Embed Size (px)
Citation preview

Feasibility Analysis of a
Redeveloped Porter County Expo Center & Fairgrounds
Presented to: Porter County &
Indiana Dunes Tourism
January 14, 2015

Conventions, Sports & Leisure International 520 Nicollet Mall • Suite 440 • Minneapolis, MN 55402 • Telephone 612.294.2000 • Facsimile 612.294.2045
January 14, 2015 Board of Commissioners Porter County 155 Indiana Avenue, Suite 205 Valparaiso, Indiana 46383 Dear Members of the Porter County Board of Commissioners: Conventions, Sports & Leisure International (CSL), in conjunction with Populous Architecture, has completed a report related to a feasibility analysis of a redeveloped Porter County Expo Center and Fairgrounds (PCEC). The attached report presents our research, analysis and findings and is intended to assist Porter County (County), Indiana Dunes Tourism (CVB), and other stakeholders in evaluating the feasibility of a redeveloped/improved PCEC. The analysis presented in this report is based on estimates, assumptions and other information developed from industry research, market data provided by the County, PCEC and others involved with the project, surveys of potential facility users, and analysis of competitive/comparable facilities and communities. The sources of information, the methods employed and the basis of significant estimates and assumptions are stated in this report. Some assumptions inevitably will not materialize and unanticipated events and circumstances may occur. Therefore, actual results achieved will vary from those described and the variations may be material. The findings presented herein are based on analysis of present and near-term conditions in the Porter County area as well as existing interest levels by a potentially redeveloped PCEC’s potential base of users. Any significant future changes in the characteristics of the local community, such as growth in population, corporate inventory and visitor amenities/attractions, could materially impact the key market conclusions developed as a part of this study. As in all studies of this type, the estimated results are based on competent and efficient management of the potential facility and assume that no significant changes in the applicable event markets will occur beyond those set forth in this report. Furthermore, all information provided to us by others was not audited or verified and was assumed to be correct. Primary research conducted for this study was completed in early 2014. This report has been prepared for the internal use of the County and CVB and should not be relied upon by any other party. The report has been structured to assist Porter County representatives in evaluating potential event market demand in Porter County and should not be used for any other purpose. This report, its findings or references to CSL may not be included or reproduced in any public offering statement or other financing document. We sincerely appreciate the assistance and cooperation we have been provided in the compilation of this report and would be pleased to be of further assistance in the interpretation and application of our findings. Very truly yours,
CSL International

FEASIBILITY ANALYSIS OF A REDEVELOPED PORTER COUNTY EXPO CENTER & FAIRGROUNDS Table of Contents
TABLE OF CONTENTS
______
Executive Summary
1. Introduction .............................................................................................. 1
2. Existing PCEC Analysis ............................................................................... 4
3. Local Market Conditions Analysis .............................................................. 14
4. Comparable Facility Benchmarking Analysis ............................................... 25
5. Market Demand Analysis .......................................................................... 33
6. Development Options and Conceptual Renderings ..................................... 49
7. Cost/Benefit Analysis ............................................................................... 58
Appendix: Comparable Facility Case Studies

FEASIBILITY ANALYSIS OF A REDEVELOPED PORTER COUNTY EXPO CENTER & FAIRGROUNDS Executive Summary Page ES-1
EXECUTIVE SUMMARY Conventions, Sports & Leisure International (CSL), in conjunction with Populous Architecture (Populous), was retained by Porter County (County) and Indiana Dunes Tourism (CVB) to study the feasibility of a redeveloped Porter County Expo Center and Fairgrounds (PCEC). This attached report outlines the key findings associated with the analysis. The full written report should be reviewed in its entirety to gain an understanding of the study's methods, limitations and implications. Introduction and Background This report outlines the key findings associated with the analysis of local market conditions, existing PCEC facility and performance, comparable facilities and host communities, market demand, supportable program and development options, conceptual renderings, preliminary construction costs, financial operations, and economic impacts. The PCEC acts as a multipurpose facility complex designed to meet the needs of Porter County residents as an economic generator and a public resource for the local community through its hosting of the Porter County Fair, consumer shows, banquets, receptions, meetings, 4-H events, equestrian events and other dirt and non-dirt events of both a non-local and local nature. The purpose of this study is to:
Research and analyze the feasibility of a redeveloped Porter County Expo Center and Fairgrounds, for the purpose of driving new visitation and economic impact, enhancing efficiency and effectiveness (for both the PCEC and the Fair), as well as adding to quality of life for County residents.
Specifically, important goals of a redeveloped PCEC would include:
1. Retain current tenants and events.
2. Grow level of non-Fair event activity and attendance.
3. Generate new visitation and economic impact.
4. Positively impact quality of life of County residents through accommodation of new events and entertainment options.
5. Improve operational efficiency, quality of event production/service for all events (Fair and non-Fair events), and financial operating performance.
6. Should there be market support for a redeveloped PCEC, consider costs, benefits, opportunities and challenges associated with a potential relocation of the complex.
7. Develop a facility improvement strategy that considers immediate/upcoming capital needs along with opportunities to improve/grow facility product commensurate with measured market support.

FEASIBILITY ANALYSIS OF A REDEVELOPED PORTER COUNTY EXPO CENTER & FAIRGROUNDS Executive Summary Page ES-2
The study process, outlined herein, consisted of detailed research and analysis, including a comprehensive set of market-specific information derived from the following:
! Local market visit, community tour, and PCEC facility/grounds tour.
! In-person meetings and focus groups with local Porter County area individuals, including County officials, CVB representatives, PCEC management, Porter County Fair & Fair Board representatives, other PCEC users, municipal government officials, and other such individuals.
! Research and analysis of local market conditions and regional trends.
! Benchmarking and best practices analysis of more than 15 competitive/regional and comparable event facilities, including research and analysis of physical facility characteristics, event accommodation and attendance data, financial and economic performance, etc.
! Completed telephone interviews with local, regional and state organization event planners and promoters, representing over 100 public/consumer shows, equestrian shows, livestock and agricultural shows, rodeos, tradeshow, entertainment and promoted events, and other such events.
Existing PCEC and Local Market Conditions Since its opening, the PCEC has served as an important asset for the Porter County community. Over the years, it has accommodated a diverse range of events, including the Porter County Fair, consumer shows, tradeshows, concerts, horse and livestock shows, rodeos, conferences, banquets, meetings, social functions, fundraisers, graduations, holiday parties, and civic events. The PCEC has served as an important regional facility attracting a variety of both local and non-local-oriented events, attendees, spectators and participants. Porter County has benefited from the Porter County Fair and the operation of the PCEC in terms of economic impact generated by visitors who would not likely otherwise be in the County, while residents benefit in terms of quality of life from the opportunity to attend entertainment, civic and other types of events hosted by the facility—many of which would not occur in the County without the presence of the PCEC. An analysis of the PCEC’s physical product and historical operations suggests that opportunities may exist to continue to retain existing business and improve its ability to compete for additional pieces of non-local and local business, as well as improving efficiency of operations and performance. The PCEC essentially operates with a “break-even” mandate at the County’s direction. While some comparable expo centers and fairgrounds throughout the country operate similarly, industry benchmarking suggests that most public sector-owned complexes operate at an annual financial operating deficit (requiring an annual operating subsidy). In the PCEC’s case, there are a number of indications that staffing levels and the delivery of quality services are negatively impacted by the breakeven mandate. An initial area of focus of the study effort was an analysis of the conditions present in the local marketplace that could impact the potential success of a redeveloped PCEC. Factors considered include socioeconomic characteristics, transportation accessibility, hotel inventory, corporate base and traditional visitor amenities (such as attractions, entertainment/leisure options, restaurants, retail, etc.).

FEASIBILITY ANALYSIS OF A REDEVELOPED PORTER COUNTY EXPO CENTER & FAIRGROUNDS Executive Summary Page ES-3
Strengths of the local Porter County market as they relate to a potential redeveloped PCEC and functioning as an event destination include:
1. Accessibility via Interstates 80/90 and 94.
2. Close proximity to the Chicago market population and corporation base.
3. Unique attraction in the Indiana Dunes National Lakeshore and State Parks.
4. Practical driving distance to several large regional metropolitan areas.
5. Quantity and location of hotel rooms within the community.
Some of Porter County’s weaknesses as they relate to supporting a potential redeveloped PCEC and functioning as an event destination include:
1. Limitations in existing hotel inventory in terms of mix of properties, size of largest property, hotels within walking distance of event facilities—may constrain the size of certain non-local event activity that could be attracted with a redeveloped PCEC.
2. Some negative or neutral perceptions of select event planners regarding the appeal of the area for events.
3. While the proximity to the Chicago market population and corporate base provides a substantial foundation from which to draw potential facility event attendees, it also possesses a significant number of competitive venues.
Comparable Facility Benchmarking The analysis of 15 identified competitive and comparable facilities provided insight into the physical and operational characteristics of facilities of a similar nature to that contemplated for Porter County. Access to a significant population base throughout the greater Chicago area will have certain implications on the ability of a redeveloped PCEC to attract events, participants, exhibitors and attendees. These population proximity characteristics tend to “shape” the event profile, mix and attendance related to facility activity and utilization and, importantly, do not solely determine whether the facility will be adequately or highly utilized. Importantly, though Porter County ranks favorably relative to the markets reviewed, the event space and supporting amenities currently available within the PCEC are somewhat lacking. Specifically, the largest contiguous exhibit space and total indoor event space offered at the PCEC rank near and at the bottom, respectively, among the comparable facilities reviewed. Further, horse stalls, RV hook-ups and arena seating capacity are also much lower than levels identified among comparable venues. Market Demand Analysis The analysis suggests that the location of the existing PCEC is generally viewed favorably, as it is centrally located within the county offering easy access to residents both in the northern and southern parts of the county as well as easy access to the state, region and, importantly, the greater Chicago market from which to draw potential event attendees and/or participants. The analysis indicates market support for a moderately larger and improved PCEC. The market analysis suggests that event and attendance levels for exhibitions, equestrian, entertainment, meetings and Fair

FEASIBILITY ANALYSIS OF A REDEVELOPED PORTER COUNTY EXPO CENTER & FAIRGROUNDS Executive Summary Page ES-4
events could be grown with a larger and improved PCEC. However, demand is believed to be low for traditional rotating conventions, conferences and tradeshows, given the nature of potentially redeveloped PCEC facilities and presence of more suitable event facilities within Porter County. As the estimated market supportable PCEC program could build upon, and leverage, existing PCEC facilities and fit within the current site, it is believed the existing PCEC and site infrastructure provides a solid foundation from which to develop incremental event and market capture. Therefore, a redeveloped PCEC would be best supported at the current location. Key areas of PCEC physical product additions include the following: (1) exhibition space; (2) covered arena; (3) horse stalls; (4) RV hookups; and (5) other. While there are no nearby hotel properties near the existing PCEC site, fairgrounds/expo center complexes often do not have attached or adjacent hotel properties. The nature of these types of complexes, coupled with the rural nature of many of their host locations, do not place industry expectations on direct and adjacent hotel support for these projects in the same way that they do for “convention centers” and “conference centers”. The relatively sparse population, lack of corporate density, and direct interstate access proximate to the PCEC site suggests that a new sizeable, quality hotel development would not likely be forthcoming without substantial public sector funding incentive. Beyond this evaluation of market demand, it is important to note that project “feasibility” is often a function of weighing the costs and benefits associated with developing and operating a facility. There are many reasons why communities invest in event facilities. These reasons include providing a community gathering place for local citizens, increasing visitation levels and exposure of the local community, ancillary economic development generation, quality of life enhancement and other issues. In this regard, important aspects to consider when determining project feasibility also include the following:
• The County will require facilities capable of hosting the Porter County Fair if the annual event is to continue operations within Porter County.
• Choosing not to redevelop event facilities capable of accommodating the event space demand met by the existing PCEC may result in the loss and/or erosion of an important portion of the 200-plus annual events held at the PCEC.
• PCEC facilities are widely considered a community benefit as an affordable option for hosting public assembly events.
• A new indoor Exhibition Center at the PCEC could also be positioned to capture market demand relative to indoor sports and recreation, assuming appropriate portable equipment is purchased and associated storage is added. This would importantly offer additional capacity in the County to accommodate certain types of non-local tournaments/competitions (e.g., basketball, volleyball, wrestling, gymnastics, cheer/dance, etc.) and local sports/recreation, without requiring the development of a “dedicated” indoor sports facility.
Development Options In addition to protecting existing business, it is believed that event levels, attendance and economic impact could grow under a redevelopment of the PCEC through a targeted master plan of expansion and improvement. The recommended building program presented herein is based on our team’s understanding of industry best practices, market analysis results, and discussions with the Porter County Fair, County officials, past users and industry participants, and a survey of event promoters/planners.

FEASIBILITY ANALYSIS OF A REDEVELOPED PORTER COUNTY EXPO CENTER & FAIRGROUNDS Executive Summary Page ES-5
The exhibit below outlines an overview of a recommended Master Plan for PCEC expansion and improvement.
Redeveloped PCEC Master Plan Recommendations
As shown, the Master Plan recommendations are segmented into four general categories:
• Market Demand Recommendations – These are additions and improvements identified in the feasibility analysis and for which there is a direct market, financial and/or economic opportunity. These recommendations include the addition of approximately 35,000 square feet of contiguous exhibition space, a new covered arena, expanded warm-up arena, a new stall barn, and an expanded RV park.
• New Construction – These projects are recommended to improve the overall functionality of the complex, marketability and appearance. These recommendations include the rebuilding of the livestock barn and arena, a new covered grandstand and stage, new entry gates and grandstand portals, and a new Fair office.
• Renovations – With the exception noted below, it is recommended that all remaining buildings be renovated. They are the existing Expo Center, Buggy Wheel Pavilion, restroom, support buildings and the site.
• Renovations/New Construction – The 4H and Expo East could either be renovated or replaced depending on the demand for their use during the Fair and non-fair periods with the development of the market demand and new construction recommendations.
Importantly, while the existing site is projected to be able to support the recommended improvements, should additional adjacent parcels of land not be acquired, parking challenges for a limited number of events may be exacerbated.
FEASIBILITY ANALYSIS OF A REDEVELOPED PORTER COUNTY EXPO CENTER & FAIRGROUNDS Executive Summary Page ES-6
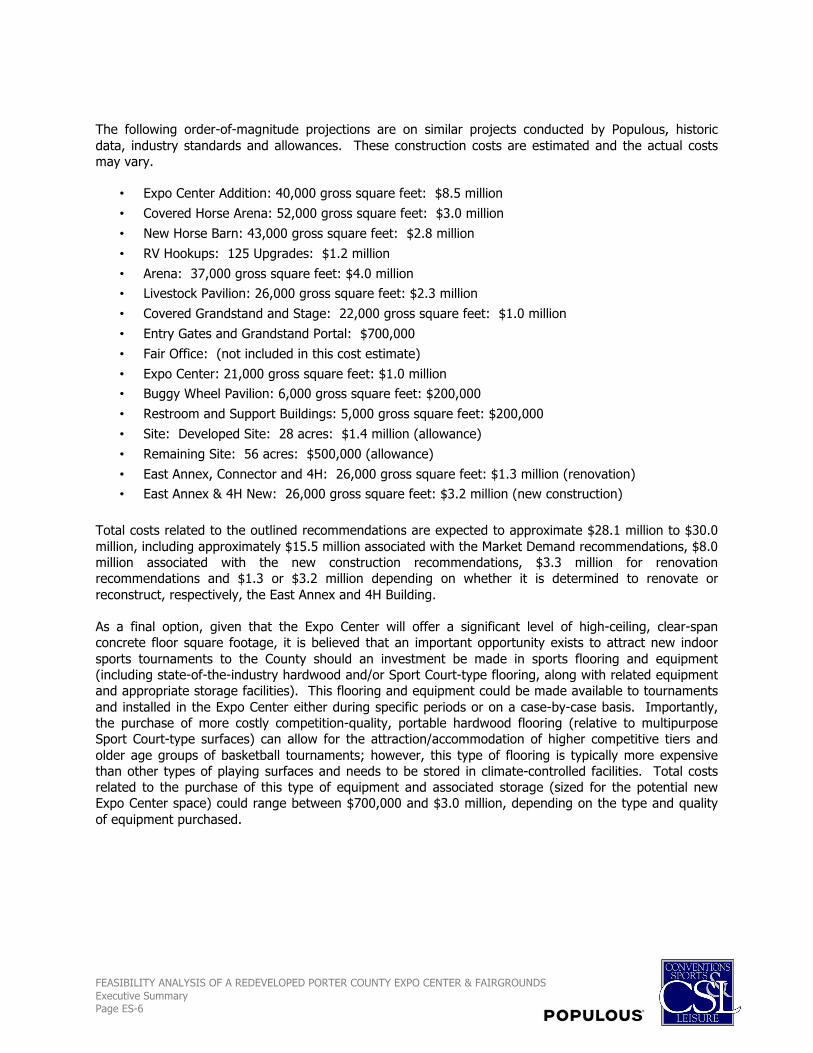
The following order-of-magnitude projections are on similar projects conducted by Populous, historic data, industry standards and allowances. These construction costs are estimated and the actual costs may vary.
• Expo Center Addition: 40,000 gross square feet: $8.5 million • Covered Horse Arena: 52,000 gross square feet: $3.0 million • New Horse Barn: 43,000 gross square feet: $2.8 million • RV Hookups: 125 Upgrades: $1.2 million • Arena: 37,000 gross square feet: $4.0 million • Livestock Pavilion: 26,000 gross square feet: $2.3 million • Covered Grandstand and Stage: 22,000 gross square feet: $1.0 million • Entry Gates and Grandstand Portal: $700,000 • Fair Office: (not included in this cost estimate) • Expo Center: 21,000 gross square feet: $1.0 million • Buggy Wheel Pavilion: 6,000 gross square feet: $200,000 • Restroom and Support Buildings: 5,000 gross square feet: $200,000 • Site: Developed Site: 28 acres: $1.4 million (allowance) • Remaining Site: 56 acres: $500,000 (allowance) • East Annex, Connector and 4H: 26,000 gross square feet: $1.3 million (renovation) • East Annex & 4H New: 26,000 gross square feet: $3.2 million (new construction)
Total costs related to the outlined recommendations are expected to approximate $28.1 million to $30.0 million, including approximately $15.5 million associated with the Market Demand recommendations, $8.0 million associated with the new construction recommendations, $3.3 million for renovation recommendations and $1.3 or $3.2 million depending on whether it is determined to renovate or reconstruct, respectively, the East Annex and 4H Building. As a final option, given that the Expo Center will offer a significant level of high-ceiling, clear-span concrete floor square footage, it is believed that an important opportunity exists to attract new indoor sports tournaments to the County should an investment be made in sports flooring and equipment (including state-of-the-industry hardwood and/or Sport Court-type flooring, along with related equipment and appropriate storage facilities). This flooring and equipment could be made available to tournaments and installed in the Expo Center either during specific periods or on a case-by-case basis. Importantly, the purchase of more costly competition-quality, portable hardwood flooring (relative to multipurpose Sport Court-type surfaces) can allow for the attraction/accommodation of higher competitive tiers and older age groups of basketball tournaments; however, this type of flooring is typically more expensive than other types of playing surfaces and needs to be stored in climate-controlled facilities. Total costs related to the purchase of this type of equipment and associated storage (sized for the potential new Expo Center space) could range between $700,000 and $3.0 million, depending on the type and quality of equipment purchased.

FEASIBILITY ANALYSIS OF A REDEVELOPED PORTER COUNTY EXPO CENTER & FAIRGROUNDS Executive Summary Page ES-7
Cost/Benefit Analysis Estimates relating to utilization, attendance, economic impacts, and financial operating characteristics of a redeveloped PCEC were developed. A comparison of the key benefits (quantifiable economic impacts and non-quantifiable benefits) relative to key costs (construction/upfront costs and ongoing operating cost impacts) of a potential County investment in PCEC redevelopment is expected to be critical to evaluating the opportunity. Estimates related to the overall economic impact generated in Porter County by both the existing PCEC and that estimated for a redeveloped PCEC are outlined in the exhibit below.
Estimated Annual Economic Impacts Associated with the Existing PCEC and a Redeveloped PCEC
(stabilized year of operations, in 2014 dollars)
As shown above, it is estimated that a redeveloped PCEC would generate approximately $13.8 million in total economic output (direct, indirect, and induced spending), supporting approximately $6.7 million in personal earnings and 172 full- and part-time jobs throughout the Porter County economy. Relative to existing PCEC levels, a redeveloped PCEC would incrementally generate an estimated $6.7 million in annual economic impact (direct, indirect and induced visitor spending) in Porter County, supporting approximately 84 full and part-time jobs throughout the local economy and nearly $3.3 million in personal earnings (income). This analysis does not consider “lost” economic impact that would be expected in the future, should no redevelopment or significant improvements be undertaken with respect to the PCEC. Based on the analysis and key assumptions outlined within this report, the exhibit on the following page presents a summary of the estimated benefits-to-costs as a ratio of total economic output per total annual cost that would need to be borne by the County associated with a redeveloped PCEC project. For purposes of this analysis, construction debt service has been calculated assuming a 3.0 percent tax exempt interest rate over a term of 30 years. This cost line item would be removed from the analysis of “annual” costs under a scenario where the County might elect to use Hospital Funds or other available monies fund construction on a pay-as-you-go basis (without issuing debt).
Current RedevelopedExpo Center/ Expo Center/Fairgrounds Fairgrounds Incremental
Total Hotel Room Nights 6,605 14,353 7,749
Direct SpendingHotel $843,943 $1,648,125 $804,183RestaurantMeals 1,856,674 3,625,875 1,769,202Entertainment/Leisure 548,563 1,071,281 522,719Retail/Shopping 717,351 1,400,906 683,555Other 253,183 494,438 241,255 Total $4,219,713 $8,240,625 $4,020,913
Indirect/Induced Spending $2,839,867 $5,545,941 $2,706,074
Total Output $7,059,579 $13,786,566 $6,726,987
Personal Earnings $3,417,967 $6,674,906 $3,256,939
Employment 88 172 84 (full & part-time jobs)

FEASIBILITY ANALYSIS OF A REDEVELOPED PORTER COUNTY EXPO CENTER & FAIRGROUNDS Executive Summary Page ES-8
Cost/Benefit Analysis for a Potential Redeveloped PCEC
As shown, total annual debt service costs to Porter County are estimated at approximately $1.7 million. As the quality of the PCEC physical product increases and larger and more prominent/attractive non-local and local events are accommodated, resultant demands on the provision and delivery of quality service will also increase. In order to maintain these higher estimated event levels and attendance (and for a redeveloped PCEC to remain industry competitive over the long-term), it would be prudent for the County to plan for a modest annual operating deficit. This is consistent with the operations of the typical expo center/fairgrounds complex in Porter County’s comparable industry set. It is estimated that the current PCEC generates approximately $7.1 million in annual economic output (direct, indirect and induced visitor spending) in Porter County. It is further projected that a redeveloped PCEC would generate approximately $13.8 million in economic output at a cost of approximately $1.7 million in annual debt service payments, resulting in a benefit to cost ratio of approximately 7.91 dollars generated per dollar expended in debt service. In terms of incremental benefit to cost, a redeveloped PCEC is projected to generate approximately $6.7 million in annual economic output at an annual debt service cost of $1.7 million, resulting in a benefit to cost ration of approximately 3.86 dollars in economic benefit per dollar spent. In addition to the more quantifiable benefits of a redeveloped PCEC in Porter County, certain potential benefits cannot be quantifiably estimated. Potential qualitative benefits for Porter County include: (1) construction period impacts; (2) enhanced quality of life, community pride, self-image, exposure and reputation; (3) enhanced regional exposure and visitation; (4) community marketing; (5) entertainment/leisure opportunities for residents; and (6) enhanced economic growth and ancillary private sector development spurred by facility operations.
Current RedevelopedExpo Center/ Expo Center/Fairgrounds Fairgrounds Incremental
Est. Construction Costs -- $28,000,000 $28,000,000
ANNUAL BENEFITS:Total Economic Output $7,059,579 $13,786,566 $6,726,987
ANNUAL COSTS:County Debt Service $0 $1,428,539 $1,428,539County Capital Reserve Funding $0 $140,000 $140,000County Operating Subsidy $0 $175,000 $175,000
Total $0 $1,743,539 $1,743,539
BENEFIT TO COST RATIO 7.91 3.86

FEASIBILITY ANALYSIS OF A REDEVELOPED PORTER COUNTY EXPO CENTER & FAIRGROUNDS Introduction Page 1
1. Introduction Conventions, Sports & Leisure International (CSL), in conjunction with Populous Architecture (Populous), was retained by Porter County (County) and Indiana Dunes Tourism (CVB) to study the feasibility of a redeveloped Porter County Expo Center and Fairgrounds (PCEC) in Porter County, Indiana. This attached report outlines the key findings associated with the analysis. This report outlines the key findings associated with the analysis of local market conditions, existing PCEC facility and performance, comparable facilities and host communities, market demand, supportable program and development options, conceptual renderings, preliminary construction cost estimates, financial operations, economic impacts, and funding issues. The PCEC acts as a multipurpose facility complex designed to meet the needs of Porter County residents as an economic generator and a public resource for the local community through its hosting of the Porter County Fair, consumer shows, banquets, receptions, meetings, 4-H events, equestrian events and other dirt and non-dirt events of both a non-local and local nature. The purpose of this study is to:
Research and analyze the feasibility of a redeveloped Porter County Expo Center and Fairgrounds, for the purpose of driving new visitation and economic impact, enhancing efficiency and effectiveness (for both the PCEC and the Fair), as well as adding to quality of life for County residents.
FEASIBILITY ANALYSIS OF A REDEVELOPED PORTER COUNTY EXPO CENTER & FAIRGROUNDS Introduction Page 2
Specifically, important goals of a redeveloped PCEC would include:
1. Retain current tenants and events.
2. Grow level of non-Fair event activity and attendance.
3. Generate new visitation and economic impact.
4. Positively impact quality of life of County residents through accommodation of new events and entertainment options.
5. Improve operational efficiency, quality of event production/service for all events (Fair and non-Fair events), and financial operating performance.
6. Should there be market support for a redeveloped PCEC, consider costs, benefits, opportunities and challenges associated with a potential relocation of the complex.
7. Develop a facility improvement strategy that considers immediate/upcoming capital needs along with opportunities to improve/grow facility product commensurate with measured market support.
The study process, outlined herein, consisted of detailed research and analysis, including a comprehensive set of market-specific information derived from the following:
! Local market visit, community tour, and PCEC facility/grounds tour.
! In-person meetings and focus groups with local Porter County area individuals, including County officials, CVB representatives, PCEC management, Porter County Fair & Fair Board representatives, other PCEC users, municipal government officials, and other such individuals.
! Research and analysis of local market conditions and regional trends.
! Benchmarking and best practices analysis of more than 15 competitive/regional and comparable event facilities, including research and analysis of physical facility characteristics, event accommodation and attendance data, financial and economic performance, etc.
! Completed telephone interviews with local, regional and state organization event planners and promoters, representing over 100 public/consumer shows, equestrian shows, livestock and agricultural shows, rodeos, tradeshow, entertainment and promoted events, and other such events.
The overall purpose of this study is to evaluate the feasibility of a potential redeveloped PCEC. Conclusions of a project’s feasibility can be assessed in various ways, including:
• Market feasibility – the facility’s ability to attract and support levels of event activity and facility usage that are consistent with, or in excess of, industry standards.
• Financial feasibility – the ability of the facility to “break-even” or generate an operating profit focusing only on direct facility-related operating revenues and expenses.
• Economic spending – the facility’s ability to generate new spending activity in the local community (i.e., direct and indirect spending that is attributable to out-of-town event attendees, participants and exhibitors that would not otherwise occur in the local area).

FEASIBILITY ANALYSIS OF A REDEVELOPED PORTER COUNTY EXPO CENTER & FAIRGROUNDS Introduction Page 3
• Tax generation – the ability of the facility to generate new tax revenue for the local area (i.e., tax revenue resulting from direct, indirect and induced spending that is attributable to out-of-town event attendees, participants and exhibitors that would not otherwise occur in the local area).
• Costs/benefits/return on investment – the facility’s ability to generate new revenues (i.e., from taxes, operating income and ancillary facility-related revenues, etc.) in excess of quantifiable facility-related costs (i.e., construction costs, operating costs, marketing costs, etc.).
• Intangible benefits/public good – the ability of the facility to represent an important resource for the local community, regardless of financial or economic concerns. These types of benefits add to the local community’s “quality of life” in the same way that libraries, museums and recreational parks do, without consideration of the economic impacts that the facility might generate.
When evaluating the feasibility of a public assembly facility, such as a multipurpose event complex, communities throughout the country have differed in the specific criteria that best reflects the definition of “feasible” for their community. For instance, one community may focus more on the ability of the project to be operationally self-supportive (i.e., generate an annual financial operating profit) rather than the intangible “public good” aspects the project would provide local residents. The research, data, information and analysis provided through this study is intended to allow the County and other community constituents to draw their own informed conclusions concerning the feasibility of a potential redeveloped PCEC in Porter County.

FEASIBILITY ANALYSIS OF A REDEVELOPED PORTER COUNTY EXPO CENTER & FAIRGROUNDS Existing PCEC Analysis Page 4
2. Existing PCEC Analysis The purpose of this chapter is to inventory and analyze key elements of the physical facility and operations of the Porter County Expo Center and Fairgrounds. Understanding the characteristics of the physical facility, utilization levels, event mix and other such characteristics of the facility is important to provide a basis from which to evaluate short and long-term market demand characteristics for Porter County and a potential redeveloped PCEC. Existing Facilities and Operating Structure Owned and operated by Porter County, the Porter County Expo Center and Fairgrounds (PCEC) is located along State Highway 49, approximately one mile south of State Highway 30 (Lincoln Highway) and three miles from downtown Valparaiso, Indiana.
The layout is classic with the buildings located along one side of a central promenade and the midway on the other. The grandstand terminates the promenade and the equestrian complex is located appropriately to the side. This results in a very clear and understandable design and circulation system. Consistent with current best practices, the buildings are grouped by like uses and services are separated from the fairgoer. The complex appears to be well maintained. The majority of the buildings are wood frame “pole barns;” the exception being the Expo Center, Grandstand and restrooms. Facilities incorporated within the PCEC complex include:
• Main Hall – 9,800-square foot exhibit hall with two banquet rooms of 3,300 square feet and 1,700 square feet;
• 4-H Building – approximately 8,200 square feet of event space; • Expo East – a 9,300-square foot event hall; • Buggy Wheel Pavilion – approximately 5,600 square feet of event space; • Seven Barns – to accommodate horses and other livestock; • Grandstand – fixed capacity of 2,350 persons; • Outdoor Show Arena – uncovered dirt show ring, with supporting warm-up area and covered
bleacher seating.

FEASIBILITY ANALYSIS OF A REDEVELOPED PORTER COUNTY EXPO CENTER & FAIRGROUNDS Existing PCEC Analysis Page 5
Since its opening, the PCEC has served as an important asset for the Porter County community. Over the years, it has accommodated a diverse range of events, including the Porter County Fair, public and consumer shows, trade shows, banquets, meetings, social functions, equestrian and livestock shows and civic events. The following exhibit presents a summary diagram of the general layout of primary spaces within the PCEC.
Exhibit 1 Existing PCEC Overview and Layout
The Fair is estimated to attract approximately 100,000 people total with a peak day of 20,000 to 30,000 on the weekend and an in-grounds peak of 17,000 attendees. The event appears to be well balanced with respect to activities; livestock shows, commercial and competitive exhibits, the midway, entertainment and equestrian events. Fairgoer parking is considered adequate except in those few instances when grandstand entertainment significantly increases attendance.
Midway/CarnivalEquestrian
Livestock
Entertainment
Exhibition
Parking
Parking
Parking
SpecialEvents
Service
RV’s
Parking

FEASIBILITY ANALYSIS OF A REDEVELOPED PORTER COUNTY EXPO CENTER & FAIRGROUNDS Existing PCEC Analysis Page 6
Event Levels The PCEC hosts a wide variety of both local and non-local events including the Porter County Fair, consumer shows, banquets, receptions, meetings, 4-H events, equestrian events and other dirt and non-dirt events of both a non-local and local nature. We begin with a summary of the number of events hosted at the PCEC in 2012, broken down by event space used.
Exhibit 2 PCEC Number of Events by Event Space – 2012
In 2012, the PCEC hosted a total of 202 events within the Main Hall, Expo East, Banquet Room 1, Banquet Room 2 and/or the 4-H Building. Expo East was the most frequently utilized event space within the PCEC, hosting 80 total events. Although the Main Hall offers a comparable amount of total space, only 26 total events were held in the Main Hall in 2012. Banquet Room 1 and Banquet Room 2 hosted 44 and 46 events, respectively, in 2012, while the 4-H Building hosted 56 total events. Importantly, some events utilized more than one event space.
26
80
44 46
56
0
20
40
60
80
100
Main Hall Expo East Banquet 1 Banquet 2 4-H Building
Eve
nts
Source: Porter County Expo Center and Fairgrounds, 2013

FEASIBILITY ANALYSIS OF A REDEVELOPED PORTER COUNTY EXPO CENTER & FAIRGROUNDS Existing PCEC Analysis Page 7
Exhibit 3 displays the number of days each event space was utilized in 2012. This number includes all move-in, event, and move-out days associated with the event.
Exhibit 3 PCEC Utilization Days by Event Space – 2012
As shown, Expo East was utilized 111 days in 2012 while Banquet Rooms 1 and 2 were utilized 70 and 65 days, respectively. As suggested by this data, the majority of 2012 events held at the PCEC were single day events. In fact, of the 202 total events, only 64 generated more than one utilization day per event. Of the 80 events held in Expo East in 2012, a total of 18 utilized event space on more than one day.
48
111
7065 68
0
20
40
60
80
100
120
Main Hall Expo East Banquet 1 Banquet 2 4-H Building
Util
izat
ion
Day
s
Source: Porter County Expo Center and Fairgrounds, 2013

FEASIBILITY ANALYSIS OF A REDEVELOPED PORTER COUNTY EXPO CENTER & FAIRGROUNDS Existing PCEC Analysis Page 8
Event days are classified as the number of days a given event is occurring, and does not include move-in or move-out days. This is an important metric to measure given that it represents the actual number of days throughout the year in which the facility is attracting attendees to participate in, or observe a given event. Exhibit 4 presents the number of event days by event space in 2012.
Exhibit 4 PCEC Event Days by Event Space– 2012
While approximately 32 percent of events utilizing space at the PCEC in at least one of the five event space analyzed generated more than one utilization day, only 18 percent (38 of 202 total events) generated more than one event day. Expo East generated 91 total event days among its 80 total events, as only nine total events generated more than one event day.
35
91
54 5461
0
20
40
60
80
100
Main Hall Expo East Banquet 1 Banquet 2 4-H Building
Eve
nt D
ays
Source: Porter County Expo Center and Fairgrounds, 2013

FEASIBILITY ANALYSIS OF A REDEVELOPED PORTER COUNTY EXPO CENTER & FAIRGROUNDS Existing PCEC Analysis Page 9
We have also evaluated the occupancy rate of each event space in 2012. Results are presented in Exhibit 5 below.
Exhibit 5 PCEC Occupancy by Hall – 2012
Occupancy levels (measured by dividing the total amount of sold event space by the total amount of sellable space within the facility multiplied by the number of days in the year) can indicate the degree to which facility usage has reached a maximum capacity. The occupancy of a facility is determined to be within a target occupancy range when the actual occupied space reaches a level of between 50 and 70 percent of total sellable capacity. Above 70 percent occupancy, a facility has exceeded practical maximum capacity and may be turning away significant business. These assumptions account for the reality that a portion of the facility’s total capacity is un-sellable due to holidays, maintenance days and inherent booking inefficiencies that result when events cannot be scheduled immediately back-to-back. As discussed, Expo East generated the most total usage, measuring approximately 30 percent occupancy for 2012. Banquet Room 1, Banquet Room 2 and the 4-H Building generated the next most usage, with between approximately 17.8 and 19.1 percent occupancy for the year. The Main Hall generated just 13.1 percent occupancy during this time period.
13.1%
30.3%
19.1% 17.8% 18.6%
0%
10%
20%
30%
40%
Main Hall Expo East Banquet 1 Banquet 2 4-H Building

FEASIBILITY ANALYSIS OF A REDEVELOPED PORTER COUNTY EXPO CENTER & FAIRGROUNDS Existing PCEC Analysis Page 10
The seasonality of demand can assist in understanding demand potential for multiple overlapping events. For example, heavy demand for a particular event type during historically busy periods at a complex can indicate a “clustering” of demand, and highlight the need for a facility to be able to accommodate multiple overlapping events. Exhibit 6 displays occupancy on a monthly basis for 2012 for the five event spaces within the PCEC analyzed.
Exhibit 6 PCEC Occupancy by Month – 2012
A typical seasonality pattern for conventions/tradeshows sees peaks in the spring and fall months. As presented above, the PCEC’s monthly occupancy follows a pattern similar to industry trends, with somewhat higher occupancy levels from March through May, and September through November. However, the PCEC is largely underperforming as no event space achieved the target occupancy rate in any given month during 2012. Expo East portrays a relatively consistent month-to-month occupancy rate. Coupled with previously discussed analysis pertaining to utilization and event day levels, these data suggest that the PCEC and future redevelopment plans should strongly consider making improvements to increase the likelihood of attracting multi-day events in order to improve overall performance.
0%
10%
20%
30%
40%
50%
60%
70%
80%
90%
100%
Janu
ary
Februa
ry
March
April
May
June
Ju
ly
Augus
t
Septem
ber
Octobe
r
Novem
ber
Decem
ber
Main Hall Expo East Banquet 1 Banquet 2 4-H Building

FEASIBILITY ANALYSIS OF A REDEVELOPED PORTER COUNTY EXPO CENTER & FAIRGROUNDS Existing PCEC Analysis Page 11
It is also useful to review the distribution of events, by size, in terms of amount of event space utilized. Exhibit 7 presents the event distribution by size at the PCEC in 2012.
Exhibit 7 PCEC Event Distribution by Size – 2012
Of the 202 total events held within one or more of the five largest event spaces at the PCEC, the average event utilized approximately 8,300 square feet of event space. Relatively few events (approximately 12 percent) utilized more than 10,000 square feet of event space or more.
0
5,000
10,000
15,000
20,000
25,000
30,000
Average = 8,340Median = 8,150
Source: Porter County Expo Center and Fairgrounds, 2013
PCECMainHall
25 Events
FEASIBILITY ANALYSIS OF A REDEVELOPED PORTER COUNTY EXPO CENTER & FAIRGROUNDS Existing PCEC Analysis Page 12
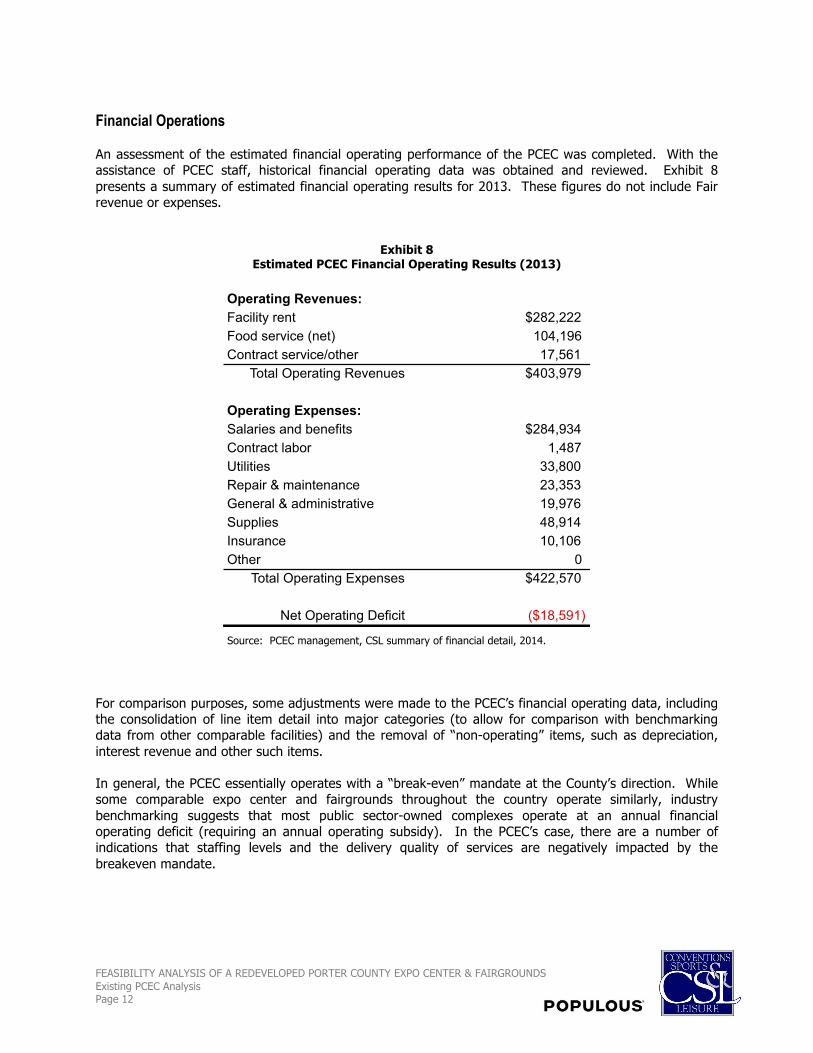
Financial Operations An assessment of the estimated financial operating performance of the PCEC was completed. With the assistance of PCEC staff, historical financial operating data was obtained and reviewed. Exhibit 8 presents a summary of estimated financial operating results for 2013. These figures do not include Fair revenue or expenses.
Exhibit 8 Estimated PCEC Financial Operating Results (2013)
Source: PCEC management, CSL summary of financial detail, 2014. For comparison purposes, some adjustments were made to the PCEC’s financial operating data, including the consolidation of line item detail into major categories (to allow for comparison with benchmarking data from other comparable facilities) and the removal of “non-operating” items, such as depreciation, interest revenue and other such items. In general, the PCEC essentially operates with a “break-even” mandate at the County’s direction. While some comparable expo center and fairgrounds throughout the country operate similarly, industry benchmarking suggests that most public sector-owned complexes operate at an annual financial operating deficit (requiring an annual operating subsidy). In the PCEC’s case, there are a number of indications that staffing levels and the delivery quality of services are negatively impacted by the breakeven mandate.
Operating Revenues:Facility rent $282,222Food service (net) 104,196Contract service/other 17,561
Total Operating Revenues $403,979
Operating Expenses:Salaries and benefits $284,934Contract labor 1,487Utilities 33,800Repair & maintenance 23,353General & administrative 19,976Supplies 48,914Insurance 10,106Other 0
Total Operating Expenses $422,570
Net Operating Deficit ($18,591)

FEASIBILITY ANALYSIS OF A REDEVELOPED PORTER COUNTY EXPO CENTER & FAIRGROUNDS Existing PCEC Analysis Page 13
Conclusions Since its opening, the PCEC has served as an important asset for the Porter County community. Over the years, it has accommodated a diverse range of events, including the Porter County Fair, consumer shows, tradeshows, concerts, horse and livestock shows, rodeos, conferences, banquets, meetings, social functions, fundraisers, graduations, holiday parties, and civic events. The PCEC has served as an important regional facility attracting a variety of both local and non-local-oriented events, attendees, spectators and participants. Porter County has benefited from the Porter County Fair and the operation of the PCEC in terms of economic impact generated by visitors who would not likely otherwise be in the County, while residents benefit in terms of quality of life from the opportunity to attend entertainment, civic and other types of events hosted by the facility—many of which would not occur in the County without the presence of the PCEC. An analysis of the PCEC’s physical product and historical operations suggests that opportunities may exist to continue to retain existing business and improve its ability to compete for additional pieces of non-local and local business, as well as improving efficiency of operations and performance. The PCEC essentially operates with a “break-even” mandate at the County’s direction. While some comparable expo centers and fairgrounds throughout the country operate similarly, industry benchmarking suggests that most public sector-owned complexes operate at an annual financial operating deficit (requiring an annual operating subsidy). In the PCEC’s case, there are a number of indications that staffing levels and the delivery of quality services are negatively impacted by the breakeven mandate.
FEASIBILITY ANALYSIS OF A REDEVELOPED PORTER COUNTY EXPO CENTER & FAIRGROUNDS Local Market Conditions Analysis Page 14
14
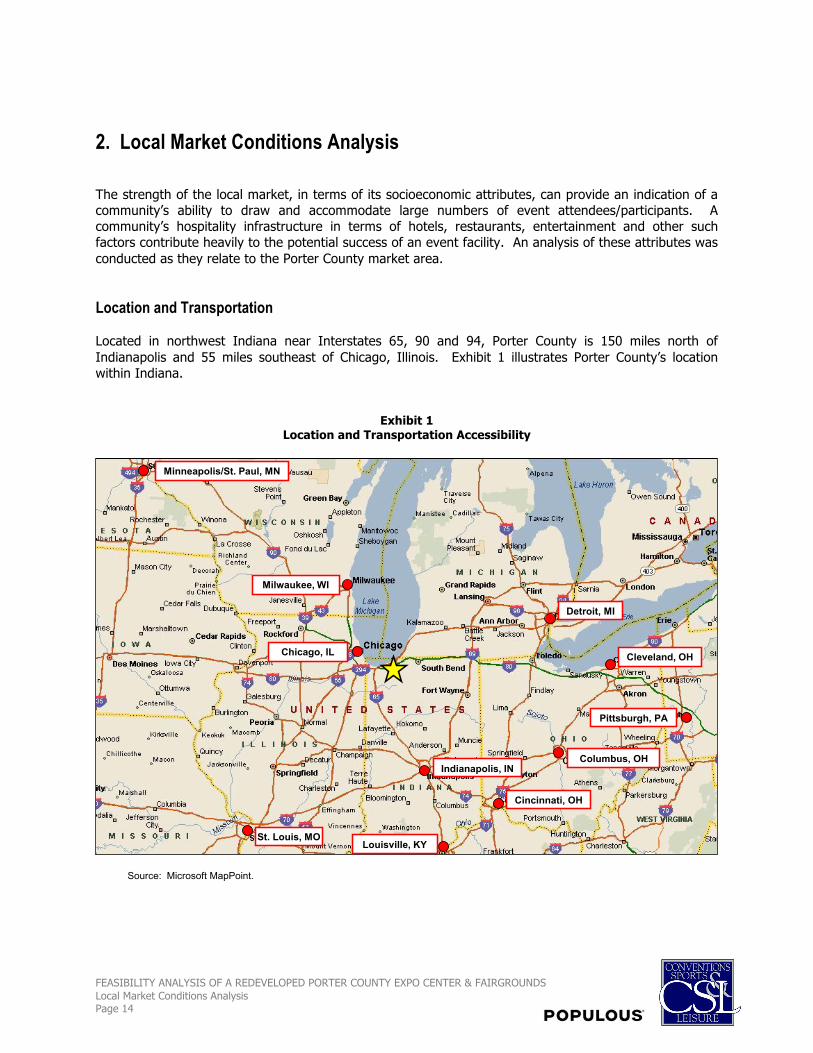
2. Local Market Conditions Analysis The strength of the local market, in terms of its socioeconomic attributes, can provide an indication of a community’s ability to draw and accommodate large numbers of event attendees/participants. A community’s hospitality infrastructure in terms of hotels, restaurants, entertainment and other such factors contribute heavily to the potential success of an event facility. An analysis of these attributes was conducted as they relate to the Porter County market area. Location and Transportation Located in northwest Indiana near Interstates 65, 90 and 94, Porter County is 150 miles north of Indianapolis and 55 miles southeast of Chicago, Illinois. Exhibit 1 illustrates Porter County’s location within Indiana.
Exhibit 1 Location and Transportation Accessibility
Source: Microsoft MapPoint.
Minneapolis/St. Paul, MN
St. Louis, MO
Indianapolis, IN
Chicago, IL
Milwaukee, WI
Detroit, MI
Columbus, OH
Pittsburgh, PA
Cleveland, OH
Cincinnati, OH
Louisville, KY

FEASIBILITY ANALYSIS OF A REDEVELOPED PORTER COUNTY EXPO CENTER & FAIRGROUNDS Local Market Conditions Analysis Page 15
15
Transportation access is vital to the success of any public assembly facility. Ease of access is not only important from the perspective of attracting event patrons/participants, but also factors into the venue selection process of organizations with events/shows which may rotate among various communities within a defined region. Porter County’s ease of access to interstates 65 and 90, and close proximity to large metropolitan markets, are significant factors when considering the viability of an event facility in the County. Exhibit 2 summarizes the driving distance in road miles and estimated driving time to select regional markets from Porter County.
Exhibit 2 Driving Distance to Regional Markets
As displayed, Porter County is within a day’s drive of 18 major metropolitan markets. These markets consist of over 38.2 million people, and include Chicago, Indianapolis, Milwaukee, Detroit, Cincinnati, Louisville, Cleveland, Columbus and St. Louis.
Source: Google Maps, 2013; U.S. CBSA Data, 2013
City, State
Miles from Porter County Expo
CenterApproximate Drive Time
Market Population
Chicago, IL 58 1:00 9,552,600Fort Wayne, IN 107 2:00 423,100Indianapolis, IN 142 2:25 1,804,500Milwaukee, WI 148 2:30 1,569,000Peoria, IL 196 3:00 379,900Toledo, OH 210 3:10 648,600Detroit, MI 250 3:40 4,271,400Cincinnati, OH 255 4:00 2,146,509Louisville, KY 257 4:00 1,307,800Cleveland, OH 309 4:40 2,056,600Columbus, OH 270 4:45 1,883,900St. Louis, MO 326 5:00 2,821,400Lexington, KY 333 5:15 487,600Des Moines, IA 375 5:40 592,700Pittsburgh, PA 426 6:15 2,362,800Nashville, TN 430 6:30 1,649,000Minneapolis, MN 464 7:20 3,363,300Omaha, NE 514 7:40 890,800

FEASIBILITY ANALYSIS OF A REDEVELOPED PORTER COUNTY EXPO CENTER & FAIRGROUNDS Local Market Conditions Analysis Page 16
16
An important component in assessing the potential success of a redeveloped event facility is the demographic and socioeconomic profile of the local market. Specific demographic and socioeconomic information that can provide an indication of the ability of a market to support a redeveloped facility complex includes population, age, household income and corporate base. Exhibit 3 demonstrates the markets and land area captured within 25-, 75- and 200-mile concentric rings around Porter County. These rings will be utilized throughout the report while analyzing and comparing demographic and socioeconomic variables.
Exhibit 3 Porter County Demographic Ring Analysis
As shown, Chicago, Illinois is located within 75 miles of Porter County. Fort Wayne and Indianapolis, Indiana and Milwaukee, Wisconsin are captured within 200 miles, while other major markets, such as St. Louis, Missouri and Detroit, Michigan are located outside of the 200 mile ring.
25-Miles
75-Miles
200-Miles

FEASIBILITY ANALYSIS OF A REDEVELOPED PORTER COUNTY EXPO CENTER & FAIRGROUNDS Local Market Conditions Analysis Page 17
17
Exhibit 4 provides a summary of key demographic characteristics estimated for Porter County, markets captured in 25-, 75- and 200-mile concentric rings around Porter County, the state of Indiana and a United States benchmark. Furthermore, taking a closer look at potential host cities within Porter County, Exhibit 5, on the following page, presents the data for the cities of Chesterton, Hebron, Kouts, Portage, and Valparaiso.
Exhibit 4 Key Porter County Area Demographics
As shown above, the population of Porter County is approximately 166,000 in 2014, up more than 13 percent from the year 2000. This percentage increase is in line with the U.S. as a whole, but materially higher than both the State of Indiana and the County’s primary, secondary, and 200-mile markets. Future projections, based on U.S. Census data, estimate Porter County’s population will approximate 168,000 in 2019, whereas the primary, secondary, and 200-mile populations are projected to be 663,000, 9.7 million, and 29.0 million, respectively. Porter County’s average household income of nearly $73,900 is up approximately 16.5 percent from 2000. The primary, secondary, and 200-mile markets, as well as the state of Indiana, all saw similar growth over that time period. While the U.S. as a whole showed average household income growth of nearly 26.0 percent, average household income for Porter County is projected to grow at twice the rate of the U.S. as a whole over the next five years.
Porter 25-Mile 75-Mile 200-Mile State ofDemographic Variable County Ring Ring Ring Indiana U.S.
Population (2000) 146,798 627,843 9,308,203 27,269,668 6,080,508 281,421,942Population (2010) 164,343 660,603 9,497,100 28,471,277 6,483,802 308,745,538Population (2014 est.) 166,118 660,412 9,581,742 28,722,281 6,567,159 317,199,353
% Change (2000-2014) 13.2% 5.2% 2.9% 5.3% 8.0% 12.7%
Population (2019 est.) 168,324 662,859 9,681,437 29,013,072 6,673,232 328,309,464% Change (2014-2019) 1.3% 0.4% 1.0% 1.0% 1.6% 3.5%
Avg. Household Inc. (2000) 63,428 54,550 64,276 58,553 52,266 56,644Avg. Household Inc. (2014 est.) 73,887 64,170 74,373 68,219 61,175 71,320
% Change (2000-2014) 16.5% 17.6% 15.7% 16.5% 17.0% 25.9%
Avg. Household Inc. (2019 est.) 82,752 69,887 79,044 71,968 62,747 75,940% Change (2014-2019) 12.0% 8.9% 6.3% 5.5% 2.6% 6.5%
Median Age (2014 est., in years) 39.1 38.9 36.8 37.5 37.4 37.7
Source: Claritas Inc. 2014

FEASIBILITY ANALYSIS OF A REDEVELOPED PORTER COUNTY EXPO CENTER & FAIRGROUNDS Local Market Conditions Analysis Page 18
18
Exhibit 5
Key Porter County City Demographics
Source: Claritas Inc., 2014.
When looking at the five cities/towns within Porter County, shown in Exhibit 5, it is important to note that the cities of Portage and Valparaiso currently possess the greatest population centers within the county, with nearly 37,700 and 32,600 residents, respectively. However, Chesterton’s population has increased nearly 26 percent from 2000 to 2014, to more than 13,500 residents. Further, Chesterton possesses the highest estimated average household income among the cities reviewed, at more than $72,300 in 2014. All five cities/towns are projected to exhibit greater growth in average household income over the next five years than both the collective State of Indiana and the U.S. average.
Town of Town of Town of City of City of State ofDemographic Variable Chesterton Hebron Kouts Portage Valparaiso Indiana U.S.
Population (2000) 10,774 3,745 1,687 32,262 29,130 6,080,508 281,421,942Population (2010) 13,068 3,724 1,879 36,828 31,730 6,483,802 308,745,538Population (2014 est.) 13,542 3,659 1,929 37,675 32,594 6,567,159 317,199,353
% Change (2000-2014) 25.7% -2.3% 14.3% 16.8% 11.9% 8.0% 12.7%
Population (2019 est.) 13,885 3,555 1,961 38,370 32,754 6,673,232 328,309,464% Change (2014-2019) 2.5% -2.8% 1.7% 1.8% 0.5% 1.6% 3.5%
Avg. Household Inc. (2000) 64,352 48,016 49,225 52,874 57,526 52,266 56,644Avg. Household Inc. (2014 est.) 72,347 62,893 67,320 62,492 67,713 61,175 71,320
% Change (2000-2014) 12.4% 31.0% 36.8% 18.2% 17.7% 17.0% 25.9%
Avg. Household Inc. (2019 est.) 81,190 68,326 74,970 69,203 76,548 62,747 75,940% Change (2014-2019) 12.2% 8.6% 11.4% 10.7% 13.0% 2.6% 6.5%
Median Age (2014 est., in years) 39.4 35.4 36.7 37.7 35.1 37.4 37.7

FEASIBILITY ANALYSIS OF A REDEVELOPED PORTER COUNTY EXPO CENTER & FAIRGROUNDS Local Market Conditions Analysis Page 19
19
Existing Porter County Lodging and Event Facilities As previously mentioned, a community’s hospitality infrastructure, in terms of hotels, restaurants, entertainment and other such factors, normally contributes heavily to the potential success of an event facility, such as that proposed for Porter County. The marketability of event facilities typically increase when supporting amenities infrastructure exist within close proximity. This supporting hospitality infrastructure also plays a key role in generating the desired economic impact of added event space. An important component of this hospitality infrastructure is the local inventory of quality hotel properties. As shown by Exhibit 6, there are 13 lodging properties in the Porter County area, offering over 60 hotel rooms.
Exhibit 6 Porter County Area Hotels
The Hilton Garden Inn Chesterton and the Days Inn of Portage represent the two largest properties in Porter County, offering 120 and 118 guestrooms, respectively. As is typical for limited-service and economy hotel properties like those that operate in Porter County, meeting/conference space integrated within the properties is relatively limited. Specifically, only a few of the hotels offer one or more meeting rooms.
Facility Rooms Facility Rooms
Hilton Garden Inn Chesterton Hotel 120 Holiday Inn Express Portage 76
Days Inn of Portage 118 Comfort Inn and Suites Porter 70
Courtyard by Marriott 111 Super 8 Motel Portage 65
Best Western Plus Portage Hotel and Suites 100 Fairfield Inn and Suites 63
Country Inn & Suites Portage 100 Best Western Indian Oak 62
Holiday Inn Express Hotel & Suites Valparaiso 85 Hampton Inn Portage Hotel 60
Hampton Inn and Valparaiso Hotel 77
1
2
3
4
5
6
7
8
9
10
11
12
13

FEASIBILITY ANALYSIS OF A REDEVELOPED PORTER COUNTY EXPO CENTER & FAIRGROUNDS Local Market Conditions Analysis Page 20
20
Exhibit 7 presents the location of each of the 13 lodging properties.
Exhibit 7 Location of Porter County Lodging Properties
As shown, there are clusters of hotel properties in Portage at the intersection of Interstates 94 and 90, and in Valparaiso due to the demand generated by the University, with no properties in the southern half of the county.
810413
12
1
6 711 3
9
2
5

FEASIBILITY ANALYSIS OF A REDEVELOPED PORTER COUNTY EXPO CENTER & FAIRGROUNDS Local Market Conditions Analysis Page 21
21
The number of potentially competitive event facilities in the local market is also an important consideration with respect to the overall viability of any new/redeveloped event facility. Porter County currently offers a number of event facilities, including meeting space within hotel facilities and event space at specialized area facilities. Exhibit 8 presents a listing of the primary Porter County facilities that offer flat floor meeting space for rental.
Exhibit 8 Primary Porter County Meeting and Event Facilities
As presented, there are 11 primary meeting facilities that exist throughout the Porter County market. The PCEC is the largest facility in the market with flat floor event space, offering approximately 39,900 square feet of total sellable space, including 9,800 contiguous square feet of space within the Main Hall. It is important to note that this only includes prime event space, and does not take into consideration concourse, lobby or other space whose primary function is not geared toward accommodating flat floor events.
1
2
3
4
5
11
6
7
8
9
10
Multipurpose/ Largest Number of RoomsExhibit Meeting Ballroom Sellable Contiguous Meeting at HQ
Facility Space Space Space Space Space Rooms Hotel
Porter County Exposition Center 9,840 7,000 23,100 39,940 9,840 2 0
Woodland Park Community Complex 0 2,300 13,200 15,500 9,600 2 0
Harre Union (Valparaiso University) 0 4,400 7,700 12,100 7,700 7 0
Strongbow Inn 0 1,300 5,500 6,800 5,500 4 60
Casa Del Roma 0 4,000 7,250 11,250 4,500 3 0
Trinity Hall 0 900 4,500 14,940 4,500 1 0
Aberdeen Manor 0 0 4,320 4,320 4,320 0 0
Holiday Inn Express & Suites (Portage) 0 1,400 0 1,400 1,400 1 76
Holiday Inn Express (Valparaiso) 0 1,600 0 1,600 1,250 2 85
Best Western Portage 0 1,600 0 1,600 1,200 3 100
Best Western Indian Oak 0 1,200 0 1,200 1,200 1 62

FEASIBILITY ANALYSIS OF A REDEVELOPED PORTER COUNTY EXPO CENTER & FAIRGROUNDS Local Market Conditions Analysis Page 22
22
The location of the existing primary local meeting and event facilities is presented in Exhibit 9.
Exhibit 9 Location of Primary Porter County Meeting and Event Facilities
As many of the available meeting and event venues in Porter County (aside from the PCEC) are supported by attached lodging properties, the pattern of Porter County meeting and event facilities largely follows a similar pattern shown with respect to location of hotel properties in the county. There is a cluster of event facilities in downtown Valparaiso and Portage.
1
4 3 5
6 7
2 8
9
11 7
10

FEASIBILITY ANALYSIS OF A REDEVELOPED PORTER COUNTY EXPO CENTER & FAIRGROUNDS Local Market Conditions Analysis Page 23
23
Attractions Porter County offers a number of attractions and recreational opportunities. The community continues to benefit from its location near Interstates 60, 90 and 94. Prominent attractions are listed in Exhibit 10, with their associated locations plotted within Porter County.
Exhibit 10
Source: Indiana Dunes Tourism, 2014
Indiana Dunes Hoosier Bat Company4th Street Theater Memorial Opera HouseAnderson's Vineyard & Winery Midwest Sundowners Miniture Air ShowArt Barn Mount BaldyBailly Homestead and Chellberg Farm Ogden Gardens ParkBeverly Shores Museum & Art Gallery Portage Lakefront and RiverwalkBroken Wagon Bison Farm Porter County Museum of HistoryButler Winery Seven Peaks Water Park DunelandCentury of Progress Homes Stagecoach Inn & Panhandle DepotChesterton and Porter Walking Tours Valparaiso Fire MuseumChicago Street Theater Valparaiso UniversityCountryside Park and Alton Goin Museum Westchester Township History MuseumCowles Bog Wolf MansionDowntown Valparaiso Walking Tours Zao Island Amusement Center
Primary Porter County Attractions

FEASIBILITY ANALYSIS OF A REDEVELOPED PORTER COUNTY EXPO CENTER & FAIRGROUNDS Local Market Conditions Analysis Page 24
24
As illustrated, there are some clusters of attractions in downtown Portage, Chesterton, and Valparaiso, but few in the southern half of the county. The most well-known attraction in Porter County are the Indiana Dunes National Lakeshore and State Park on Lake Michigan, offering a variety of nature related activities. Conclusions An initial area of focus of the study effort was an analysis of the conditions present in the local marketplace that could impact the potential success of a redeveloped PCEC. Factors considered include socioeconomic characteristics, transportation accessibility, hotel inventory, corporate base and traditional visitor amenities (such as attractions, entertainment/leisure options, restaurants, retail, etc.). Strengths of the local Porter County market as they relate to a potential redeveloped PCEC and functioning as an event destination include:
1. Accessibility via Interstates 80/90 and 94.
2. Close proximity to the Chicago market population and corporation base.
3. Unique attraction in the Indiana Dunes National Lakeshore and State Park.
4. Practical driving distance to several large regional metropolitan areas.
5. Quantity and location of hotel rooms within the community.
Some of Porter County’s weaknesses as they relate to supporting a potential redeveloped PCEC and functioning as an event destination include:
1. Limitations in existing hotel inventory in terms of mix of properties, size of largest property, hotels within walking distance of event facilities—may constrain the size of certain non-local event activity that could be attracted with a redeveloped PCEC.
2. Some negative or neutral perceptions of select event planners regarding the appeal of the area for events.
3. While the proximity to the Chicago market population and corporate base provides a substantial foundation from which to draw potential facility event attendees, it also possesses a significant number of competitive venues.

FEASIBILITY ANALYSIS OF A REDEVELOPED PORTER COUNTY EXPO CENTER & FAIRGROUNDS Comparable Facility Benchmarking Analysis Page 25
4. Comparable Facility Benchmarking Analysis This chapter provides a review of the various physical characteristics and resources of comparable event facilities and host communities. A set of comparable facilities was identified and analyzed to obtain insight into the physical and operational characteristics of facilities located in comparable communities throughout the country. Comparable Event Facilities Exhibit 1 presents a summary of the physical characteristics and components of the primary event spaces of the comparable facilities analyzed. The figures under the “Largest Contiguous Exhibit Space” and “Total Indoor Event Space” columns represent square feet.
Exhibit 1 Competitive/Comparable Markets – Facility Characteristics
Source: Interviews with facility management, facility websites, industry publications, 2014
LargestOwnership Size Total Permanent Portable RV Grandstand Arena
Facility City, State Structure (in acres) Stalls Stalls Stalls Hookups Seating Seating
Western Idaho Fairgrounds Boise, ID County 240 140 140 0 101 3,200 225Clark County Fair Exhibition Center Ridgefield, WA County 170 285 260 25 n/a 7,500 550Lancaster Events Center Lincoln, NE 501(c)3 167 800 400 400 200 n/a 300Island Grove Events Center Greeley, CO City/County 145 150 150 0 300 9,000 100Deschutes County Fair and Expo Center Redmond, OR County 132 400 75 325 106 2,500 4,000Porter County Expo Ctr. and Fairgrounds Valparaiso, IN County 85 142 110 32 100 2,350 200Kansas Expocentre Topeka, KS County 80 261 241 20 76 n/a 10,000Wichita Falls Multipurpose Center Witchita Falls, TX City 80 275 0 275 600 n/a 6,500Claremore Expo Claremore, OK City 55 310 90 220 44 n/a 2,400Nolan County Coliseum Sweetwater,TX County 50 300 300 0 130 n/a 3,200Douglas County Fairgrounds and Event Center Castle Rock, CO County 45 244 94 150 10 2,450 2,000Bell County Expo Belton, TX County 43 275 220 55 16 n/a 6,000Ector County Coliseum Odessa, TX County 42 120 0 120 45 n/a 7,400Linn County Fair & Expo Center Albany, OR County 35 284 94 190 67 n/a 2,250Young County Arena Graham, TX City 20 250 0 250 60 n/a 2,500Mallett Event Center and Arena Levelland, TX County 3 121 0 121 50 n/a 1,950
Average 89 270 139 131 133 4,500 3,100Median 80 261 110 120 88 2,900 2,300
Contiguous IndoorEvent Enclosed Covered Outdoor Event Exhibit Event
Facility Buildings Arenas Arenas Arenas Barns Halls Space Space
Lancaster Events Center 9 3 0 2 1 3 83,000 235,650Clark County Fair Exhibition Center 12 1 0 1 6 4 97,200 183,600Linn County Fair & Expo Center 7 2 0 1 1 3 48,600 131,400Island Grove Events Center 10 0 0 4 2 4 58,200 126,300Kansas Expocentre 7 2 1 0 1 3 44,500 121,350Wichita Falls Multipurpose Center 6 2 1 0 1 2 38,100 121,200Deschutes County Fair and Expo Center 13 1 2 1 5 4 14,900 92,550Mallett Event Center and Arena 4 2 0 0 0 2 25,200 85,825Western Idaho Fairgrounds 12 0 0 2 5 5 35,000 84,200Bell County Expo 7 2 1 0 2 2 36,250 81,240Douglas County Fairgrounds and Event Center 10 1 0 3 4 2 29,100 71,650Claremore Expo 4 1 1 0 1 1 31,000 68,200Ector County Coliseum 9 1 1 1 4 2 23,000 57,700Nolan County Coliseum 6 1 1 1 1 2 17,000 52,100Young County Arena 4 1 1 2 0 0 5,000 46,400Porter County Expo Ctr. and Fairgrounds 12 0 0 2 6 4 9,840 39,960
Average 8 1 1 1 2 3 39,100 104,000Median 7 1 1 1 1 2 35,000 85,800

FEASIBILITY ANALYSIS OF A REDEVELOPED PORTER COUNTY EXPO CENTER & FAIRGROUNDS Comparable Facility Benchmarking Analysis Page 26
As shown, the facilities range in acreage, components and seating capacities. A number of event complexes incorporate multiple buildings at the site. Beyond dirt-oriented event space and ancillary facilities such as barns/stalls, many of the facilities offer flat floor event space for exhibitions, assemblies, banquets and meetings. The existing PCEC lies near the bottom of this set of complexes in terms of total indoor event space, largest arena seating and largest contiguous exhibit space. While there is significant variation among the comparable facilities reviewed for this study, the following is a summary of typical or industry average characteristics:
• Facility size ranges from three acres for the Malett Event Center and Arena in Levelland, Texas to the 240-acre Western Idaho Fairgrounds in Boise, Idaho. The PCEC’s 86-acre size is comparable to the average and median size of facilities reviewed.
• A typical comparable facility offers between 140 and 300 stalls and between 50 and 150 RV hook-ups. RV hook-ups can also be an important income generator for the facility, with rental extended to patrons beyond those attending or participating in events.
• On average, the largest single indoor exhibit hall among comparable facilities reviewed approximates 39,100 square feet, ranging from just 5,000 square feet up to 97,200 contiguous square feet. Total indoor event space ranges from 46,400 square feet to nearly 235,700 square feet, averaging 104,000 square feet per complex. The PCEC ranks at or near the bottom among the comparable facilities reviewed in each of these categories.
• On average, main arenas include a total capacity of approximately 3,100 seats, typically ranging between 100 and 10,000. The PCEC ranks near the bottom among comparable venues reviewed, offering approximately 200 seats at its outdoor horse ring.
• The majority of comparable facilities are owned and operated by the public sector (i.e., City or County government).
• Likewise, as will be discussed in a later chapter, the majority of comparable facilities operate at a financial operating deficit, requiring public sector subsidy to support annual operations.
• Based on available information, a typical cost to construct comparable facilities might range between $10 million and $20 million, and is largely dependent on size, amenities, level of finish, site conditions, location, etc. Funding for the majority of facility projects was obtained almost entirely from the public sector; however, in some instances, funding was also obtained from local private donors and corporations.
Facility Case Studies To further illustrate the characteristics of each of these identified competitive and comparable facilities, case studies were developed for each and are presented in Appendix A.

FEASIBILITY ANALYSIS OF A REDEVELOPED PORTER COUNTY EXPO CENTER & FAIRGROUNDS Comparable Facility Benchmarking Analysis Page 27
Demographic Comparison of Host Communities The strength of a community in terms of its ability to draw events, attendees and visitors is measured in part by the size of the market area population and its spending characteristics. To gain an understanding of the relative strength of the Porter County market area, it is useful to compare various demographic characteristics among the comparable markets supporting similar venues. For this analysis, the market demographics of the Porter County area and the markets hosting the comparable facilities that were selected for review have been evaluated using 25-, 75- and 200-mile concentric rings around the respective market’s complex. Population Exhibit 2 displays the population within the comparable markets’ county, and 25-, 75- and 200-mile radii of each of the markets’ complex.
Exhibit 2 Comparable Communities – Total Population
As shown in the exhibit, the county population associated with comparable communities range from a low of less than 14,700 in Sweetwater, Texas, to a high of nearly 444,700 in Ridgefield, Washington. The average population of the host county of each comparable market (excluding Porter County) approximates 197,600. This compares to 166,100 people within Porter County. Within a 25-mile radius, the population ranges from a low of 22,400 in Sweetwater, Texas to a high of 1.9 million in Ridgefield,
Market County 25-Mile 75-Mile 200-Mile
Ridgefield, WA 444,683 1,903,581 3,044,324 9,490,568Castle Rock, CO 305,871 1,347,780 4,159,593 5,423,032Porter County, IN 166,118 660,412 9,581,742 28,722,281Claremore, OK 89,246 632,610 1,524,759 8,975,317Boise, ID 420,343 621,573 746,449 1,320,497Greeley, CO 271,291 504,461 3,710,294 5,300,607Albany, OR 119,359 502,910 3,117,433 6,636,967Belton, TX 332,440 380,590 2,830,707 21,197,635Lincoln, NE 298,566 338,282 1,462,900 6,692,356Topeka, KS 179,312 298,428 2,561,898 7,993,531Odessa, TX 150,190 297,504 489,240 1,659,289Redmond, OR 164,035 175,641 229,951 5,286,169Witchita Falls, TX 132,192 140,670 1,092,040 11,992,599Levelland, TX 23,176 74,701 550,751 2,034,588Graham, TX 18,226 24,131 941,525 12,794,682Sweetwater,TX 14,653 22,428 395,944 5,506,604
Average (excluding Porter County) 197,600 484,400 1,790,500 7,487,000
Porter County Rank (out of 16) 8 3 1 1
Sorted by 25-mile populationSource: Claritas, Inc. 2014

FEASIBILITY ANALYSIS OF A REDEVELOPED PORTER COUNTY EXPO CENTER & FAIRGROUNDS Comparable Facility Benchmarking Analysis Page 28
Washington, and a market average (excluding Porter County) of 484,400. When considering the 75- and 200-mile radii measurement, the proximity of the Chicago market improves Porter County’s relative position among the comparable markets reviewed. In fact, Porter County’s 75-mile market population is 130 percent larger than that of the next most populous 75-mile market, and its 200-mile market population is more than 35 percent larger than the next largest market offering a comparable facility. Household Income Average household income reflects a household’s income that is remaining after taxes have been paid, which is available for disposable spending and saving. This statistical figure can be valuable when evaluating consumer capacity and propensity to expend personal income on leisure goods and services, such as attending certain events at public assembly facilities. Exhibit 3 presents the average household income within the comparable event markets.
Exhibit 3 Comparable Communities – Average Household Income
As shown, the average household income within Porter County is approximately $73,900. The average household income of the comparable markets’ county (excluding Porter County) is $67,200. Porter County ranks above the average for average household income among all the geographic region measurements considered.
Market County 25-Mile 75-Mile 200-Mile
Castle Rock, CO $123,756 $91,515 $79,936 $76,389Odessa, TX $65,841 $72,780 $69,222 $61,175Ridgefield, WA $71,320 $71,279 $68,496 $73,590Lincoln, NE $68,422 $69,476 $70,863 $68,712Greeley, CO $71,249 $68,605 $80,130 $77,091Levelland, TX $63,249 $68,329 $59,632 $61,710Porter County, IN $73,887 $64,170 $74,373 $68,219Topeka, KS $62,293 $63,173 $69,826 $64,660Claremore, OK $72,369 $62,496 $59,312 $61,369Belton, TX $62,369 $62,311 $72,693 $73,846Graham, TX $62,510 $61,720 $68,565 $71,635Redmond, OR $61,097 $60,227 $57,860 $63,478Witchita Falls, TX $58,833 $57,444 $59,005 $66,645Boise, ID $61,321 $56,769 $55,965 $57,096Albany, OR $48,151 $56,274 $65,674 $65,603Sweetwater,TX $55,591 $55,467 $56,099 $68,423
Average (excluding Porter County) $67,200 $65,200 $66,200 $67,400
Porter County Rank (out of 16) 2 7 3 8
Sorted by 25-mile average household incomeSource: Claritas, Inc. 2014

FEASIBILITY ANALYSIS OF A REDEVELOPED PORTER COUNTY EXPO CENTER & FAIRGROUNDS Comparable Facility Benchmarking Analysis Page 29
Median Age Exhibit 4 demonstrates the comparable markets’ median age of their corresponding population.
Exhibit 4 Comparable Communities – Median Age
As shown in the exhibit, the comparable markets’ 25-mile median age ranges from 31.1 years of age in Belton, Texas to 50.0 years of age within 25 miles of Albany, Oregon. Porter County’s 25-mile median age of 38.9 is older than the average comparable market’s (excluding Porter County) median age of 37.2 years of age. The average of the comparable markets (excluding Porter County) remained consistent throughout the county, primary and secondary markets analyzed, all falling within a one-year range.
Market County 25-Mile 75-Mile 200-Mile
Belton, TX 31.3 31.1 33.5 34.6Levelland, TX 33.6 32.5 31.9 34.2Odessa, TX 32.2 33.0 33.4 33.9Lincoln, NE 33.5 34.0 35.9 36.8Greeley, CO 33.9 34.2 36.2 36.6Boise, ID 35.9 35.0 35.3 36.3Topeka, KS 38.3 35.0 36.3 37.0Claremore, OK 38.7 36.3 37.7 37.1Ridgefield, WA 37.5 37.4 37.9 38.1Castle Rock, CO 37.3 37.5 36.3 36.7Witchita Falls, TX 34.4 38.4 37.7 35.9Porter County, IN 39.1 38.9 36.8 37.5Sweetwater,TX 38.4 39.5 35.7 34.8Redmond, OR 41.3 41.2 42.4 38.3Graham, TX 41.7 42.4 36.9 35.1Albany, OR 39.5 50.0 35.4 37.7
Average (excluding Porter County) 36.5 37.2 36.2 36.2
Porter County Rank (out of 16) 13 12 11 13
Sorted by: 25-Mile Median AgeSource: Claritas Inc. 2014

FEASIBILITY ANALYSIS OF A REDEVELOPED PORTER COUNTY EXPO CENTER & FAIRGROUNDS Comparable Facility Benchmarking Analysis Page 30
Corporate Base
The number of companies in a market is an important characteristic to evaluate when determining the viability of a multipurpose event complex. From a direct standpoint, local companies tend to provide utilization for flat floor and meeting space in such facilities, through meetings, banquets, training and other such events. Similarly, local companies provide advertising and sponsorship demand for spectator facilities, as well as demand for tickets for certain facility events. Indirectly, the size of a local corporate base also tends to be correlated with the level and breadth of supporting community amenities (i.e., hotels, restaurants, transportation infrastructure, etc.). Exhibit 5 shows the comparable markets’ corporate base, in terms of number of companies.
Exhibit 5 Comparable Communities – Number of Companies
Within Porter County, there are nearly 8,200 businesses, which is near the middle of other counties analyzed. When comparing the comparable primary market corporate base (75-mile radius), Porter County ranks at the top of the comparable markets with 536,500 businesses.
Market County 25-Mile 75-Mile 200-Mile
Ridgefield, WA 22,515 104,591 186,412 578,329Castle Rock, CO 21,955 79,631 278,962 391,036Greeley, CO 16,402 40,755 260,658 380,290Claremore, OK 3,690 40,257 100,351 603,922Porter County, IN 8,184 33,635 536,495 1,826,677Boise, ID 25,433 33,162 41,356 104,560Albany, OR 7,375 28,228 198,032 419,977Lincoln, NE 17,288 24,042 96,389 465,995Belton, TX 13,762 17,909 169,322 1,206,308Odessa, TX 7,832 16,794 27,189 106,713Topeka, KS 9,436 16,096 140,026 546,370Redmond, OR 12,996 13,950 28,306 353,694Witchita Falls, TX 7,806 8,424 60,393 766,641Levelland, TX 1,301 8,419 33,860 130,612Graham, TX 1,616 2,624 62,022 848,066Sweetwater,TX 988 1,591 24,221 547,874
Average (excluding Porter County 11,360 29,100 113,830 496,690
Lewistown Rank (out of 16) 9 5 1 1
Sorted by: 25-Mile CorporationsSource: Hoover’s, Inc. 2014
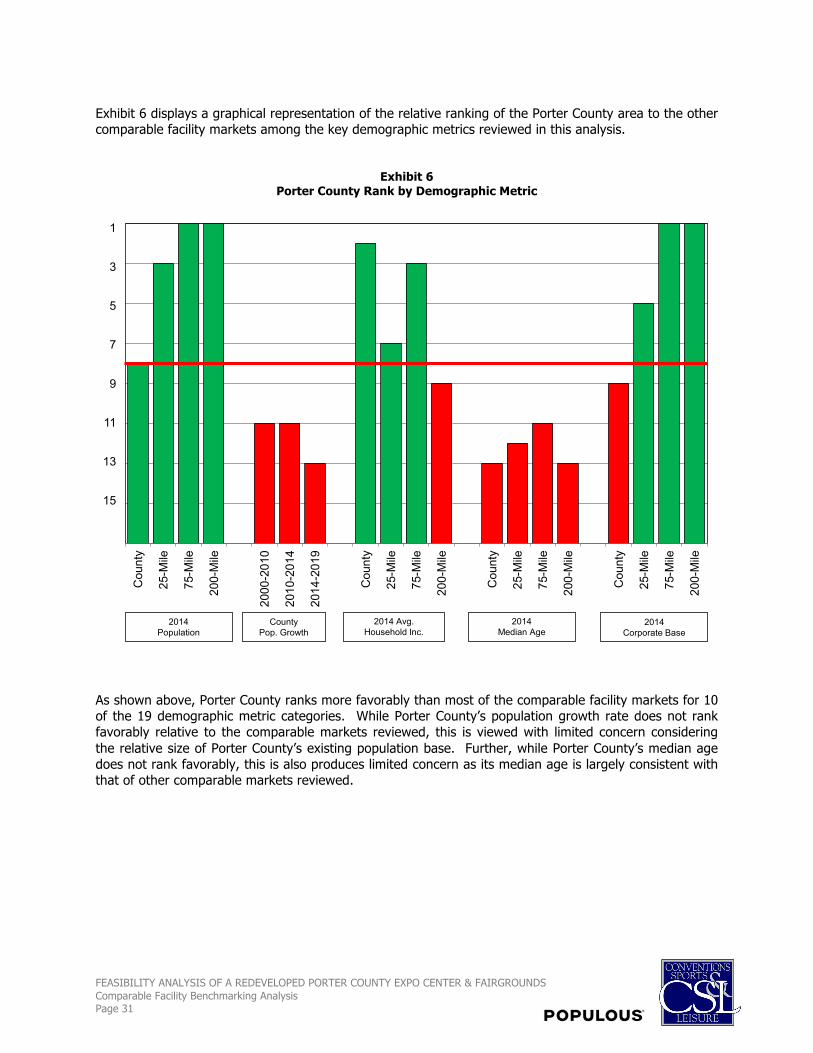
FEASIBILITY ANALYSIS OF A REDEVELOPED PORTER COUNTY EXPO CENTER & FAIRGROUNDS Comparable Facility Benchmarking Analysis Page 31
Exhibit 6 displays a graphical representation of the relative ranking of the Porter County area to the other comparable facility markets among the key demographic metrics reviewed in this analysis.
Exhibit 6 Porter County Rank by Demographic Metric
As shown above, Porter County ranks more favorably than most of the comparable facility markets for 10 of the 19 demographic metric categories. While Porter County’s population growth rate does not rank favorably relative to the comparable markets reviewed, this is viewed with limited concern considering the relative size of Porter County’s existing population base. Further, while Porter County’s median age does not rank favorably, this is also produces limited concern as its median age is largely consistent with that of other comparable markets reviewed.
2014Population
County Pop. Growth
2014 Avg.Household Inc.
2014 Median Age
2014Corporate Base
Cou
nty
25-M
ile
75-M
ile
200-
Mile
2000
-201
0
2010
-201
4
2014
-201
9
Cou
nty
25-M
ile
75-M
ile
200-
Mile
Cou
nty
25-M
ile
75-M
ile
200-
Mile
Cou
nty
25-M
ile
75-M
ile
200-
Mile
1
3
5
7
9
11
13
15

FEASIBILITY ANALYSIS OF A REDEVELOPED PORTER COUNTY EXPO CENTER & FAIRGROUNDS Comparable Facility Benchmarking Analysis Page 32
Conclusions The analysis of 15 identified competitive and comparable facilities provided insight into the physical and operational characteristics of facilities of a similar nature to that contemplated for Porter County. Access to a significant population base throughout the greater Chicago area will have certain implications on the ability of a redeveloped PCEC to attract events, participants, exhibitors and attendees. These population proximity characteristics tend to “shape” the event profile, mix and attendance related to facility activity and utilization and, importantly, do not solely determine whether the facility will be adequately or highly utilized. Importantly, though Porter County ranks favorably relative to the markets reviewed, the event space and supporting amenities currently available within the PCEC are somewhat lacking. Specifically, the largest contiguous exhibit space and total indoor event space offered at the PCEC rank near and at the bottom, respectively, among the comparable facilities reviewed. Further, horse stalls, RV hook-ups and arena seating capacity are also much lower than levels identified among comparable venues.

FEASIBILITY ANALYSIS OF A REDEVELOPED PORTER COUNTY EXPO CENTER & FAIRGROUNDS Market Demand Analysis Page 33
5. Market Demand Analysis
The purpose of this chapter is to provide an analysis of the estimated market demand for a potential redeveloped PCEC in Porter County. To form a basis for the analysis, a variety of techniques were used. Specifically, detailed telephone interviews were completed with event producers representing key event segments that could use a potential redeveloped complex. This survey-based technique provides a detailed understanding of potential user needs, their willingness to use a potential redeveloped PCEC, as well as overall perceptions of Porter County as a potential host community for their event. Industry Definitions and Characteristics The public assembly event industries are diverse and dynamic, consisting of a wide variety of events, many of which focus around a collection or gathering of individuals for the purpose of entertainment/recreation and/or face-to-face communication and the transmission of ideas/information. Exhibit 1 illustrates differences in the typical physical characteristics and event profiles of traditional event facilities.
Exhibit 1 Typical Public Assembly Facility Characteristics
DRAFT COPYFor Discussion Purposes
Typical Event Facility Characteristics
Convention Conference Expo Community/ Spectator Horse/Event FairgroundsCenter Center Center Civic Center Arena Center Complex
Type of SpaceExhibit,
Meeting, Ballroom
Meeting, Ballroom
Exhibit, Limited Meeting
Multipurpose Space
Spectator Seating, Flat Floor Space
Multiple Indoor & Outdoor
Facilities, Dirt & Concrete, Spectator
Seats
Multiple Indoor & Outdoor
Facilities, Dirt & Concrete, Spectator
Seats
Typical Events
Conventions, Trade Shows,
Meetings, Banquet,
Public Shows
Conferences, Meetings, Banquets
Public Shows, Trade Shows, Miscellaneous
Local Meetings & Banquets, Recreation,
Other Events
Spectator and Other Events
Horse, Rodeo, Ag., Livestock, Public Shows
Fair, Ag., Horse,
Livestock, Public Shows,
Festivals, Other
Typical Ancillary Characteristics
Adjacent Headquarters
Hotel
Adjacent Headquarters
Hotel
Parking, Accessibility,
Visibility
Parking, Accessibility,
Visibility
Parking, Accessibility,
Visibility
Parking, RV Hookups,
Large Acreage
Parking, RV Hookups,
Large Acreage
Economic Impact Generating Ability High Moderate
Limited to Moderate
Limited to Moderate
Limited to Moderate Moderate
Limited to Moderate
IV. MARKET DEMAND ANALYSIS

FEASIBILITY ANALYSIS OF A REDEVELOPED PORTER COUNTY EXPO CENTER & FAIRGROUNDS Market Demand Analysis Page 34
• Convention centers, under the traditional model, typically incorporate exhibit, meeting and ballroom space. Usually located in medium- to large-sized cities, convention centers tend to focus on attracting non-local economic impact-generating events such as conventions and tradeshows. It is imperative that convention-quality hotel inventory is located close to the center. Convention centers also tend to host a large number of secondary events, such as corporate meetings, public shows and banquets.
• Conference centers tend to represent smaller facilities than convention centers, usually containing both flexible and dedicated meeting space, in addition to banquet space. Most traditional conference centers do not incorporate prime exhibit space and instead focus on accommodating local and non-local corporate meetings/conferences along with other local event activity such as private receptions and banquets. Many conference centers are situated within hotel facilities. Conference centers are often broken into several categories related to their type/focus: executive, corporate, resort and college/university.
• Expo centers, or exposition/exhibition centers, traditionally consist of large exhibit-focused structures possessing limited or no breakout meeting and banquet space. Expo facilities tend to be lower cost facilities (i.e., construction cost per gross square foot) than convention and conference centers. Most of the events accommodated by traditional expo centers are local in nature and include events such as public/consumer shows, festivals and other large flat floor space using events.
• Community/civic centers tend to vary widely in terms of their physical and operational characteristics. Many centers offer multipurpose space that can accommodate a wide variety of events. The large majority of event activity represents events and attendees from the local area and, as such, adjacent/nearby hotel inventory does not tend to be a primary concern for most events. Communities tend to develop these types of facilities for the good and benefit of the local community rather than for economic impact generating purposes.
• Spectator arenas are plenary seating venues that primarily accommodate spectator events such as sporting events, concerts, family shows and circuses. Some spectator venues have the capability to configure the arena floor and/or retract some or all of its seating areas to accommodate certain types of flat floor events such as graduations, public shows, and recreation activities.
• Horse/event centers are typically multi-facility complexes, often located in rural or non-urban settings. Most horse/event centers focus on accommodating dirt-oriented shows, events and exhibitions. Typical horse/event centers include a variety of event, show and stable areas, such as arenas, exhibition facilities, show arenas, warm-up arenas, rodeo arenas, horse barns, livestock barns/pens and other such areas.
• Fairgrounds complexes are often similar to horse/event centers, including a variety of indoor and outdoor facilities suitable for equine, livestock, agricultural, exhibition and recreational events and activities. The primary role of these facilities is often to play host to an annual fair (i.e., County or State Fairs, etc.). Some fairgrounds complexes also integrate dirt racetracks and grandstands for outdoor spectator events.
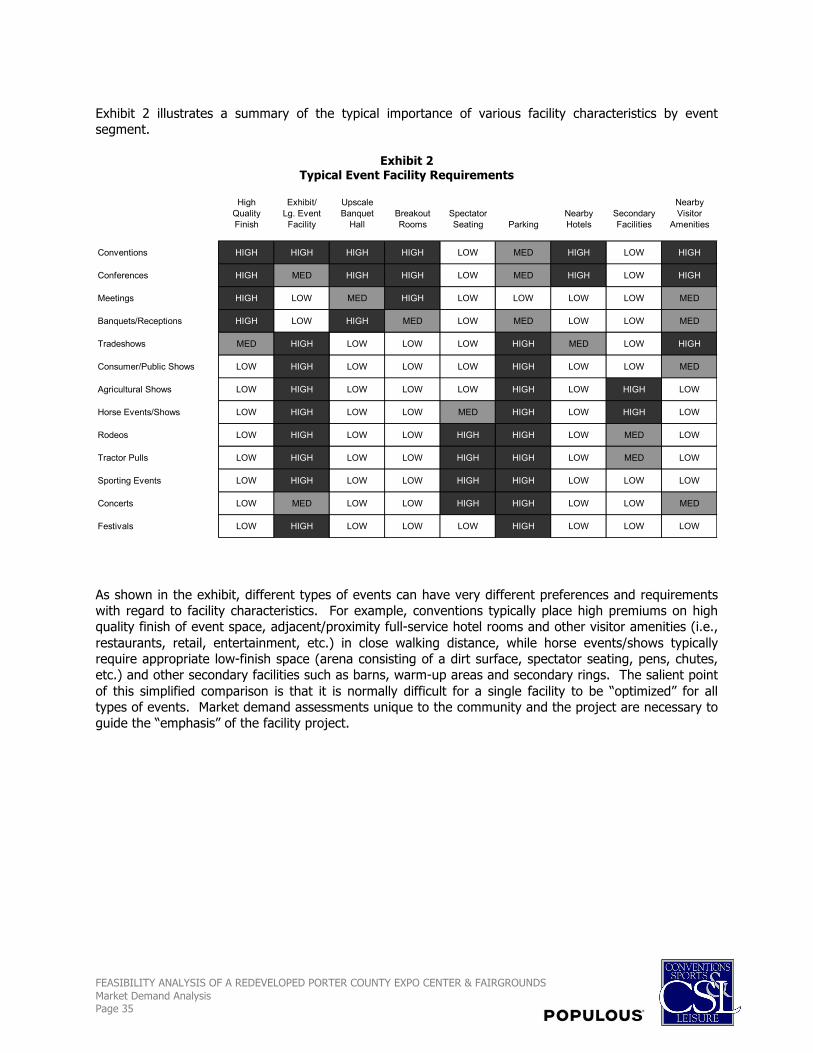
FEASIBILITY ANALYSIS OF A REDEVELOPED PORTER COUNTY EXPO CENTER & FAIRGROUNDS Market Demand Analysis Page 35
Exhibit 2 illustrates a summary of the typical importance of various facility characteristics by event segment.
Exhibit 2 Typical Event Facility Requirements
As shown in the exhibit, different types of events can have very different preferences and requirements with regard to facility characteristics. For example, conventions typically place high premiums on high quality finish of event space, adjacent/proximity full-service hotel rooms and other visitor amenities (i.e., restaurants, retail, entertainment, etc.) in close walking distance, while horse events/shows typically require appropriate low-finish space (arena consisting of a dirt surface, spectator seating, pens, chutes, etc.) and other secondary facilities such as barns, warm-up areas and secondary rings. The salient point of this simplified comparison is that it is normally difficult for a single facility to be “optimized” for all types of events. Market demand assessments unique to the community and the project are necessary to guide the “emphasis” of the facility project.
High Exhibit/ Upscale NearbyQuality Lg. Event Banquet Breakout Spectator Nearby Secondary VisitorFinish Facility Hall Rooms Seating Parking Hotels Facilities Amenities
Conventions HIGH HIGH HIGH HIGH LOW MED HIGH LOW HIGH
Conferences HIGH MED HIGH HIGH LOW MED HIGH LOW HIGH
Meetings HIGH LOW MED HIGH LOW LOW LOW LOW MED
Banquets/Receptions HIGH LOW HIGH MED LOW MED LOW LOW MED
Tradeshows MED HIGH LOW LOW LOW HIGH MED LOW HIGH
Consumer/Public Shows LOW HIGH LOW LOW LOW HIGH LOW LOW MED
Agricultural Shows LOW HIGH LOW LOW LOW HIGH LOW HIGH LOW
Horse Events/Shows LOW HIGH LOW LOW MED HIGH LOW HIGH LOW
Rodeos LOW HIGH LOW LOW HIGH HIGH LOW MED LOW
Tractor Pulls LOW HIGH LOW LOW HIGH HIGH LOW MED LOW
Sporting Events LOW HIGH LOW LOW HIGH HIGH LOW LOW LOW
Concerts LOW MED LOW LOW HIGH HIGH LOW LOW MED
Festivals LOW HIGH LOW LOW LOW HIGH LOW LOW LOW

FEASIBILITY ANALYSIS OF A REDEVELOPED PORTER COUNTY EXPO CENTER & FAIRGROUNDS Market Demand Analysis Page 36
Exhibit 3 presents a sampling of types of events within major categories that are often accommodated by the type of multipurpose event complex project contemplated for Porter County—some of which the existing PCEC is already accommodating to modest degrees.
Exhibit 3 Typical Multipurpose Event Complex Events by Type
Further, to assist in this analysis, event history data was collected from each of the competitive/comparable facilities (discussed in the previous chapter). Exhibit 4, on the following two pages, presents a listing of the actual events hosted in a recent year at the comparable facilities reviewed under this study. The event data illustrate the wide diversity of event types accommodated by the event complexes reviewed.
• Corporate • Private trade• State association• Regional association• National association• International association• Social, military, education, religious,
fraternal
• Gaited• Barrel racing• Carriage• Pleasure• Cutting• Dressage• Driving• Equitation• Hunter• Jumper• Racing• Reigning• Penning• Western• Walking• Roping• Rodeo
HORSE SHOW/EVENTS
• Gun show• Antique show• Auto show• Boat & RV show• Bridal show• Craft & quilt fair• Home improvement show• Home & garden show• Sports show
OTHER EVENTS• Graduations• Festivals• Flea Markets• Motocross• Exams• Concerts• Amateur Sports
MEETINGS/BANQUETS• Meetings• Banquets• Receptions• Weddings• Seminars• Corporate training• Lectures
CONVENTIONS/TRADESHOWS
CONSUMER/PUBLIC SHOWS
• Pig show/sales• Cattle show/sales• Sheep show/sales• Goat show/sales• Alpaca show/sales
LIVESTOCK SHOWS

FEASIBILITY ANALYSIS OF A REDEVELOPED PORTER COUNTY EXPO CENTER & FAIRGROUNDS Market Demand Analysis Page 37
Exhibit 4 - Examples of Specific Events Held by Comparable Facilities
2-Day Truck Bash Continental Antique Shows4D Barrel Jackpot County Fair4-H Mardi Gras County Holiday Big Country Dance4-H Ride Night County Jr. Livestock4-H Shooting Club County Livestock ShowACRA Finals Rodeo and Trade Show County Roping Agility Dog Show County Sheriff TrainingAGR Cattle Show County Sports FestivalAJBA All American Brahman County Stock ShowAKC Dog Show County Youth FairAlpaca Llama Grand National Show Countywide Garage SaleAmerican Boer Goat Show Cowboy Calf Roping AssociationAmerican Dexter Cattle Association Cowboy Capital 5D Barrel RaceAnnual Bring Out the Bags Cowboy Capital Barrel FinalsAnnual Glass & Pottery Show & Sale Cowboy Church CampAntique Auction Cowboy Church RodeoAntique Show Cowboy Mounted ShootingAntique Tractor Pull Craft FairAppaloosa Horse Club Crawfish BoilArabian Horse Club Crawfish Classic Cutting Horse AssociationArabian Horseshow Cross Canadian Ragweed! ConcertArchery Shoot Crosstimbers Cowboy ChurchArchery Shooters Association Regional CSPOTWIN Competition Agility CampArea IV FFA Leadership Cutting Horse AssociationArena Cross Cutting Horse ShowArts & Crafts Show CVB BanquetAthens Summer Jubilee AQHA Show Cycle City Promotions Arena CrossAthletic Championship Cheer & Dance Comp. D&G Barrel RacingAvalon Hunter Horse Show Dance Dreams RecitalAvon Meeting Demolition DerbyAzalea Classic Paint Horse Show Derby 4UBarrel Bash District Livestock ShowBarrel Racing Association Dittos for KiddosBeef Master Show and Sale Do Dat BarbequeBelt Buckle Bash Livestock Show Dog Agility ShowBen Hur Shrine Circus Dog ShowBest in State Barrel Racing Doll Collectors' Society Doll ShowBig Country Cutting Dressage ClubBlack Rodeo Ducks Unlimited BanquetBlues Festival Elephant Rock Cycling AdventureBoat & RV Show Expo PartyBonanza Cutting Extreme Calf RopingBrides Club Wedding Expo Family & Child Services MeetingBrookhollow Field Day Family Care Giver ConferenceBull Blow Out Fear Not Team RopingCat Club Fish and ChicksCBR Barrel Racing Fortune 5 Barrel RaceCelebration of Champions Free Style Bomb TourChamber Banquet Friends of the NRAChamber of Commerce Business Expo General Board MeetingCherokee Nation Food Distribution Get Connected! Hair, Skin & Nail ShowChoctaw Nation's Horsemans Association Goat ExtravaganzaChoctaw Pow Wow Good Sams RV Club Mtg.Christmas Wrestling Great American Train ShowCircle G Quarter Horse Show Gun & Blade ShowCircus Gun & Knife ShowClassic AQHA Shows Gun ShowClassic Paint Horse Show H & H DanceCollectible Cars Auction Halloween CarnivalCollectibles and Tack Auction Harlem GlobetrottersCollector's West Gun & Knife Show Health FairConcerts High School ReunionConsignment Sale High School Rodeo

FEASIBILITY ANALYSIS OF A REDEVELOPED PORTER COUNTY EXPO CENTER & FAIRGROUNDS Market Demand Analysis Page 38
Exhibit 4 (Continued) - Examples of Specific Events Held by Comparable Facilities
Hip Hop Show Professional Bull Riders TourHog Show Quail UnlimitedHoliday Food & Gift Show Quarter Horse ShowHorse & Cattle shows and sales Ranch RodeoHorse Committee Dr. Householder Clinic Range Beef Cow SymposiumHunter Jumper Horse Show Regional Cutting Horse AssociationIndoor Cart Races Regional Halloween FestIndoor Go Karts Regional High School RodeoIndoor Soccer Regional Longhorn ShowInternational Junior Brangus Show Regional Paint Horse ClubInvitational Steer Roping Regional RodeoJohn Deere Partners in Production Reining OKRHA SeminarJunior College Rodeo ReunionsJunior High School Rodeo Finals Rocky Mountain Beef ExpoJurassic Classic Barrel Racing RodeoK9 Xpress Agility Training RopingKennel Club Roscoe Pig SaleKennel Club Dog Show Rotary Wild Game FestKid's Expo & Day Camp RV Group MeetingLarge Yard Sale Science FairLifechanger Church Dinner Service Season of CraftsLipizzaner Stallion Show Seniors Team Roping AssociationLittle Valley Auto Swap Shallow Exploration Drillers ClinicLivestock shows Sheep & Goat ValidationsMaker Faire Shoot for the Dough Winter ClassicMaster Gardener Meetings Show Arts, Crafts & Home DécorMaster Swine Volunteer Seminar Showstopper Boer Goat SaleMDA Rodeo ShrimpfestMeetings Silver Buckle Horse ShowMemorial Open Barrel Race Spirit Fingers Pom & CheerMetro Wrestling Spring Classic HorseshowMexican Bullriding Spring Horse SaleMiniature Horse Show Stakes Cutting FuturityMMA Boxing Stampede Team RopingMonster Truck Racing State 4-H Working Cowhorse ClinicMonster Trucks State FairMotorcross State High School RodeoMud Race State Horse ExpoMule & Donkey Show Steer RopingMusic Festival StockShow & RodeoN.C.T. Meat Goat Show Summer Circuit Cutting ShowNational Barrel Horse Association SupercrossNational Shetland Dog Show TCRA RodeoNational Terrier Dog Show Team RopingNCHA Day The Mane Event Equestrian ExpositionNEOSHA Barrel Race Trade ShowsNew Year's Anticipation Barrel Race Triathlon FestivalNorth American Corriente Association Tri-County Ag ExpoNorthwest RV Show Universal Fight Promotions - Cage FightNW Fly Fishing Show US Pony Club ShowOld Time Tractor Show and Pull USCRA Calf Roping FinalsOne Stop Unique Christmas Shopping USTPA Team PenningOpen Horse Show USTRC Affiliate RopingOriginal Team Roping Veterans Memorial Fight Night Pro BoxingOTRA Team Roping & Special Event WeddingsPaint Horse Show Winter Circuit CuttingPalomino Exhibitors Association Women of CountryPCBR Senior Bullriding World Junior Team Roping ChampionshipPinewood Derby Worlds Largest Rattlesnake RoundupPolice Academy Training WTBRA Barrel Racing Round UpPoultry Show Xtreme World Moto-CrossPower Farming Show Young Guns of CountryPRCA Rodeo Youth Rodeo

FEASIBILITY ANALYSIS OF A REDEVELOPED PORTER COUNTY EXPO CENTER & FAIRGROUNDS Market Demand Analysis Page 39
This discussion begins to lay the groundwork for some important issues that will likely affect the types of events that could be attracted to a redeveloped PCEC. The type, level of finish, configuration and amenities of the space offered in any potential redeveloped complex will play a strong role in determining the ability of the facility to attract and accommodate certain types of events. Survey Research and Findings The purpose of this section is to provide a summary of the survey research conducted with respect to a potential redeveloped PCEC. Specifically, at the outset of the study process, several focus group meetings were conducted in Porter County with a variety of local area individuals—some representing the Fair, some representing organizations with existing events held at the PCEC, some representing local business/community leaders, and some representing interested local citizens. Subsequent to these focus groups, detailed telephone interviews were completed with event planners representing key non-local event segments that could use a potential redeveloped multipurpose event complex in Porter County. This survey-based technique provides a detailed understanding of potential user needs, their willingness to use a potentially redeveloped PCEC, as well as overall perceptions of Porter County as a potential host community for their event(s). This research element focuses on potential “non-local” users of a redeveloped PCEC—those events that drive new visitation to the area and associated economic impact. In order to test the potential event market for a redeveloped PCEC, a detailed telephone survey was conducted with planners and organizers of state and regional equestrian, livestock and other animal related shows, producers of public/consumer shows, tradeshows, entertainment events, and other such events with a potential interest in the specific type of event space that would be offered within a new/redeveloped complex in Porter County. The survey resulted interviews with individual planners, representing more than 100 rotating events/shows. A primary objective of the survey was to ascertain the perceived interest of event organizers in using a potentially redeveloped PCEC for one or more future events. The events identified through the survey were analyzed in terms of potential for being held in Porter County and in terms of attributes unique to the individual events. The survey results produced information on the likelihood concerning targeted event planners rotating their event(s) to Porter County, as well as specific event characteristics of those events that represent the potential event markets.

FEASIBILITY ANALYSIS OF A REDEVELOPED PORTER COUNTY EXPO CENTER & FAIRGROUNDS Market Demand Analysis Page 40
Likelihood of Utilizing Redeveloped PCEC in Porter County State and regional organization event planners were asked to indicate the likelihood of their organization utilizing a redeveloped PCEC, assuming it meets the needs of their event(s). Responses are presented in Exhibit 5 and are segmented between organizations having indicated that they have utilized the PCEC in the past.
Exhibit 5 Likelihood of Utilizing a Redeveloped PCEC
The overall positive interest by respondents in rotating one or more events to Porter County if sufficient facility space existed is 79 percent. Specifically, 34 percent indicated their group would "definitely" hold an event in Porter County, 18 percent "likely," 27 percent "possibly," 14 percent "not likely," and 7 percent "definitely not." The strong positive response rate is partially due to the presence of events having utilized the PCEC in past years. Specifically, nearly 80 percent of respondents indicating a potential interest in utilizing event space at a redeveloped facility are current or past PCEC event space users. The large concentration of positive interest responses in the “possibly” category among potential new events to the Porter County market is typical in surveys of this nature. Based on other surveys that CSL has completed in recent years, Porter County’s response is characterized as moderate relative to interest noted in other comparable communities.
Source: CSL Equestrian, Livestock, and Event Promoter Survey, 2014.
18%
11%
0% 10% 20% 30% 40%
Definitely Not
Not Likely
Possibly
Likely
Definitely
Have used PCEC Have not used PCEC
34%
18%
27%
14%
7%
5%

FEASIBILITY ANALYSIS OF A REDEVELOPED PORTER COUNTY EXPO CENTER & FAIRGROUNDS Market Demand Analysis Page 41
Reasons for Not Choosing Porter County Event organizers indicating that they would not likely use a potentially redeveloped PCEC were asked to expand on their reasons. Based on survey results, reasons for not likely rotating to Porter County for a future event varied among respondents. A summary of the reasons that event organizers indicated for not choosing Porter County as a future destination are presented below.
• We have always hosted the event in the same location and would not consider moving.
• We have a good relationship with our existing facility and have no desire to relocate the event.
• The population likely to attend our event is located in central Indiana and would not drive that far north.
• We need a more centrally located facility in our region.
• Our primary attendee base is in southern and central Indiana, but we may be able to add a smaller show in the northern part of the state.
• We need members in the area to help coordinate and attend the event, but the majority of our members do not live in northern Indiana. This would make planning and gaining local support too difficult.
As shown, responses given by state and regional event producers as to why they would not choose to hold their event(s) in Porter County tend to revolve around the geographical location of Porter County and past tradition of hosting an event in a different venue. Facility Usage Characteristics Rotating events typically have specific preferences and/or requirements regarding the months in which their event can occur. Likewise, organization planners typically employ a particular rotational policy that allows the event to return to a specific location only after a certain period of time. Exhibit 6 presents the seasonality patterns for those events that represent the potential market demand for a redeveloped PCEC.

FEASIBILITY ANALYSIS OF A REDEVELOPED PORTER COUNTY EXPO CENTER & FAIRGROUNDS Market Demand Analysis Page 42
Exhibit 6
Event Seasonality at a Redeveloped PCEC
Of the 79 percent of interviewees responding with a positive interest toward utilizing a potentially redeveloped PCEC in Porter County, it was found that event seasonality tends to peak in May and June, with approximately 31 percent of respondents indicating the potential for hosting events during these months. In general, event space demand is strongest for indoor public/consumer show events in February, March and April, with outdoor equestrian/livestock event space demand increasing throughout the summer months. It was also found that the average number of days the facility would be used, per event, among those expressing a positive interest in Porter County is approximately 2.5 days. Exhibit 7 illustrates the distribution of average estimated move-in, move-out and event days indicated through the survey via interested respondents.
Note: Of those respondents with a positive interest in Porter County.Source: CSL Equestrian, Livestock, and Event Promoter Survey, 2014.
0%
5%
10%
15%
20%
25%
30%
35%
40%
45%
50%
Exhibit 7 Utilization at a Redeveloped PCEC
Move-In Days 0.7
Event Days 1.6
Move-Out Days 0.2
Note: Of those respondents with a positive interest in Porter County.Source: CSL Equestrian, Livestock, and Event Promoter Survey, 2014.

FEASIBILITY ANALYSIS OF A REDEVELOPED PORTER COUNTY EXPO CENTER & FAIRGROUNDS Market Demand Analysis Page 43
Lodging Requirements An important aspect in attracting non-local events is the availability of committable hotel rooms. The non-local event market share captured in any community cannot expand beyond what area hotels can accommodate. Since many non-local groups have specific requirements related to hotel room availability, survey respondents with a potential interest in a redeveloped PCEC were questioned regarding their group’s specific hotel requirements. Exhibit 8 presents a summary of peak night hotel room requirements by events representing the primary market for a redeveloped PCEC.
Exhibit 8 Hotel Rooms Needed to Accommodate
Attendees of Events at a Potentially Redeveloped PCEC
As shown, 90 percent of Porter County’s potential non-local event market requires approximately 200 hotel rooms or fewer, while approximately 75 percent of the potential market for a redeveloped PCEC event space requires fewer than 100 rooms on the peak night of the event. Based on the local market hotel analysis discussed earlier, the estimated 1,100 hotel rooms within the Porter County market would likely be sufficient to accommodate the majority of overnight demand by events with a potential interest in a redeveloped PCEC.
0
100
200
300
400
500
600
5% 10%
15%
20%
25%
30%
35%
40%
45%
50%
55%
60%
65%
70%
75%
80%
85%
90%
95%
100%
Average – 90Median – 50
Note: Of those respondents with a positive interest in Porter County.Source: CSL Equestrian, Livestock, and Event Promoter Survey, 2014.

FEASIBILITY ANALYSIS OF A REDEVELOPED PORTER COUNTY EXPO CENTER & FAIRGROUNDS Market Demand Analysis Page 44
Facility Space Requirements While conducting interviews with targeted state and regional organizations, those respondents expressing a positive interest in Porter County were asked how much multipurpose/exhibit event space is required to accommodate their event. Responses are summarized in Exhibit 9.
Exhibit 9 Multipurpose Event Space Needed at a
Redeveloped PCEC
As shown, of the potential market for events requiring multipurpose event space in Porter County, the average amount of multipurpose/exhibit event space required approximates 26,500 square feet, with 90 percent of Porter County’s market requiring approximately 40,000 square feet of space or less. Approximately 80 percent of Porter County’s potential market can be accommodated within 30,000 square feet of multipurpose event space or less.
0
30,000
60,000
90,000
120,000
150,000
5% 10%
15%
20%
25%
30%
35%
40%
45%
50%
55%
60%
65%
70%
75%
80%
85%
90%
95%
100%
Average – 26,500Median – 12,000
Note: Of those respondents with a positive interest in Porter County. Average only includes those events indicating a need for exhibit space.Source: CSL Equestrian, Livestock, and Event Promoter Survey, 2014.

FEASIBILITY ANALYSIS OF A REDEVELOPED PORTER COUNTY EXPO CENTER & FAIRGROUNDS Market Demand Analysis Page 45
Attendance Event planners were asked to estimate the average delegate/participant attendance levels for their event(s). These figures exclude spouses and guests of the event’s delegates. Responses are summarized in Exhibit 10.
Exhibit 10 Average Attendance at a
Redeveloped PCEC
As shown, the average state and regional organization with a potential interest in Porter County attracts approximately 260 participants. Approximately 90 percent of the potential event market for Porter County consists of events attracting 500 attendees or fewer. Such data with regard to attendance levels will be an important factor in later determining the amount of economic impact potentially generated by a redeveloped PCEC.
0
200
400
600
800
1,000
1,200
1,400
5% 10%
15%
20%
25%
30%
35%
40%
45%
50%
55%
60%
65%
70%
75%
80%
85%
90%
95%
100%
Average – 260Median – 150
Note: Of those respondents with a positive interest in Porter County.Source: CSL Equestrian, Livestock, and Event Promoter Survey, 2014.

FEASIBILITY ANALYSIS OF A REDEVELOPED PORTER COUNTY EXPO CENTER & FAIRGROUNDS Market Demand Analysis Page 46
Event Segment Market Demand Summary The market demand analysis conducted suggests that a new or expanded/improved PCEC in Porter County could not only retain a significant number of events currently held at the existing PCEC, but attract a measurable level of new events to the Porter County area. Moderate demand was noted from a variety of state and regional equestrian, livestock and other animal related shows and public/consumer shows representing the most likely users of such redeveloped facility space. While these market segments represent the greatest potential for growth with a redeveloped PCEC, segments such as conventions/conferences (from a local perspective), concerts, sporting events and other such events also may provide some incremental demand for redesigned event space. Specific observations regarding individual event segments are summarized below:
Equine, Livestock, and Other Animal Show Event Space Demand The general consensus among survey respondents was favorable in regard to the geographic location of the PCEC. There are limited equestrian and livestock facilities in the northwest Indiana region, especially with respect to covered arenas. The accessibility to the Chicago market and the close proximity to major interstates were also seen as advantageous factors for the location of the facility. Competition-based events of this type typically require dirt floor space, housing for animals, and significant parking for large trailers. Over 80 percent of equestrian and livestock show producers surveyed indicated a need for at least a covered show arena, in addition to an outdoor warm-up ring. An average of 100-150 stalls are needed, but respondents recommended the PCEC also incorporate space for additional temporary stalls to be assembled if necessary. This would allow larger events to be attracted while reducing the initial financial investment. Respondents also expressed interest in the facility offering hay and shavings on-site. Not only is this a convenience for exhibitors, but also a revenue generator for the facility. Public/Consumer Show Event Space Demand Consumer and public shows are exhibit-based shows that are typically open to the general public and draw from the local area. These events tend to charge a nominal fee for entry and generally include events such as home and garden shows, boat shows, auto shows, gun shows, antique shows, career fairs, and other such exhibitions/expositions. The driving factors concerning site selection for most public/consumer show producers are normally proximity to large concentrations of population (from which to draw attendees) and an un-served market opportunity within the industry segment/focus of their show. Consumer/public show producers tend to size shows based on the space available in the community they wish to serve. Based on interviews with state/regional show producers accounting for over 30 annual events, approximately 80 percent indicated a positive response to a redeveloped facility in Porter County. To accommodate nearly 80 percent of those with interest in Porter County, the PCEC would need to offer roughly 30,000 square feet of exhibit space. Exhibit space of this size would accommodate events attracting up to nearly 1,500 attendees. To accommodate an additional 10 percent of interested event promoters, 40,000 square feet of exhibit space is necessary. With 40,000 square feet available, it is estimated that events attracting up to 3,200 attendees could be accommodated.

FEASIBILITY ANALYSIS OF A REDEVELOPED PORTER COUNTY EXPO CENTER & FAIRGROUNDS Market Demand Analysis Page 47
In most cases, a concrete floor exhibit hall would be required to host these events; however, some dirt facilities can accommodate some shows with hardening/compacting the surface and laying carpet or utilizing a portable hard surface system. Conventions, Tradeshows, Meetings, Banquets, and Other Space Demand Conventions and conferences are typically rotating events held by professional associations and SMERF (social, military, educational, religious, fraternal) groups. Most events have exhibit, food function, general assembly and breakout activities. Tradeshows are normally private exhibit-oriented events focusing on a particular industry trade or sector. They can be produced by large corporations or private event production organizations. More than half of recurring tradeshows rotate among destinations rather than remaining fixed year-after-year in a single location/facility. As both of these event types are attended predominantly by non-local attendees and exhibitors, quality hotel inventory nearby the event facility is typically a critical factor in site selection. Additionally, destination appeal, visitor amenities and the quality of the event facility (in terms of providing upscale exhibit space and carpeted ballroom and meeting space) are also generally very important to these events. As such, Porter County has limitations in its existing meeting facilities, both in terms of quality and quantity of space offered. The lack of an adjacent headquarters hotel also limits PCEC’s ability to accommodate such demand. Multipurpose event venues also often accommodate a variety of other locally-based and attended events, including meetings, banquets and other miscellaneous events. These events tend to be small, single or partial-day events that are predominately attended by local area residents. Oftentimes, they can be hosted in small banquet, breakout or multipurpose rooms (with concrete, carpeted or multipurpose flooring). These events can be important in driving facility utilization and resulting operating revenue in some facilities. Additionally, multipurpose event venues have the potential to accommodate tournaments, meets, competitions and other such amateur and recreational sporting events. This demand was largely measured as part of a separate, simultaneous report conducted by CSL under a separate cover. As part of this research, it was largely concluded that existing Porter County indoor amateur sports facilities can accommodate a significant portion of the potential demand of this event segment. However, there may be opportunities to partner with these existing local facilities to attract larger amateur sporting events and/or grow the size of events currently held within these facilities by utilizing a substantial amount of contiguous flat-floor event space at a redeveloped PCEC.

FEASIBILITY ANALYSIS OF A REDEVELOPED PORTER COUNTY EXPO CENTER & FAIRGROUNDS Market Demand Analysis Page 48
Conclusions The analysis suggests that the location of the existing PCEC is generally viewed favorably, as it is centrally located within the county offering easy access to residents both in the northern and southern parts of the county as well as easy access to the state, region and, importantly, the greater Chicago market from which to draw potential event attendees and/or participants. The analysis indicates market support for a moderately larger and improved PCEC. The market analysis suggests that event and attendance levels for exhibitions, equestrian, entertainment, meetings and Fair events could be grown with a larger and improved PCEC. However, demand is believed to be low for traditional rotating conventions, conferences and tradeshows, given the nature of potentially redeveloped PCEC facilities and presence of more suitable event facilities within Porter County. As the estimated market supportable PCEC program could build upon, and leverage, existing PCEC facilities and fit within the current site, it is believed the existing PCEC and site infrastructure provides a solid foundation from which to develop incremental event and market capture. Therefore, a redeveloped PCEC would be best supported at the current location. As will be detailed further in the subsequent chapter, key areas of PCEC physical product additions include the following: (1) exhibition space; (2) covered arena; (3) horse stalls; (4) RV hookups; and (5) other. While there are no nearby hotel properties near the existing PCEC site, fairgrounds/expo center complexes often do not have attached or adjacent hotel properties. The nature of these types of complexes, coupled with the rural nature of many of their host locations, do not place industry expectations on direct and adjacent hotel support for these projects in the same way that they do for “convention centers” and “conference centers”. The relatively sparse population, lack of corporate density, and direct interstate access proximate to the PCEC site suggests that a new sizeable, quality hotel development would not likely be forthcoming without substantial public sector funding incentive. Beyond this evaluation of market demand, it is important to note that project “feasibility” is often a function of weighing the costs and benefits associated with developing and operating a facility. There are many reasons why communities invest in event facilities. These reasons include providing a community gathering place for local citizens, increasing visitation levels and exposure of the local community, ancillary economic development generation, quality of life enhancement and other issues. In this regard, important aspects to consider when determining project feasibility also include the following:
• The County will require facilities capable of hosting the Porter County Fair if the annual event is to continue operations within Porter County.
• Choosing not to redevelop event facilities capable of accommodating the event space demand met by the existing PCEC may result in the loss and/or erosion of an important portion of the 200-plus annual events held at the PCEC.
• PCEC facilities are widely considered a community benefit as an affordable option for hosting public assembly events.
• A new indoor Exhibition Center at the PCEC could also be positioned to capture market demand relative to indoor sports and recreation, assuming appropriate portable equipment is purchased and associated storage is added. This would importantly offer additional capacity in the County to accommodate certain types of non-local tournaments/competitions (e.g., basketball, volleyball, wrestling, gymnastics, cheer/dance, etc.) and local sports/recreation, without requiring the development of a “dedicated” indoor sports facility.

FEASIBILITY ANALYSIS OF A REDEVELOPED PORTER COUNTY EXPO CENTER & FAIRGROUNDS Development Options and Conceptual Renderings Page 49
6. Development Options and Conceptual Renderings Based on the results of the analysis of local market conditions, competitive/comparable facilities and host communities and market demand, the purpose of this chapter is to outline identified development options pursuant to industry best practices and the estimated market supportable building program for a redeveloped PCEC in Porter County. Development Options In addition to protecting existing business, it is believed that event levels, attendance and economic impact could grow under a redevelopment of the PCEC through a targeted master plan of expansion and improvement. The recommended building program presented herein is based on our team’s understanding of industry best practices, market analysis results, and discussions with the Porter County Fair, County officials, past users and industry participants, and a survey of event promoters/planners. Recommended improvements would be expected to increase event and attendance levels for exhibitions, equestrian, livestock, entertainment, meeting, Fair-related and other events. Presented below, Exhibit 1 outlines an overview of a recommended Master Plan for PCEC expansion and improvement.
Exhibit 1 Master Plan Recommendations

FEASIBILITY ANALYSIS OF A REDEVELOPED PORTER COUNTY EXPO CENTER & FAIRGROUNDS Development Options and Conceptual Renderings Page 50
As shown, the Master Plan recommendations are segmented into four general categories:
• Market Demand Recommendations – These are additions and improvements identified in the feasibility analysis and for which there is a direct market, financial and/or economic opportunity.
• New Construction – These projects are recommended to improve the overall functionality of the complex, marketability and appearance.
• Renovations – With the exception noted below, it is recommended that all remaining buildings be renovated. They are the existing Expo Center, Buggy Wheel Pavilion, restroom, support buildings and the site.
• Renovations/ New Construction – The 4H and Expo East could either be renovated or replaced depending on the demand for their use during the Fair and non-fair periods with the development of the market demand and new construction recommendations.
Importantly, while the existing site is projected to be able to support the recommended improvements, should additional adjacent parcels of land not be acquired, parking challenges for a limited number of events may be exacerbated. Market Demand Recommendations Based on the analysis conducted and outlined herein, the following additions and improvements to the PCEC complex would be considered market supportable:
• Expo Center Exhibition Addition – Recommended addition of approximately 35,000 square feet of contiguous exhibition space, divisible into two separable halls and connected to the existing Expo entry foyer. Addition of approximately 5,000 square feet of pre-function space, including restrooms, concession area and an entrance. Facility should be fully climate controlled. Pavement of the existing grass parking lot east of the drive is recommended to replace parking lost by the addition’s location. It is also recommended that the tower element and the existing building be re-themed / re-clad for consistency. Exhibit 2, on the following page, presents a conceptualized rendering of the Expo Center Addition.
• Covered Arena, Expanded Warm-up Arena – Construction of a cover for the existing dirt ring in the northeast corner of the complex. Open-sided design with lights undercover or skylights and large blade fans to maintain comfortable temperature levels during the summer. Further, it is recommended that the warm-up area be expanded to a size commensurate with that of the primary show ring.
• Stall Barn with Covered Connector – Development of a new 43,000 gross-square foot horse barn offering approximately 200 10’x10’ stalls, washracks, restrooms and a show office. Importantly, a covered connector should be constructed to provide access to the warm-up and/or show ring. Exhibit 3, on the following page, presents a view of the recommended improvements to the arena, warm-up area and stall barn.
• RV Park – Expansion and renovation of the RV Park to 125 full service (water, sanitary sewer and electrical) connections are recommended for use for both the Fair and as a desirable component of a robust equine program and to accommodate Expo Center users and other travelers.

FEASIBILITY ANALYSIS OF A REDEVELOPED PORTER COUNTY EXPO CENTER & FAIRGROUNDS Development Options and Conceptual Renderings Page 51
Exhibit 2 View of Expo Center Addition
Exhibit 3 View of Covered Arena, Expanded Warm-up Arena, Stall Barn and Covered Connector

FEASIBILITY ANALYSIS OF A REDEVELOPED PORTER COUNTY EXPO CENTER & FAIRGROUNDS Development Options and Conceptual Renderings Page 52
Based on the analysis conducted, these elements would address each of the primary areas of market demand believed to exist with regard to a new/redeveloped event space in Porter County. The redeveloped Complex would offer a more “complete”, efficient and attractive complex, thereby making it more competitive in attracting a variety of state, regional and select national events. Further, by covering the existing arena, expanding the warm-up arena, and constructing a 200-stall barn with a covered hallway connecting the three facilities, the midsized equestrian market demand should be fulfilled. As the PCEC establishes its name as an equestrian facility, consideration should be given to covering the warm-up arena as well. New Construction Recommendations In addition to the market supportable recommendations, optional program elements should be given consideration to address overall best practices of a state-of-the-industry fairgrounds facility. Examples of these best practices include:
• Development of a well-balanced Fair with respect to the breadth of activities offered; • Well-maintained buildings and grounds; • A separation of Fair-goers and service provision space; • A clearly defined and easily navigated pedestrian circulation path; • A County market penetration rate approximating 50 percent; • Spreading attendance over the duration to levels commensurate with the following:
o Approximately 20,000 to 30,000 on the peak day of the Fair; and o Approximately 17,000 in-ground (that is, on the grounds at one given time) peak.
• Adequate planning and preparation to allow for future growth potential through adequate levels and diversity of programmable event space and sufficient parking.
In order to accommodate these best practices and to improve the PCEC’s overall functionality, marketability and appearance, the following New Construction projects are recommended:
• New Gates – Currently, there are no permanent gates/portals providing controlled access to the PCEC complex. Development of two new gates is recommended, including a West Gate adjacent to the Expo Center and a South Gate at the Grandstand. These will facilitate ticket taking for Fair and other on-ground events and emphasize specific points of entry to the complex. Exhibit 4, on the following page, presents an image of the proposed new West Gate.
• Livestock Arena and Pavilion – Rebuilding the livestock barn and arena to state-of-the-industry facilities would increase their operational capacities and maximize utilization for both Fair and non-Fair related events. This flexibility could provide an opportunity to utilize this space to accommodate temporary stalls for equestrian shows requiring stall facilities in excess of the permanent stalling facilities available.
• Covered Grandstand and Stage – Covering the seating and stage would have the intended effect of extending the Grandstand’s use for events outside of the Fair and potentially increase Fair concert attendance by providing protection from the elements. Exhibit 5, on the following page, presents a view of the recommended improvements to the arena, warm-up area, stalling facility and the covered grandstand.
• Fair Office – Development of a permanent office facility for use by the Fair Board. This could potentially offer the added benefit of providing space for non-Fair 4H activities. It is tentatively located adjacent to the main parking lot.

FEASIBILITY ANALYSIS OF A REDEVELOPED PORTER COUNTY EXPO CENTER & FAIRGROUNDS Development Options and Conceptual Renderings Page 53
Exhibit 4 View of West Entry Gate and Promenade
Exhibit 5
View of the Equine Center and Grandstand

FEASIBILITY ANALYSIS OF A REDEVELOPED PORTER COUNTY EXPO CENTER & FAIRGROUNDS Development Options and Conceptual Renderings Page 54
Renovation Recommendations
With the exception noted below, it is recommended that all remaining buildings be renovated. They are the existing Expo Center, Buggy Wheel Pavilion, restroom, support buildings and the site. Renovations/New Construction Recommendations
The 4H Building and Expo East have the option to either renovate or be replaced entirely. The decision to renovate or replace will be dependent on the demand for each building during the construction of the new exhibition hall. Exhibit 6 presents an aerial view of the redeveloped Fairgrounds, including all of the recommendations proposed above.
Exhibit 6 Aerial View of Redeveloped Porter County Fairgrounds

FEASIBILITY ANALYSIS OF A REDEVELOPED PORTER COUNTY EXPO CENTER & FAIRGROUNDS Development Options and Conceptual Renderings Page 55
Estimated Order-of-Magnitude Costs To provide an understanding of potential costs associated with a redeveloped PCEC and Fairgrounds complex, an analysis was conducted of order-of-magnitude construction costs pursuant to the various development options outlined within this chapter. The following projections are based on similar projects conducted by Populous, historic data, industry standards and allowances. These construction costs are estimated and the actual costs may vary. Costs have been broken down by the program categories. Costs Related to Market Demand Recommendations
• Expo Center Addition: 40,000 gross square feet: $8.5 million Details 35,000 square feet of exhibition space divisible into 2 halls Clear span 5,000 square feet of pre-function including restrooms, concessions and entrance Conditioned: Heated and air-conditioned New Parking Lot
• Covered Horse Arena: 52,000 gross square feet: $3.0 million
Details Open sided Lighted / Skylights Large Blade Fans
• New Horse Barn: 43,000 gross square feet: $2.8 million
Details 200 - 10’x10’ stalls Wash racks/Restrooms/Show Office
• RV Hookups: 125 Upgrades: $1.2 million
Total project costs for the recommendations supported by market demand are $15.5 million, including A/E fees and contingences. Specifically, the Expo Center exhibition hall addition is estimated to cost $8.5 million, improvements to the arena are estimated at $3.0 million, construction of a new horse barn is projected to cost $2.8 million and improvements to the RV park would cost an estimated $1.2 million. Costs Related to New Construction Recommendations
• Arena: 37,000 gross square feet : $4.0 million Details Enclosed w/ Overhead Doors Clear span Heated/Power Vented/Large Blade Fans
• Livestock Pavilion: 26,000 gross square feet: $2.3 million
Details Enclosed w/ Overhead Doors Heated/Power Vented/Large Blade Fans

FEASIBILITY ANALYSIS OF A REDEVELOPED PORTER COUNTY EXPO CENTER & FAIRGROUNDS Development Options and Conceptual Renderings Page 56
• Covered Grandstand and Stage: 22,000 gross square feet: $1.0 million
Details Lighting
• Entry Gates and Grandstand Portal: $700,000
Details Two (2) Entry Gates @ $300,000 Allowance One (1) Portal @ $100,000 Allowance
• Fair Office: not included in cost estimate Total project costs related to the new construction recommendations outlined are estimated at $8.0 million. Specifically, new construction of the livestock arena is estimated at $4.0 million, the Livestock Pavilion reconstruction is projected at $2.3 million, covering the grandstand is estimated to cost $1.0 million and the addition of two entry gates would cost approximately $700,000. Costs Related to Renovation Recommendations
• Expo Center: 21,000 gross square feet: $1.0 million Details Reclad Redesign Tower Miscellaneous Capital Maintenance
• Buggy Wheel Pavilion: 6,000 gross square feet: $200,000
Details Miscellaneous Capital Maintenance
• Restroom and Support Buildings: 5,000 gross square feet: $200,000 Details Miscellaneous Capital Maintenance
• Site: Developed Site: 28 acres: $1.4 million (allowance)
Remaining Site: 56 acres: $500,000 (allowance) Details General Paving, Site Electrical, Drainage, Landscape, etc.
Total project costs related to renovation recommendations are estimated at $3.3 million, including approximately $1.0 million for renovations to the Expo Center, $200,000 for improvements to the Buggy Wheel Pavilion, $200,000 for support building renovations, and $1.9 million for site improvements.

FEASIBILITY ANALYSIS OF A REDEVELOPED PORTER COUNTY EXPO CENTER & FAIRGROUNDS Development Options and Conceptual Renderings Page 57
Costs Related to Renovations/New Construction Recommendations
• East Annex, Connector and 4H: 26,000 gross square feet: $1.3 million (renovation) Details High Capital Maintenance
• East Annex and 4H New: 26,000 gross square feet: $3.2 million (new construction) Details Clear span Offices and Support
Total project costs related to the renovations/new construction recommendations outlined are estimated at $1.3 million if the decision is made to renovate the East Annex or $3.2 million if a new East Annex and 4H Building are constructed. As a final option, given that the Expo Center will offer a significant level of high-ceiling, clear-span concrete floor square footage, it is believed that an important opportunity exists to attract new indoor sports tournaments to the County should an investment be made in sports flooring and equipment (including state-of-the-industry hardwood and/or Sport Court-type flooring, along with related equipment and appropriate storage facilities). Specifically, this equipment could include:
• Portable hardwood and/or multipurpose Sport Court-type flooring • Portable basketball goals • Portable scoreboards • Portable seating • Portable volleyball net system • Players’ chairs • Scoring tables • Miscellaneous equipment, including mops/sweeps, water coolers, rolling racks, basketballs,
volleyballs, extension cords, equipment dollies, portable dividing screens, etc. This flooring and equipment could be made available to tournaments and installed in the Expo Center either during specific periods or on a case-by-case basis. Importantly, the purchase of more costly competition-quality, portable hardwood flooring (relative to multipurpose Sport Court-type surfaces) can allow for the attraction/accommodation of higher competitive tiers and older age groups of basketball tournaments; however, this type of flooring is typically more expensive than other types of playing surfaces and needs to be stored in climate-controlled facilities. Total Costs Related to Recommendations Total costs related to the outlined recommendations are expected to approximate $28.1 million to $30.0 million, including approximately $15.5 million associated with the Market Demand recommendations, $8.0 million associated with the new construction recommendations, $3.3 million for renovation recommendations and $1.3 or $3.2 million depending on whether it is determined to renovate or reconstruct, respectively, the East Annex and 4H Building. Total costs related to the optional purchase of sports/recreation-related equipment and associated storage (sized for the potential new Expo Center space) could range between $700,000 and $3.0 million, depending on the type and quality of equipment purchased.

FEASIBILITY ANALYSIS OF A REDEVELOPED PORTER COUNTY EXPO CENTER AND FAIRGROUNDS Cost/Benefit Analysis Page 58
7. Cost/Benefit Analysis Based on the results of the market demand analysis, estimates relating to utilization, attendance, economic impacts, and financial operating characteristics of a redeveloped PCEC were developed. A comparison of the key benefits (quantifiable economic impacts and non-quantifiable benefits) relative to key costs (construction/upfront costs and ongoing operating cost impacts) of a potential County investment in PCEC redevelopment is expected to be critical to evaluating the opportunity. Economic Impact Concepts The ability of a public assembly facility, like the PCEC, to generate new spending and associated economic impacts in a community is often one of the primary determinants regarding a decision to invest in the development and operation of such a facility. Beyond generating new visitation and associated spending in local communities, expo centers and fairgrounds also benefit a community in other important ways, such as providing a venue for annual fairs and other events and activities attended by community members. The purpose of this section is to provide an analysis of the economic impacts that are generated by the existing PCEC and for the redevelopment Master Plan (outlined in the previous chapter) based on key assumptions described herein. For the purposes of this cost/benefit analysis, the full renovation/new construction master plan of constituent elements relating to $28 million to $30 million in total order-of-magnitude project costs have been assumed. The annual operations of an expo center and fairgrounds complex typically provide significant benefits to an area. Typically, and for purposes of this report, quantifiable effects are characterized in terms of economic impacts. Economic impacts are conveyed through measures of direct spending, total output, personal earnings and employment. The impact of an expo center and fairgrounds complex is maximized when out-of-town attendees, exhibitors and/or attendee guests spend money in a community while attending a complex event. This spending by out-of-town attendees represents new money to the community hosting the event. This new money then creates multiplier effects as the initial spending is circulated throughout the local economy. It is important to note that spending estimates associated with the PCEC only represent spending that is estimated to be new to the community (net new spending), directly attributable to the operation (and existence) of the PCEC. The analysis does not consider any assumed displaced spending within the community. For purposes of this analysis, “community” is referring to Porter County. The characteristics of economic impact effects are generally discussed in terms of their direct, indirect and induced effects on the area economy:
• Direct effects consist principally of initial purchases made by attendees/participants/exhibitors at an event who have arrived from out-of-town. This spending typically takes place in local hotels, restaurants, retail establishments and other such businesses. An example of direct spending is when an out-of-town event attendee pays a local hotel for overnight lodging accommodations.

FEASIBILITY ANALYSIS OF A REDEVELOPED PORTER COUNTY EXPO CENTER AND FAIRGROUNDS Cost/Benefit Analysis Page 59
• Indirect effects consist of the re-spending of the initial or direct expenditures. An example of indirect spending is when a restaurant purchases additional food and dining supplies as a result of new dining expenditures through increased patronage. A certain portion of these incremental supply expenditures occurs within the local community (i.e., “indirect spending,” the type of which is quantified under this analysis), while another portion leaves the local economy (i.e., “leakage”).
• Induced effects consist of the positive changes in employment, earnings and tax collections generated by changes in population associated with the direct and indirect expenditures.
The re-spending of dollars in an economy is estimated by using economic multipliers and applying them to the amount of direct, or initial spending. The multiplier effect is estimated in this analysis using a regional economic forecasting model provided by the IMPLAN Group, Inc., a private economic modeling company. The IMPLAN system uses an input-output matrix with specific data for multipliers based on regional business patterns from across the country. Financial information for the matrix of multipliers is collected from various sources that include, but are not limited to, the U.S. Department of Labor, as well as state sales and tax reports. The system uses this data to determine the economic independence of specific geographic regions as well as the interdependence that exists between industries in those regions. The systems provide total industry output, personal earnings and employment data for approximately 520 industry groups. For purposes of this analysis, results of the economic impact analyses are measured in terms of the following categories:
• Total output represents the total direct, indirect and induced spending effects generated by the project. This calculation measures the total dollar change in output that occurs in the local economy for each dollar of output delivered to final demand.
• Personal earnings represents the wages and salaries earned by employees of businesses associated with or impacted by the project. In other words, the multiplier measures the total dollar change in earnings of households employed by the affected industries for each additional dollar of output delivered to final demand.
• Employment represents the number of full- and part-time jobs. The employment multiplier measures the total change in the number of jobs in the local economy for each additional $1.0 million of output delivered to final demand.
The initial spending of new dollars into an economy begins a series in which the dollars are cycled through the economy. The re-spending of the dollars is estimated by using the economic multipliers discussed above and applying them to the amount of direct, or initial, spending. The multiplier illustrates that spending in a defined economy will lead to additional spending until that dollar has completed its cycle through leakage. Leakage represents the portion of a dollar spent in areas outside the designated economy.

FEASIBILITY ANALYSIS OF A REDEVELOPED PORTER COUNTY EXPO CENTER AND FAIRGROUNDS Cost/Benefit Analysis Page 60
Analysis of Quantifiable Economic Impacts As an initial step in the analysis of economic impacts, annual event levels were estimated for a redeveloped PCEC. Additionally, estimates are also provided throughout this analysis regarding the existing PCEC. The figures projected under the Redeveloped Expo Center/Fairgrounds heading represent annual figures “upon stabilization”, which would represent a case several years after construction completion and initiation of operations. Exhibit 1 presents a summary of the estimated annual number of events for a redeveloped Porter County complex during a stabilized year of operations (assumed to occur by the fourth full year of operations). For purposes of this analysis, the below estimates do not include new indoor sports and recreation uses that could materialize should quality sports/recreation equipment be purchased consistent with that outlined in the previous chapter. Events/uses of this nature would largely be incremental relative to the event and utilization levels outlined below and on the subsequent pages.
Exhibit 1
Estimated Annual Number of Events for the Existing PCEC and a Redeveloped PCEC (stabilized year of operations)
As shown, a redeveloped PCEC is estimated to annually accommodate 348 events. Increased use by meetings and banquets and well as equestrian shows, account for over half of the incremental event activity. Specifically, improvements to the arena, warm-up arena and stalling facilities are expected to generate 34 incremental equestrian, livestock/agricultural and other animal events. Further, improvements to the indoor meeting and event space would be expected to attract 14 additional public/consumer shows, 32 additional meetings/banquets and six additional entertainment-related events. In total, a redeveloped complex would be projected to attract 66 incremental events over current PCEC operational levels.
Current RedevelopedExpo Center/ Expo Center/
Event Type Fairgrounds Fairgrounds Incremental
Fair 1 1 0Equestrian 17 35 18Livestock/Ag 6 12 6Other Animal 35 45 10Public/Consumer 46 60 14Meetings/Banquets 88 120 32Entertainment 19 25 6Other 70 50 (20)
Total 282 348 66

FEASIBILITY ANALYSIS OF A REDEVELOPED PORTER COUNTY EXPO CENTER AND FAIRGROUNDS Cost/Benefit Analysis Page 61
Event days generated at a potential redeveloped PCEC are projected by type of event in Exhibit 2.
Exhibit 2 Estimated Annual Number of Event Days for the Existing PCEC and a Redeveloped PCEC
(stabilized year of operations)
As shown, as a result of improvements to the PCEC, it is projected that the incremental event activity would produce an estimated 123 additional event days. The largest increase in event day activity would come from added equestrian events (45 additional event days), public/consumer show events (33 additional event days) and meetings/banquets (32 additional event days). Exhibit 3 presents the resulting level of annual attendance, by event type, for a redeveloped PCEC, as compared to estimated current levels.
Exhibit 3 Estimated Annual Attendance for the Existing PCEC and a Redeveloped PCEC
(stabilized year of operations)
Current RedevelopedExpo Center/ Expo Center/
Event Type Fairgrounds Fairgrounds Incremental
Fair 10 10 0Equestrian 26 70 45Livestock/Ag 8 24 16Other Animal 39 50 11Public/Consumer 69 102 33Meetings/Banquets 88 120 32Entertainment 19 25 6Other 70 50 (20)
Total 328 451 123
Current RedevelopedExpo Center/ Expo Center/
Event Type Fairgrounds Fairgrounds Incremental
Fair 100,000 150,000 50,000Equestrian 3,188 17,500 14,313Livestock/Ag 1,170 4,200 3,030Other Animal 1,925 2,475 550Public/Consumer 34,500 76,500 42,000Meetings/Banquets 8,800 15,000 6,200Entertainment 3,800 10,000 6,200Other 10,500 12,500 2,000
Total 163,883 288,175 124,293

FEASIBILITY ANALYSIS OF A REDEVELOPED PORTER COUNTY EXPO CENTER AND FAIRGROUNDS Cost/Benefit Analysis Page 62
Annual attendance at a redeveloped PCEC would be projected to nearly double that of the current PCEC’s annual attendance. Specifically, attendance at the annual Porter County Fair would be projected to increase by approximately 50,000, while public/consumer show attendance is projected to increase by 42,000 as a result of the facility-wide improvements. In order to project direct spending related to PCEC activity it is necessary to estimate the number of non-local event attendees/participants/exhibitors that could be attracted to Porter County. Exhibit 4 presents the estimated annual non-local attendance attracted by type of event. These projections will then help estimate the direct spending and overall economic impact generated by a redeveloped PCEC.
Exhibit 4 Estimated Annual Non-Local Attendance for the Existing PCEC and a Redeveloped PCEC
(stabilized year of operations)
As displayed, annual non-local attendance under a redeveloped PCEC is estimated to nearly double over existing levels, with significant increases within the public/consumer show category, largely due to the significant assumed expansion of high-quality exhibition space square footage. Equestrian shows are also estimated to realize a significant growth in non-local attendance, due to significant improvements/attractiveness of facility/complex capabilities, functionality and marketability.
Current RedevelopedExpo Center/ Expo Center/
Event Type Fairgrounds Fairgrounds Incremental
Fair 30,000 45,000 15,000Equestrian 1,275 10,500 9,225Livestock/Ag 351 2,520 2,169Other Animal 578 990 413Public/Consumer 8,625 19,125 10,500Meetings/Banquets 1,760 3,000 1,240Entertainment 1,140 3,000 1,860Other 2,100 2,500 400
Total 45,829 86,635 40,807

FEASIBILITY ANALYSIS OF A REDEVELOPED PORTER COUNTY EXPO CENTER AND FAIRGROUNDS Cost/Benefit Analysis Page 63
The estimates of average daily spending on a per person basis were applied to estimates of potential future event activity at the potential redeveloped PCEC, based on the results of the overall market analysis. Adjustments were applied to estimated attendance levels for potential future event activity at the complex to segregate estimated levels of potential out-of-town event attendance directly as a result of the redeveloped PCEC. As is typical with nearly all multipurpose event complexes that focus on attracting horse and other dirt-oriented events, reductions have been made with regard to average daily spending assumptions to reflect a significant percentage of complex participants that do not require lodging facilities (i.e., stay in RVs or represent “day-trippers”). Exhibit 5 presents the estimated annual direct spending associated with non-local attendees (spectators, participants, and exhibitors) for a potential redeveloped PCEC in 2014 dollars and upon stabilization of operations (assumed to occur by the fourth full year of operations).
Exhibit 5 Estimated Annual Direct Spending Associated with the Existing PCEC and a Redeveloped PCEC
(stabilized year of operations, in 2014 dollars)
As shown, it is estimated that the existing PCEC generates approximately $4.2 million in annual direct spending as a result of events held at the complex. Upon stabilization, it is projected that a redeveloped PCEC would generate nearly $8.2 million per annum in direct spending within Porter County, or approximately $4.0 million in incremental annual direct spending. The total estimated direct expenditures generate effects on the economy that extend beyond the initial expenditures. As the direct spending flows throughout the local area economies, additional rounds of spending, employment and earnings are generated.
Current RedevelopedExpo Center/ Expo Center/
Event Type Fairgrounds Fairgrounds Incremental
Fair $2,700,000 $4,050,000 $1,350,000Equestrian 159,375 1,312,500 1,153,125Livestock/Ag 43,875 315,000 271,125Other Animal 72,188 123,750 51,563Public/Consumer 646,875 1,434,375 787,500Meetings/Banquets 220,000 375,000 155,000Entertainment 125,400 330,000 204,600Other 252,000 300,000 48,000
Total $4,219,713 $8,240,625 $4,020,913

FEASIBILITY ANALYSIS OF A REDEVELOPED PORTER COUNTY EXPO CENTER AND FAIRGROUNDS Cost/Benefit Analysis Page 64
Exhibit 6 considers direct, indirect and induced spending to estimate the overall economic impact generated in Porter County by both the existing PCEC and that estimated for a redeveloped PCEC pursuant to the market indicated master plan outlined in a previous chapter.
Exhibit 6 Estimated Annual Economic Impacts Associated with the Existing PCEC and a Redeveloped PCEC
(stabilized year of operations, in 2014 dollars)
As shown above, it is estimated that a redeveloped PCEC would generate approximately $13.8 million in total economic output (direct, indirect, and induced spending), supporting approximately $6.7 million in personal earnings and 172 full- and part-time jobs throughout the Porter County economy. Relative to existing PCEC levels, a redeveloped PCEC would incrementally generate an estimated $6.7 million in annual economic impact (direct, indirect and induced visitor spending) in Porter County, supporting approximately 84 full and part-time jobs throughout the local economy and nearly $3.3 million in personal earnings (income). This analysis does not consider “lost” economic impact that would be expected in the future, should no redevelopment or significant improvements be undertaken with respect to the PCEC.
Current RedevelopedExpo Center/ Expo Center/Fairgrounds Fairgrounds Incremental
Total Hotel Room Nights 6,605 14,353 7,749
Direct SpendingHotel $843,943 $1,648,125 $804,183RestaurantMeals 1,856,674 3,625,875 1,769,202Entertainment/Leisure 548,563 1,071,281 522,719Retail/Shopping 717,351 1,400,906 683,555Other 253,183 494,438 241,255 Total $4,219,713 $8,240,625 $4,020,913
Indirect/Induced Spending $2,839,867 $5,545,941 $2,706,074
Total Output $7,059,579 $13,786,566 $6,726,987
Personal Earnings $3,417,967 $6,674,906 $3,256,939
Employment 88 172 84 (full & part-time jobs)

FEASIBILITY ANALYSIS OF A REDEVELOPED PORTER COUNTY EXPO CENTER AND FAIRGROUNDS Cost/Benefit Analysis Page 65
Cost Analysis This presentation is designed to assist project representatives in estimating the cost/benefit attributes of a potential redeveloped PCEC and cannot be considered to be a presentation of expected future results. Accordingly, this analysis may not be useful for any other purpose. The assumptions disclosed herein are not all inclusive, but are those deemed to be significant; however, there will be differences between estimated and actual results, because events and circumstances frequently do not occur as expected, and these differences may be material. Based on the analysis and key assumptions outlined within this report, Exhibit 7 presents a summary of the estimated benefits to costs as a ratio of total economic output per total annual cost that would need to be borne by the County associated with a redeveloped PCEC project. For purposes of this analysis, construction debt service has been calculated assuming a 3.0 percent tax exempt interest rate over a term of 30 years. This cost line item would be removed from the analysis of “annual” costs under a scenario where the County might elect to use Hospital Funds or other available monies fund construction on a pay-as-you-go basis (without issuing debt).
Exhibit 7 Cost/Benefit Analysis for a Potential Redeveloped PCEC
As shown, total annual debt service costs to Porter County are estimated at approximately $1.7 million. As the quality of the PCEC physical product increases and larger and more prominent/attractive non-local and local events are accommodated, resultant demands on the provision and delivery of quality service will also increase. In order to maintain these higher estimated event levels and attendance (and for a redeveloped PCEC to remain industry competitive over the long-term), it would be prudent for the County to plan for a modest annual operating deficit. This is consistent with the operations of the typical expo center/fairgrounds complex in Porter County’s comparable industry set. It is estimated that the current PCEC generates approximately $7.1 million in annual economic output (direct, indirect and induced visitor spending) in Porter County. It is further projected that a redeveloped PCEC would generate approximately $13.8 million in economic output at a cost of approximately $1.7 million in annual debt service payments, resulting in a benefit to cost ratio of approximately 7.91 dollars
Current RedevelopedExpo Center/ Expo Center/Fairgrounds Fairgrounds Incremental
Est. Construction Costs -- $28,000,000 $28,000,000
ANNUAL BENEFITS:Total Economic Output $7,059,579 $13,786,566 $6,726,987
ANNUAL COSTS:County Debt Service $0 $1,428,539 $1,428,539County Capital Reserve Funding $0 $140,000 $140,000County Operating Subsidy $0 $175,000 $175,000
Total $0 $1,743,539 $1,743,539
BENEFIT TO COST RATIO 7.91 3.86

FEASIBILITY ANALYSIS OF A REDEVELOPED PORTER COUNTY EXPO CENTER AND FAIRGROUNDS Cost/Benefit Analysis Page 66
generated per dollar expended in debt service. In terms of incremental benefit to cost, a redeveloped PCEC is projected to generate approximately $6.7 million in annual economic output at an annual debt service cost of $1.7 million, resulting in a benefit to cost ration of approximately 3.86 dollars in economic benefit per dollar spent. Non-Quantifiable Impacts The effects of attracting new events, participants, attendees and exhibitors to the Porter County area could impact numerous industries and enhance economic activity throughout the community. Primary visitor industries, including hotels, restaurants, retail, local transportation, and related industries can benefit directly from a potential center. Indirect effects can benefit various support industries, including the wholesale, distribution, manufacturing, and other industries. In addition to the more quantifiable benefits of a redeveloped PCEC in Porter County, certain potential benefits cannot be quantifiably estimated. Potential qualitative benefits for Porter County include:
• Construction Period Impacts – While not specifically quantified herein, there is normally a substantial short-term economic impact (including many jobs created) during the construction phase of public assembly facility projects of this nature.
• New Visitation – New visitors will be attracted to the area because of an event in the new/redeveloped complex. These attendees, in turn, may elect to return to the area later for a vacation or other business. These impacts have not been quantified.
• Community Marketing – Attendees of certain complex events can represent decision-makers and executives from a broad cross-section of industries. This exposure can benefit the area from a long-term business development perspective. These impacts have not been quantified.
• Anchor for Enhancement/Revitalization – New/redeveloped complex development can oftentimes be the base of community-wide master development plans to enhance and/or revitalize markets. These impacts have not been quantified.
• Other Benefits – There are a number of other intangible benefits and quality of life issues of having an event complex facility in a community that have not been quantified, including their ability to enhance community reputation and image, provide for a local gathering point for residents and new advertising opportunities for local businesses.

FEASIBILITY ANALYSIS OF A REDEVELOPED PORTER COUNTY EXPO CENTER & FAIRGROUNDS Appendix: Comparable Facility Case Studies Page A-1
APPENDIX: COMPARABLE FACILITY CASE STUDIES
Linn County Fair and Expo Center Albany, Oregon Facility Components:
• Willamette Events Center o 48,600 square feet o Conference room
" 6,000 square feet " Subdivisible
• Cascade Livestock Pavilion o 42,000 square feet o 190 portable stalls o 100 ft. x 210 ft. warm-up arena
• Outdoor Warm-up Arena
• Calapooia Arena (enclosed) o 48,600 square foot facility o Arena floor: 129 ft. x 270 ft. o 2,256 permanent seats o 2,300 additional floor seats
• Santiam Building o 21,000 square feet
• 67 RV Hookups
The Linn County Fair and Expo Center is located on 35 acres in Albany, Oregon. With 121,400 square feet of total indoor event space, the center has the flexibility to accommodate a variety of events including horse and livestock shows, public and consumer shows, graduations, meetings, tradeshows, and others. In a recent year of operations, the center reported over $800,000 in revenues and approximately $1.0 million in expenses.
Fairgrounds Facility: Linn County Fair & Expo Center
City, State: Albany, ORSize: 35 acresOwnership Structure: County
Number of Event Halls 3 Number of Enclosed Arenas 2 Number of Covered Arenas 0 Number of Outdoor Arenas 1 Number of Barns 1 Number of Event Buildings 7
Largest Contiguous Exhibit Space: 48,600Total Indoor Event Space: 131,400
Permanent Horse Stalls: 94Portable Horse Stalls: 190RV Hook-ups: 67Grandstand Seating: n/a

FEASIBILITY ANALYSIS OF A REDEVELOPED PORTER COUNTY EXPO CENTER & FAIRGROUNDS Appendix: Comparable Facility Case Studies Page A-2
Bell County Expo Center Belton, Texas
Facility Components:
• Main Arena o 120 ft x 245 ft (cement) o Fixed Seating for 6,000 o Maximum Capacity of 8,500
• Exposition Building o 100,000 total square feet o 20,000-square foot dirt arena o 55,000 square feet of concrete
exhibit space • 180 permanent stalls and 100 portable
stalls
• Assembly Hall o 1,000 banquet capacity o 16,460 square feet
• Special Events Room o 11,700 square feet o Capacity for 20 – 250 people o 9,573 square feet
• Outdoor Arena & Horse Barn • 8 RV Hookups
The $9.5 million Bell County Expo Center was constructed in 1987 and is owned by Bell County. The Center is managed by Bell County Expo, Inc., a non-profit corporation overseen by a Board of Directors. In a recent year, the center hosted 291 events including conventions, concerts, livestock and equestrian shows, trade shows, consumer shows, banquets, meetings, social functions, rodeo events, graduations and civic events. Bell County Expo Center has also been the home for professional sports teams including minor league hockey and indoor football. Several years ago, the facility completed a modest renovation project that improved the aesthetics of the exterior façade and functionality of the entrance and circulation areas. The facility also recently completed an expansion feasibility study that contemplated adding a new indoor dirt arena and attached stall space. The facility is currently exploring the sale of naming rights to the complex to assist in income generation.
Fairgrounds Facility: Bell County Expo
City, State: Belton, TXSize: 43 acresOwnership Structure: County
Number of Event Halls 2 Number of Enclosed Arenas 2 Number of Covered Arenas 1 Number of Outdoor Arenas 0 Number of Barns 2 Number of Event Buildings 7
Largest Contiguous Exhibit Space: 36,250Total Indoor Event Space: 81,240
Permanent Horse Stalls: 220Portable Horse Stalls: 55RV Hook-ups: 16Grandstand Seating: n/a

FEASIBILITY ANALYSIS OF A REDEVELOPED PORTER COUNTY EXPO CENTER & FAIRGROUNDS Appendix: Comparable Facility Case Studies Page A-3
Western Idaho Fairgrounds Garden City, Idaho
Facility Components:
• Exposition Building o North Expo: 20,000 square feet o Center Expo: 35,000 square feet o South Expo: 20,000 square feet
• Premium Building o 7,200 square feet
• Western Town o 2,000 square feet o Subdivisible
• Shop Arena (outdoor) o 300 ft. x 160 ft. o Seating for 225
• Trackside Arena (outdoor) o 250 ft. x 125 ft. o Seating for 225
• 5 Barns • 101 RV Hookups • 140 permanent horse stalls
The Western Idaho Fairgrounds is located on 240 acres in Garden City, Idaho. One of its main facilities, the Exposition Building, has a total of 75,000 square feet available and is used primarily for public and consumer shows, dances, flea markets, sales and auctions, and other various events. In a recent year, 65 total events were hosted at the Fairgrounds, accounting for 271 event days. In a recent operating year, the Fairgrounds generated nearly $3.5 million in revenue and accumulated approximately $3.3 million in expenses.
Fairgrounds Facility: Western Idaho Fairgrounds
City, State: Boise, IDSize: 240 acresOwnership Structure: County
Number of Event Halls 5 Number of Enclosed Arenas 0 Number of Covered Arenas 0 Number of Outdoor Arenas 2 Number of Barns 5 Number of Event Buildings 12
Largest Contiguous Exhibit Space: 35,000Total Indoor Event Space: 84,200
Permanent Horse Stalls: 140Portable Horse Stalls: 0RV Hook-ups: 101Grandstand Seating: 3,200

FEASIBILITY ANALYSIS OF A REDEVELOPED PORTER COUNTY EXPO CENTER & FAIRGROUNDS Appendix: Comparable Facility Case Studies Page A-4
Douglas County Fairgrounds and Events Center Castle Rock, Colorado
Facility Components:
• Event Center o Total Size: 29,100 sq. ft. o $1,500 standard
• Indoor Arena o Size: 118 ft. x 280 ft. o Outdoor warm up ring 100 ft. x
150 ft. o 2,000 spectator seating o $1,000 standard
• Outdoor Arena o Size: 135 ft. x 300 ft. o Grandstand seating for 2,441 o Six (6) bucking chutes o $500 standard
• Kirk Hall o 4,800 SF o $300 standard
• Louviers Village Clubhouse o $300 standard
The Douglas County Events Center opened in 2005, at a total cost of $15 million. As part of the Douglas County Fairgrounds, the complex is located in Castle Rock, Colorado, situated off Interstate 25, between Denver and Colorado Springs. Each year, the complex hosts events such as: conferences, meetings, equine events, trade shows, trainings, rodeos, auctions and livestock sales and shows.
Fairgrounds Facility: Douglas County Fairgrounds
City, State: Castle Rock, COSize: 45 acresOwnership Structure: County
Number of Event Halls 2 Number of Enclosed Arenas 1 Number of Covered Arenas 0 Number of Outdoor Arenas 3 Number of Barns 4 Number of Event Buildings 10
Largest Contiguous Exhibit Space: 29,100Total Indoor Event Space: 71,650
Permanent Stalls: 94Portable Stalls: 150RV Hook-ups: 10Grandstand Seating: 2,450

FEASIBILITY ANALYSIS OF A REDEVELOPED PORTER COUNTY EXPO CENTER & FAIRGROUNDS Appendix: Comparable Facility Case Studies Page A-5
Claremore Expo Center Claremore, Oklahoma
Facility Components:
• Indoor Dirt Arena o Dimensions: 135 ft. x 265 ft. o Flooring: Dirt o Seating: 2,400 bleachers &
2,500 floor • Expo Hall
o Size: 31,000 square feet o Seating: 50 to 3,000
• Outdoor Arena o Dimensions: 120 ft. x 210 ft.
• Stall Barn o Size: 120 ft. x 210 ft.
• 220 portable horse stalls • RV Park
o 44 full hook-ups o 20, 30 and 50-amp service o BBQ grills, picnic areas, laundry
service The City of Claremore dedicated the facility in December 1999. The Claremore Expo Center complex sits on 55 acres and includes an indoor dirt arena, expo hall, outdoor arena and a stall barn that can hold 220 portable stalls. Each year, the Center hosts an array of events including concerts, livestock shows, trade shows, sports events, receptions, banquets, equestrian shows, tractor pulls and motorcycle and bicycle events. It is estimated that the Claremore Expo Center hosts 350 events each year, including over 100 equine related events. Additionally, the Expo Center recently has become the host facility of the Rogers State Basketball program.
Fairgrounds Facility: Claremore Expo Center
City, State: Claremore, OKSize: 55 acresOwnership Structure: City Dept.
Number of Event Halls 1 Number of Enclosed Arenas 1 Number of Covered Arenas 1 Number of Outdoor Arenas 0 Number of Barns 1 Number of Event Buildings 4
Largest Contiguous Exhibit Space: 31,000Total Indoor Event Space: 68,200
Permanent Horse Stalls: 90Portable Horse Stalls: 220RV Hook-ups: 44Grandstand Seating: n/a

FEASIBILITY ANALYSIS OF A REDEVELOPED PORTER COUNTY EXPO CENTER & FAIRGROUNDS Appendix: Comparable Facility Case Studies Page A-6
Young County Arena Graham, Texas
Facility Components
• Competition Arena
o Size: 150 ft. x 250 ft., dirt floor o Seating Capacity: 2,523
" 2,290 bench seats " 233 chairs
• Secondary Arena (covered) o Size: 120 ft. x 250 ft.
• 1,080 square foot concession area • 250 portable horse stalls • Two Animal Wash Bays
o 2,400 square feet • 3,900 square foot meeting room • 5,000 square feet exhibit space • 60 RV hookups
The Young County Event Center opened in 2003 in Graham, Texas, approximately 90 miles northwest of Fort Worth, and was intended to serve as the primary rodeo and equine facility in north Texas. The center is owned and operated by the Graham Economic Development Authority, which assumed control from Young County in 2006. The center features a 37,500 square foot competition arena with seating for 2,500, a 30,000 square foot secondary arena, 250 portable horse stalls, two animal wash bays, a 3,900 square foot meeting room, 5,000 square feet of exhibit space, and 60 RV hook-ups. In a recent year, the center hosted approximately 115 events, including youth rodeos, team roping events, barrel racing, livestock shows, motocross, concerts and other events, over 170 days, and attracting approximately 40,000 attendees. Young County issued approximately $1.5 million in bonds backed by a 4-B sales tax as a means of funding the majority of project costs. In addition, local businesses donated an undisclosed amount of materials and other funding to the County towards construction. In a recent year, the facility generated over $200,000 in operating revenue and incurred approximately $340,000 in operating expenses. Operating deficits are subsidized by the Graham Economic Development Authority via sales tax revenue.
Fairgrounds Facility: Young County Arena
City, State: Graham, TXSize: 20 acresOwnership Structure: City
Number of Event Halls 0 Number of Enclosed Arenas 1 Number of Covered Arenas 1 Number of Outdoor Arenas 2 Number of Barns 0 Number of Event Buildings 4
Largest Contiguous Exhibit Space: 5,000Total Indoor Event Space: 46,400
Permanent Horse Stalls: 0Portable Horse Stalls: 250RV Hook-ups: 60Grandstand Seating: n/a

FEASIBILITY ANALYSIS OF A REDEVELOPED PORTER COUNTY EXPO CENTER & FAIRGROUNDS Appendix: Comparable Facility Case Studies Page A-7
Island Grove Events Center Greeley, Colorado
Facility Components:
• Events Center o 60,000 square feet of event
space o Great Hall: 58,000 square feet o 1,300-square foot conference
room • Pro-Rodeo Arena
o Large arena: 311 ft. x 205 ft. o Seating for 9,000 o Warm-up arena: 120 ft. x 70 ft.
• Exhibition Building: 24,200 sq. ft. exhibit and meeting venue
• Bunk House: 1,500 sq. ft. meeting venue
• 4-H Building: o Great Hall: 6,600 square feet o 1,300 square foot meeting room
• Greeley Saddle Club: Two (2) outdoor arenas
• Pavilion: 9,200 sq. ft. covered meeting area
• Livestock Building: 30,000 sq. ft. barn for sales and shows
• Five lighted softball fields • Outdoor Swimming pool • Centennial Village Museum • 150 Indoor Stalls • 300 RV Hookups
The Island Grove Event Center is part of a 145-acre Island Grove Regional Park which contains ten event buildings, softball fields, a swimming pool and the Centennial Village Museum. The complex is owned by the City of Greeley and Weld County. The Center hosts events such as concerts, sporting events, rodeos, public and trade shows, cattle and livestock sales and shows, equestrian events and various social events.
Fairgrounds Facility: Island Grove Events Center
City, State: Greeley, COSize: 145 acresOwnership Structure: City/County
Number of Event Halls 4 Number of Enclosed Arenas 0 Number of Covered Arenas 0 Number of Outdoor Arenas 4 Number of Barns 2 Number of Event Buildings 10
Largest Contiguous Exhibit Space: 58,200Total Indoor Event Space: 126,300
Permanent Horse Stalls: 150Portable Horse Stalls: 0RV Hook-ups: 300Grandstand Seating: 9,000
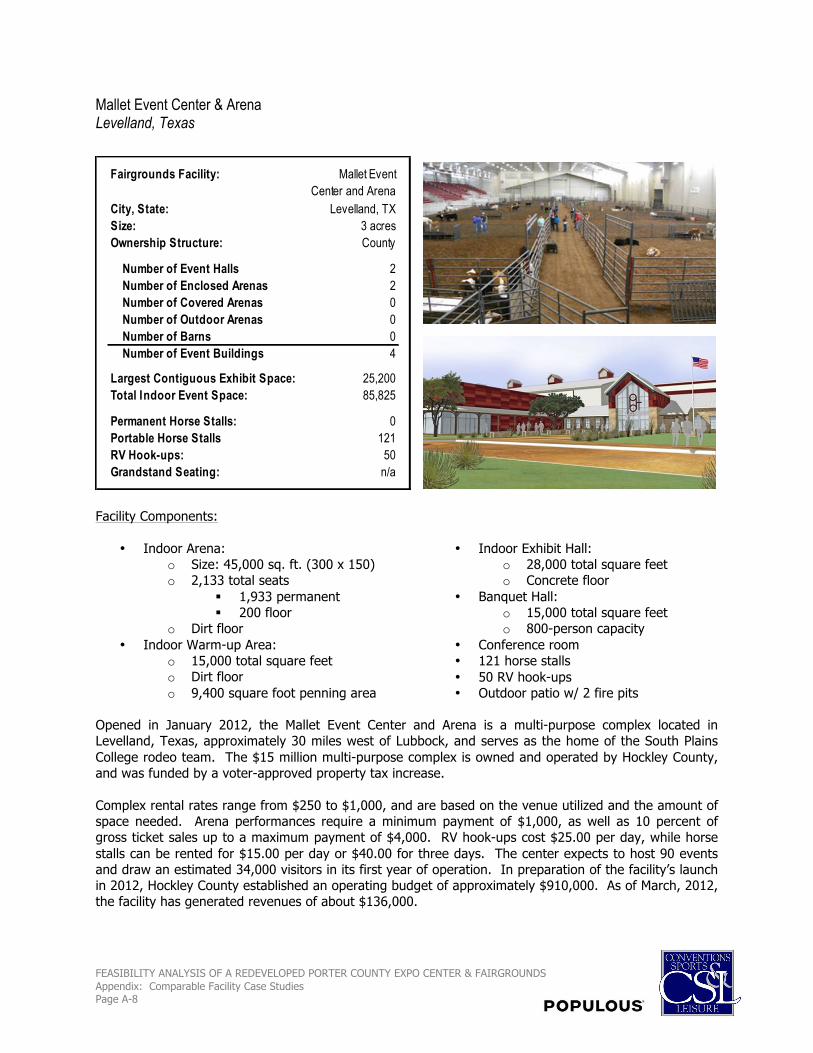
FEASIBILITY ANALYSIS OF A REDEVELOPED PORTER COUNTY EXPO CENTER & FAIRGROUNDS Appendix: Comparable Facility Case Studies Page A-8
Mallet Event Center & Arena Levelland, Texas
Facility Components:
• Indoor Arena: o Size: 45,000 sq. ft. (300 x 150) o 2,133 total seats
" 1,933 permanent " 200 floor
o Dirt floor • Indoor Warm-up Area:
o 15,000 total square feet o Dirt floor o 9,400 square foot penning area
• Indoor Exhibit Hall: o 28,000 total square feet o Concrete floor
• Banquet Hall: o 15,000 total square feet o 800-person capacity
• Conference room • 121 horse stalls • 50 RV hook-ups • Outdoor patio w/ 2 fire pits
Opened in January 2012, the Mallet Event Center and Arena is a multi-purpose complex located in Levelland, Texas, approximately 30 miles west of Lubbock, and serves as the home of the South Plains College rodeo team. The $15 million multi-purpose complex is owned and operated by Hockley County, and was funded by a voter-approved property tax increase. Complex rental rates range from $250 to $1,000, and are based on the venue utilized and the amount of space needed. Arena performances require a minimum payment of $1,000, as well as 10 percent of gross ticket sales up to a maximum payment of $4,000. RV hook-ups cost $25.00 per day, while horse stalls can be rented for $15.00 per day or $40.00 for three days. The center expects to host 90 events and draw an estimated 34,000 visitors in its first year of operation. In preparation of the facility’s launch in 2012, Hockley County established an operating budget of approximately $910,000. As of March, 2012, the facility has generated revenues of about $136,000.
Fairgrounds Facility: Mallet Event Center and Arena
City, State: Levelland, TXSize: 3 acresOwnership Structure: County
Number of Event Halls 2 Number of Enclosed Arenas 2 Number of Covered Arenas 0 Number of Outdoor Arenas 0 Number of Barns 0 Number of Event Buildings 4
Largest Contiguous Exhibit Space: 25,200Total Indoor Event Space: 85,825
Permanent Horse Stalls: 0Portable Horse Stalls 121RV Hook-ups: 50Grandstand Seating: n/a

FEASIBILITY ANALYSIS OF A REDEVELOPED PORTER COUNTY EXPO CENTER & FAIRGROUNDS Appendix: Comparable Facility Case Studies Page A-9
Lancaster Events Center Lincoln, Nebraska
Facility Components:
• Multipurpose Arena o Arena floor: 100 ft. x 225 ft. o Dirt floor that can be compacted
and carpet laid over • Lincoln Room
o 17,000 square feet • Amy Countryman Arena
o Size: 300 ft. x 125 ft. • Pavilion I
o 83,000 square feet o Capacity for 400 booths or stalls
• Pavilion II o 83,000 square feet o Capacity for 400 stalls
• Pavilion III o Arena floor: 220 ft. x 114 ft.
• Business Center o 3 meeting rooms o 5,750 total square feet
• 800 Stall capacity • 200 RV Hookups
Built in 2000, the Lancaster Event Center is located right outside Lincoln, Nebraska. The Center cost $15 million to construct, and was funded through County issued bonds. The Event Center hosts 300 events per year, including agricultural trade and livestock shows, regional and national equipment shows, auto shows, sporting events, conferences and meetings. All three structures of the Center are connected.
Fairgrounds Facility: Lancaster Events Center
City, State: Lincoln, NESize: 167 acresOwnership Structure: 501(c)3
Number of Event Halls 3 Number of Enclosed Arenas 3 Number of Covered Arenas 0 Number of Outdoor Arenas 2 Number of Barns 1 Number of Event Buildings 9
Largest Contiguous Exhibit Space: 83,000Total Indoor Event Space: 235,650
Permanent Horse Stalls: 400Portable Horse Stalls: 400RV Hook-ups: 200Grandstand Seating: n/a
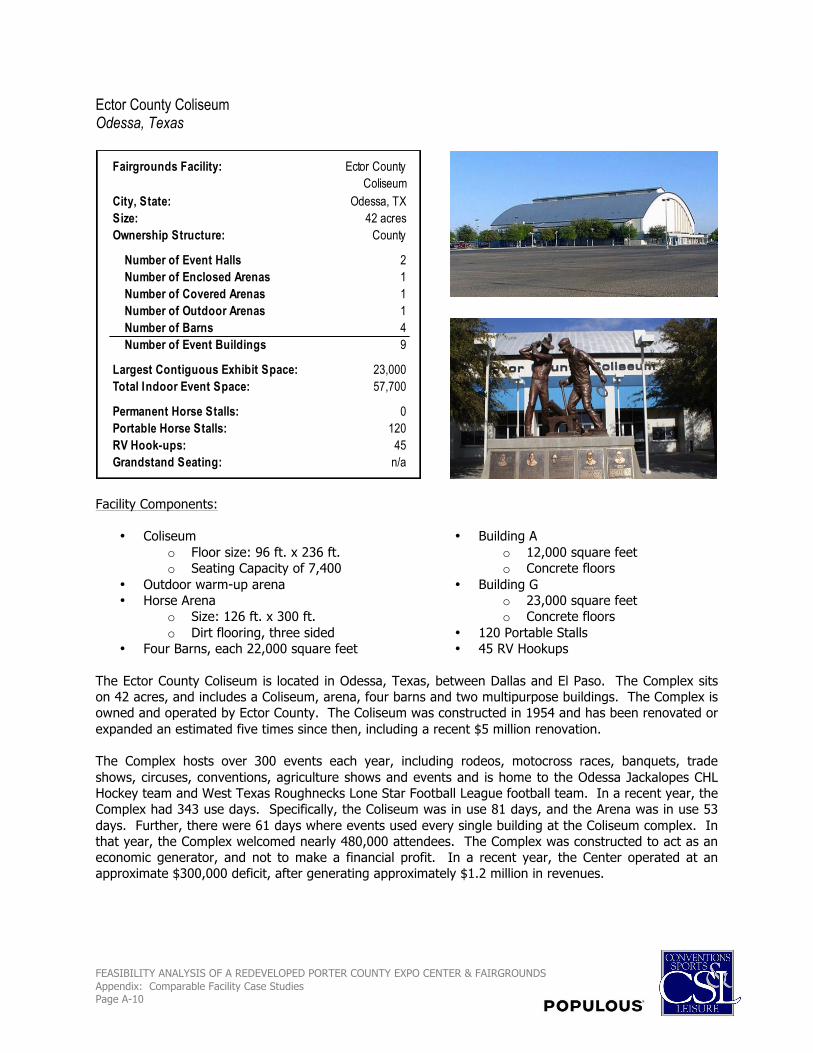
FEASIBILITY ANALYSIS OF A REDEVELOPED PORTER COUNTY EXPO CENTER & FAIRGROUNDS Appendix: Comparable Facility Case Studies Page A-10
Ector County Coliseum Odessa, Texas
Facility Components:
• Coliseum o Floor size: 96 ft. x 236 ft. o Seating Capacity of 7,400
• Outdoor warm-up arena • Horse Arena
o Size: 126 ft. x 300 ft. o Dirt flooring, three sided
• Four Barns, each 22,000 square feet
• Building A o 12,000 square feet o Concrete floors
• Building G o 23,000 square feet o Concrete floors
• 120 Portable Stalls • 45 RV Hookups
The Ector County Coliseum is located in Odessa, Texas, between Dallas and El Paso. The Complex sits on 42 acres, and includes a Coliseum, arena, four barns and two multipurpose buildings. The Complex is owned and operated by Ector County. The Coliseum was constructed in 1954 and has been renovated or expanded an estimated five times since then, including a recent $5 million renovation. The Complex hosts over 300 events each year, including rodeos, motocross races, banquets, trade shows, circuses, conventions, agriculture shows and events and is home to the Odessa Jackalopes CHL Hockey team and West Texas Roughnecks Lone Star Football League football team. In a recent year, the Complex had 343 use days. Specifically, the Coliseum was in use 81 days, and the Arena was in use 53 days. Further, there were 61 days where events used every single building at the Coliseum complex. In that year, the Complex welcomed nearly 480,000 attendees. The Complex was constructed to act as an economic generator, and not to make a financial profit. In a recent year, the Center operated at an approximate $300,000 deficit, after generating approximately $1.2 million in revenues.
Fairgrounds Facility: Ector County Coliseum
City, State: Odessa, TXSize: 42 acresOwnership Structure: County
Number of Event Halls 2 Number of Enclosed Arenas 1 Number of Covered Arenas 1 Number of Outdoor Arenas 1 Number of Barns 4 Number of Event Buildings 9
Largest Contiguous Exhibit Space: 23,000Total Indoor Event Space: 57,700
Permanent Horse Stalls: 0Portable Horse Stalls: 120RV Hook-ups: 45Grandstand Seating: n/a

FEASIBILITY ANALYSIS OF A REDEVELOPED PORTER COUNTY EXPO CENTER & FAIRGROUNDS Appendix: Comparable Facility Case Studies Page A-11
Deschutes County Fair and Expo Center Redmond, Oregon
Facility Components:
• North Sister o 9,400 square feet o 3 breakout meeting rooms
• Middle Sister o 14,900 square feet o 4 breakout meeting rooms
• South Sister o 9,400 square feet o 3 breakout meeting rooms
• High Deserts Activity Center o 12,700 square feet
• Hooker Creek Event Center o Oval shape: 125 ft. x 320 ft. o Arena seating: 4,000 o Concert seating: 7,800 o Warm-up arena attached
• 5 Barns o 75 permanent stalls o 325 portable stalls
• Juniper Arena (outdoor) o 175 ft. x 295 ft.
• Sagebrush Arena (outdoor covered) o 130 ft. x 230 ft.
The Deschutes County Fair and Expo Center is located on 132 acres in Redmond, Oregon and was completed in the year 2000. Owned and operated by the County, the facility includes 46,400 square feet of exhibit space across four buildings, the Hooker Creek Events Center which features an indoor arena with seating for 4,000, an outdoor arena, an outdoor covered arena, five barns, 106 RV hookups, and 400 stalls.
In a recent year, the complex hosted 365 events attracting approximately 461,500 attendees. The facility generated nearly $2.9 million in revenue while incurring expenses of $2.7 million (excluding debt service payments of $242,000). The economic impact for the Deschutes County Fair and Expo was estimated by facility management at over $38.6 million.
Fairgrounds Facility: Deschutes County Fairgrounds and
Expo CenterCity, State: Redmond, ORSize: 132 acresOwnership Structure: County
Number of Event Halls 4 Number of Enclosed Arenas 1 Number of Covered Arenas 2 Number of Outdoor Arenas 1 Number of Barns 5 Number of Event Buildings 13
Largest Contiguous Exhibit Space: 14,900Total Indoor Event Space: 92,550
Permanent Horse Stalls: 75Portable Horse Stalls 325RV Hook-ups: 106Grandstand Seating: 2,500

FEASIBILITY ANALYSIS OF A REDEVELOPED PORTER COUNTY EXPO CENTER & FAIRGROUNDS Appendix: Comparable Facility Case Studies Page A-12
Clark County Fair Exhibition Center Ridgefield, Washington
Facility Components:
• Dr. Jack Giesy Arena o Size: 112 ft. x 325 ft. o Dirt floor arena, asphalt
spectator areas, restrooms and offices
o 194 horse stalls o $760 – $560 per day
• Livestock Buildings o 2 Horse Stall Barns o Sheep Barn o Goat Barn o Small Animal Barn o E Building
• Exhibition Hall o 97,200 sq. ft. of subdividable
exhibit space o $5,850 per day
• South Halls o One: 24,000 sq. ft. o Two: 8,000 sq. ft. o Three: 18,000 sq. ft. o $320 - $850 per day
• Grandstands o 7,500 seating capacity o $2,500 minimum vs. 12% of
ticket gross The Clark County Event Center is located at the Clark County Fairgrounds in Ridgefield, Washington. Located on 170 acres, the Event Center and the Fairgrounds incorporates many event venues on one site, including an exhibit hall, arena, grandstand, livestock buildings and halls. The new exhibit hall opened in March 2005 and totaled $18 million in construction costs. Owned and constructed by Clark County, the County contracts with the Fairgrounds Site Management Group to operate and market the facility. The Center hosts a wide array of events each year, including the Clark County Fair, which welcomes 250,000 visitors each year. In a recent year, the Center hosted over 70 events, which accounted for over 210 event days.
Fairgrounds Facility: Clark County Fair Exhibition Center
City, State: Ridgefield, WASize: 170 acresOwnership Structure: County Dept.
Number of Event Halls 4 Number of Enclosed Arenas 1 Number of Covered Arenas 0 Number of Outdoor Arenas 1 Number of Barns 6 Number of Event Buildings 12
Largest Contiguous Exhibit Space: 97,200Total Indoor Event Space: 183,600
Permanent Horse Stalls: 260Portable Horse Stalls: 25RV Hook-ups n/aGrandstand Seating: 7,500

FEASIBILITY ANALYSIS OF A REDEVELOPED PORTER COUNTY EXPO CENTER & FAIRGROUNDS Appendix: Comparable Facility Case Studies Page A-13
Nolan County Coliseum Sweetwater, Texas
Facility Components:
• Coliseum o Size: 90 ft. x 240 ft. o Dirt Flooring o Permanent seating of 3,200
• Muncie Arena o Outdoor arena o Size: 160 ft. x 260 ft. o Seating for 300
• Coliseum Annex o 13,500 square feet
• Convention/Exhibit Building o 17,000 square feet o Movable partition
• Horse Barn • 300 permanent stalls • 130 RV Hookups
The Nolan County Coliseum opened in 1958 in Sweetwater, Texas, and has since undergone several facility renovations and expansions over the years. Owned and operated by Nolan County, the facility includes a 3,200-seat indoor coliseum with a 21,600 square foot dirt floor, a 13,500 square foot annex, a 41,600 square foot outdoor arena with seating for 300, a 17,000 square foot exhibition building, 300 permanent stalls, and 130 RV hook-ups. On an annual basis, the facility hosts approximately 200 events, including rodeos, team roping, livestock shows, meetings, banquets, cutting and barrel races and the world’s largest Rattlesnake Round-up. Approximately 80,000 attendees visit the facility annually, including 30,000 that attend the Rattlesnake Round-up every March. In a recent year, the facility generated operating revenues of approximately $400,000 and incurred operating expenses of approximately $375,000.
Fairgrounds Facility: Nolan County Coliseum
City, State: Sweetwater, TXSize: 50 acresOwnership Structure: County
Number of Event Halls 2 Number of Enclosed Arenas 1 Number of Covered Arenas 1 Number of Outdoor Arenas 1 Number of Barns 1 Number of Event Buildings 6
Largest Contiguous Exhibit Space: 17,000Total Indoor Event Space: 52,100
Permanent Horse Stalls: 300Portable Horse Stalls: 0RV Hook-ups: 130Grandstand Seating: n/a
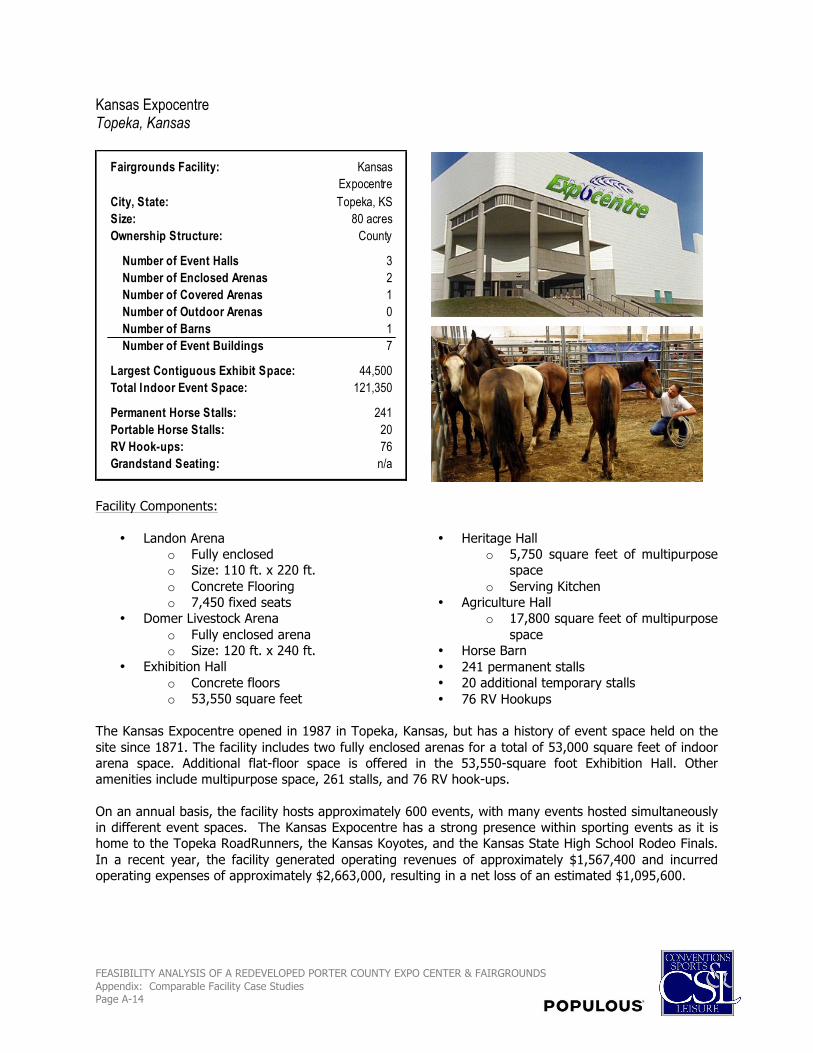
FEASIBILITY ANALYSIS OF A REDEVELOPED PORTER COUNTY EXPO CENTER & FAIRGROUNDS Appendix: Comparable Facility Case Studies Page A-14
Kansas Expocentre Topeka, Kansas
Facility Components:
• Landon Arena o Fully enclosed o Size: 110 ft. x 220 ft. o Concrete Flooring o 7,450 fixed seats
• Domer Livestock Arena o Fully enclosed arena o Size: 120 ft. x 240 ft.
• Exhibition Hall o Concrete floors o 53,550 square feet
• Heritage Hall o 5,750 square feet of multipurpose
space o Serving Kitchen
• Agriculture Hall o 17,800 square feet of multipurpose
space • Horse Barn • 241 permanent stalls • 20 additional temporary stalls • 76 RV Hookups
The Kansas Expocentre opened in 1987 in Topeka, Kansas, but has a history of event space held on the site since 1871. The facility includes two fully enclosed arenas for a total of 53,000 square feet of indoor arena space. Additional flat-floor space is offered in the 53,550-square foot Exhibition Hall. Other amenities include multipurpose space, 261 stalls, and 76 RV hook-ups. On an annual basis, the facility hosts approximately 600 events, with many events hosted simultaneously in different event spaces. The Kansas Expocentre has a strong presence within sporting events as it is home to the Topeka RoadRunners, the Kansas Koyotes, and the Kansas State High School Rodeo Finals. In a recent year, the facility generated operating revenues of approximately $1,567,400 and incurred operating expenses of approximately $2,663,000, resulting in a net loss of an estimated $1,095,600.
Fairgrounds Facility: Kansas Expocentre
City, State: Topeka, KSSize: 80 acresOwnership Structure: County
Number of Event Halls 3 Number of Enclosed Arenas 2 Number of Covered Arenas 1 Number of Outdoor Arenas 0 Number of Barns 1 Number of Event Buildings 7
Largest Contiguous Exhibit Space: 44,500Total Indoor Event Space: 121,350
Permanent Horse Stalls: 241Portable Horse Stalls: 20RV Hook-ups: 76Grandstand Seating: n/a

FEASIBILITY ANALYSIS OF A REDEVELOPED PORTER COUNTY EXPO CENTER & FAIRGROUNDS Appendix: Comparable Facility Case Studies Page A-15
Wichita Falls Multi-Purpose Event Center Wichita Falls, Texas
Facility Components:
• J.S. Bridwell Ag Center o Arena (120 ft. x 270 ft.) o 1,200 seats o Barn (50,000 sq. ft.) o 275 indoor horse stalls o 600 RV hook-ups
• Memorial Auditorium – 2,700 seats
• MPEC Events Center o 57,141 total square feet o 10 meeting rooms
• Kay Yeager Coliseum o 120 ft. x 250 ft. floor o 6,500 permanent seats
• 10,000 total capacity
The Wichita Falls Multi-Purpose Event Center is located in Wichita Falls, Texas, and includes the J.S. Bridwell Ag Center, the 6,500-seat Kay Yeager Coliseum, the 57,141 square foot exhibit hall, and the 2,700-seat Memorial Auditorium. The event center is owned and operated by the City of Wichita Falls. The J.S. Bridwell Ag Center Opened in 1996 with a cost of approximately $5.7 million, including $4.2 million in hard costs and $1.5 million in land acquisition, and was funded with bonds secured by City of Wichita Falls and Wichita County general funds. The MPEC Events Center opened in 1997 and the Kay Yeager Coliseum opened in 2003 at a cost of approximately $19 million. In total, the Ag Center had 41,000 attendees in 2011, hosting 116 events, including horse shows, livestock shows, rodeo events, and other such events. In 2011, the Ag Center generated approximately $573,000 in operating revenue and incurred approximately $947,000 in operating expenses, resulting in a net operating loss of approximately $374,000. Annual operating losses are subsidized by funds generated by a seven percent city hotel/motel tax.
Fairgrounds Facility: Wichita Falls Multipurpose
CenterCity, State: Wichita Falls, TXSize: 80 acresOwnership Structure: City
Number of Event Halls 2 Number of Enclosed Arenas 2 Number of Covered Arenas 1 Number of Outdoor Arenas 0 Number of Barns 1 Number of Event Buildings 6
Largest Contiguous Exhibit Space: 38,100Total Indoor Event Space: 121,200
Permanent Horse Stalls: 0Portable Horse Stalls 275RV Hook-ups: 600Grandstand Seating: n/a