Embed Size (px)
Citation preview

3/5/15
Challenge the future
DelftUniversity ofTechnology
Understanding Software Performance Regressions Using Differential Flame GraphsCor-Paul Bezemer, Johan Pouwelse, Brendan Gregg
2Understanding Software Performance Regressions Using DFGs
Regression Testing

3Understanding Software Performance Regressions Using DFGs
Regression Testing Cycle
1)Write code 2)Deploy to continuous integration system3)Test4)Deploy to production code or return to 1)

4Understanding Software Performance Regressions Using DFGs
Performance Regression Testing
• Functional testing is difficult, but:• Functionality is either OK or broken
• Performance testing is even more difficult:• Depends on requirements of application
• A library may be fast enough for one application, while it's too slow for another
• How much performance regression is acceptable?

5Understanding Software Performance Regressions Using DFGs
6Understanding Software Performance Regressions Using DFGs
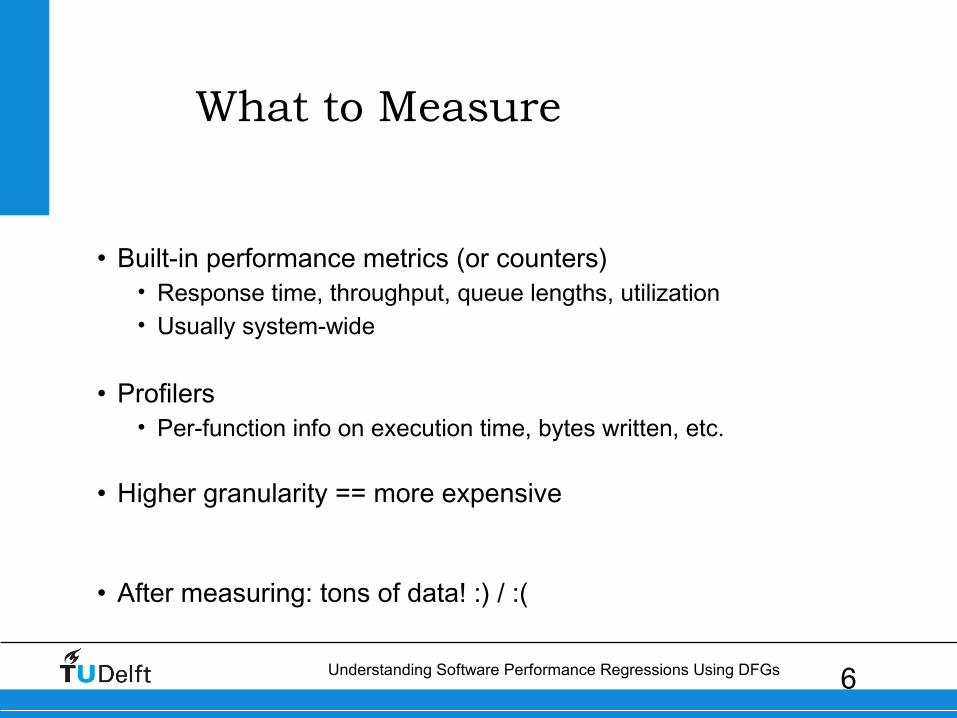
What to Measure
• Built-in performance metrics (or counters)• Response time, throughput, queue lengths, utilization• Usually system-wide
• Profilers• Per-function info on execution time, bytes written, etc.
• Higher granularity == more expensive
• After measuring: tons of data! :) / :(
7Understanding Software Performance Regressions Using DFGs

8Understanding Software Performance Regressions Using DFGs
Detecting I/O Regression
• Previous work:• “Detecting and analyzing I/O performance regressions”,
C. Bezemer, E. Milon, A. Zaidman, J. Pouwelse (Journal of Software: Evolution and Process 26 (12), 1193-1212)
• Approach for finding out which function exhibits I/O write regression over two software versions
• Results promising, but sometimes difficult to interpret

9Understanding Software Performance Regressions Using DFGs
Work in Progress: Visualization
10Understanding Software Performance Regressions Using DFGs
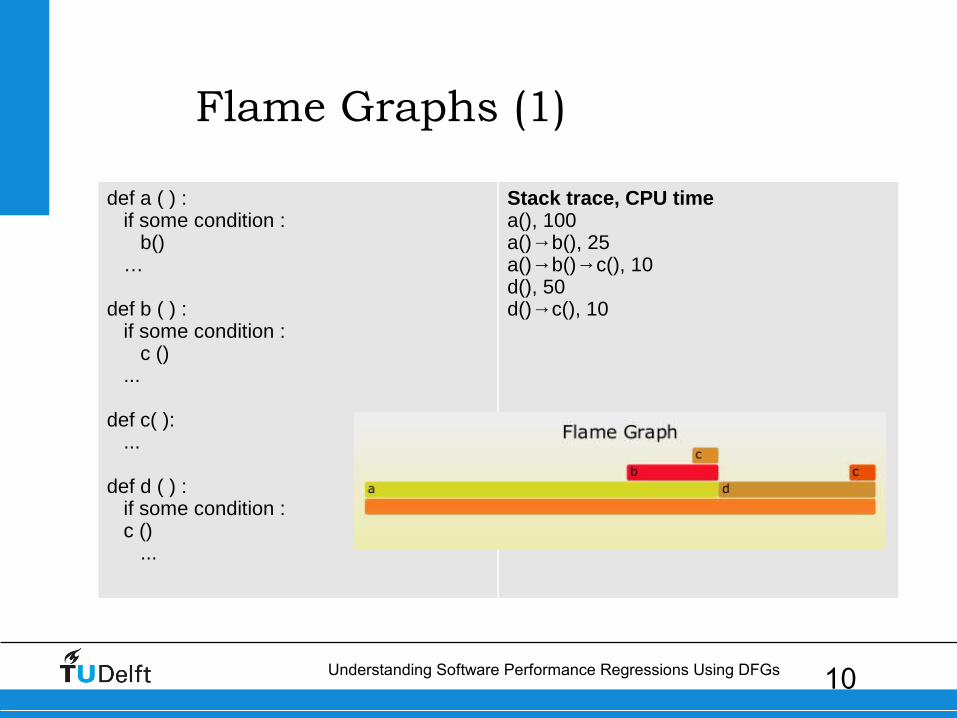
Flame Graphs (1)
def a ( ) : if some condition : b() …
def b ( ) : if some condition : c () ...
def c( ): ...
def d ( ) : if some condition : c () ...
Stack trace, CPU timea(), 100a()→b(), 25a()→b()→c(), 10d(), 50d()→c(), 10

11Understanding Software Performance Regressions Using DFGs
Flame Graphs (2)

12Understanding Software Performance Regressions Using DFGs
Flame Graphs (3)

13Understanding Software Performance Regressions Using DFGs
Differential Flame Graphs (1)

14Understanding Software Performance Regressions Using DFGs
Demo

15Understanding Software Performance Regressions Using DFGs
Differential Flame Graphs (2)
• You can do this with performance profiles..
• But also with other data?• Ideas:
• Website clickpaths• Parallel/distributed computing• ...
• Let us know! http://corpaul.github.io/flamegraphdiff/
• (they use this at Netflix, so it must be pretty cool!)
16Understanding Software Performance Regressions Using DFGs
Discussion
• Data collection is difficult• No out of the box solutions• Expensive
• Data variation between executions can be considerable• Especially for 'non-stable' metrics (CPU, memory)
17Understanding Software Performance Regressions Using DFGs
[email protected]://corpaul.github.io/flamegraphdiff/