Embed Size (px)
Citation preview
Why ΔQ is the ideal
network metric
© Predictable Network Solutions 2015
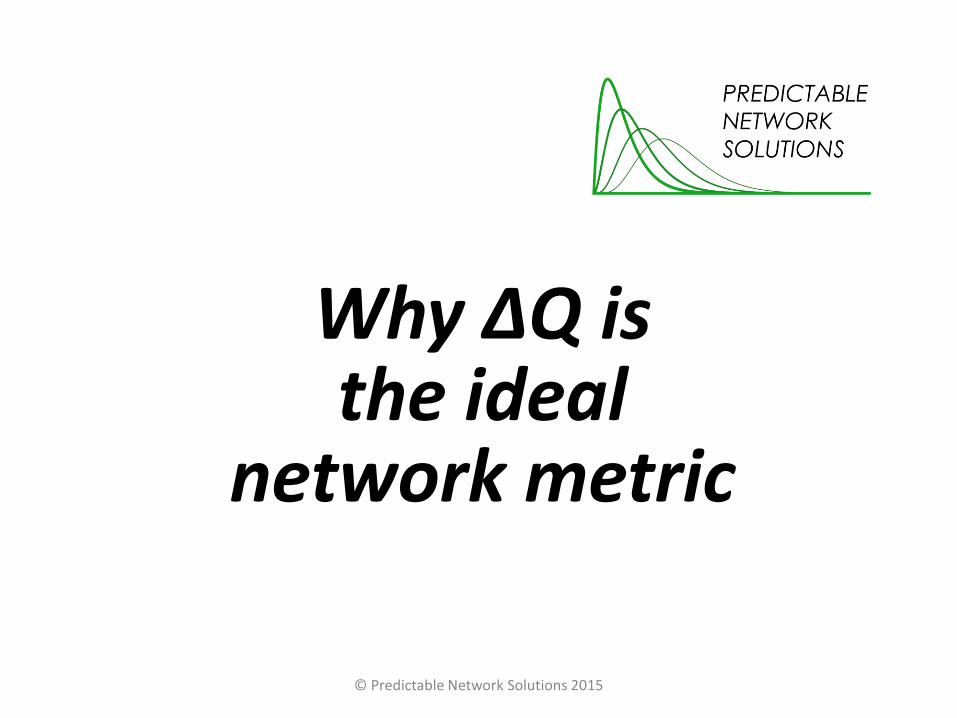
Dr Neil Davies Co-founder and Chief Scientist
Ex: University of Bristol (23 years).
Former technical head of joint university/research institute (SRF/PACT).
The only network performance science company in the world.
• New mathematical performance measurement and analysis techniques.
• Performance assessment methodology.
• World’s first packet network quality assurance solution.
PREDICTABLE NETWORK
SOLUTIONS
Peter Thompson CTO
Ex: GoS Networks, U4EA, SGS-Thomson, INMOS & Universities of Bristol, Warwick and Cambridge and Oxford .
Authority on technical and commercial issues of converged networking.
Martin Geddes Associate Director of Business Development
Ex: BT, Telco 2.0, Sprint, Oracle, Oxford University.
Thought leader on the future of the telecommunications industry.
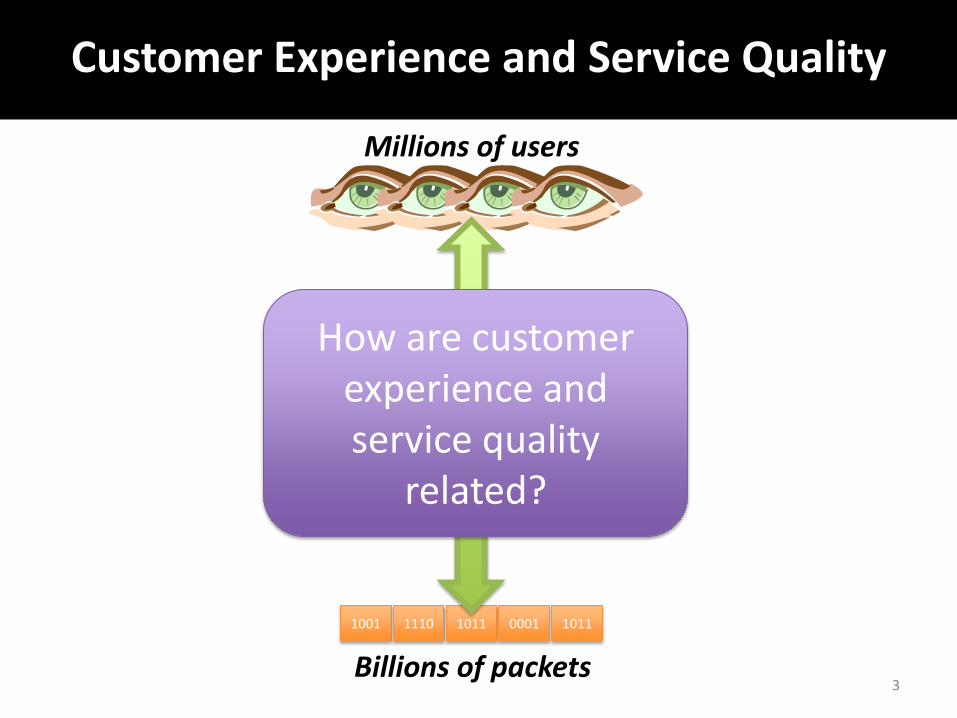
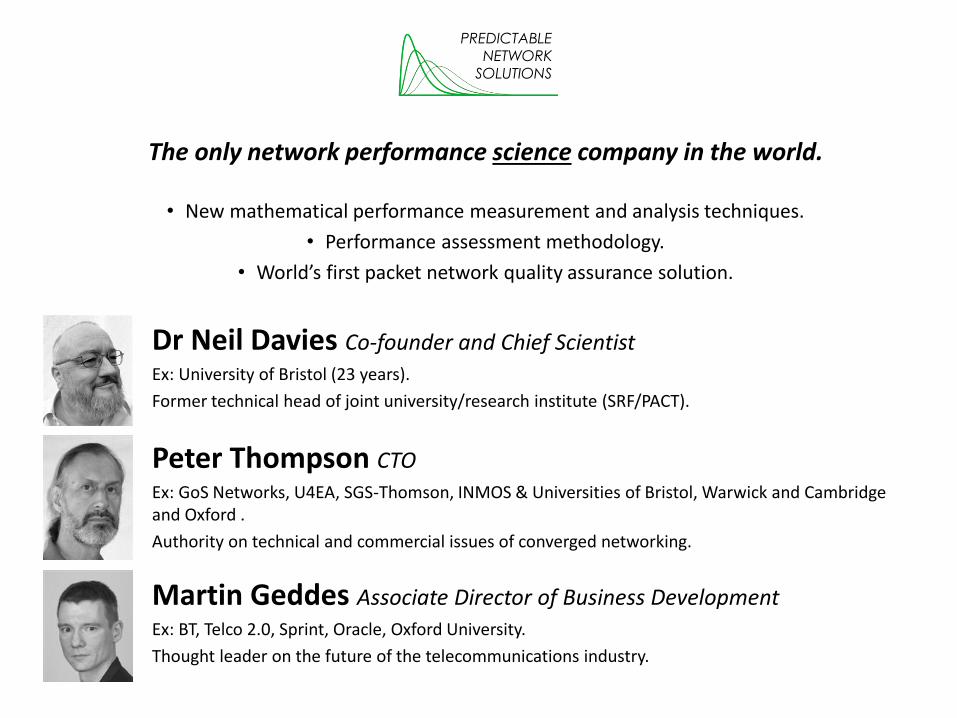
Customer Experience and Service Quality
Millions of users
1001 1110 1011 0001 1011
Billions of packets 3
How are customer experience and service quality
related?
SQM
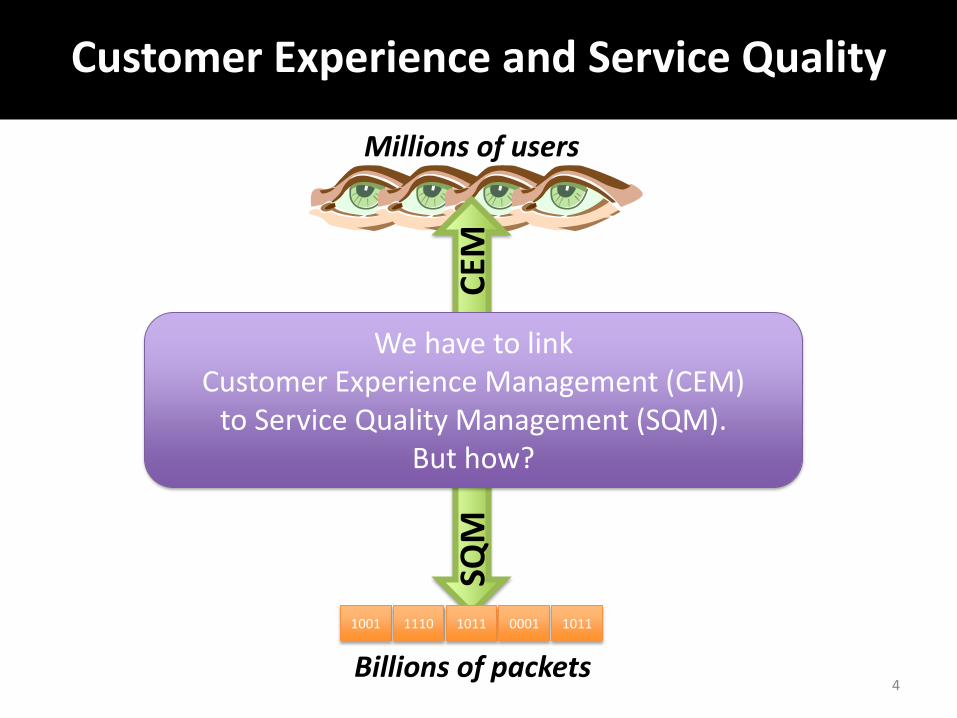
Customer Experience and Service Quality
Millions of users
1001 1110 1011 0001 1011
Billions of packets
CEM
4
We have to link Customer Experience Management (CEM)
to Service Quality Management (SQM). But how?
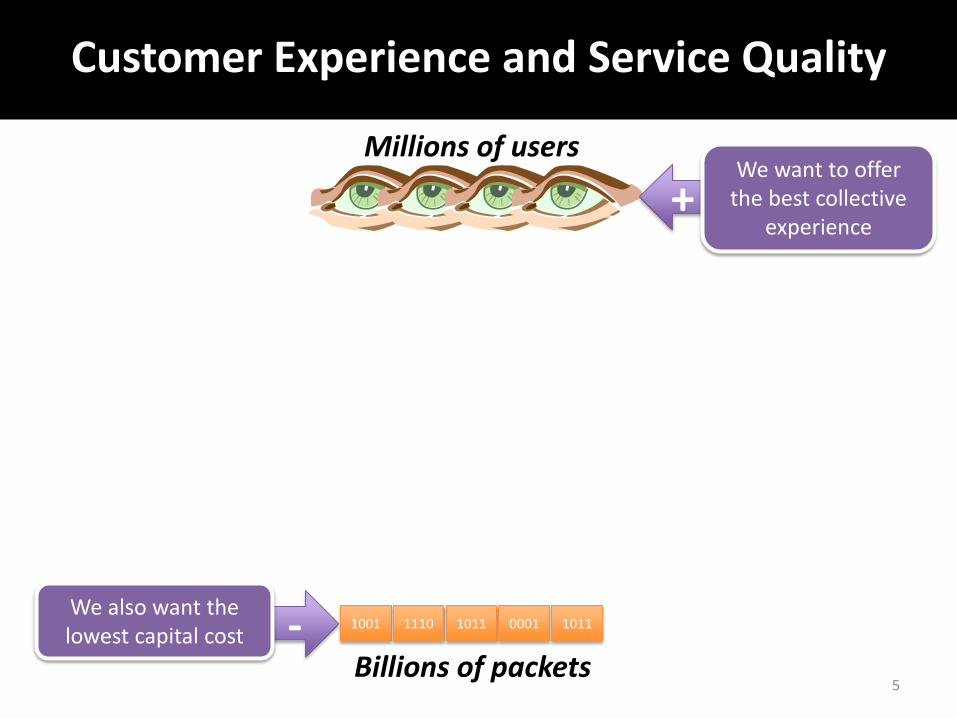
Customer Experience and Service Quality
Millions of users
1001 1110 1011 0001 1011
Billions of packets
+ We want to offer
the best collective experience
- We also want the lowest capital cost
5
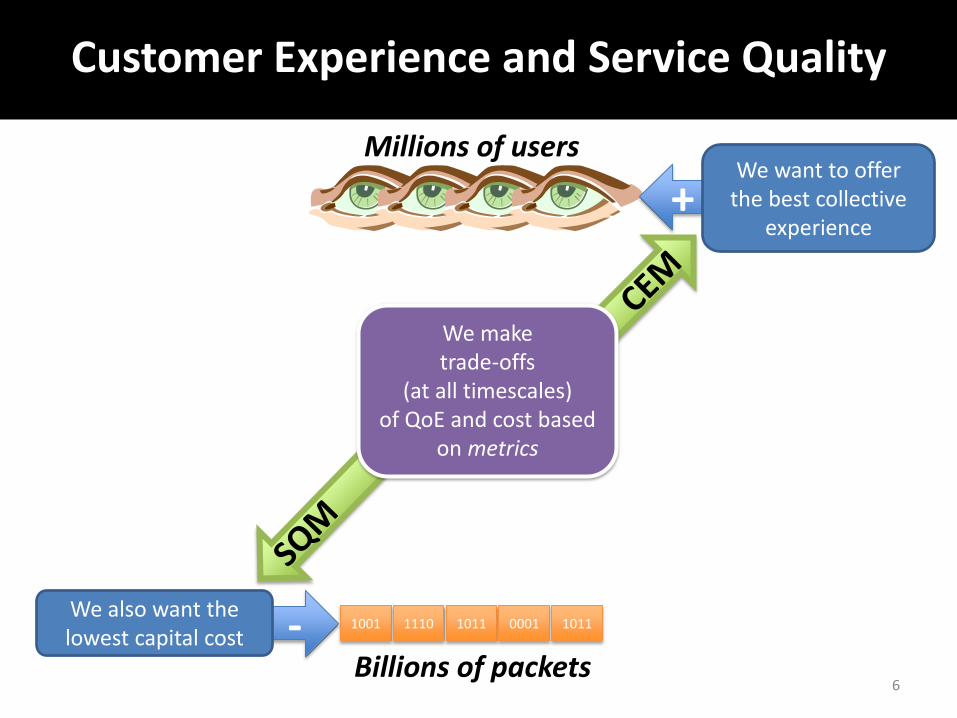
Customer Experience and Service Quality
Millions of users
1001 1110 1011 0001 1011
Billions of packets
+ We want to offer
the best collective experience
- We also want the lowest capital cost
We make trade-offs
(at all timescales) of QoE and cost based
on metrics
6
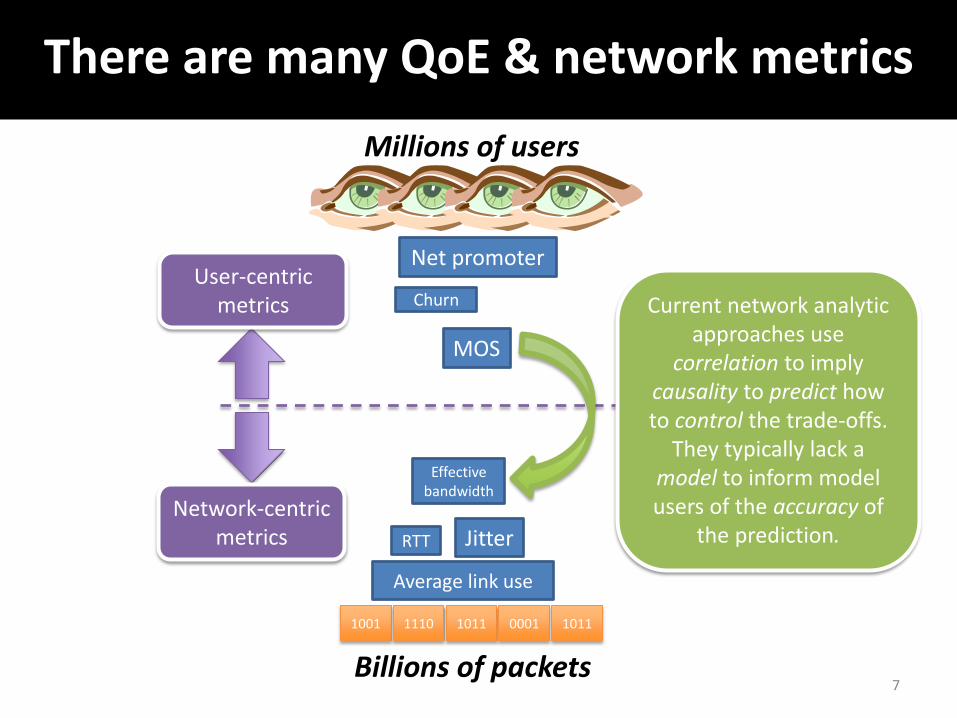
Net promoter
There are many QoE & network metrics
Jitter
Millions of users
1001 1110 1011 0001 1011
Billions of packets
MOS
Average link use
Effective bandwidth
User-centric metrics
Network-centric metrics
Current network analytic approaches use
correlation to imply causality to predict how to control the trade-offs.
They typically lack a model to inform model users of the accuracy of
the prediction. RTT
Churn
7
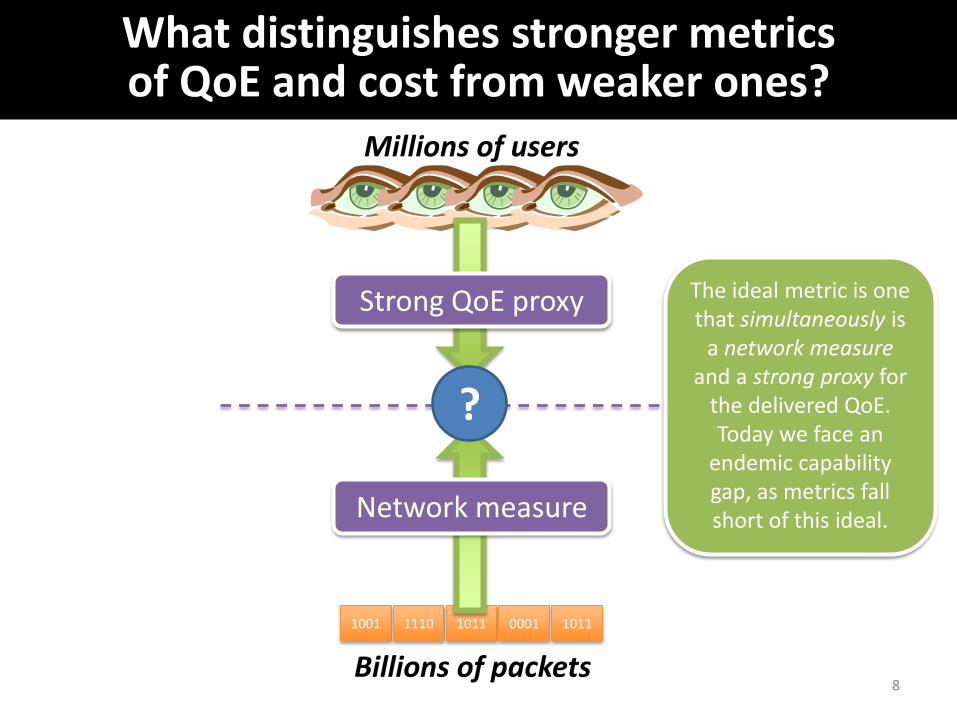
What distinguishes stronger metrics of QoE and cost from weaker ones?
Millions of users
1001 1110 1011 0001 1011
Billions of packets
Strong QoE proxy
Network measure
?
8
The ideal metric is one that simultaneously is
a network measure and a strong proxy for
the delivered QoE. Today we face an
endemic capability gap, as metrics fall short of this ideal.
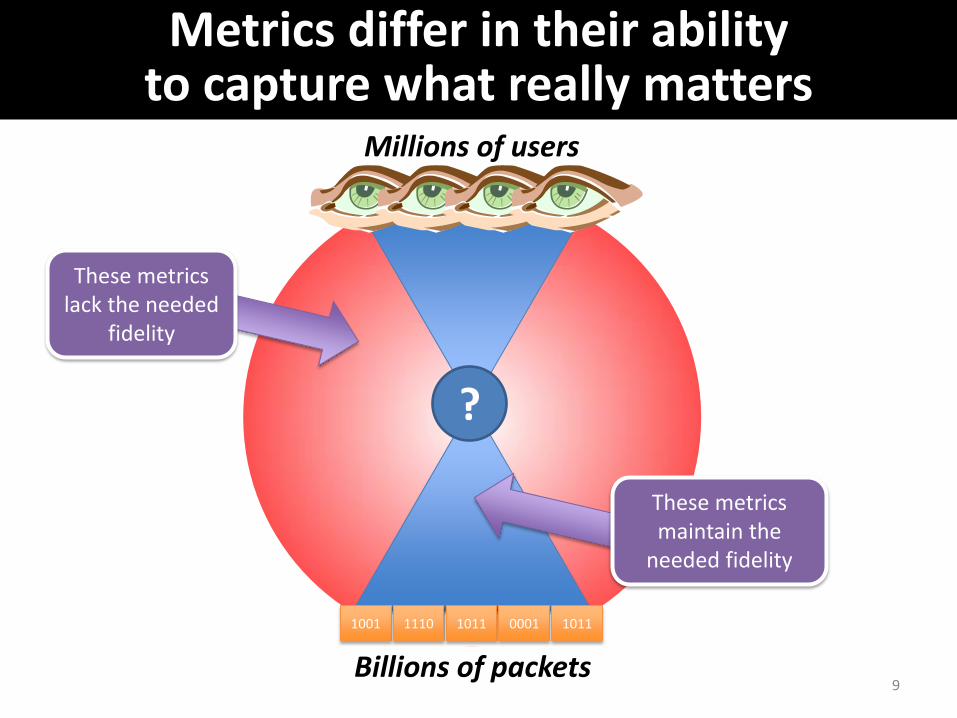
Metrics differ in their ability to capture what really matters
Millions of users
1001 1110 1011 0001 1011
Billions of packets
These metrics maintain the
needed fidelity
These metrics lack the needed
fidelity
?
9
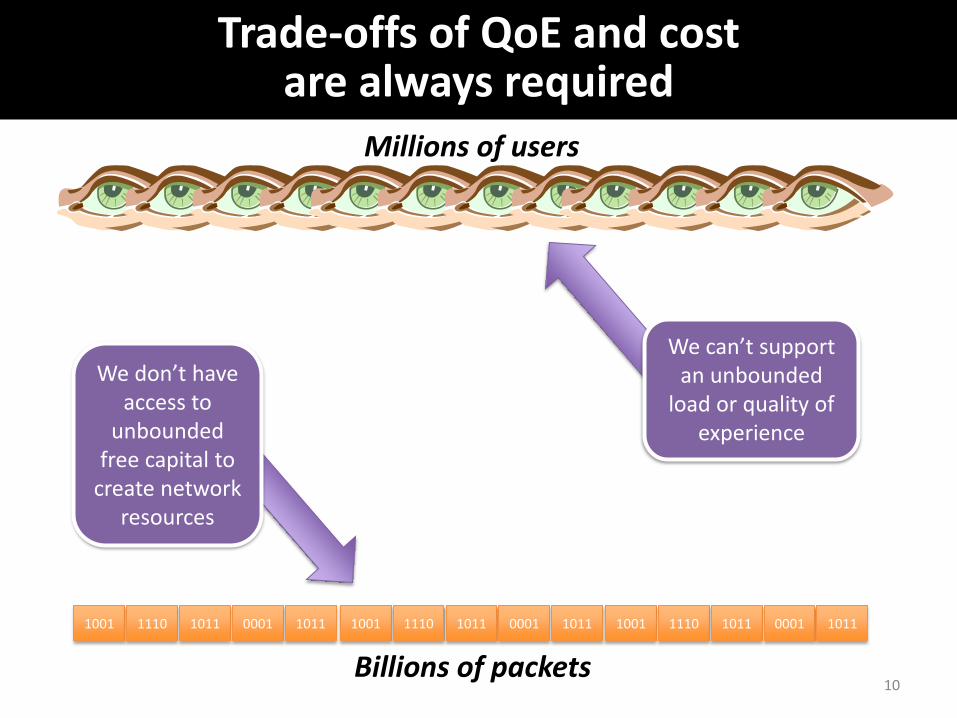
Trade-offs of QoE and cost are always required
Millions of users
1001 1110 1011 0001 1011
Billions of packets 10
1001 1110 1011 0001 1011 1001 1110 1011 0001 1011
We can’t support an unbounded
load or quality of experience
We don’t have access to
unbounded free capital to
create network resources
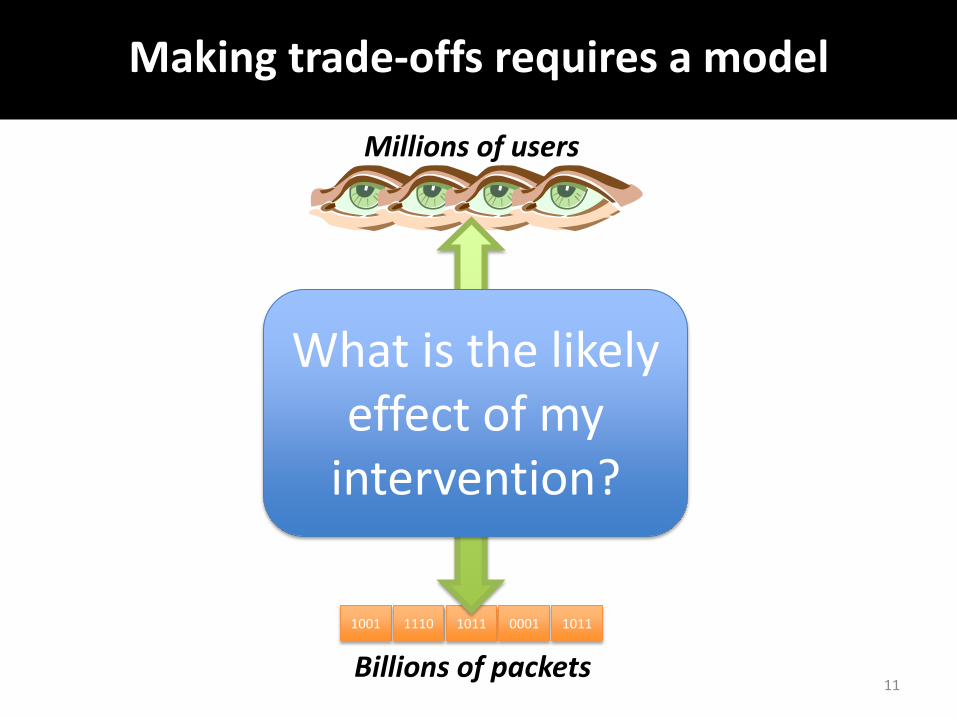
Making trade-offs requires a model
Millions of users
1001 1110 1011 0001 1011
Billions of packets 11
What is the likely effect of my
intervention?
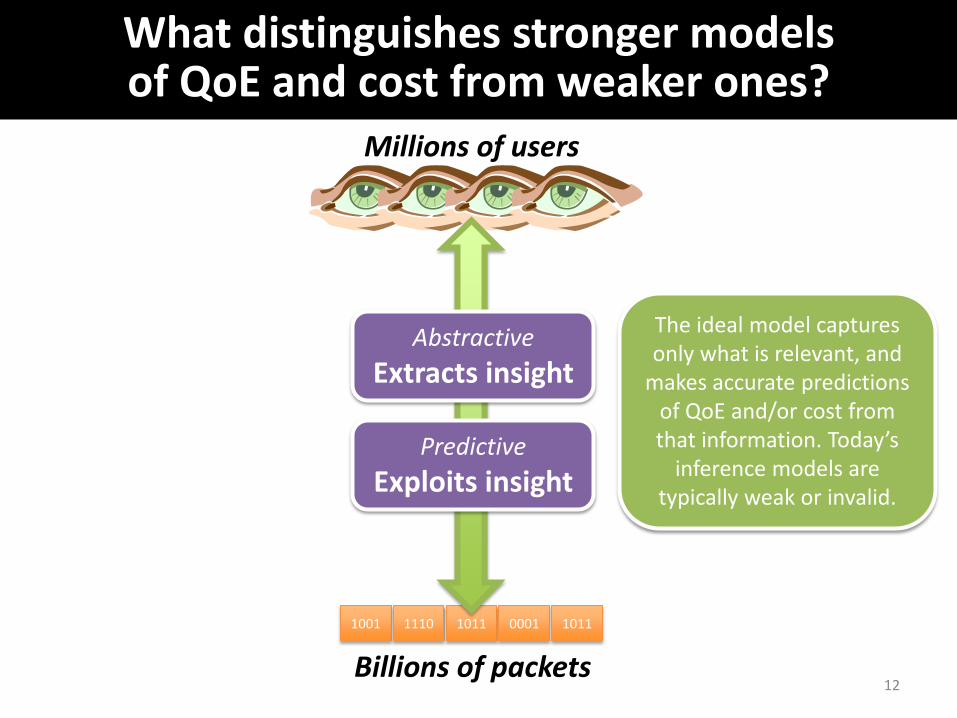
What distinguishes stronger models of QoE and cost from weaker ones?
Millions of users
1001 1110 1011 0001 1011
Billions of packets
Abstractive
Extracts insight
Predictive
Exploits insight
12
The ideal model captures only what is relevant, and
makes accurate predictions of QoE and/or cost from that information. Today’s
inference models are typically weak or invalid.
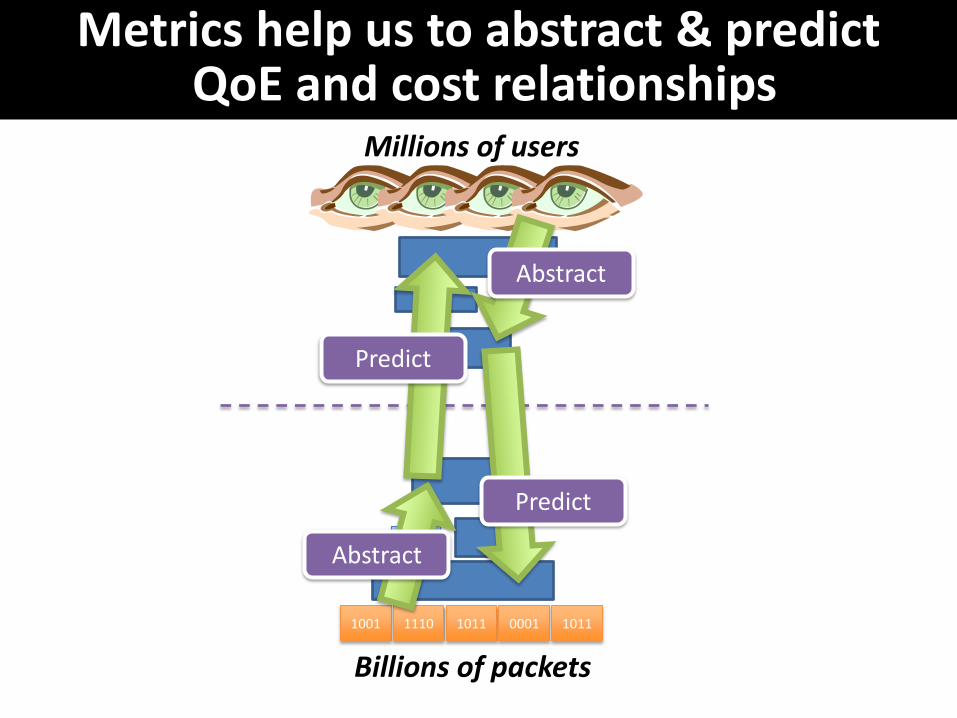
Metrics help us to abstract & predict QoE and cost relationships
Millions of users
1001 1110 1011 0001 1011
Billions of packets
Abstract
Predict
Abstract
Predict
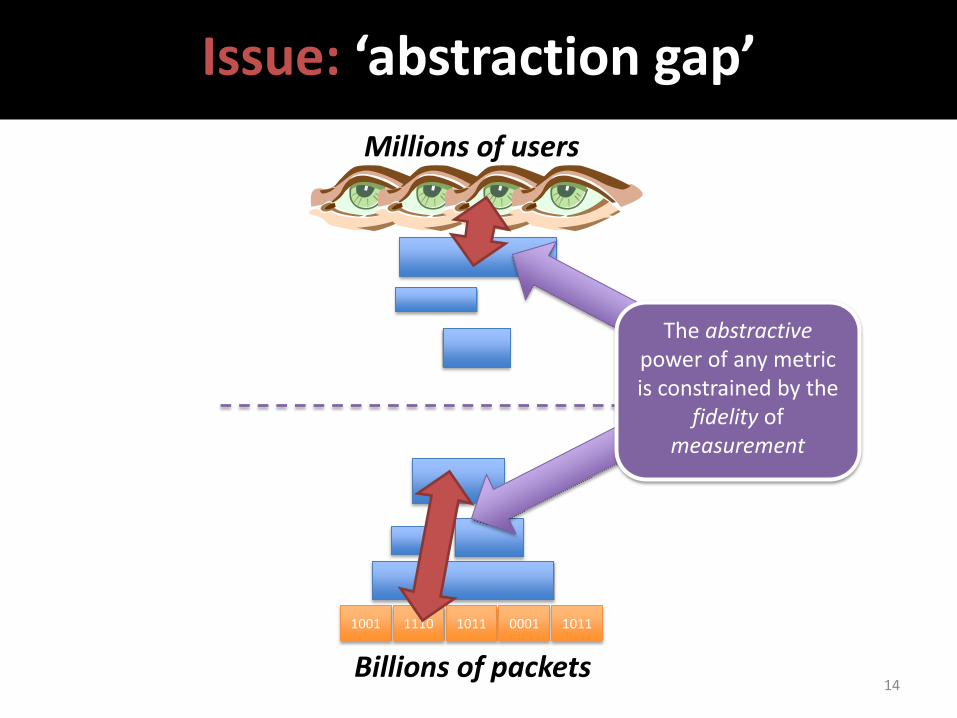
Issue: ‘abstraction gap’
Millions of users
1001 1110 1011 0001 1011
Billions of packets
The abstractive power of any metric is constrained by the
fidelity of measurement
14
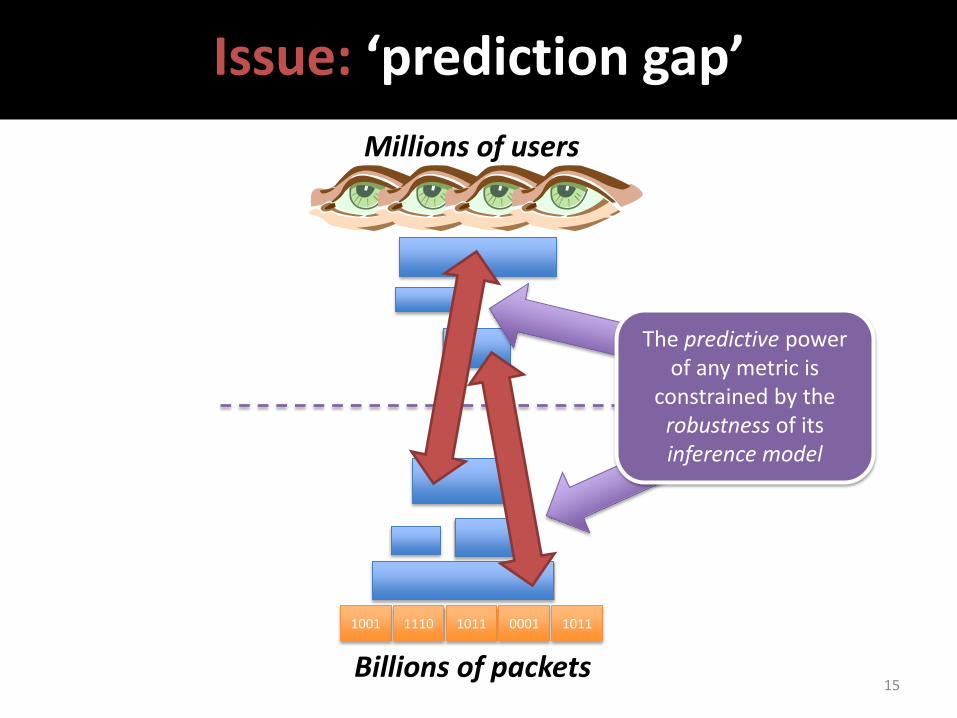
Issue: ‘prediction gap’
Millions of users
1001 1110 1011 0001 1011
Billions of packets
The predictive power of any metric is
constrained by the robustness of its inference model
15
So why do we have these gaps?
Experience without theory teaches nothing
— W Edwards Deming
(and we, as an industry, are lacking sufficient theory)
16
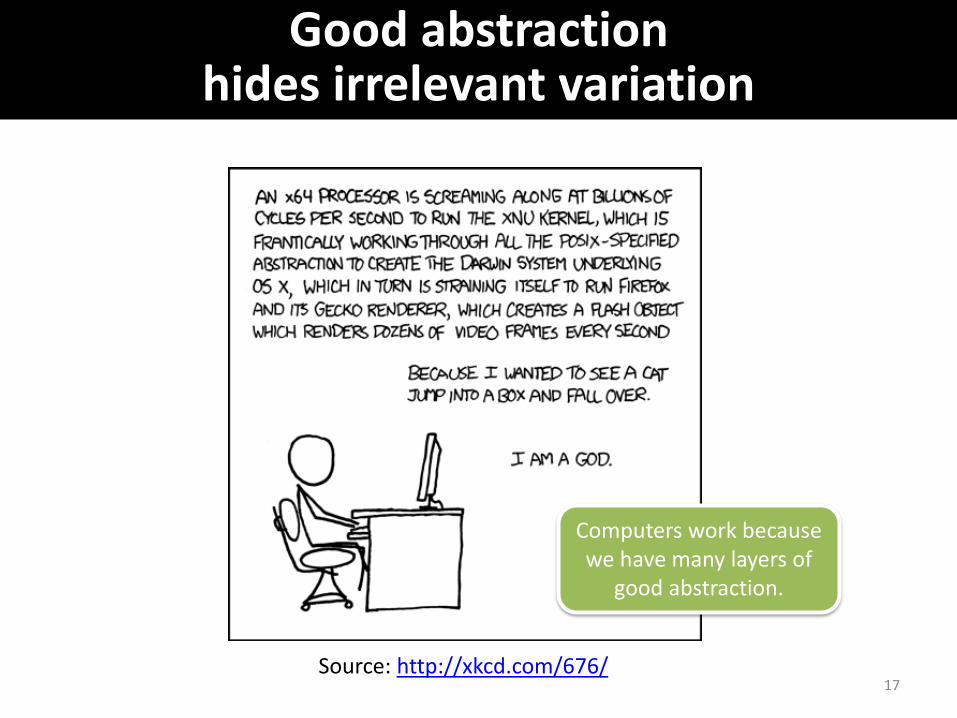
Good abstraction hides irrelevant variation
Source: http://xkcd.com/676/ 17
Computers work because we have many layers of
good abstraction.
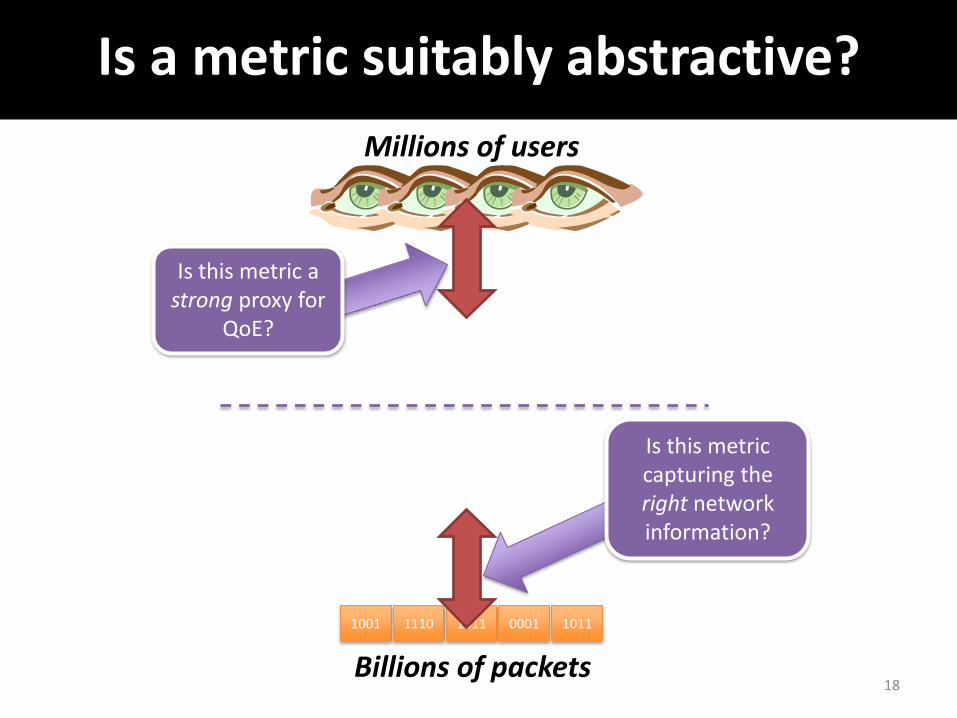
Is a metric suitably abstractive?
Millions of users
1001 1110 1011 0001 1011
Billions of packets
Is this metric capturing the right network information?
Is this metric a strong proxy for
QoE?
18

Without a model you have no abstractive power
© Predictable Network Solutions 2013 19
1:1 scale map of London (not very useful as lacks abstraction)
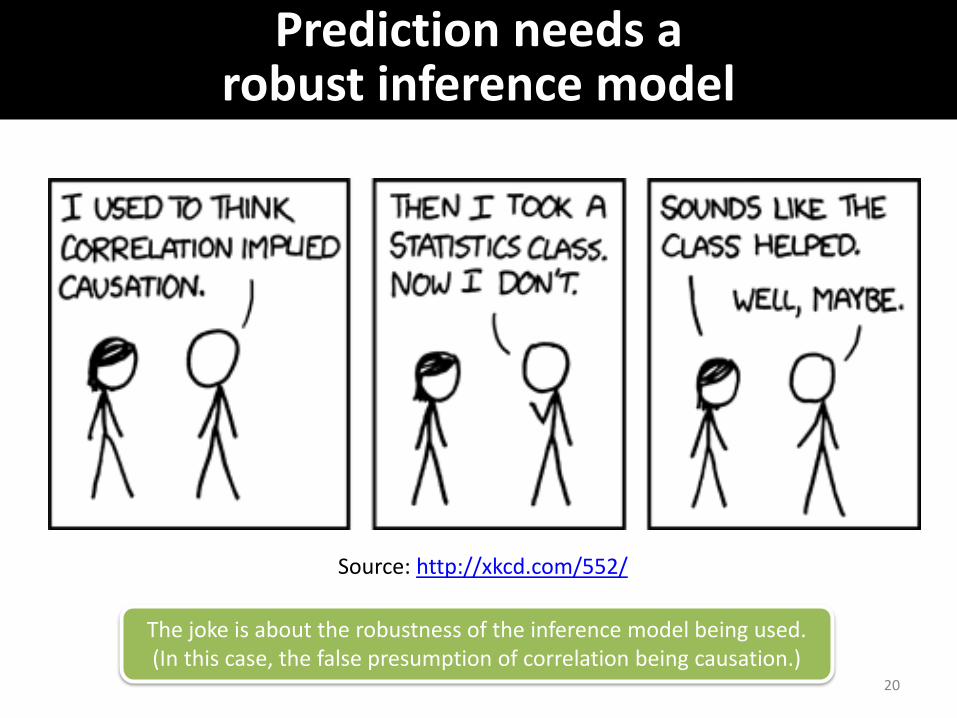
Prediction needs a robust inference model
20
Source: http://xkcd.com/552/
The joke is about the robustness of the inference model being used. (In this case, the false presumption of correlation being causation.)
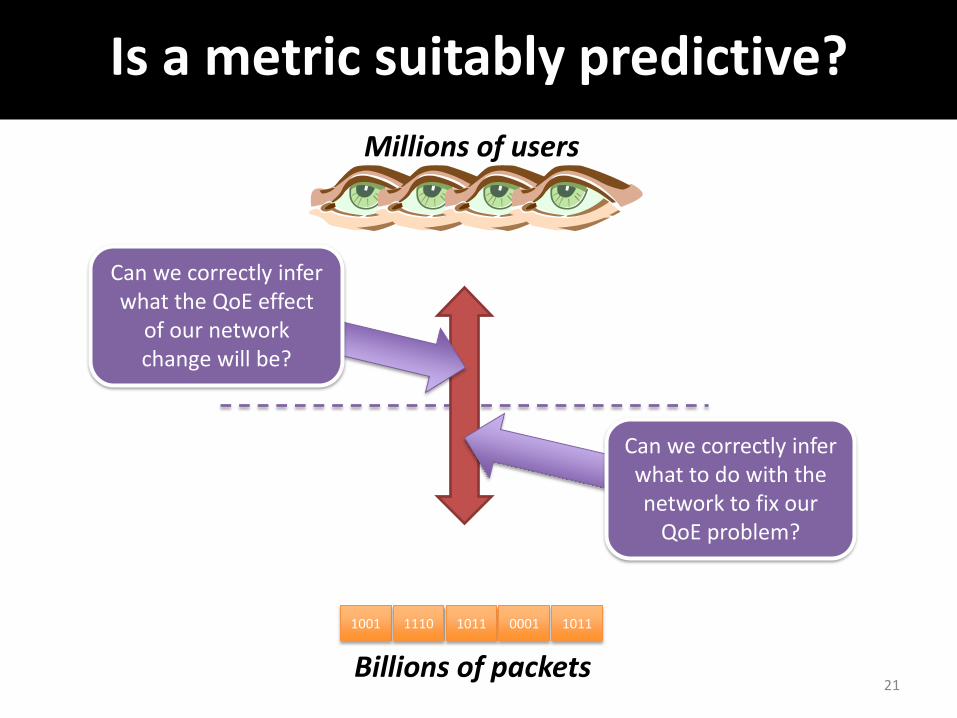
Is a metric suitably predictive?
Millions of users
1001 1110 1011 0001 1011
Billions of packets
Can we correctly infer what to do with the network to fix our
QoE problem?
Can we correctly infer what the QoE effect
of our network change will be?
21
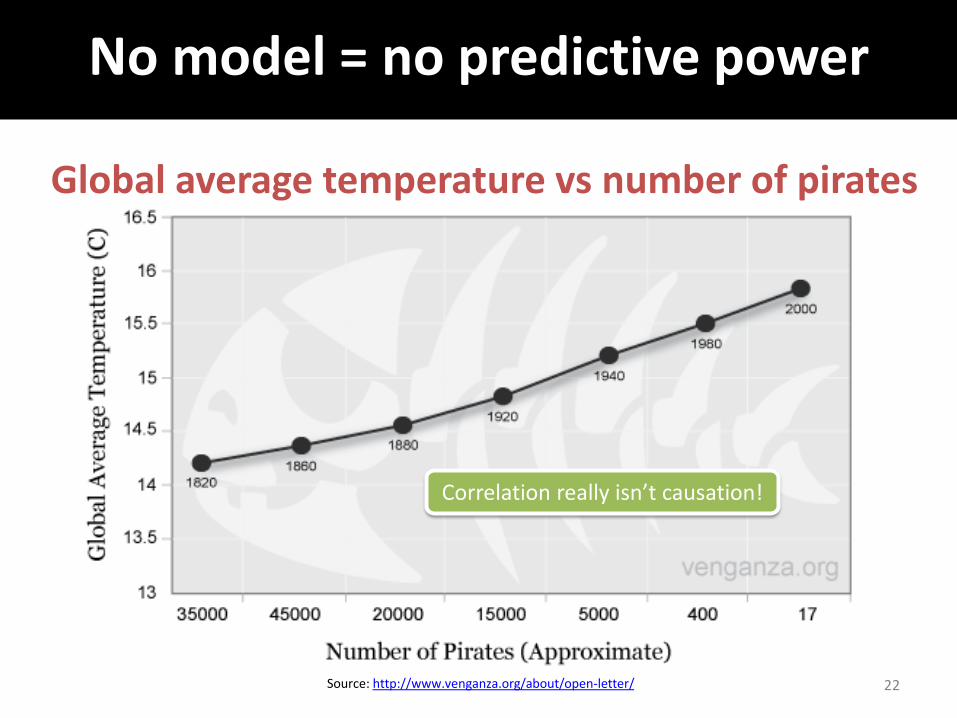
No model = no predictive power
Source: http://www.venganza.org/about/open-letter/
Global average temperature vs number of pirates
22
Correlation really isn’t causation!
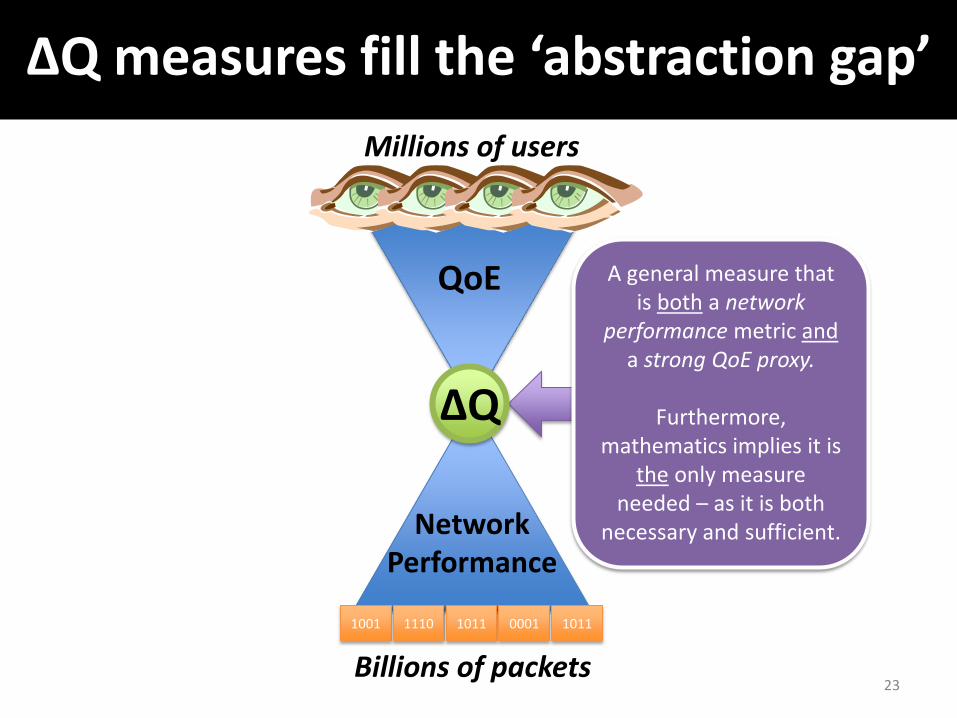
ΔQ measures fill the ‘abstraction gap’
Millions of users
1001 1110 1011 0001 1011
Billions of packets
A general measure that is both a network
performance metric and a strong QoE proxy.
Furthermore,
mathematics implies it is the only measure
needed – as it is both necessary and sufficient.
ΔQ
QoE
Network Performance
23
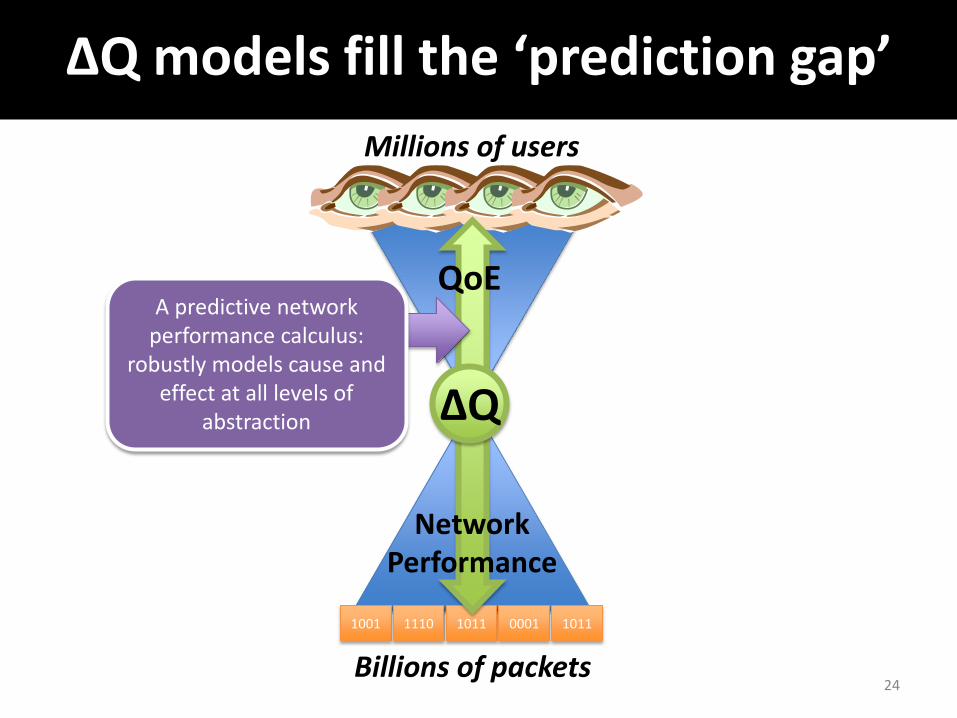
ΔQ models fill the ‘prediction gap’
Millions of users
1001 1110 1011 0001 1011
Billions of packets
ΔQ
A predictive network performance calculus:
robustly models cause and effect at all levels of
abstraction
QoE
Network Performance
24
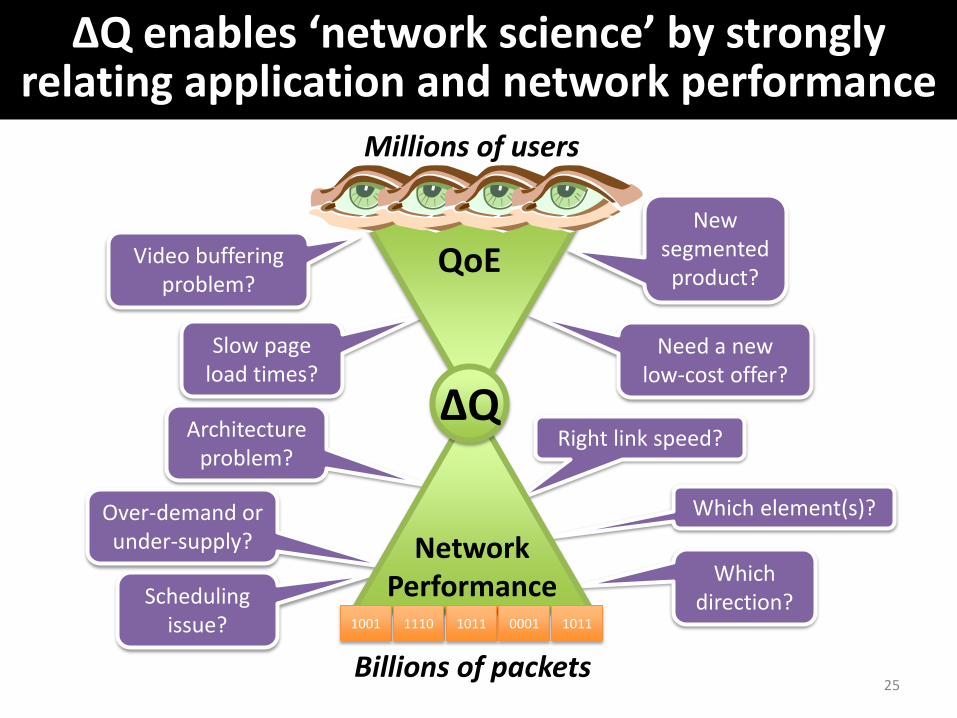
Right link speed?
New segmented product?
Video buffering problem?
Which direction?
Architecture problem?
Scheduling issue?
Over-demand or under-supply?
Which element(s)?
Slow page load times?
Need a new low-cost offer?
ΔQ enables ‘network science’ by strongly relating application and network performance
QoE
Network Performance
Millions of users
1001 1110 1011 0001 1011
Billions of packets
ΔQ
25
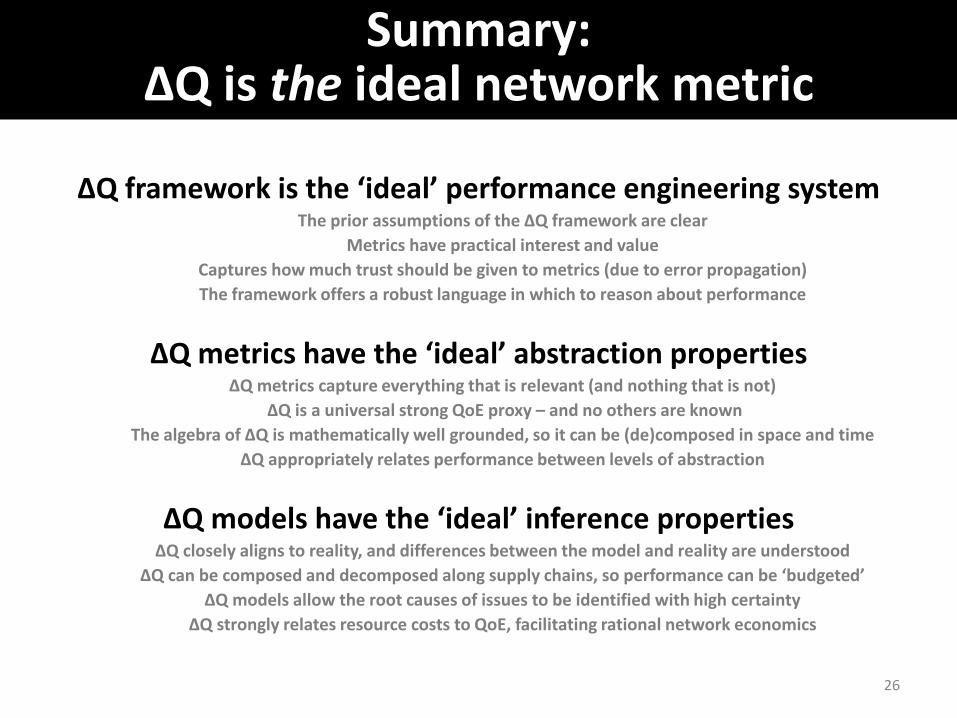
Summary: ∆Q is the ideal network metric
∆Q framework is the ‘ideal’ performance engineering system The prior assumptions of the ∆Q framework are clear
Metrics have practical interest and value
Captures how much trust should be given to metrics (due to error propagation)
The framework offers a robust language in which to reason about performance
∆Q metrics have the ‘ideal’ abstraction properties ∆Q metrics capture everything that is relevant (and nothing that is not)
∆Q is a universal strong QoE proxy – and no others are known
The algebra of ∆Q is mathematically well grounded, so it can be (de)composed in space and time
∆Q appropriately relates performance between levels of abstraction
∆Q models have the ‘ideal’ inference properties ∆Q closely aligns to reality, and differences between the model and reality are understood
∆Q can be composed and decomposed along supply chains, so performance can be ‘budgeted’
∆Q models allow the root causes of issues to be identified with high certainty
∆Q strongly relates resource costs to QoE, facilitating rational network economics
26

We can help you!
Measure the true customer experience with high fidelity metrics
Isolate the root cause of QoE issues in your supply chain with scientific accuracy
Safely optimise the trade-off of QoE and cost
Get in touch! [email protected]
27