Embed Size (px)
Citation preview

Investigating the 3D structure of the genome withHi-C data analysis
Sylvain Foissac & Nathalie Villa-Vialaneix
Séminaire MIAT - Toulouse, 2 juin 2017
SF & NV2 | Hi-C data analysis 1/28

Sommaire
1 Normalization
2 TAD identification
3 A/B compartments
4 Differential analysis
SF & NV2 | Hi-C data analysis 2/28

Sommaire
1 Normalization
2 TAD identification
3 A/B compartments
4 Differential analysis
SF & NV2 | Hi-C data analysis 3/28

Purpose of normalization
1 within matrix normalization: make bins comparable within a matrix(not needed for differential analysis)
2 between matrix normalization: make the same bin pair comparablebetween two matrices (needed for differential analysis)
SF & NV2 | Hi-C data analysis 4/28

Purpose of normalization
1 within matrix normalization: make bins comparable within a matrix(not needed for differential analysis)
2 between matrix normalization: make the same bin pair comparablebetween two matrices (needed for differential analysis)
SF & NV2 | Hi-C data analysis 4/28
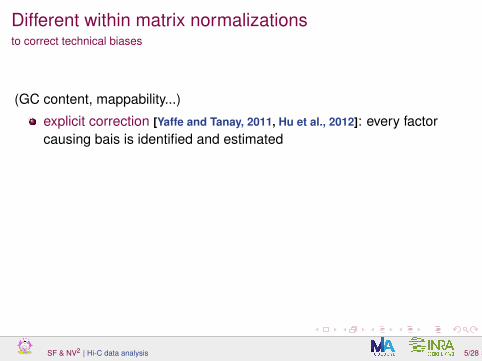
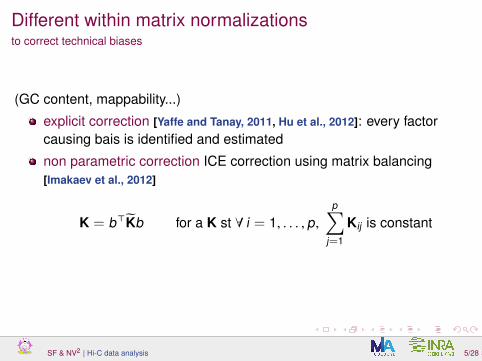
Different within matrix normalizationsto correct technical biases
(GC content, mappability...)
explicit correction [Yaffe and Tanay, 2011, Hu et al., 2012]: every factorcausing bais is identified and estimated
non parametric correction ICE correction using matrix balancing[Imakaev et al., 2012]
K = b>K̃b for a K st ∀ i = 1, . . . , p,p∑
j=1
Kij is constant
SF & NV2 | Hi-C data analysis 5/28

Different within matrix normalizationsto correct technical biases
picture from [Schmitt et al., 2016]
SF & NV2 | Hi-C data analysis 5/28

Different within matrix normalizationsto take distances into account
theoretical distribution taken from [Belton et al., 2012]
K̃dij =
Kij − Kd(i,j)
σ(Dd(i,j))with
{Kd average counts at distance dσ(Dd) standard deviation
available in HiTC [Servant et al., 2012]
SF & NV2 | Hi-C data analysis 6/28

Between matrix normalizationcorrect for differences in sequencing depth
standard approach: similar to RNA-seq normalization
However...
density adjustment by LOESS fit [Robinson and Oshlack, 2010]
(implemented in csaw)
SF & NV2 | Hi-C data analysis 7/28

Between matrix normalizationcorrect for differences in sequencing depth
standard approach: similar to RNA-seq normalizationHowever...
density adjustment by LOESS fit [Robinson and Oshlack, 2010]
(implemented in csaw)
SF & NV2 | Hi-C data analysis 7/28

Between matrix normalizationcorrect for differences in sequencing depth
standard approach: similar to RNA-seq normalizationHowever...
density adjustment by LOESS fit [Robinson and Oshlack, 2010]
(implemented in csaw)
SF & NV2 | Hi-C data analysis 7/28

Sommaire
1 Normalization
2 TAD identification
3 A/B compartments
4 Differential analysis
SF & NV2 | Hi-C data analysis 8/28

Topologically Associated Domains (TADs)
[Rao et al., 2014]
SF & NV2 | Hi-C data analysis 9/28

TAD method jungleDirectionality index [Dixon et al., 2012]: compute divergence betweenup/downstream interaction counts + HMM to identify TADs
armatus [Filippova et al., 2013]: maximize a criteria which evaluate awithin/between count ratio + combine multi-resolution results in aconsensual segmentationsegmentation method [Brault et al., 2017]: block boundary estimation inmatrix... (many others), interestingly, very few provides a hierarchicalclusteringComparisons in: [Fotuhi Siahpirani et al., 2016, Dali and Blanchette, 2017]
SF & NV2 | Hi-C data analysis 10/28

TAD method jungleDirectionality index [Dixon et al., 2012]: compute divergence betweenup/downstream interaction counts + HMM to identify TADsarmatus [Filippova et al., 2013]: maximize a criteria which evaluate awithin/between count ratio + combine multi-resolution results in aconsensual segmentation
segmentation method [Brault et al., 2017]: block boundary estimation inmatrix... (many others), interestingly, very few provides a hierarchicalclusteringComparisons in: [Fotuhi Siahpirani et al., 2016, Dali and Blanchette, 2017]
SF & NV2 | Hi-C data analysis 10/28

TAD method jungleDirectionality index [Dixon et al., 2012]: compute divergence betweenup/downstream interaction counts + HMM to identify TADsarmatus [Filippova et al., 2013]: maximize a criteria which evaluate awithin/between count ratio + combine multi-resolution results in aconsensual segmentationsegmentation method [Brault et al., 2017]: block boundary estimation inmatrix
... (many others), interestingly, very few provides a hierarchicalclusteringComparisons in: [Fotuhi Siahpirani et al., 2016, Dali and Blanchette, 2017]
SF & NV2 | Hi-C data analysis 10/28

TAD method jungleDirectionality index [Dixon et al., 2012]: compute divergence betweenup/downstream interaction counts + HMM to identify TADsarmatus [Filippova et al., 2013]: maximize a criteria which evaluate awithin/between count ratio + combine multi-resolution results in aconsensual segmentationsegmentation method [Brault et al., 2017]: block boundary estimation inmatrix... (many others), interestingly, very few provides a hierarchicalclusteringComparisons in: [Fotuhi Siahpirani et al., 2016, Dali and Blanchette, 2017]
SF & NV2 | Hi-C data analysis 10/28

DI evolution with respect to armatus TADs
SF & NV2 | Hi-C data analysis 11/28

CTCF at TAD boundaries
SF & NV2 | Hi-C data analysis 12/28
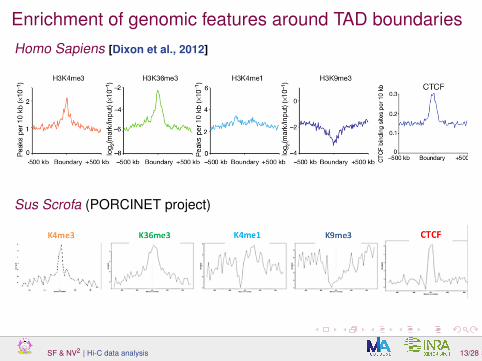
Enrichment of genomic features around TAD boundariesHomo Sapiens [Dixon et al., 2012]
Sus Scrofa (PORCINET project)
SF & NV2 | Hi-C data analysis 13/28

Current methodological developmentConstrained HAC as a way to compare/combine TADs between samplesContrained HAC: Hierarchical clustering with contiguity constrains
Challenges (currently under development with Pierre Neuvial and MarieChavent):
methodological issues: what happens when using Ward’s linkagecriterion with a non Euclidean similarity (counts of the Hi-C matrix)?what happens when adding constrains to HAC? (partially solved)development of the R package adjclust (Google Summer of Codeselected project)
SF & NV2 | Hi-C data analysis 14/28

Sommaire
1 Normalization
2 TAD identification
3 A/B compartments
4 Differential analysis
SF & NV2 | Hi-C data analysis 15/28

A/B compartments
[Lieberman-Aiden et al., 2009]
[Giorgetti et al., 2013]
Method (in theory):
compute Pearson correlations between bins(using interaction counts with all the other binsof the same chromosome)
compute eigenvectors (or perform PCA) on thiscorrelation matrix
affect A/B compartments to +/- values of PCs
SF & NV2 | Hi-C data analysis 16/28

A/B compartments in practiceafter ICED and distance-based normalizations
Method:
differentiate between A/B using sign of the correlation between PCsand diagonal counts
choose a relevant PC and method maximizing − log10(p − value)between diagonal counts in +/- PC (2-group comparison Student test)
SF & NV2 | Hi-C data analysis 17/28

A/B compartments in practice
after ICED and distance-based normalizations
Method:
differentiate between A/B using sign of the correlation between PCsand diagonal counts
choose a relevant PC and method maximizing − log10(p − value)between diagonal counts in +/- PC (2-group comparison Student test)
SF & NV2 | Hi-C data analysis 17/28

Biological validation
SF & NV2 | Hi-C data analysis 18/28

Sommaire
1 Normalization
2 TAD identification
3 A/B compartments
4 Differential analysis
SF & NV2 | Hi-C data analysis 19/28

FilteringIn differential analysis of sequencing data, filtering is a crucial step:
removing low count features (that are little or no chance to be founddifferential) improves the test power (leverage the multiple testingcorrection effect) and can save unnecessary computational time
can be performed 1/ at the beginning of the analysis or after theestimation of the parameters of the model used for differentialanalysis
; 2/ can be fixed to an arbitrary value (minimum total countper sample) or automated from the data
500 kb - automatic filter (filters counts<∼ 5) - 96.4% of pairs filtered out
before filtering after filtering
SF & NV2 | Hi-C data analysis 20/28

FilteringIn differential analysis of sequencing data, filtering is a crucial step:
removing low count features (that are little or no chance to be founddifferential) improves the test power (leverage the multiple testingcorrection effect) and can save unnecessary computational timecan be performed 1/ at the beginning of the analysis or after theestimation of the parameters of the model used for differentialanalysis
; 2/ can be fixed to an arbitrary value (minimum total countper sample) or automated from the data
500 kb - automatic filter (filters counts<∼ 5) - 96.4% of pairs filtered out
before filtering after filtering
SF & NV2 | Hi-C data analysis 20/28

FilteringIn differential analysis of sequencing data, filtering is a crucial step:
removing low count features (that are little or no chance to be founddifferential) improves the test power (leverage the multiple testingcorrection effect) and can save unnecessary computational timecan be performed 1/ at the beginning of the analysis or after theestimation of the parameters of the model used for differentialanalysis; 2/ can be fixed to an arbitrary value (minimum total countper sample) or automated from the data
for Hi-C data:filtering was performed at the beginning of the analysis (to limit thecomputation burden)was performed by using an arbitrary threshold or a threshold basedon the estimation of the noise background by a quantile ofinter-chromosomal counts (as in R package diffHic)
500 kb - automatic filter (filters counts<∼ 5) - 96.4% of pairs filtered out
before filtering after filtering
SF & NV2 | Hi-C data analysis 20/28

FilteringIn differential analysis of sequencing data, filtering is a crucial step:
removing low count features (that are little or no chance to be founddifferential) improves the test power (leverage the multiple testingcorrection effect) and can save unnecessary computational timecan be performed 1/ at the beginning of the analysis or after theestimation of the parameters of the model used for differentialanalysis; 2/ can be fixed to an arbitrary value (minimum total countper sample) or automated from the data
500 kb - automatic filter (filters counts<∼ 5) - 96.4% of pairs filtered out
before filtering after filtering
SF & NV2 | Hi-C data analysis 20/28

Exploratory analysis (500kb bins)chromosome 1
1 0.911
1
0.8886
0.8866
1
0.8566
0.8651
0.8288
1
0.8973
0.9118
0.8912
0.8692
1
0.8935
0.9032
0.8818
0.8799
0.906
1
LW90−160216−GCCAAT
LW90−160223−CTTGTA
LW90−160308−AGTTCC
LW110−160307−CGATGT
LW110−160308−AGTCAA
LW110−160517−ACAGTG
LW90
−160
216−
GCCAAT
LW90
−160
223−
CTTGTA
LW90
−160
308−
AGTTCC
LW11
0−16
0307
−CGAT
GT
LW11
0−16
0308
−AGTCAA
LW11
0−16
0517
−ACAGTG
−1.0 −0.5 0.0 0.5 1.0
Cosinus (Frobenius norm)
good reproducibility betweenexperiments
no clear organization with respect tothe condition
all data after filtering and betweenmatrix normalization (LOESS)
2 outliers but PC1 is organized withrespect to the condition
SF & NV2 | Hi-C data analysis 21/28

Methods for differential analysis of Hi-CSimilar to RNA-seq [Lun and Smyth, 2015] and R package diffHic(essentially a wrapper for edgeR):
count data modeled by Binomial Negative distribution
parameters (mean, variance per gene) are estimated from data: avariance vs mean relationship is modeled
test is performed using an exact test (similar to Fisher) or alog-likelihood ratio test (GLM model)
SF & NV2 | Hi-C data analysis 22/28

Complementary remarks about DE analysis
Hi-C data contain more zeros than RNA-seq data: some peoplepropose to use Zero Inflated BN distribution (unpublished as far as Iknow)
provides a p-value for every pair of bins:I analysis based on a very large number of bins for finer resolutions
(500kb after filtering: 998 623 pairs of bins; without filtering:13 509 221 pairs of bins): problem solved for 500kb bins but still understudy for 40kb bins
I tests are performed as if bin pairs were independant whereas they arespatially correlated
: estimation of model parameters might be improvedif 1/ smoothed with respect to spatial proximity (similar to what issometimes performed methylation data analysis); 2/ performedindependantly for pairs of bins at a given distance (future work).
post-analysis of spatial distribution of p-values, work-in-progress withPierre Neuvial (submitted CNRS project)
SF & NV2 | Hi-C data analysis 23/28

Complementary remarks about DE analysis
Hi-C data contain more zeros than RNA-seq data: some peoplepropose to use Zero Inflated BN distribution (unpublished as far as Iknow)
provides a p-value for every pair of bins:I analysis based on a very large number of bins for finer resolutions
(500kb after filtering: 998 623 pairs of bins; without filtering:13 509 221 pairs of bins): problem solved for 500kb bins but still understudy for 40kb bins
I tests are performed as if bin pairs were independant whereas they arespatially correlated: estimation of model parameters might be improvedif 1/ smoothed with respect to spatial proximity (similar to what issometimes performed methylation data analysis); 2/ performedindependantly for pairs of bins at a given distance (future work).
post-analysis of spatial distribution of p-values, work-in-progress withPierre Neuvial (submitted CNRS project)
SF & NV2 | Hi-C data analysis 23/28

because last page had no pictureprobably not suited for the youngest
SF & NV2 | Hi-C data analysis 24/28

Preliminary results
913 bin pairs found differential (after multiple testing correction)
most of them are related to 3 chromosomes
parameter setting (filters...) and biological analysis are work-in-progress...
SF & NV2 | Hi-C data analysis 25/28

Differential TADs (state-of-the-art)Detecting differential domains between the two conditionsExisting approaches:
[Fraser et al., 2015] (3 conditions, no replicate)I HMM on TAD boundaries (with a tolerance threshold) to identify
different TAD boundaries between samplesI HAC on TADs, cophenetic distance to obtain local conserved structure
by using a z-score approach
R package diffHic computes up/down-stream counts (with ± 100Kb)and uses the GLM model implemented in edgeR with an interactionbetween stream direction (up/down) and condition.
However, the first approach does not take biological variability into account(no replicate) and the second uses only a very aggregated criterion.
SF & NV2 | Hi-C data analysis 26/28

Differential TADs (perspectives)Ideas for future workUsing constrained HAC, are we able to:
compute a consensus dendrogram using several biological replicates;
differentiate branches significantly (in which sense?) differentbetween conditions taking into account the within condition variability?
SF & NV2 | Hi-C data analysis 27/28

Conclusions and perspectives
Honnestly, it’s late and I really do not believe that I will have enough time tomake a conclusion and discuss perspectives so...
Questions?
SF & NV2 | Hi-C data analysis 28/28

ReferencesBelton, J., Patton MacCord, R., Harmen Gibcus, J., Naumova, N., Zhan, Y., and Dekker, J. (2012).Hi-C: a comprehensive technique to capture the conformation of genomes.Methods, 58:268–276.
Brault, V., Chiquet, J., and Lévy-Leduc, C. (2017).Efficient block boundaries estimation in block-wise constant matrices: an application to HiC data.Electronic Journal of Statistics, 11(1):1570–1599.
Dali, R. and Blanchette, M. (2017).A critical assessment of topologically associating domain prediction tools.Nucleic Acid Research, 45(6):2994–3005.
Dixon, J., Selvaraj, S., Yue, F., Kim, A., Li, Y., Shen, Y., Hu, M., Liu, J., and Ren, B. (2012).Topological domains in mammalian genomes identified by analysis of chromatin interactions.Nature, 485:376–380.
Filippova, D., Patro, R., Duggal, G., and Kingsford, C. (2013).Identification of alternative topological domains in chromatin.Algorithms for Molecular Biology, 9:14.
Fotuhi Siahpirani, A., Ay, F., and Roy, S. (2016).A multi-task graph-clustering approach for chromosome conformation capture data sets identifies conserved modules ofchromosomal interactions.Genome Biology, 17:114.
Fraser, J., Ferrai, C., Chiariello, A., Schueler, M., Rito, T., Laudanno, G., Barbieri, M., Moore, B., Kraemer, D., Aitken, S., Xie, S.,Morris, K., Itoh, M., Kawaji, H., Jaeger, I., Hayashizaki, Y., Carninci, P., Forrest, A., The FANTOM Consortium, Semple, C.,Dostie, J., Pombo, A., and Nicodemi, M. (2015).Hierarchical folding and reorganization of chromosomes are linked to transcriptional changes in cellular differentiation.Molecular Systems Biology, 11:852.
Giorgetti, L., Servant, N., and Heard, E. (2013).Changes in the organization of the genome during the mammalian cell cycle.
SF & NV2 | Hi-C data analysis 28/28

Genome Biology, 14:142.
Hu, M., Deng, K., Selvaraj, S., Qin, Z., Ren, B., and Liu, J. (2012).HiCNorm: removing biases in Hi-C data via Poisson regression.Bioinformatics, 28(23):3131–3133.
Imakaev, M., Fudenberg, G., McCord, R., Naumova, N., Goloborodko, A., Lajoie, B., Dekker, J., and Mirny, L. (2012).Iterative correction of Hi-C data reveals hallmarks of chromosome organization.Nature Methods, 9:999–1003.
Lieberman-Aiden, E., van Berkum, N., Williams, L., Imakaev, M., Ragoczy, T., Telling, A., Amit, I., Lajoie, B., Sabo, P., Dorschner,M., Sandstrom, R., Bernstein, B., Bender, M., Groudine, M., Gnirke, A., Stamatoyannopoulos, J., Mirny, L., Lander, E., andDekker, J. (2009).Comprehensive mapping of long-range interactions reveals folding principles of the human genome.Science, 326(5950):289–293.
Lun, A. and Smyth, G. (2015).diffHic: a Bioconductor package to detect differential genomic interactions in Hi-C data.BMC Bioinformatics, 16:258.
Rao, S., Huntley, M., Durand, N., Stamenova, E., Bochkov, I., Robinson, J., Sanborn, A., Machol, I., Omer, A., Lander, E., andLieberman Aiden, E. (2014).A 3D map of the human genome at kilobase resolution reveals principle of chromatin looping.Cell, 159(7):1665–1680.
Robinson, M. and Oshlack, A. (2010).A scaling normalization method for differential expression analysis of RNA-seq data.Genome Biology, 11:R25.
Schmitt, A., Hu, M., and Ren, B. (2016).Genome-wide mapping and analysis of chromosome architecture.Nature Reviews, 17(12):743–755.
Servant, N., Lajoie, B., Nora, E., Giorgetti, L., Chen, C., Heard, E., Dekker, J., and Barillot, E. (2012).
SF & NV2 | Hi-C data analysis 28/28

HiTC: exploration of high-throughput ‘C’ experiments.Bioinformatics, 28(21):2843–2844.
Yaffe, E. and Tanay, A. (2011).Probabilistic modeling of Hi-C contact maps eliminates systematic biases to characterize global chromosomal architecture.Nature Genetics, 43:1059–1065.
SF & NV2 | Hi-C data analysis 28/28