Embed Size (px)
Citation preview

High resolution maps of PWV and 3D reconstruction of atmosphere refractivity
Giovanni Nico
Consiglio Nazionale delle Ricerche (CNR) Istituto per le Applicazioni del Calcolo (IAC)
Bari, Italy

Outline
Interesting features meterological datasets Active vs. passive remote sensing Interaction of e.m. with atmosphere Meteorological databases SAR interferometry (new high-resolution meteorological data?)
GPS tomography

What am I interested in?
Linear features are related to transport of moisture in atmosphere?
Laminar or turbolent flow ?
Are there frontal zones?
Are isolated anomalies related to some specific atmospheric phenomenon?
High resolution image of atmosphere

What am I interested in?
3D images of atmospheric refractivity
Can I identify/retrieve specific patterns ?
Relevance
I could better study/identify different types of clouds:
•Stratiform cloud •Small cumulus clouds •Cumulonimbus •Ice clouds
Deeper knowledge about atmospheric dynamics

Active vs. passive remote sensing
The Sun energy is reflected, for visible wavelengths, or absorbed and re-emited, as it is for thermal infrared.
detect energy when the naturally occurring energy is available
Passive Sensors can only take place during the day (sun) time
Thermal-IR energy can be detected by night or day as long as the amount of energy is large enough to be recorded.

Active vs. passive remote sensing
They provide their own energy source for illumination.
Active Sensors
The sensor emits radiation which is directed toward the target to be investigated. The radiation reflected from that target is detected and measured by the sensor.
The advantages of active sensors is that they can operate at any time of day
Active sensors can be used for examining wavelengths that are not sufficiently provided by the sun, such as microwaves.

Passive remote sensing
The microwave energy recorded by a passive sensor can be:
1. Emitted by the atmosphere
2. Reflected from the surface
3. Emitted from the surface
4. Transmitted from the subsurface
Because the wavelengths are so long, the energy available is quite small compared to optical wavelengths.
Thus, the fields of view must be large to detect enough energy to record a signal. Most passive microwave sensors are therefore characterized by low spatial resolution.

Active remote sensing
As with passive microwave sensing, a major advantage of radar is the capability of the radiation to penetrate through cloud cover and most weather conditions.
Because radar is an active sensor, it can also be used to image the surface at any time, day or night
The two main advantages are:
“All-weather”
“Day and Night”
Because of the fundamentally different way in which an active radar operates compared to the passive sensors a radar image is quite different from images acquired in the visible.

Active vs. passive RS images

Active vs. passive RS images

Interaction with atmosphere
Fevereiro 2012
DEGGE, João Catalão Fernandes [[email protected]]
11
Particles and gases in the atmosphere can affect the incoming light and radiation.
Two mechanisms:
Scattering
Absorption

Interaction with atmosphere
Scattering occurs when particles or large gas molecules present in the atmosphere interact with and cause the electromagnetic radiation to be redirected from its original path.
How much scattering takes place depends on the wavelength of the radiation, the abundance of particles or gases, and the distance travelled by radiation.
Three types of scattering:
Rayleigh Mie
NonSelective

Interaction with atmosphere
Rayleigh scattering causes shorter wavelengths of energy to be scattered more than longer wavelengths
Rayleigh scattering is the dominant scattering mechanism in the upper atmosphere.
Mie scattering occurs when the particles in the atmosphere have 0about the same size as the radiation wavelength.
Examples are: Dust, pollen, smoke and water vapor
Mie scattering occurs mostly in the lower portions of the atmosphere where larger particles are more abundant

Interaction with atmosphere
Nonselective scattering occurs when the particle size is greater than the radiation wavelength.
All wavelengths are scattered about equally.
Water droplets and large dust particles can cause this type of scattering.
This type of scattering causes fog and clouds to appear white to our eyes because blue, green, and red light are all scattered in approximately equal quantities (blue+green+red light = white light)
Interaction with atmosphere
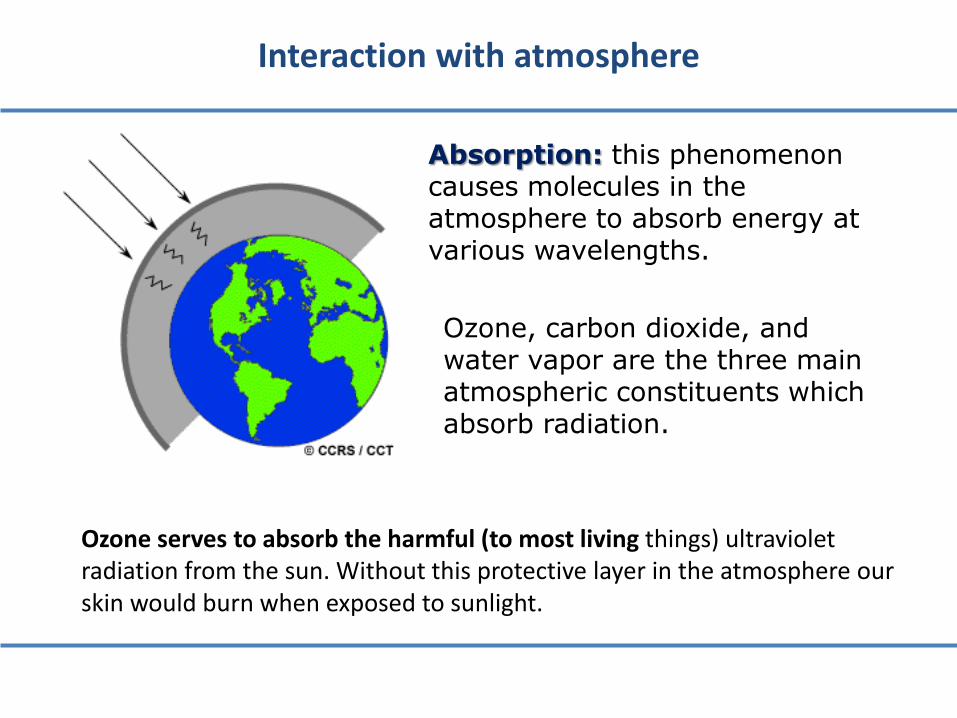
Absorption: this phenomenon causes molecules in the atmosphere to absorb energy at various wavelengths.
Ozone, carbon dioxide, and water vapor are the three main atmospheric constituents which absorb radiation.
Ozone serves to absorb the harmful (to most living things) ultraviolet radiation from the sun. Without this protective layer in the atmosphere our skin would burn when exposed to sunlight.
Interaction with atmosphere
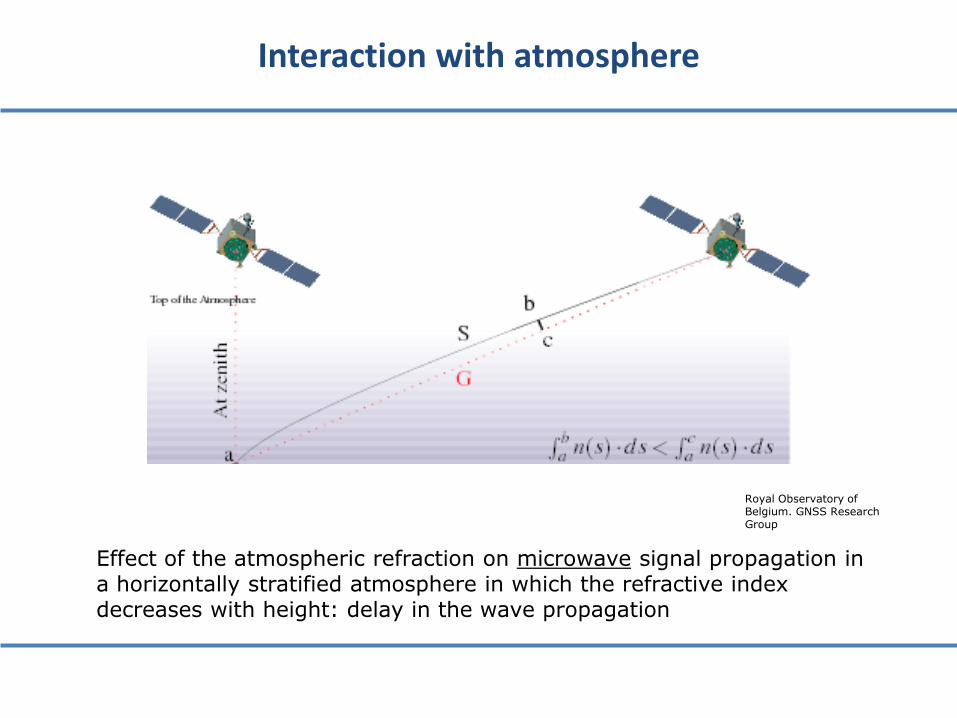
Effect of the atmospheric refraction on microwave signal propagation in a horizontally stratified atmosphere in which the refractive index decreases with height: delay in the wave propagation
Royal Observatory of Belgium. GNSS Research Group

Interaction with atmosphere
Because these gases absorb electromagnetic energy in very specific regions of the spectrum, they influence where (in the spectrum) we can "look" for remote sensing purposes.
Those areas of the spectrum which are not severely influenced by atmospheric absorption and thus, are useful to remote sensors, are called atmospheric windows.

Meteorological stations
Meteorological databases
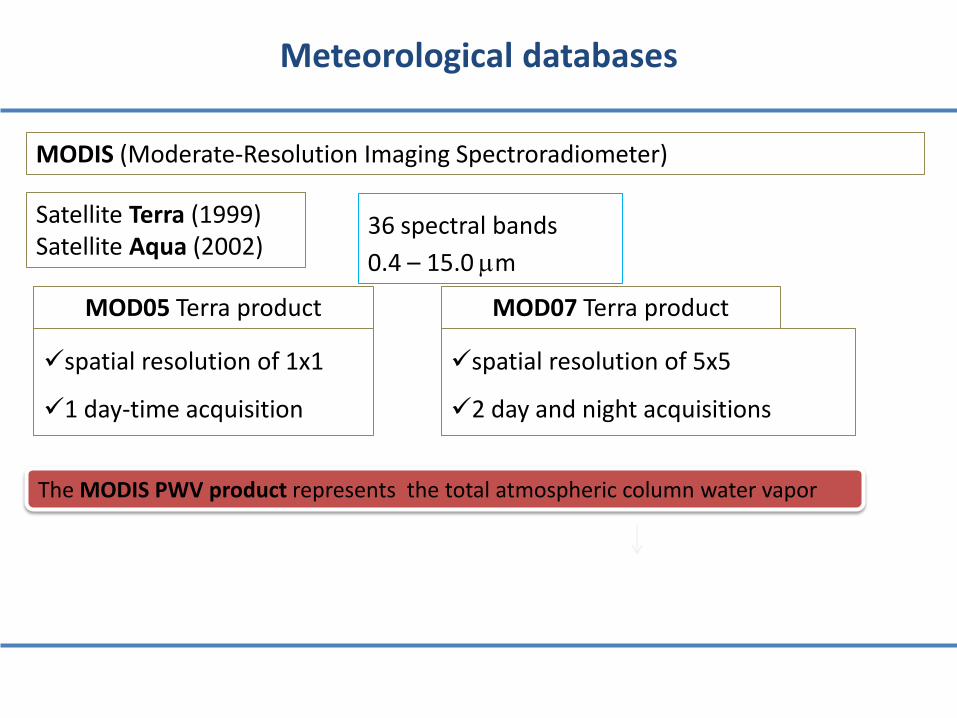
MODIS (Moderate-Resolution Imaging Spectroradiometer)
spatial resolution of 1x1
1 day-time acquisition
36 spectral bands
0.4 – 15.0 m
The MODIS PWV product represents the total atmospheric column water vapor
Satellite Terra (1999) Satellite Aqua (2002)
MOD05 Terra product
spatial resolution of 5x5
2 day and night acquisitions
MOD07 Terra product

Meteorological databases

Meteorological databases
AVHRR (Advaced Very High Resolution Radiometer)
spatial resolution of 1.1x1.1 km at nadir
ground swath of about 2000 km
6-8 acquisitions per day (by combining two operational satellites)
Five channels
• C1 0.58 – 0.68 m • C2 0.73 – 1.1 m • C3 3.6 – 3.9 m • C4 10.3 – 11.3 m • C5 11.5 – 12.5 m
AVHRR images can be used to get an overview of the general atmospheric situation, the position of frontal zones and the type of cloud cover
Cold cirrus clouds Warmer medium and lower level clouds
Combination of channels 1, 2 and 4

Meteorological databases
Meteosat
spatial resolution of 5x5 km at nadir
1 acquisition per half an hour
Three channels
• C1 0.5 – 0.9 m • C2 5.7 – 7.1 m • C3 10.5 – 12.5 m
Water Vapor
Meteorological databases
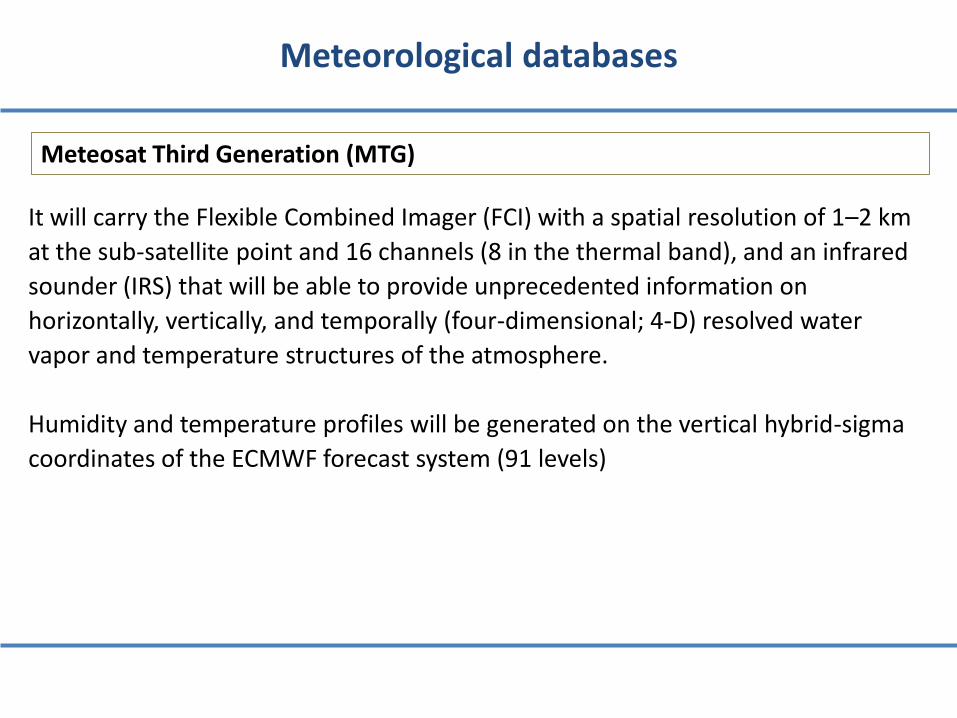
It will carry the Flexible Combined Imager (FCI) with a spatial resolution of 1–2 km
at the sub-satellite point and 16 channels (8 in the thermal band), and an infrared
sounder (IRS) that will be able to provide unprecedented information on
horizontally, vertically, and temporally (four-dimensional; 4-D) resolved water
vapor and temperature structures of the atmosphere.
Humidity and temperature profiles will be generated on the vertical hybrid-sigma
coordinates of the ECMWF forecast system (91 levels)
Meteosat Third Generation (MTG)

Meteorological databases
Global Atmospheric Models:
ERA-Interim (European Center for Medium-Range Weather Forecasts – ECMWF) North American Regional Reanalysis (NARR) Modern Era-Retrospective Analysis for Research and Application (MERRA)
Global and regional reanalysis of atmospheric data provide estimates of atmospheric variables several time a day at different pressure levels.

Meteorological databases
ERA-Interim is a atmospheric reanalysis of the ECMWF, following ERA-40. It provides estimates of temperature, water vapor partial pressure, and geopotential height along 37 pressure levels, on a global 0.7° grid, at 0:00, 6:00, 12:00 and 18:00 UTC daily, from 1989 to present.
NARR is a regional model that provides estimates of temperature, water vapor partial pressure, and geopotential height along 29 pressure levels, on a Northern Hemisphere Lambert Conformal Conic grid centered on the USA, at 0:00, 3:00, 6:00, 9:00, 12:00, 15:00, 18:00 and 21:00 UTC daily, from 1979 to the present.
MERRA is a global reanalysis, providing temperature, water vapor partial pressure and geopotential height along 42 pressure levels, on a global grid (0.5° along longidute and 0.75° along latitude), at 0:00, 6:00, 12:00, and 18:00 UTC daily, from 1979 to present.

Meteorological databases
The geopotential height is defined to compensate for the decrease of gravitational attraction with the geometric height z, as
zR
zRH
e
e
where Re = 6536.766 is the mean Earth radius
TeRH
e s100
The partial pressure e of water vapor is computed from the relative humidity RH and temperature
Interested people can search for the Clausius-Clapeyron equation giving the saturation partial water vapor pressure es

Numerical Weather Models (NWMs)
The Weather Reseach & Forecasting (WRF) model can be used to generate 3D field of atmosphere temperature, pressure, geopotential, water vapor fraction and liquid water.
Spatial resolution 1kmx1km

NWMs atmospheric phase delay
h
hydwethydwetatm dhNNRRR0
6
cos
10

NWMs atmospheric phase delay
GPS stations overlaid to delay map

NWMs atmospheric phase delay
Stratified atmosphere? Turbolent atmosphere?

Meteorological databases
SAR interferometry
WRF

Atmospheric signal in radar interferometric phase images?
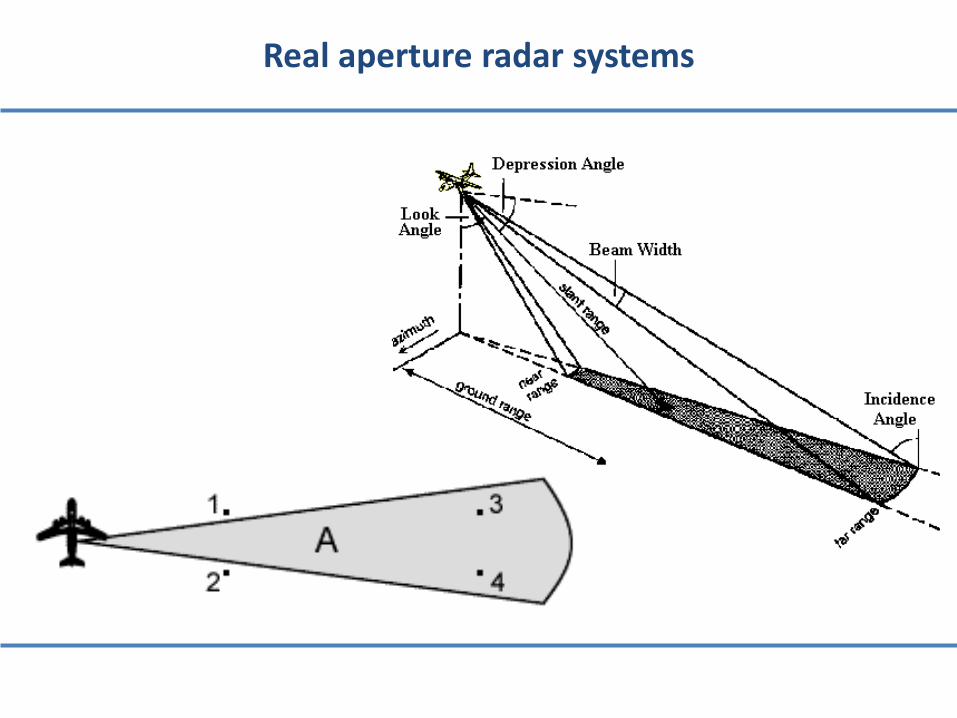
Real aperture radar systems

Synthetic Aperture Radar (SAR)
h S
Range (R)
Azi
mu
th (
Az)

Azimuth aperture
Azimuth aperture
beamwidth
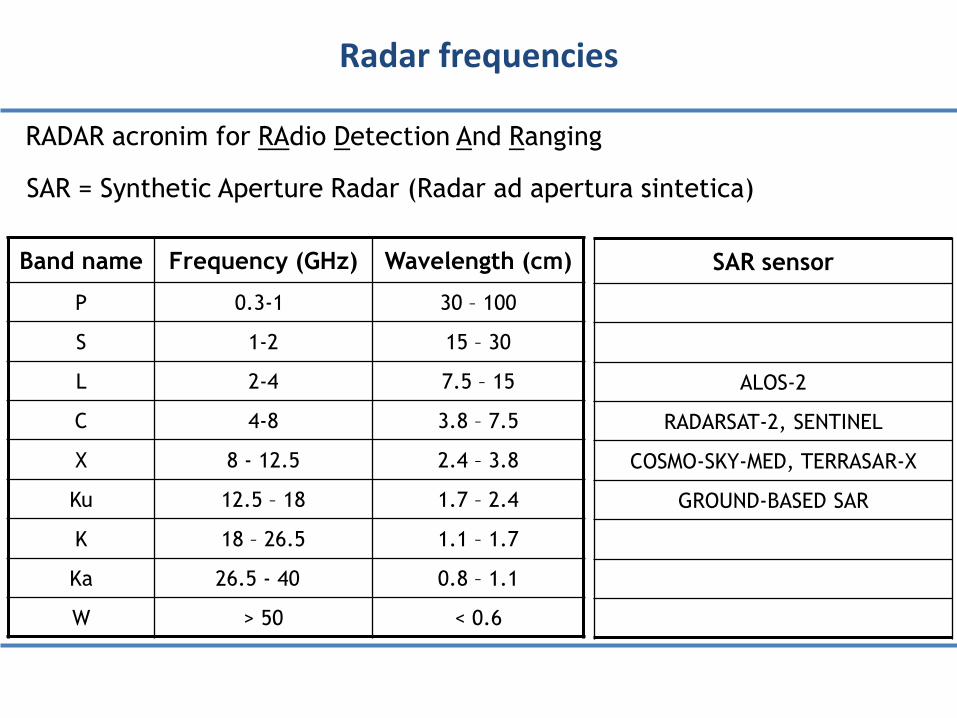
Radar frequencies
RADAR acronim for RAdio Detection And Ranging
SAR = Synthetic Aperture Radar (Radar ad apertura sintetica)
Band name Frequency (GHz) Wavelength (cm)
P 0.3-1 30 – 100
S 1-2 15 – 30
L 2-4 7.5 – 15
C 4-8 3.8 – 7.5
X 8 - 12.5 2.4 – 3.8
Ku 12.5 – 18 1.7 – 2.4
K 18 – 26.5 1.1 – 1.7
Ka 26.5 - 40 0.8 – 1.1
W > 50 < 0.6
SAR sensor
ALOS-2
RADARSAT-2, SENTINEL
COSMO-SKY-MED, TERRASAR-X
GROUND-BASED SAR

GPS (20180 km) L-band
Sentinel-1 (693 km) C-band
ALOS-2 (628 km) L band
CSK (620 km) X-band
11000 km
Ionosphere = dispersive medium
Propagation delay in atmosphere
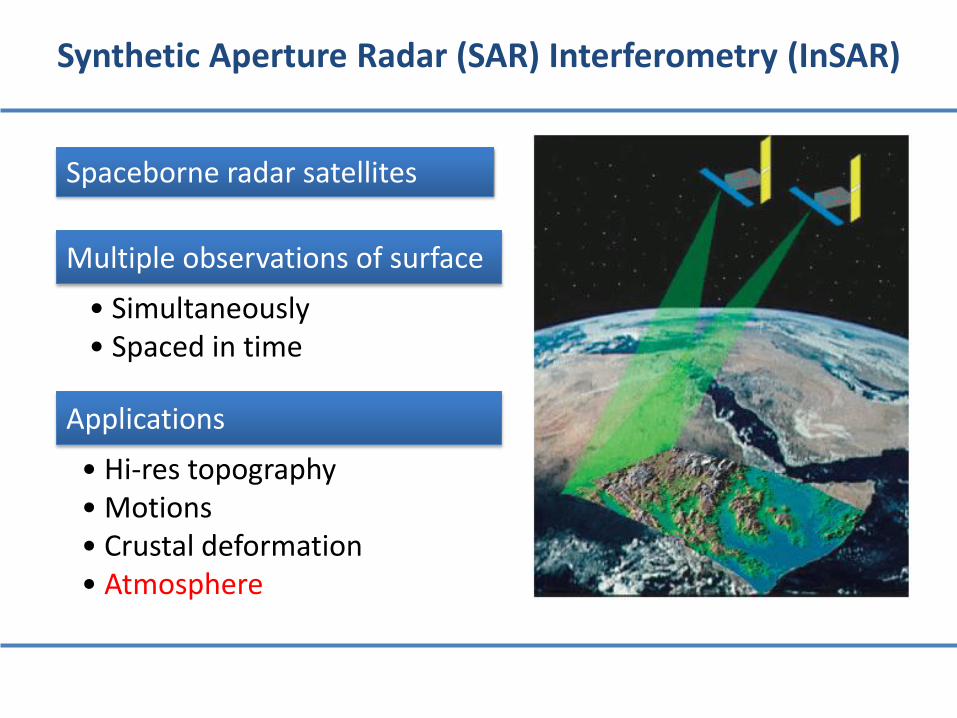
Synthetic Aperture Radar (SAR) Interferometry (InSAR)
Spaceborne radar satellites
• Simultaneously • Spaced in time
• Hi-res topography • Motions • Crustal deformation • Atmosphere
Multiple observations of surface
Applications

InSAR data acquisition
z
baseline
slant range
The baseline is the distance between “time coregistered” orbits
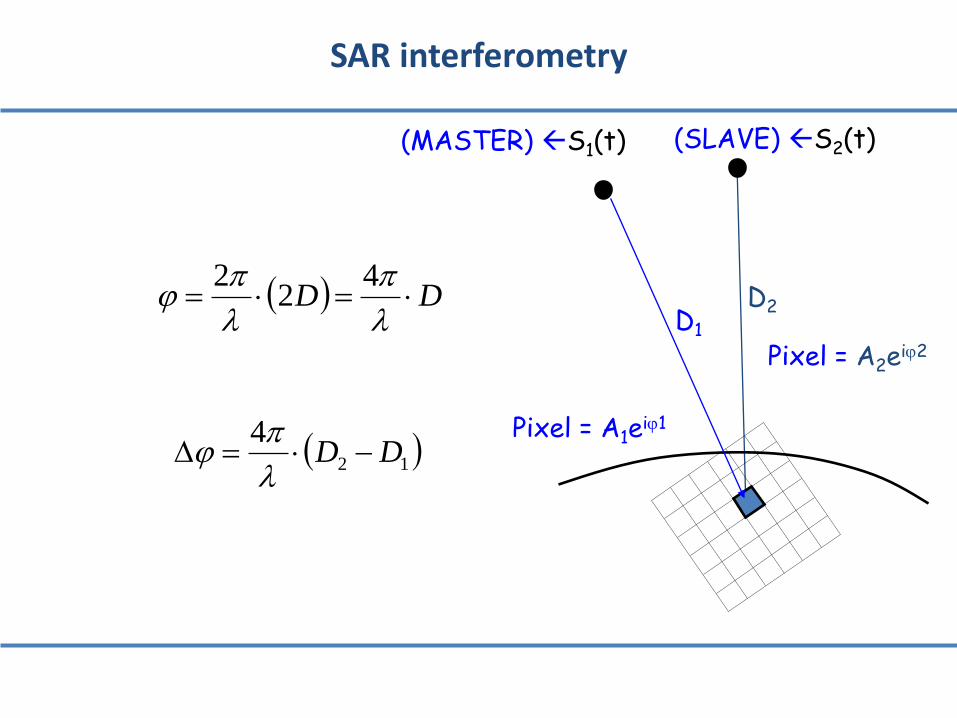
SAR interferometry
DD
42
2
(MASTER) S1(t)
Pixel = A1ei1
D1 D2
Pixel = A2ei2
12
4DD
(SLAVE) S2(t)

InSAR Geometry - height
For =2: Height ambiguity B=200m h 2= 43.7 m

Topographic phase

Differential SAR interferometry (DInSAR)
After interferogram flattening, the interferometric phase contains both altitude and motion contributions:
If there is a
DTM Phase DTM
contribution
Differential Interferogram

DInSAR Applications
Terrain displacements (earthquakes, landslides, subsidences, glaciers, etc…

InSAR phase contributions
topo noise atmo Displacement k

The atmospheric contribution
Longer wavelength microwave radiation can penetrate through cloud cover, haze, dust, as the longer wavelengths are not susceptible to atmospheric scattering.
Radiation travel path can be affected by atmospheric humidity, temperature and pressure
Two SAR images not simultaneous, can be affected differently by the atmosphere with consequences on the interferometric phase.
BUT

Wf
N
T
Pk
T
Pk
T
Pksn ed
4.131.401)(
22
v3
v21
vacatm
atm dsdsn(s)
ZTDFdzn
H
0
0atm 1sin
1
Propagation delay in atmosphere

Precipitable Water Vapour and InSAR
Let us suppose to have an interferogram corrected for topography
)()()()(, M
atm
S
atm
M
def
S
def
SM tttttt
where tdtdef
4)(
tPWV
Mtatm
14)(
cos
1M is the mapping function
'
23
6
2
10
kT
kR
m
vOH
The precipitable water vapor is the total amount of water vapor
In a vertical column of the atmosphere if it would all
condense

Precipitable Water Vapour and InSAR
If terrain deformation can be neglected, InSAR can provide maps of PWV temporal changes
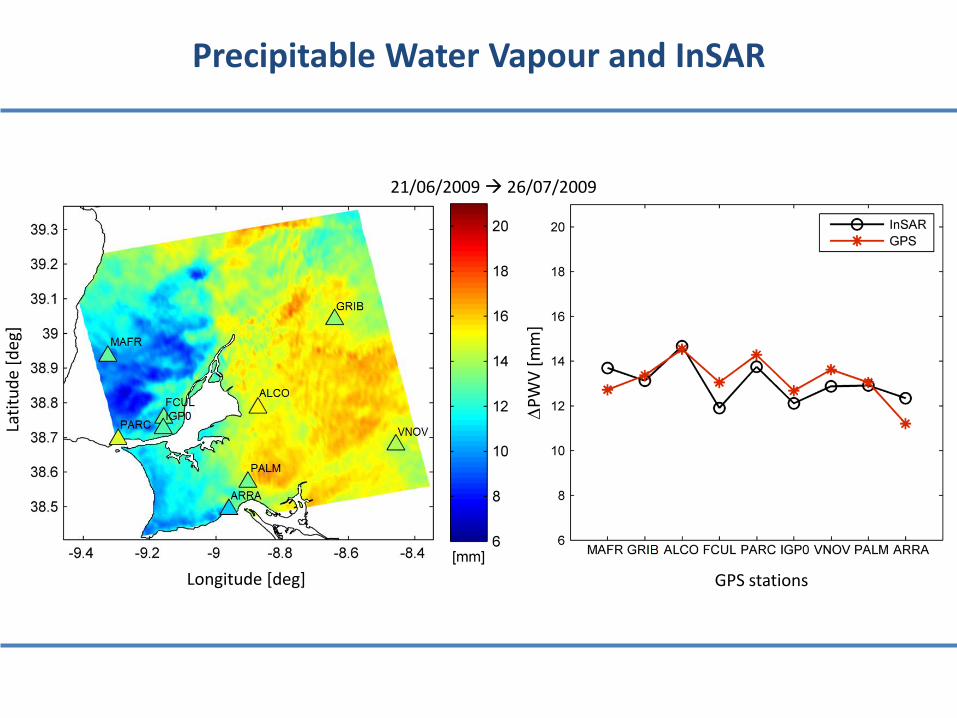
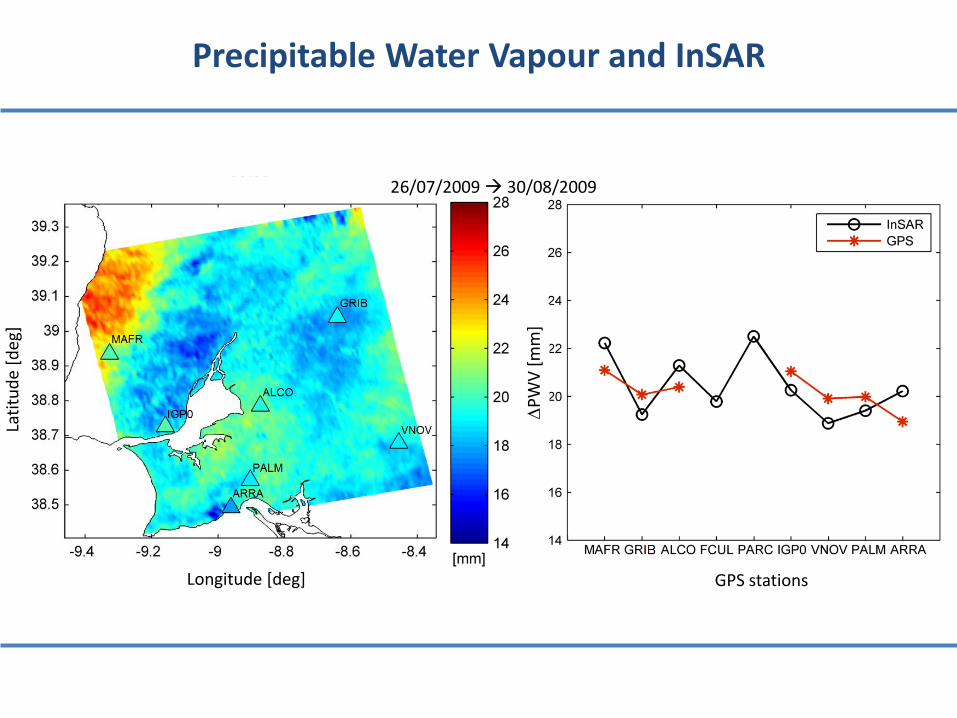
A set of independent measurements of PWV by a network of permanent GPS stations can be used to calibrate InSAR measurements. Each station measures the mean PWV in a circular area with a radius of about 3.8 km depending on the cut-off angle set in the GPS processing. The idea is to use GPS estimates of PWV at the acquisition times of master and slave SAR images to compute an independent set of PWV.
rSM MttPWV
4,

Precipitable Water Vapour and InSAR

Precipitable Water Vapour and InSAR La
titu
de
[deg
]
Longitude [deg] GPS stations
PW
V [
mm
]
30/08/2009 04/10/2009

Precipitable Water Vapour and InSAR
Longitude [deg]
Lati
tud
e [d
eg]
GPS stations
P
WV
[m
m]
04/10/2009 08/11/2009

Precipitable Water Vapour and InSAR
Longitude [deg]
Lati
tud
e [d
eg]
GPS stations
P
WV
[m
m]
12/04/2009 17/05/2009
Precipitable Water Vapour and InSAR
Longitude [deg]
Lati
tud
e [d
eg]
GPS stations
P
WV
[m
m]
21/06/2009 26/07/2009
Precipitable Water Vapour and InSAR
Longitude [deg]
Lati
tud
e [d
eg]
GPS stations
P
WV
[m
m]
26/07/2009 30/08/2009

Precipitable Water Vapour and InSAR
A refinement of the PWV can be obtained by accurately estimating the mean vertical temperature used to compute the constant .
Usually Tm is obtained by a linear regression with the surface temperature Ts

Precipitable Water Vapour and InSAR
'
23610 k
T
kR
m
v

How can we estimate the absolute PWV?
Relative PWV InSAR
17/05/09 – 12/04/09
Absolute PWV WRF model 12/04/09
Absolute PWV 17/05/09

What can we do with InSAR estimates of PWV?
InSAR interpolation to 10km x 10km grid

Assimilation of InSAR PWV maps in NWMs
Spatial distribution of the cumulative difference in the water vapor mixing ratio (QVAPOR) in g/kg (positive mean increase
with respect to the analysis field)
QVAPOR vertical profile before and after the data assimilation

Assimilation of InSAR PWV maps in NWMs
Cumulative difference of hydrometeors in mm Hydrometeors vertical profile
before and after data assimilation

Sentinel-1 High-resolution mapping of PWV on a regional scale
Footprint of all swaths for each segment (S1 and S2) and the network of GPS permanent
stations

Sentinel-1 High-resolution mapping of PWV on a regional scale
Phase contributions due to the temporal change of the dry and ionospheric components of refractivity have been removed!!! Differences with respect to
100kmx100km SAR interferograms (e.g. Envisat)
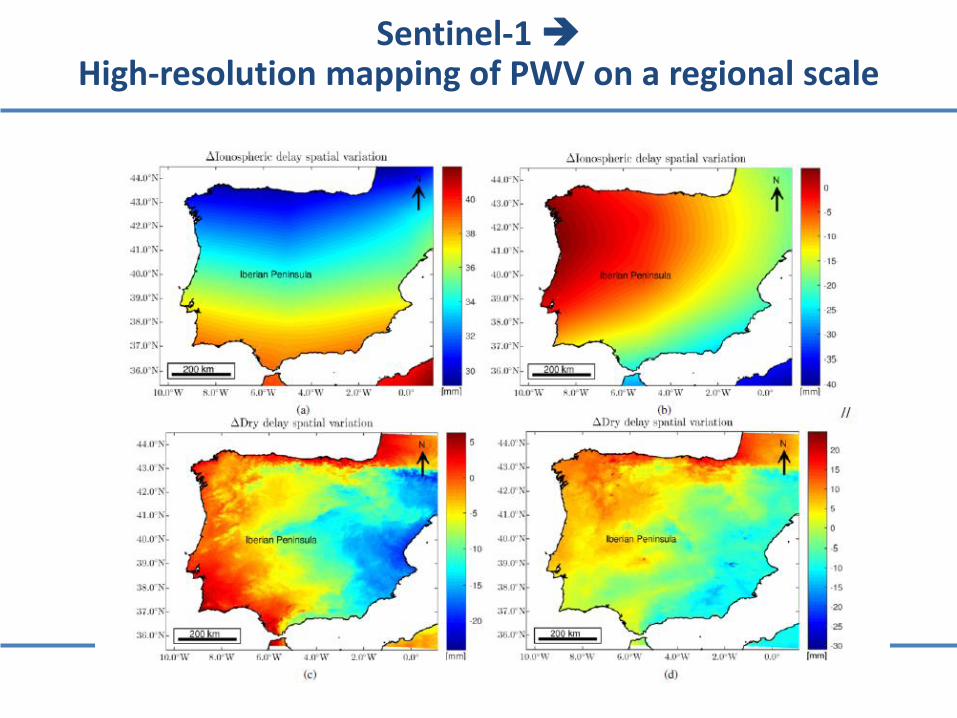
Sentinel-1 High-resolution mapping of PWV on a regional scale

wetNASWD
GNSS (Global Navigation Satellite System) tomography

GNSS (Global Navigation Satellite System) tomography
PWVdr
T
Pk
T
PkZSWD w 2
v3
v2
1610
K2 = 71.6 k mb-1
K3 = 3.747 105 k2 mb-1
Z-1 = empirical inverse wet compressibility factor
SWD observations
unknown refractivity
3D tomographic grid model
wet
M
wet
MNN
voxM
N voxvoxobsobsaa
aa
N
N
.
SWD
SWD
1
1111
1

GNSS (Global Navigation Satellite System) tomography
The A matrix is filled using a ray tracing algorithm to measure the sub-path distance travelled by the total SWD in each voxel
The main drawback of GNSS tomography formulation is its ill-posedeness resulting from the sub-optimal coverage of the grid model due to he GPS geometry properties the A matrix is not invertible due the large amount of zeros values ini correspondence of the empty voxels mainly in the lowerr part of the tomographic part of the tomographic model.
To overcome this problem a set of constraints or additional information concerning the grid model are added
wetNB
A
0
SWD
GNSS (Global Navigation Satellite System) tomography
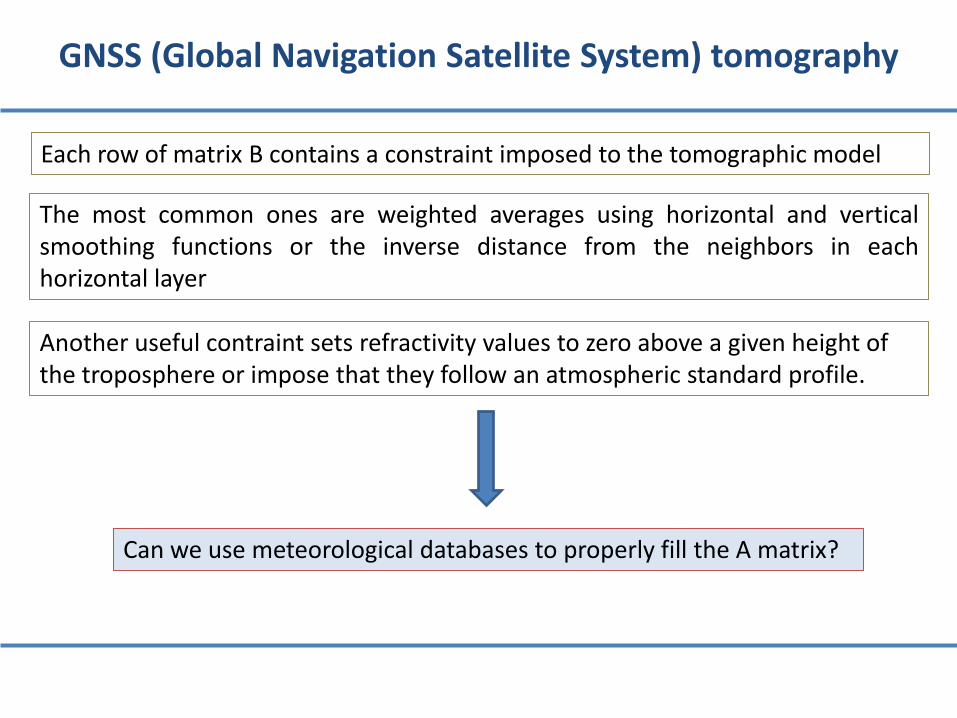
Each row of matrix B contains a constraint imposed to the tomographic model
The most common ones are weighted averages using horizontal and vertical smoothing functions or the inverse distance from the neighbors in each horizontal layer
Another useful contraint sets refractivity values to zero above a given height of the troposphere or impose that they follow an atmospheric standard profile.
Can we use meteorological databases to properly fill the A matrix?

GNSS (Global Navigation Satellite System) tomography
0
TT NASWDPAPAPANN 1
00
wet
If a first guess solution N0 of refractivity is available, a solution can be provided by the damped least square method
P = vector with the weight of each SWD observation
P0 = error covariance matrix of the a priori solution N0
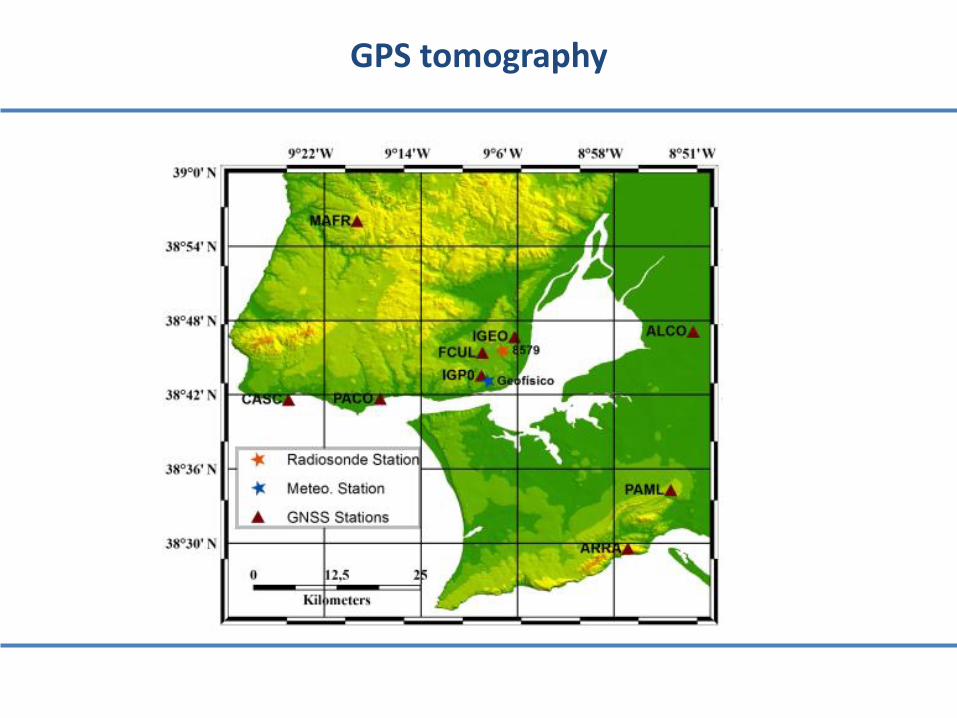
GPS tomography
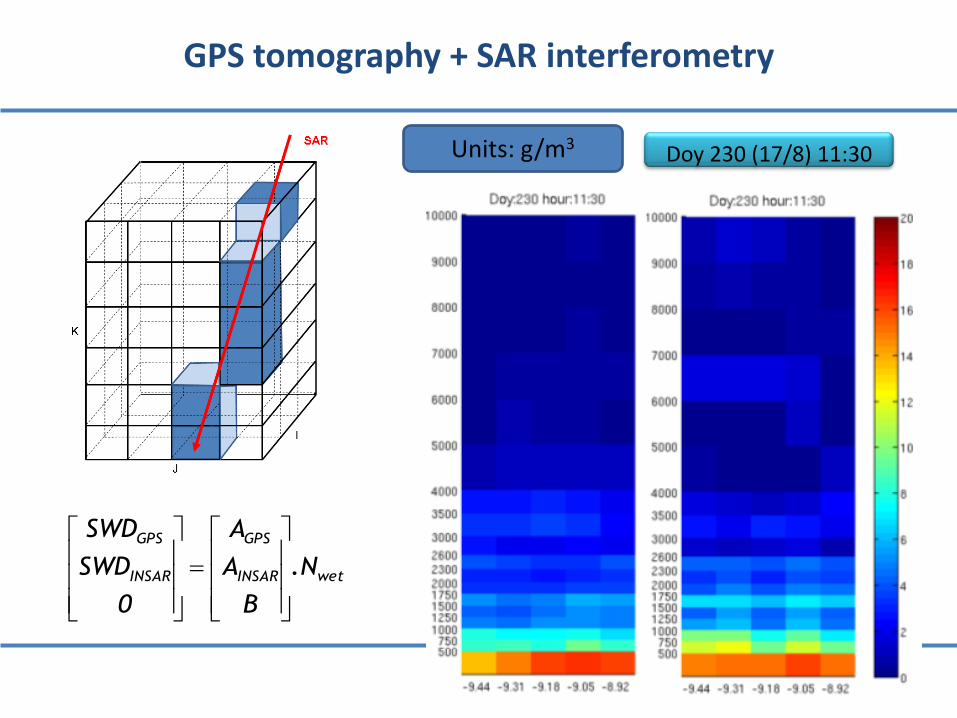
GPS tomography + SAR interferometry
wetINSAR
GPS
INSAR
GPS
.N
B
A
A
0
SWD
SWD
Units: g/m3 Doy 230 (17/8) 11:30

wetMODIS
GPS
MODIS
GPS
.N
B
A
A
0
SWD
SWD
GPS tomography + MODIS
Radiosonde: Strong vertical variability
Tomography: Smoother and smaller vertical variability

A few references + contacts for data
P. Benevides, G. Nico, J. Catalão, and P. Miranda, “Bridging InSAR and PS Tomography: A New Differential Geometrical Constraint,” IEEE Transactions on Geoscience and Remote Sensing, 54(2), 697–702, 2016. P. Mateus, G. Nico, and J. Catalão, “Maps of PWV Temporal Changes by SAR Interferometry: A Study on the Properties of Atmosphere’s Temperature Profiles,” IEEE Geoscience and Remote Sensing Letters, 11(12), 2065–2069, 2014. P. Mateus, G. Nico, R. Tomé, J. Catalão, and P. Miranda, “Experimental Study on the Atmospheric Delay Based on GPS, SAR Interferometry, and Numerical Weather Model Data,” IEEE Transactions on Geoscience and Remote Sensing, 51(1), 6–11, 2013. P. Mateus, G. Nico, and J. Catalão, “Can spaceborne SAR interJ. Catalão, ferometry be used to study the temporal evolution of PWV?” Atmospheric Research, vol. 119, no. 0, pp. 70–80, 2013.
João Catalão, University of Lisbon, [email protected]
Giovanni Nico, CNR-IAC, [email protected]


![07 asterix and the big fight [1964]](https://img.pdfslide.us/doc/110x75/55835eaad8b42aa3798b5594/07-asterix-and-the-big-fight-1964.jpg)