Embed Size (px)
Citation preview

A Research Service By Business Insider
THE FUTURE OF RETAIL: 2015

Retail is changing.
Source: Flickr / Joseph Brent
Digital is changing the way people shop.
Source: Flickr / Joseph Brent

We define “digital commerce” as purchases that are made on desktop and mobile computers.
Source: US Economic Census
Q1 Q2 Q3 Q4 Q1 Q2 Q3 Q4 Q1 Q2 Q3 Q4 Q1 Q2 Q3 Q4 Q1 Q2 Q3 Q4 Q10%
2%
4%
6%
8%Share Of US Retail Sales From DigitalQuarterly

Nearly all growth in retail now comes from this segment.
Source: US Economic Census
Q1 20
10
Q2 20
10
Q3 20
10
Q4 20
10
Q1 20
11
Q2 20
11
Q3 20
11
Q4 20
11
Q1 20
12
Q2 20
12
Q3 20
12
Q4 20
12
Q1 20
13
Q2 20
13
Q3 20
13
Q4 20
13
Q1 20
14
Q2 20
14
Q3 20
14
Q4 20
14
Q1 20
150%
5%
10%
15%
20%
25%US Retail Sales, Year-Over-Year Growth
Overall Retail Digital Commerce

So what’s driving digital commerce growth?
Source: US Census, BI Intelligence
Overall Retail Digital Commerce
3.5%
14.8%
Annual Growth In 2015US

Consumers are using smartphones and tablets more as purchasing devices.
Source: US Economic Census, comScore
Q1 2012
Q2 2012
Q3 2012
Q4 2012
Q1 2013
Q2 2013
Q3 2013
Q4 2013
Q1 2014
Q2 2014
Q3 2014
Q4 2014
Q1 2015
$0
$20,000
$40,000
$60,000
$80,000
$100,000Overall US Digital Sales
Mobile Desktop

Social networks are now driving more e-commerce than email.
Source: AddShoppers, Internet Retailer, BI Intelligence Estimates
Facebook Twitter Pinterest E-mail Google+ Other
$1,461,350,000
$651,530,000
$422,620,000 $421,850,000 $421,850,000
$58,630,000
E-Commerce Revenue Generated From Social Media
Top 500 Retailers, Global, 2014Estimates in millions

And shopping sites have gone global, allowing people to shop wares from all around the world.
Source: Company Filings, BI Intelligence Estimates
Q2 2012
Q3 2012
Q4 2012
Q1 2013
Q2 2013
Q3 2013
Q4 2013
Q1 2014
Q2 2014
Q3 2014
Q4 2014
0
50
100
150
200
250
300
350
400
Active Buyers On Top E-Commerce MarketplacesTrailing 12 months; Global
Alibaba (Includes Tmall and Taobao)
Amazon
eBay
Groupon
Etsy
Zalando
Millions

From a macro perspective, digital commerce may not seem like much compared to in-store retail.
Source: US Economic Census, comScore
Q1 2012
Q2 2012
Q3 2012
Q4 2012
Q1 2013
Q2 2013
Q3 2013
Q4 2013
Q1 2014
Q2 2014
Q3 2014
Q4 2014
Q1 2015
$0
$200,000
$400,000
$600,000
$800,000
$1,000,000
$1,200,000
$1,400,000Overall US Retail Sales
In-store
Digital (mobile + desktop)
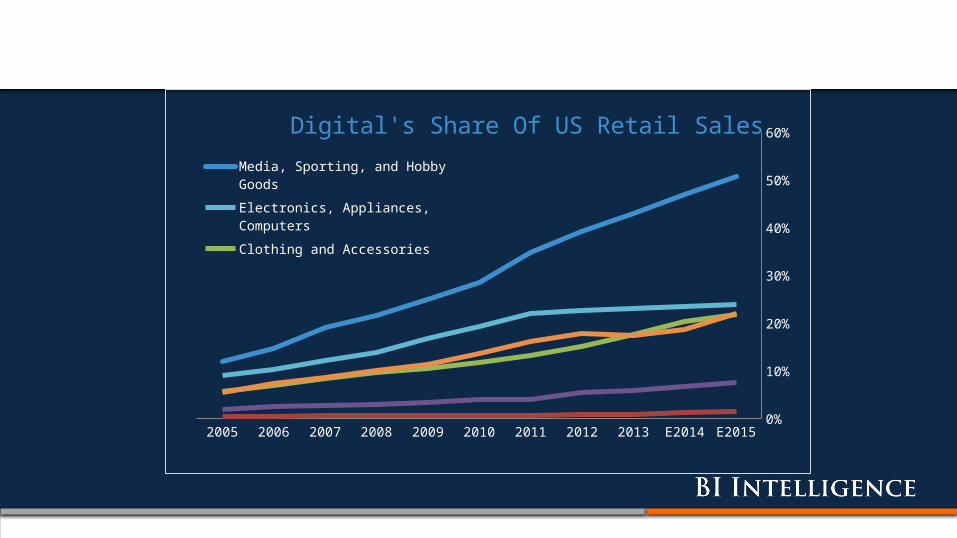
But look closer, by product category...
Source: US Economic Census, BI Intelligence
2005 2006 2007 2008 2009 2010 2011 2012 2013 E2014 E20150%
10%
20%
30%
40%
50%
60%Digital's Share Of US Retail Sales
Media, Sporting, and Hobby Goods Electronics, Appliances, Com-putersClothing and Accessories Furniture and Home Furnishings Health and Personal Care Food and Beverage

And you’ll see that e-commerce is booming.
Source: US Economic Census, BI Intelligence
2005 2006 2007 2008 2009 2010 2011 2012 2013 E2014 E2015$0
$10,000
$20,000
$30,000
$40,000
$50,000
$60,000
$70,000US Digital Retail Sales, By CategoryClothing and Accessories Media, Sporting, and Hobby Goods Furniture and Home Furnishings Electronics, Appliances, Com-putersHealth and Personal Care Food and Beverage
2005 2006 2007 2008 2009 2010 2011 2012 2013 E2014 E20150%
10%
20%
30%
40%
50%
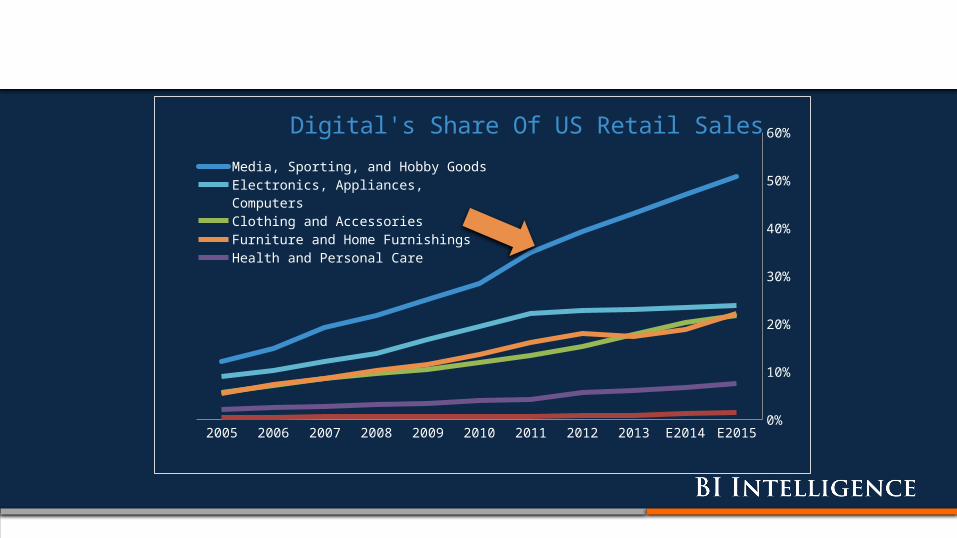
60%Digital's Share Of US Retail Sales
Media, Sporting, and Hobby Goods Electronics, Appliances, ComputersClothing and Accessories Furniture and Home Furnishings Health and Personal Care Food and Beverage
The “Media, Sporting, and Hobby Goods” Categoryis leading the way.
Source: US Economic Census, BI Intelligence
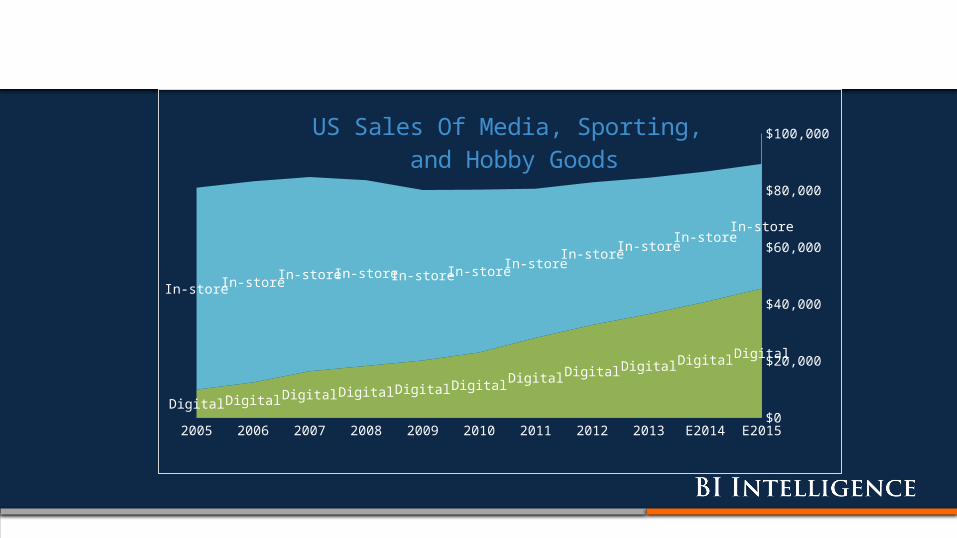
Over 50% of these sales in the US now occur online.
Source: US Economic Census, BI Intelligence
2005 2006 2007 2008 2009 2010 2011 2012 2013 E2014 E2015$0
$20,000
$40,000
$60,000
$80,000
$100,000
Digital Digital Digital Digital Digital Digital Digital Digital Digital Digital Digital
In-store In-store In-store In-store In-store In-storeIn-store
In-storeIn-store
In-storeIn-store
US Sales Of Media, Sporting, and Hobby Goods

And digital media has become the fastest growing e-commerce category in the US.
Source: ComScore 2015
Jewelry and Watches
Books and Magazines
Flowers and Gifts
Music, Movies, Videos
Video Games and Consoles
Event Tickets
Consumer Electronics
Toys and Hobby Goods
Home and Garden
Furniture and Appliances
Office Supplies
Sport and Fitness
Apparel and Accessories
Consumer Packaged Goods
Digital Content
-1%
2%
6%
6%
7%
8%
14%
14%
14%
15%
15%
17%
20%
21%
27%
YoY Growth of E-Commerce Sales, By Category US 2014/2013

2005 2006 2007 2008 2009 2010 2011 2012 2013 E2014 E20150%
10%
20%
30%
40%
50%
60%Digital's Share Of US Retail Sales
Media, Sporting, and Hobby Goods Electronics, Appliances, ComputersClothing and Accessories Furniture and Home Furnishings Health and Personal Care Food and Beverage
The “Electronics” category isn’t far behind.
Source: US Economic Census, BI Intelligence

Over 50% of these sales in the US now occur online.
Source: US Economic Census, BI Intelligence
2005 2006 2007 2008 2009 2010 2011 2012 2013 E2014 P2015$0
$20,000
$40,000
$60,000
$80,000
$100,000
$120,000
Digital Digital Digital Digital Digital Digital Digital Digital Digital Digital Digital
In-storeIn-store In-store In-store
In-store In-store In-store In-store In-store In-store In-store
US Sales Of Electronics And Appliances

Leading to the decline of some traditional retailers.
RadioShack filed for bankruptcy in early 2015 after 11 consecutive quarterly losses; the company has since been bailed out by Sprint.

2005 2006 2007 2008 2009 2010 2011 2012 2013 E2014 E20150%
10%
20%
30%
40%
50%
60%Digital's Share Of US Retail Sales
Media, Sporting, and Hobby Goods Electronics, Appliances, ComputersClothing and Accessories Furniture and Home Furnishings Health and Personal Care Food and Beverage
The “Apparel” category is close behind.
Source: US Economic Census, BI Intelligence

Approximately one-fourth of apparel sales in the US now occur online.
Source: US Economic Census, BI Intelligence
2005 2006 2007 2008 2009 2010 2011 2012 2013 E2014 E2015$0
$50,000
$100,000
$150,000
$200,000
$250,000
$300,000
Digital Digital Digital Digital Digital Digital Digital Digital Digital Digital Digital
In-store In-store In-store In-store In-store In-storeIn-store
In-store In-storeIn-store
In-store
US Sales Of Apparel

But younger shoppers still prefer the flexibility of shopping for clothes at stores and online.
Source: Piper Jaffray
Fall 2013 Spring 2014 Fall 2014 Spring 2015
36%
19%
36%39%
64%
81%
64%61%
US Teens Preferences When Purchasing Clothing OnlineOnline-Only Retailers
Online Retailers With Stores

So while many traditional apparel retailers are holding on by a thread, the ones that survive will be those that diversify into e-commerce.
Source: Shutterstock

Let’s see how those traditional apparel retailers are faring...
Source: AP

JCPenney relies way too heavily on in-store sales, which account for 99% of its business.
Source: JCPenney, Internet Retailer, BI Intelligence Estimates
2004 2005 2006 2007 2008 2009 2010 2011 2012 2013 20150
5000
10000
15000
20000
25000
Digital Online Online Online Online Online Online Online Online Online Online
In-store OfflineOffline Offline
Offline Offline Offline Offline
Offline Offline Offline
JCPenney Annual Retail SalesGlobal
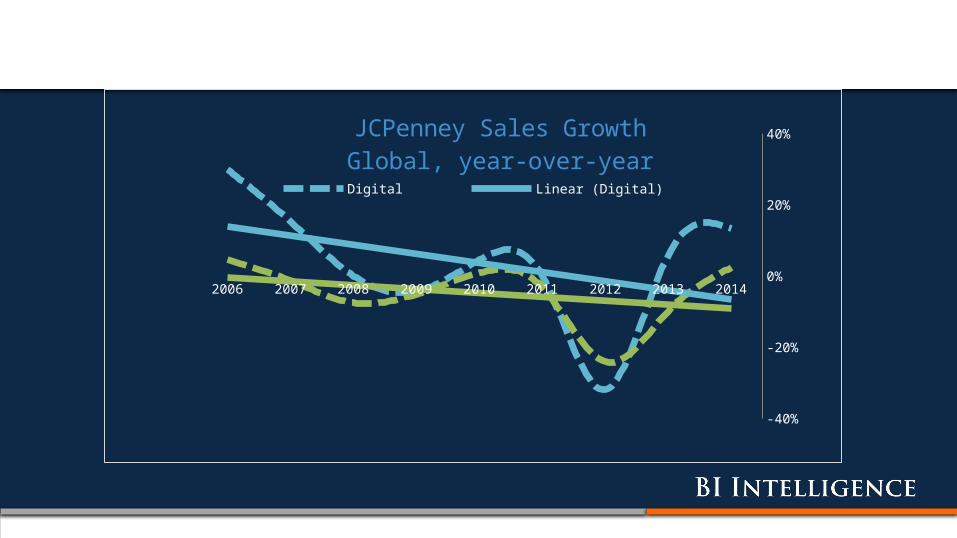
And JCPenney’s growth has been inconsistent, trending downward overall.
Source: JCPenney, Internet Retailer, BI Intelligence Estimates
2006 2007 2008 2009 2010 2011 2012 2013 2014
-40%
-20%
0%
20%
40%JCPenney Sales GrowthGlobal, year-over-year
Digital Linear (Digital) In-store
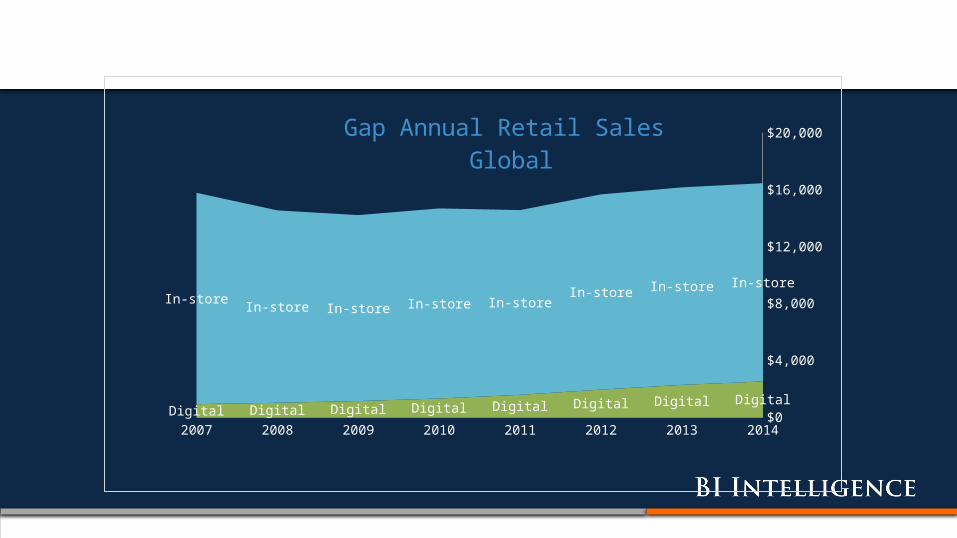
Gap’s business is much more diversified than JC Penney’s; 15% of Gap sales come from digital.
Source: Gap, Internet Retailer, BI Intelligence
2007 2008 2009 2010 2011 2012 2013 2014$0
$4,000
$8,000
$12,000
$16,000
$20,000
Digital Digital Digital Digital Digital Digital Digital Digital
In-storeIn-store In-store In-store In-store
In-store In-store In-store
Gap Annual Retail Sales Global

And although Gap’s growth is decelerating, it’s still trending upwards overall.
Source: Gap, Internet Retailer, BI Intelligence
2008 2009 2010 2011 2012 2013 2014
-20%
-10%
0%
10%
20%
30%
Gap Sales GrowthGlobal, year-over-year
Digital Linear (Digital) In-store Linear (In-store)

Furniture has been steadily disrupted by shoppers going online to purchase home goods.
Source: US Economic Census, BI Intelligence
2005 2006 2007 2008 2009 2010 2011 2012 2013 E2014 E20150%
10%
20%
30%
40%
50%
60%Digital's Share Of US Retail Sales
Media, Sporting, and Hobby Goods Electronics, Appliances, ComputersClothing and Accessories Furniture and Home Furnishings Health and Personal Care Food and Beverage

Digital now accounts for 28% of furniture sales in the US.
Source: Us Economic Census, BI Intelligence
2005 2006 2007 2008 2009 2010 2011 2012 2013 E2014 P2015$0
$20,000
$40,000
$60,000
$80,000
$100,000
$120,000
$140,000
$160,000
Digital Digital Digital Digital Digital Digital Digital Digital Digital Digital Digital
In-store In-store In-storeIn-store
In-store In-store In-store In-store
In-store
In-storeIn-store
US Sales Of Furniture

Now the categories with the greatest potential for disruption…
Source: Flickr/Foad Hersi, Jamie

Health and Personal Care is on deck to be completely disrupted by e-commerce.
Source: US Economic Census, BI Intelligence
2005 2006 2007 2008 2009 2010 2011 2012 2013 E2014 E20150%
10%
20%
30%
40%
50%
60%Digital's Share Of US Retail Sales
Media, Sporting, and Hobby Goods Electronics, Appliances, ComputersClothing and Accessories Furniture and Home Furnishings Health and Personal Care Food and Beverage
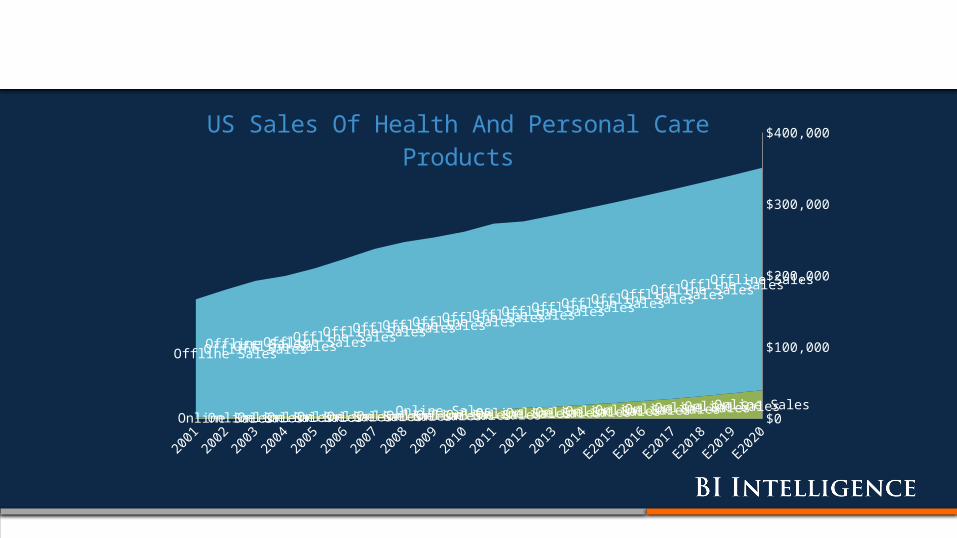
Americans today spend over $300 billion a year buying health and care products. Only 7% of that is done online.
Source: US Census, eMarketer, BI Intelligence
2001
2002
2003
2004
2005
2006
2007
2008
2009
2010
2011
2012
2013
2014
E201
5
E201
6
E201
7
E201
8
E201
9
E202
0$0
$100,000
$200,000
$300,000
$400,000
Online SalesOnline SalesOnline SalesOnline SalesOnline SalesOnline SalesOnline SalesOnline SalesOnline SalesOnline SalesOnline SalesOnline SalesOnline SalesOnline SalesOnline SalesOnline SalesOnline SalesOnline SalesOnline SalesOnline Sales
Offline SalesOffline SalesOffline SalesOffline SalesOffline SalesOffline SalesOffline SalesOffline SalesOffline SalesOffline SalesOffline SalesOffline SalesOffline SalesOffline SalesOffline SalesOffline SalesOffline SalesOffline SalesOffline SalesOffline Sales
US Sales Of Health And Personal Care Products

But by 2020, digital will account for $1 in every $10 spent on health and care products.
Source: US Census, eMarketer, BI Intelligence Estimates
2001
2002
2003
2004
2005
2006
2007
2008
2009
2010
2011
2012
2013
2014
E201
5
E201
6
E201
7
E201
8
E201
9
E202
00%
4%
8%
12%
E-Commerce Share Of Health And Personal Care Retail Sales
US

That’s nearly $40 billion.
Source: US Census, eMarketer, BI Intelligence
_x00
04...
_x00
04...
_x00
04...
_x00
04...
_x00
04...
_x00
04...
_x00
04...
_x00
04...
_x00
04...
_x00
04...
_x00
04...
_x00
04...
_x00
04...
_x00
04...
_x00
05...
_x00
05...
_x00
05...
_x00
05...
_x00
05...
_x00
05...
$0
$5,000
$10,000
$15,000
$20,000
$25,000
$30,000
$35,000
$40,000
$45,000US E-Commerce Sales Of
Health And Personal Care Products

Among health and beauty shoppers, Amazon is the most popular e-commerce destination.
Source: AT Kearney, 2014
Olay.
com
JCPe
nney
.com
Lore
al.co
m
Beaut
y.co
m
Drugs
tore
.com
Avon.
com
Ulta.co
m
eBay
.com
CVS.co
m
Macys
.com
Targ
et.com
Wal
gree
ns.co
m
Seph
ora.
com
Wal
mar
t.com
Amaz
on.co
m
18% 18% 19% 20% 22% 23% 24% 25% 25% 27% 28%32%
35%
42%
73%
Where US Consumers Shop Online For Personal Care And Beauty Products

Four out of ten online health and beauty shoppers use subscription services to refill products they need.
Source: AT Kearney, May 2014
No62%
Tools, 2%Fragrances, 3%Nail Care, 4%
Color Cosmet-ics, 5%
Hair Care, 5%
Personal Care, 6%
Skin Care, 8%Other, 6%
Subscription E-Commerce Services: Health And Personal Care Products
US, 2014A) Do you use subscription services in order to receive health and personal care products on a recurring basis?
B) For which types of products?

Birchbox capitalizes on this and generates over a quarter-billion dollars every year from its beauty subscription business.
Source: News Announcements, BI Intelligence
2010 2011 2012 2013 2014 E2015$0
$50,000,000
$100,000,000
$150,000,000
$200,000,000
$250,000,000
$300,000,000
74,000 250,000
533,333
1,152,000
2,304,000
Birchbox Subscription Business Annual RevenueBI Intelligence Estimates
Subscribers (In Thousands) Subscription Revenue
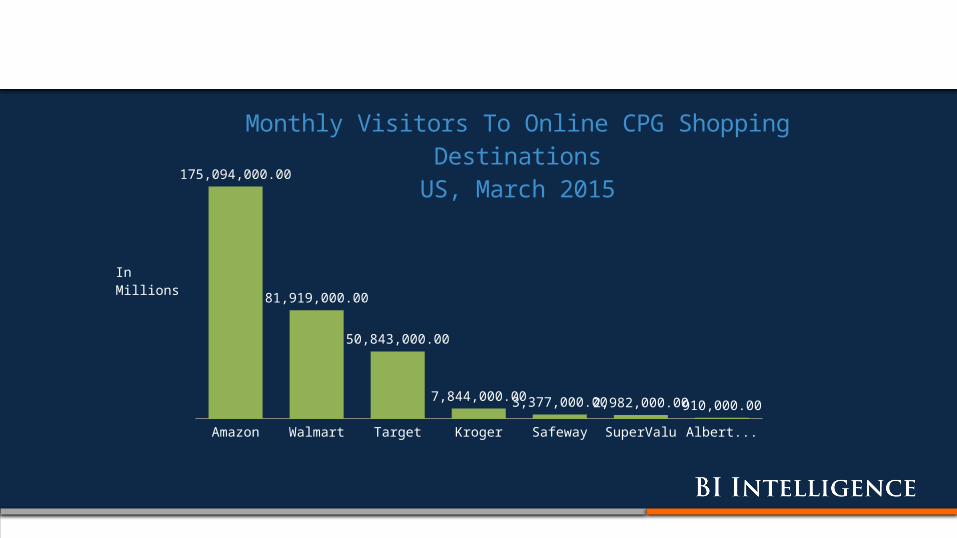
But Amazon is the most popular e-commerce destination for everyday products.
Source: comScore
Amazon Walmart Target Kroger Safeway SuperValu Albertsons
175,094,000.00
81,919,000.00
50,843,000.00
7,844,000.003,377,000.002,982,000.00 910,000.00
Monthly Visitors To Online CPG Shopping Destina-tions
US, March 2015
In Millions

Groceries are the biggest opportunity in e-commerce.
Source: US Economic Census, BI Intelligence
2005 2006 2007 2008 2009 2010 2011 2012 2013 E2014 E20150%
10%
20%
30%
40%
50%
60%Digital's Share Of US Retail Sales
Media, Sporting, and Hobby Goods Electronics, Appliances, ComputersClothing and Accessories Furniture and Home Furnishings Health and Personal Care Food and Beverage

Americans spend $600 billion a year buying groceries, but less than 1% of that is online.
Source: BI Intelligence
2002
2003
2004
2005
2006
2007
2008
2009
2010
2011
2012
2013
E201
4
E201
5
E201
6
E201
7
E201
8$0
$200,000
$400,000
$600,000
$800,000US Grocery Sales Forecast
Offline
On-line

Demand isn’t the issue. Consumers of all ages are willing to try grocery e-commerce services.
Source: Nielsen
Silent Generation (65+)
Baby Boomers (50-64)
Generation X (35-49)
Millennials (21-34)
Generation Z (15-20)
9%
17%
22%
30%
28%
35%
48%
57%
57%
55%
Consumers Ordering Groceries Online For Home Delivery, By Age (Global)
Already Using
Willing To Use

And cultural differences aren’t the issue either.Demand spans all geographic markets.
Source: Nielsen
Europe
North America
Latin America
Middle East-Africa
Asia-Pacific
13%
12%
13%
19%
37%
50%
55%
65%
58%
53%
Consumers Ordering Groceries Online For Home DeliveryBy Region
Already Using
Willing To Use

Source: Lonely Planet via Getty Images
So what is holding back digital from disrupting groceries?

The issue is that consumers don’t have the option.Only 5% of supermarkets offer mobile ordering.
Source: AppLovin, July 2014
Online Retail Department Store
Restaurant Chain
Pharmacy Supermarket
83%
75% 73%
50%
5%
Share Of Top US Retailers With An App That Has Purchasing Capabilities
Top 100 Retailers By Segment

And we know that consumers want to order groceries on mobile.
Source: PricerwaterhouseCoopers, October 2014
_x0
00
7_G
roce
ry
Furn
itu
re
_x0
01
1_H
ea
lth
an
d ..
.
_x0
01
0_S
po
rts
eq
u...
_x0
00
7_J
ew
elr
y
_x0
01
4_H
ou
seh
old
a...
_x0
00
7_A
pp
are
l
_x0
01
4_B
oo
ks, m
usi
...
_x0
00
b_E
lect
ron
ics
63% 68% 73% 74% 80% 84% 86% 86% 89%
37% 32% 27% 26% 20% 16% 14% 14% 12%
Breakdown Of E-Commerce Sales By ChannelUS
PC Mobile

Consumers spend more money when buying groceries online than if they were in a supermarket.
Source: Greycroft Science, Earnest Research
Blue
Apron
Hello
Fre
sh
Plat
ed
Inst
acar
t
Fres
hDire
ct
Peap
od
Fres
h Mar
ket
Harris
Tee
ter
Trad
er Jo
e's
Who
le Fo
ods
$61.20$71.07 $68.47
$79.70
$112.63
$166.83
$42.18 $49.38 $51.79 $52.32
Average Order Value, E-Commerce Grocery Services And Traditional Supermarkets
Repeat customers only; February 2015Fixed Subscription Subscription + Choice A la Carte Traditional Grocery

And online grocery shoppers make multiple orders per month.
Source: Greycroft Science, Earnest Research
Blue
Apron
Hello
Fre
sh
Plat
ed
Inst
acar
t
Fres
hDire
ct
Peap
od
Fres
h Mar
ket
Harris
Tee
ter
Trad
er Jo
e's
Who
le Fo
ods
2.35 2.18 2.18
2.89 2.9
1.73 1.83
3.59
2.17
2.83
Transactions Per Month Per Customer,E-Commerce Grocers And Traditional Supermarkets
Repeat customers onlyFixed Subscription Subscription + Choice A La Carte Traditional Grocery

Especially those repeat customers.
Source: Greycroft Science, Earnest Research
Blue Apron Hello Fresh Plated Instacart
1.761.52
1.69 1.65
2.352.18 2.18
2.89
Transactions Per Month Per Customer, By E-Commerce Grocery Service
New customer Repeat customer

Online grocers, such as FreshDirect, are generating 2x more money per customer per month than traditional supermarkets.
Source: Greycroft Science, Earnest Research
Blue
Apron
Hello
Fre
sh
Plat
ed
Inst
acar
t
Fres
hDire
ct
Peap
od
Fres
h Mar
ket
Harris
Tee
ter
Trad
er Jo
e's
Who
le Fo
ods
$144 $155 $149
$230
$327$289
$77
$177
$112$148
Average Spending Per Customer Per Month, E-Commerce Grocers And Traditional Supermarkets
Fixed Subscription Subscription + Choice A La Carte Traditional Grocery

We estimate that Instacart will handle $600 milliona year in online grocery orders by 2016.
Source: News Filings, BI Intelligence
2012 2013 2014 P2015 E2016$0
$100,000,000
$200,000,000
$300,000,000
$400,000,000
$500,000,000
$600,000,000
$700,000,000
Instacart Annual Sales HandledBI Intelligence Estimates

Now let’s look at how the mass merchants are faring: the retailers that sell all of these products.

Amazon’s growth has decelerated; but it’s still outperforming competitors.
Source: Amazon
Q4 2011
Q1 2012
Q2 2012
Q3 2012
Q4 2012
Q1 2013
Q2 2013
Q3 2013
Q4 2013
Q1 2014
Q2 2014
Q3 2014
Q4 2014
Q1 2015
0%
20%
40%
60%
80%
$10,913
$7,975$8,161$8,558
$13,934
$10,214$10,415$11,048
$17,126
$13,017$13,278$13,953
$20,638
$15,628
Amazon Retail RevenueIn $ Billions; Global
YoY Growth

eBay is in a downward spiral.
Source: eBay
Q4 2011
Q1 2012
Q2 2012
Q3 2012
Q4 2012
Q1 2013
Q2 2013
Q3 2013
Q4 2013
Q1 2014
Q2 2014
Q3 2014
Q4 2014
Q1 2015
Q2 2015
-6%
0%
6%
12%
18%
$16,490$16,206$16,171$16,281
$19,105$18,326$18,292$18,345
$21,518$20,545$20,485$20,075
$21,849$20,195$20,061
eBay Gross Merchandise VolumeIn $ Billions; Global; Ex-Auto
YoY Growth

Walmart still relies heavily on brick-and-mortar sales.
Source: Walmart, Internet Retailer, BI Intelligence
2010 2011 2012 2013 2014$0
$100,000
$200,000
$300,000
$400,000
$500,000
$600,000Walmart Annual Sales
GlobalIn-store Digital

As does Target.
Source: Target, Internet Retailer, BI Intelligence
2011 2012 2013 2014$0
$10,000
$20,000
$30,000
$40,000
$50,000
$60,000
$70,000
$80,000Target Annual Sales
Digital
In-store

But Target leads Walmart when it comes to e-commerce.
Source: Target, Walmart, BI Intelligence
2011 2012 2013 20140.0%
0.5%
1.0%
1.5%
2.0%
2.5%
3.0%
3.5%
4.0%
4.5%E-Commerce Share Of Revenues
TargetWalmart

Conversion rates are rising on mass merchant e-commerce sites, which means that shoppers aren’t just browsing online, they are buying.
Source: Kantar Retail ShopperScape, December of each year
Target.com Kohls.com Walmart.com Amazon
31%
46% 46%
80%
36%
49%56%
86%
36%
54% 56%
82%
48%
58% 60%
85%
58%63% 66%
89%
Holiday E-Commerce Conversion Rate Shoppers who purchased on website as % of total website vis-
itors*Desktop-only, US-only
2010 2011 2012 2013 2014

And digital isn’t just disrupting how people shop, it’s also changing the way they receive their purchases.
Source: Flickr, US Department of Labor

Consumers are demanding faster delivery.
Source: Stony Brook University
Same or next day Two to three days Four to five days More than five days
Depends
4%
31%
35%
23%
7%
Delivery Speed Option Selected Most OftenAnswered by US e-commerce shoppers
Q1 2015

So retailers are getting competitive with lower thresholds for free shipping.
Source: Company info
JCPenney.com Macys.com Kohls.com Walmart.com Gap.com Amazon.com Target.com
$99 $99
$75
$50 $50
$35
$25
Minimum Order Value Required For Free Standard Shipping
US, February 2015
*Note: As of February 24, 2015

The demand for fast shipping has benefitted on-demand delivery startups like Postmates.
Source: Postmates, BI Intelligence Estimates
May-12 Sep-12 Jan-13 May-13 Sep-13 Jan-14 May-14 Sep-14 Jan-150
200,000
400,000
600,000
800,000
1,000,000
1,200,000
1,400,000
1,600,000Postmates Cumulative DeliveriesUS-only

Retailers and shippers will look to technology to lower the cost of delivery, which is why companies—from Google to Uber to Amazon—are interested in autonomous vehicles.
Source: ARK Research
$2.25$2.15
$0.76
$0.25
Estimated Cost Per Mile Of Vehicle Services For ConsumersUS
*Estimate for the year 2020

And they’ll also look to technology to help increase the speed of delivery.
Source: ARK Investment Management, Company info
$0
$2
$4
$6
$8
$10
$12
$14
USPS Priority 1-Day$5.25
FedEx Ground$8.32
UPS Ground$12.92
Google Shopping$4.99
Amazon Same-Day $8.99
Amazon Prime Air*$1.00
Delivery Fee That Consumers Pay For A Small Package2.2kg (5lb) package delivered within 16.1km (10 miles) in the
US
Delivery
Fee
30 MINUTES SAME-DAY NEXT-DAY
*Launch date unknown, and delivery fee is an estimate

It’s technology that is driving the digital disruption of retail.

Sign up for BI Intelligence for more content
like this
Subscribe to Business Insider’s research service to
get rich analysis and key insights on today’s most
relevant topics in the digital landscape
intelligence.businessinsider.com

intelligence.businessinsider.com
Henry BlodgetCEO & Editor-in-Chief
Emily AdlerManaging Editor
Barbara PengVice President,Research
Cooper Smith Senior Research Analyst
BI Intelligence
Nancee HalpinResearch Associate
BII E-COMMERCE