Embed Size (px)
Citation preview
THE WEALTH REPORT 2015
1
THE WEALTH REPORT 2015
INDIA DR. SAMANTAK DAS
Chief Economist & Director - Research

Wealthy Indians - today and tomorrow
The Wealth Report
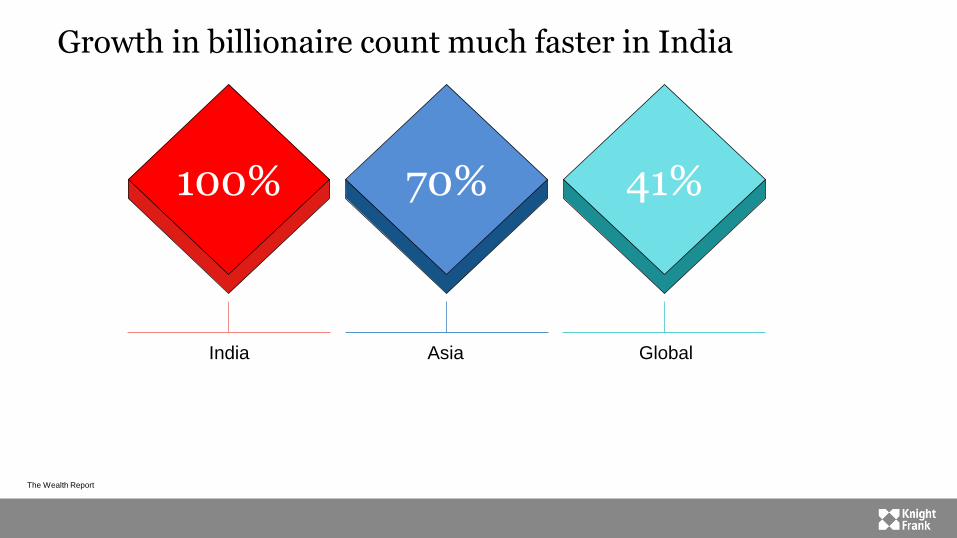
Growth in billionaire count much faster in India
The Wealth Report
70% 100% 41%
India
% forecast growth in commercial
investment volumes during 2015
Asia Global
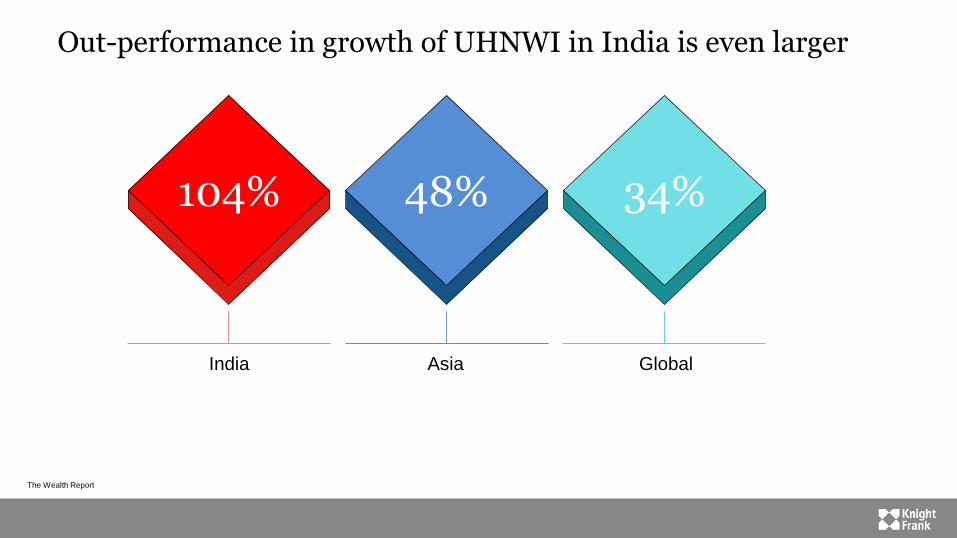
Out-performance in growth of UHNWI in India is even larger
The Wealth Report
48% 104% 34%
India
% forecast growth in commercial
investment volumes during 2015
Asia Global
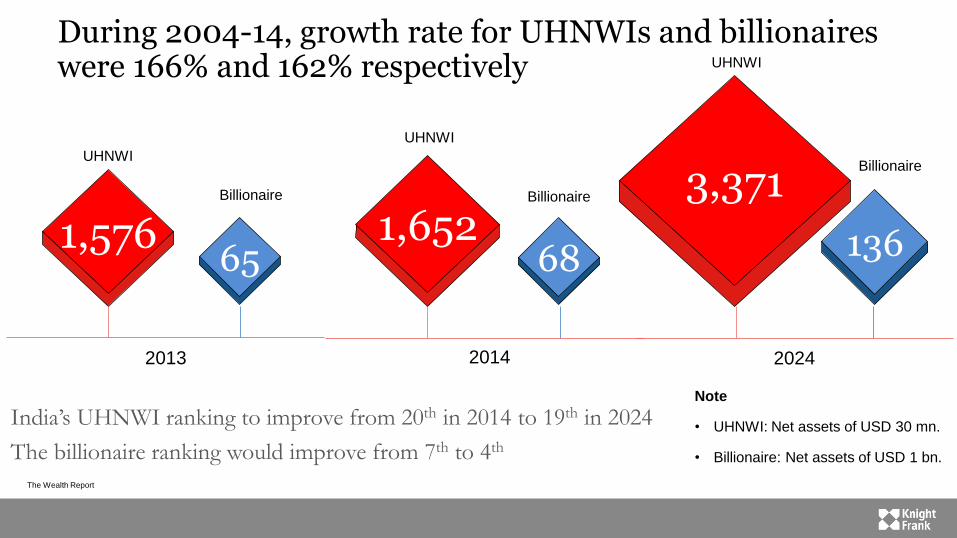
During 2004-14, growth rate for UHNWIs and billionaires were 166% and 162% respectively
The Wealth Report
Note
• UHNWI: Net assets of USD 30 mn.
• Billionaire: Net assets of USD 1 bn.
65 1,576
2013
68 1,652
2014
136
3,371
2024
India’s UHNWI ranking to improve from 20th in 2014 to 19th in 2024
The billionaire ranking would improve from 7th to 4th Insert legend
UHNWI
Billionaire
UHNWI
Billionaire
UHNWI
Billionaire
The Wealth Report
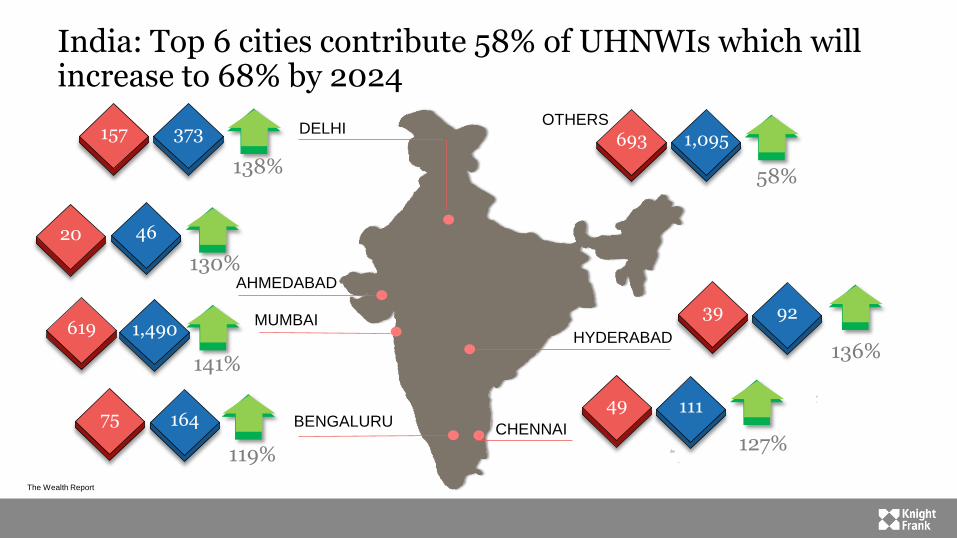
India: Top 6 cities contribute 58% of UHNWIs which will increase to 68% by 2024
CHENNAI BENGALURU
MUMBAI
AHMEDABAD
HYDERABAD
DELHI
20 46
130%
157 373
138%
39 92
136%
49 111
127%
619 1,490
141%
75 164
119%
693 1,095
58%
OTHERS
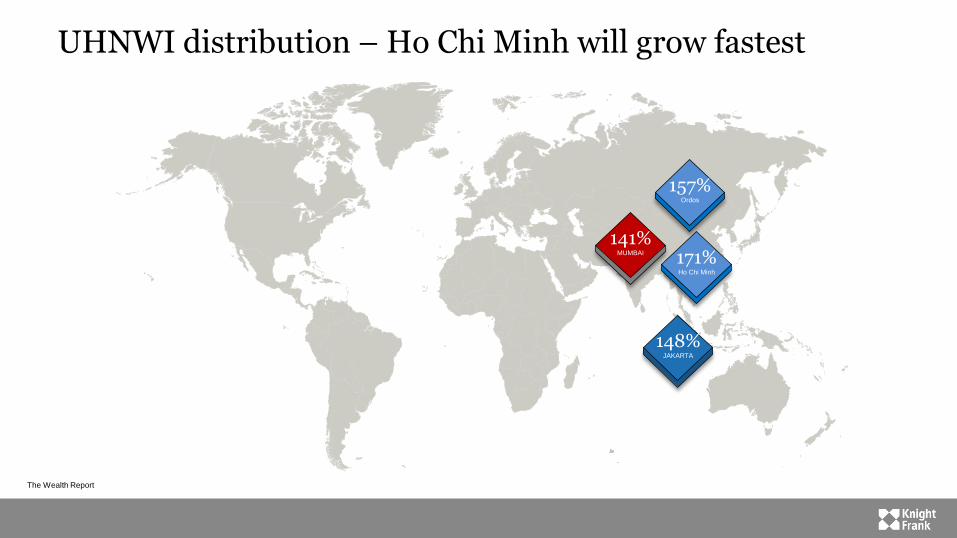
UHNWI distribution – Ho Chi Minh will grow fastest
The Wealth Report
148% JAKARTA
171% Ho Chi Minh
157% Ordos
141% MUMBAI
The Wealth Report
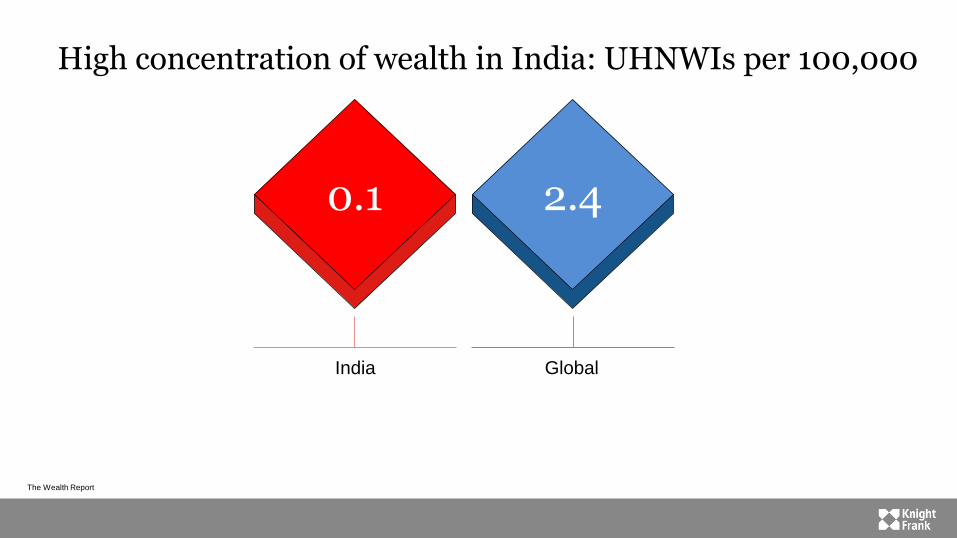
High concentration of wealth in India: UHNWIs per 100,000
2.4 0.1
India Global
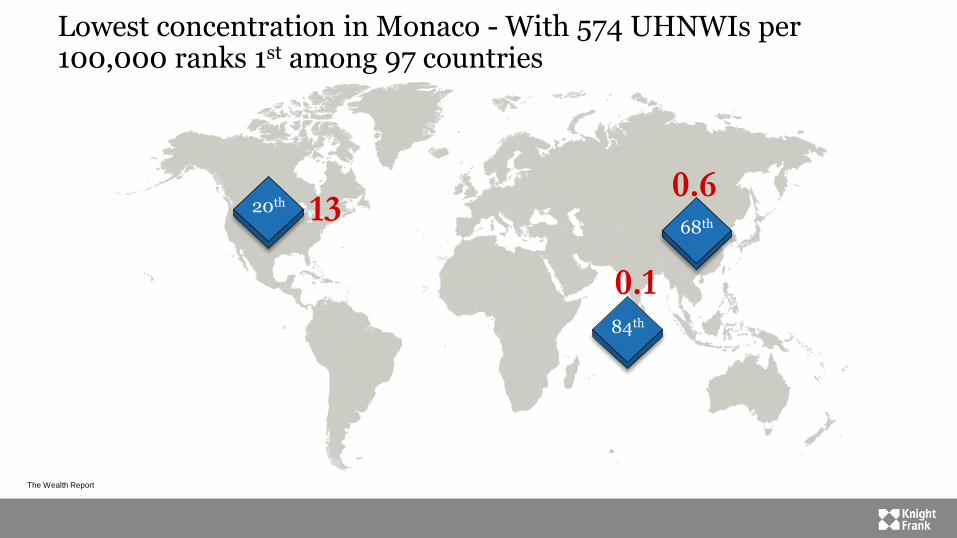
Lowest concentration in Monaco - With 574 UHNWIs per 100,000 ranks 1st among 97 countries
The Wealth Report
20th 68th
84th
13 0.6
0.1
What do wealthy Indians think?
The Wealth Report
The Wealth Report
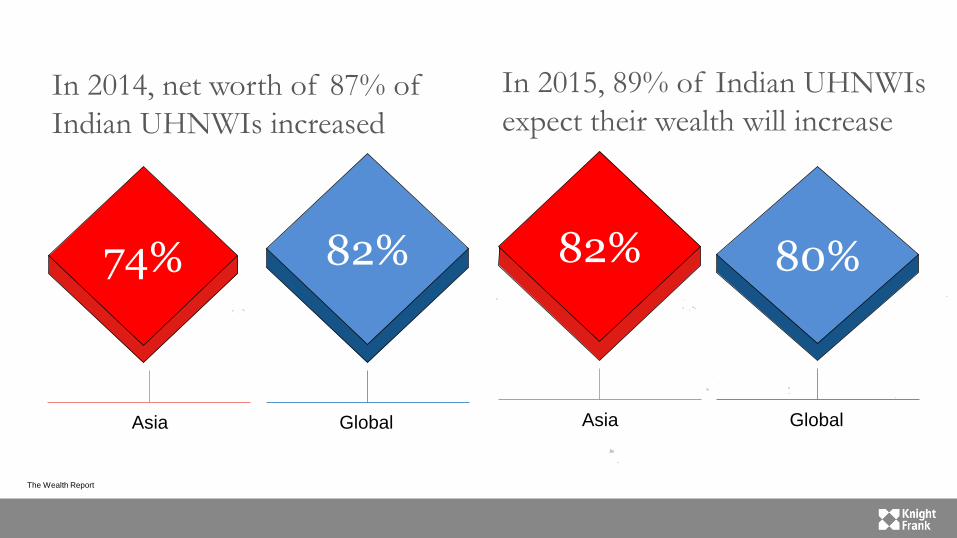
82% 74%
Asia Global
In 2014, net worth of 87% of
Indian UHNWIs increased
80% 82%
Asia Global
In 2015, 89% of Indian UHNWIs
expect their wealth will increase
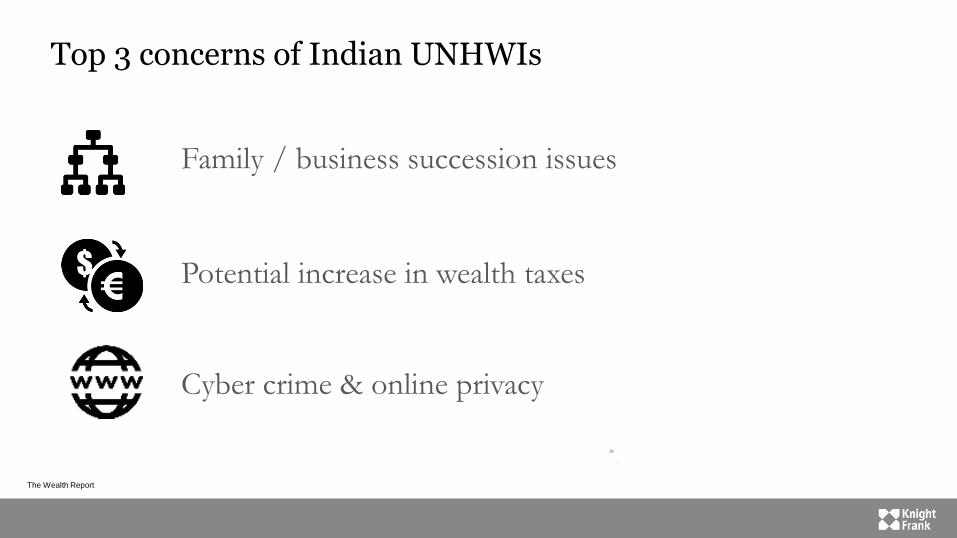
Top 3 concerns of Indian UNHWIs
The Wealth Report
Family / business succession issues
Potential increase in wealth taxes
Cyber crime & online privacy
The Wealth Report
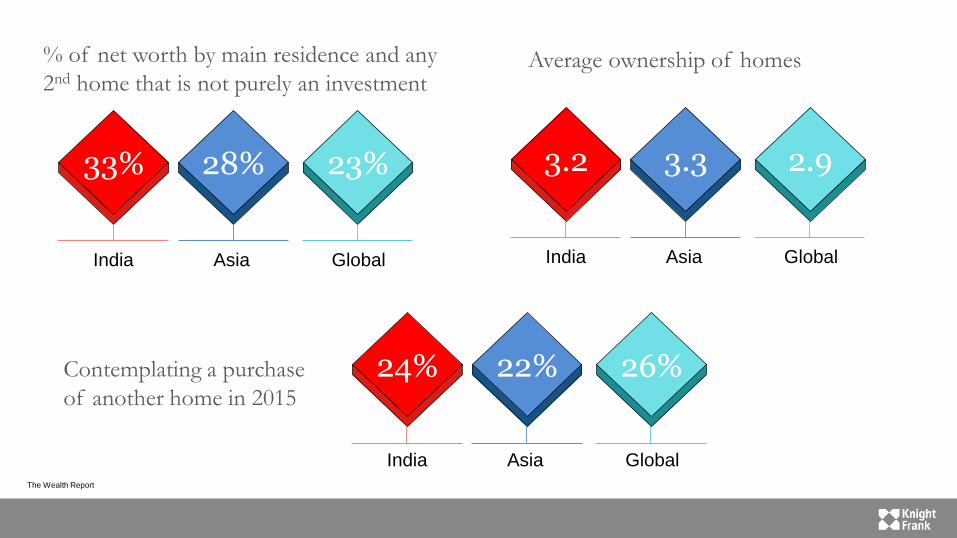
28% 33% 23%
India Asia Global
% of net worth by main residence and any
2nd home that is not purely an investment
3.3 3.2 2.9
India Asia Global
Average ownership of homes
22% 24% 26%
India Asia Global
Contemplating a purchase
of another home in 2015
The Wealth Report
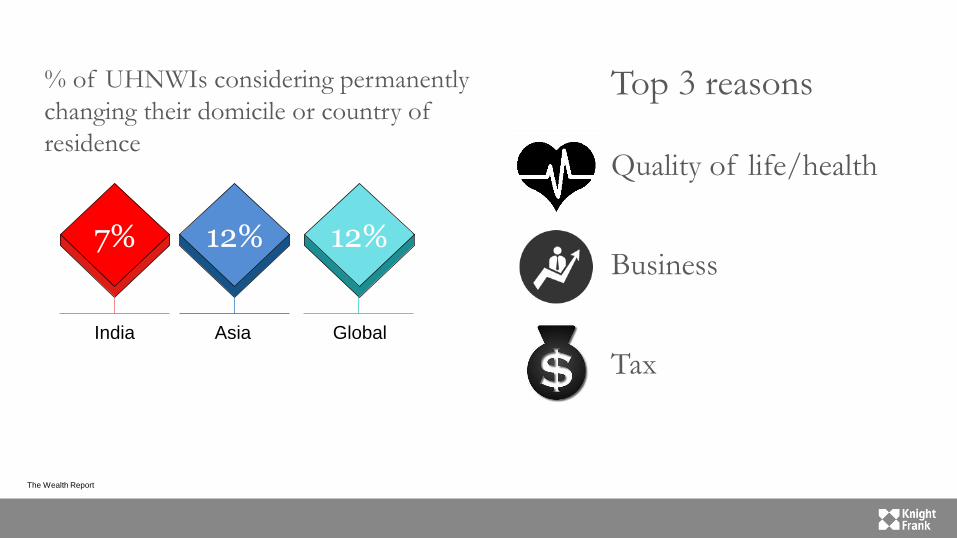
12% 7% 12%
India Asia Global
% of UHNWIs considering permanently
changing their domicile or country of
residence
Top 3 reasons
Quality of life/health
Business
Tax
The Wealth Report
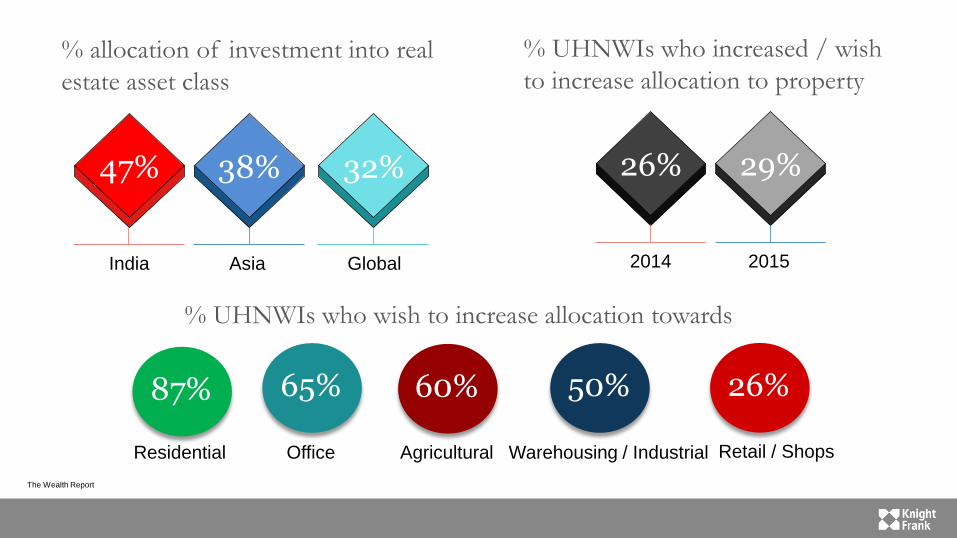
38% 47% 32%
India Asia Global
% allocation of investment into real
estate asset class
29% 26%
2014 2015
% UHNWIs who increased / wish
to increase allocation to property
% UHNWIs who wish to increase allocation towards
87%
Residential
65%
Office
60%
Agricultural
50%
Warehousing / Industrial
26%
Retail / Shops
The Wealth Report
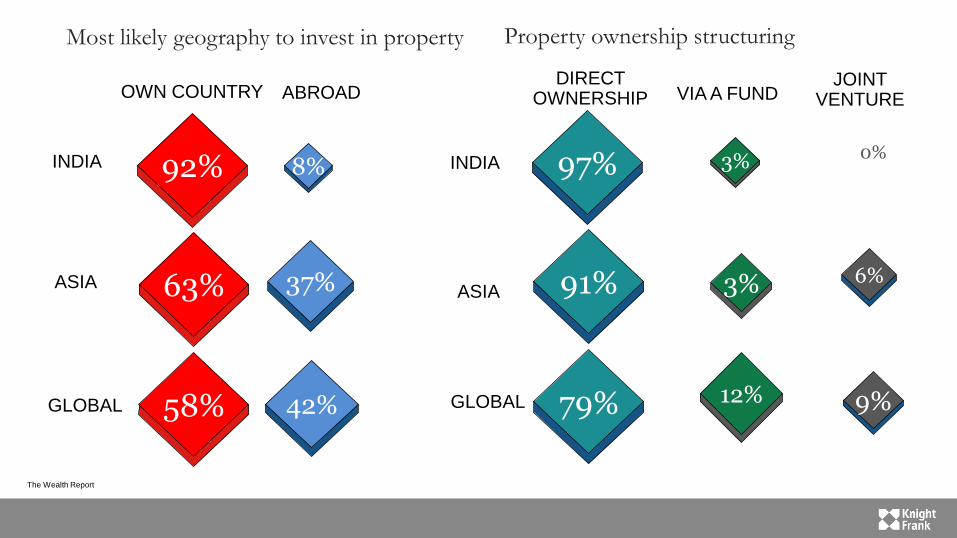
Most likely geography to invest in property Property ownership structuring
8% 92% INDIA
OWN COUNTRY ABROAD
GLOBAL
ASIA 37% 63%
42% 58%
3% 97%
DIRECT OWNERSHIP VIA A FUND
3% 91%
12% 79%
JOINT VENTURE
6%
9%
0% INDIA
GLOBAL
ASIA

The Wealth Report
Change in investment in other asset classes – Allocation to equity investments and own business to increase remarkably
EQUITIES
OWN BUSINESS
CASH
FIXED INCOME BONDS
GOLD / PRECIOUS METALS
95%
70%
-39%
0%
-55%
45%
39%
-9%
-17%
-17%
52%
46%
6%
12%
-48%
IND
IA
GL
OB
AL
AS
IA
The Wealth Report
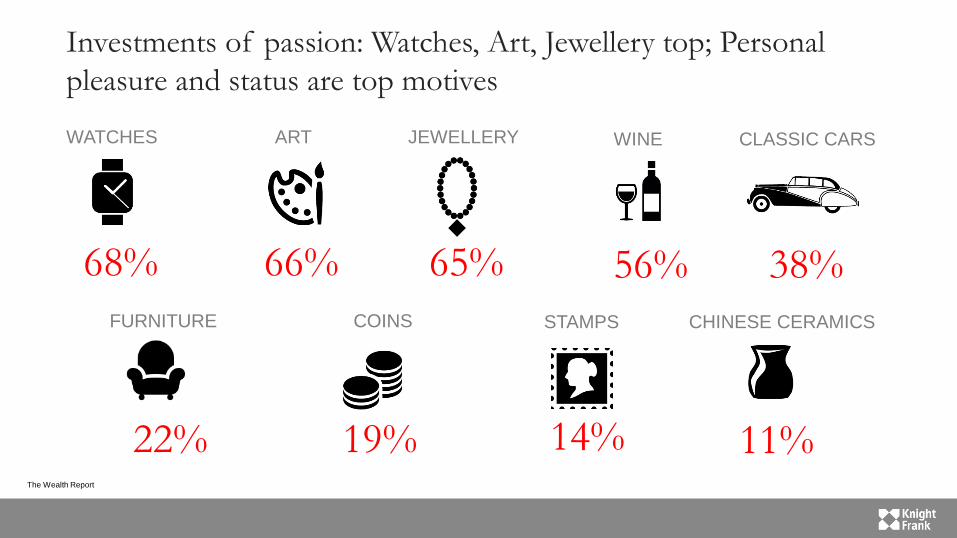
Investments of passion: Watches, Art, Jewellery top; Personal
pleasure and status are top motives
38%
CLASSIC CARS
66%
ART
56%
WINE
22%
FURNITURE STAMPS
19%
COINS
14%
68%
WATCHES
65%
JEWELLERY
CHINESE CERAMICS
11%

Prime Residential Property Prices
The Wealth Report
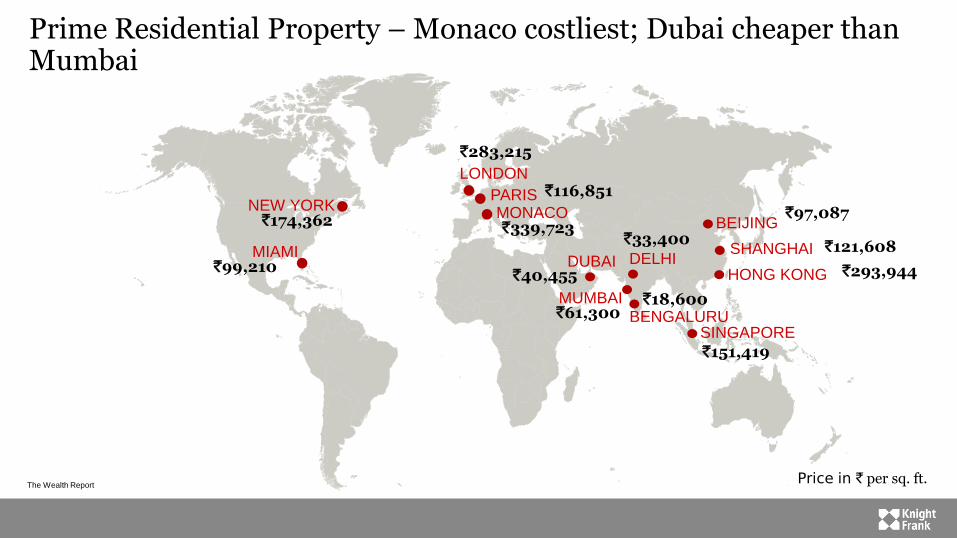
Prime Residential Property – Monaco costliest; Dubai cheaper than Mumbai
The Wealth Report
`174,362 `339,723
`283,215
`151,419
`293,944 HONG KONG
SINGAPORE
MONACO
LONDON
NEW YORK
`121,608 SHANGHAI
PARIS `116,851
`99,210 MIAMI
`97,087 BEIJING
DELHI
BENGALURU MUMBAI
DUBAI
`33,400
`61,300 `18,600
`40,455
Price in ` per sq. ft.
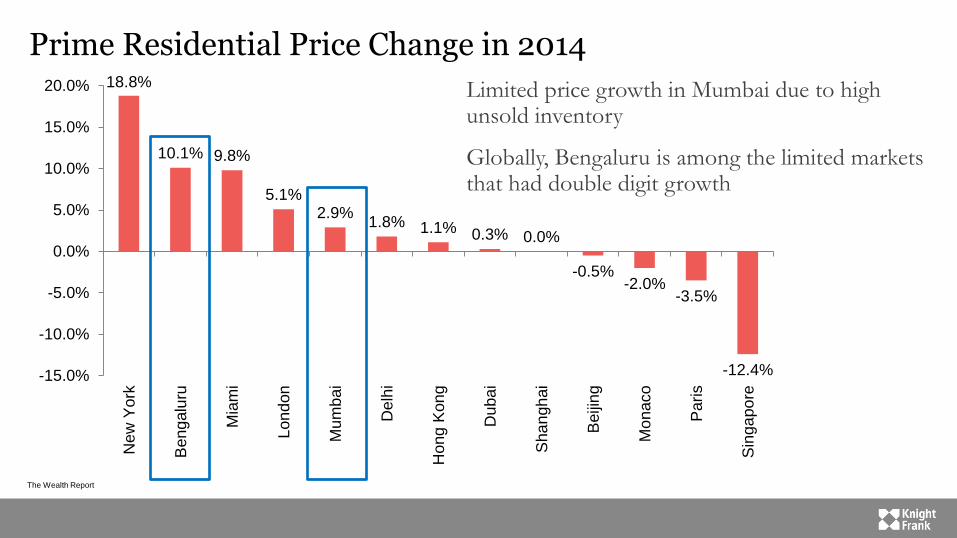
Prime Residential Price Change in 2014
The Wealth Report
Limited price growth in Mumbai due to high unsold inventory
Globally, Bengaluru is among the limited markets that had double digit growth
18.8%
10.1% 9.8%
5.1% 2.9%
1.8% 1.1% 0.3% 0.0%
-0.5% -2.0%
-3.5%
-12.4% -15.0%
-10.0%
-5.0%
0.0%
5.0%
10.0%
15.0%
20.0%
New
York
Ben
galu
ru
Mia
mi
Lon
don
Mu
mb
ai
Delh
i
Hong
Kon
g
Duba
i
Sha
ngh
ai
Beiji
ng
Mo
naco
Pari
s
Sin
ga
po
re
Cities preferred by Global UHNWIs
The Wealth Report
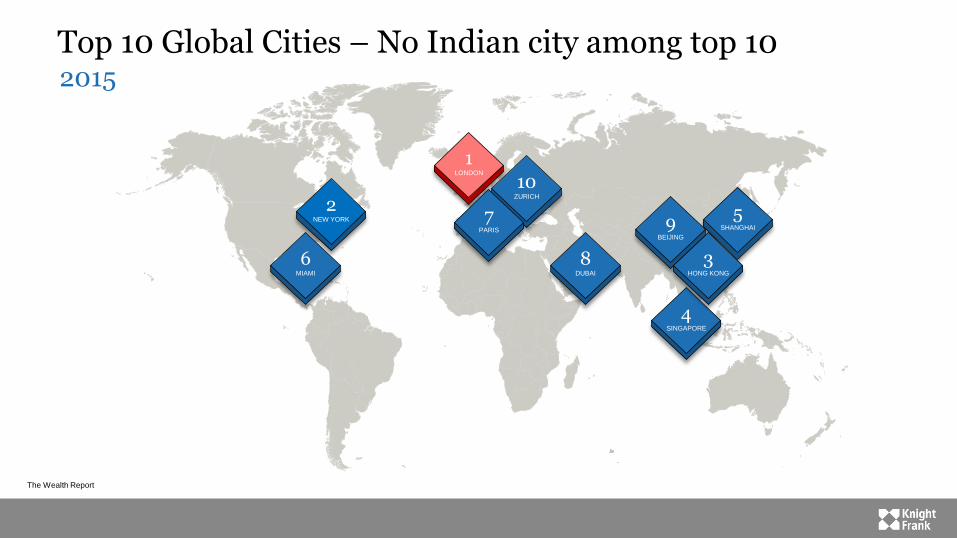
Top 10 Global Cities – No Indian city among top 10
The Wealth Report
2 NEW YORK 5
SHANGHAI
6 MIAMI
8 DUBAI
9 BEIJING
4 SINGAPORE
1 LONDON
10 ZURICH
7 PARIS
3 HONG KONG
2015
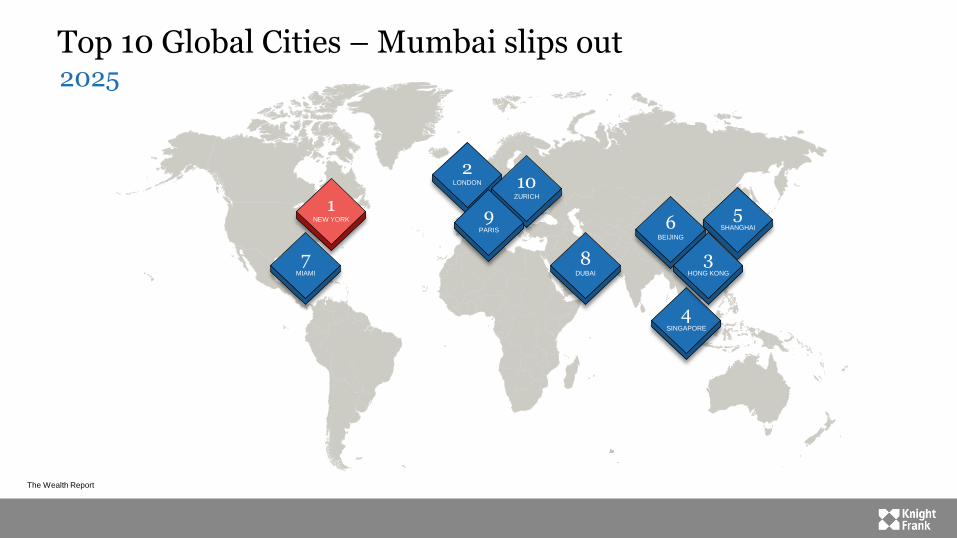
Top 10 Global Cities – Mumbai slips out
The Wealth Report
1 NEW YORK 5
SHANGHAI
7 MIAMI
8 DUBAI
6 BEIJING
4 SINGAPORE
2 LONDON 10
ZURICH
9 PARIS
3 HONG KONG
2025

Key Takeaways
By 2024, only USA, China and Russia will have more billionaires than India
Top 6 cities in India contribute 58% of UHNWIs in the country. This dominance shall further accelerate to 68% by 2024
The country has high concentration of wealth in the hands of few – ranks 84th out of 97 countries
24% Indian UHNWIs are contemplating a purchase of another home in 2015
The Wealth Report

THE WEALTH REPORT 2015
27