Embed Size (px)
Citation preview
FUTURE OF B.C. HOUSING REPORT A study of buyer and renter sentiment in British Columbia

Resonance Consultancy is a global advisor on real estate, tourism and economic development for leading developers, destinations and cities around the world.
R E S O N A N C E C O . C O M
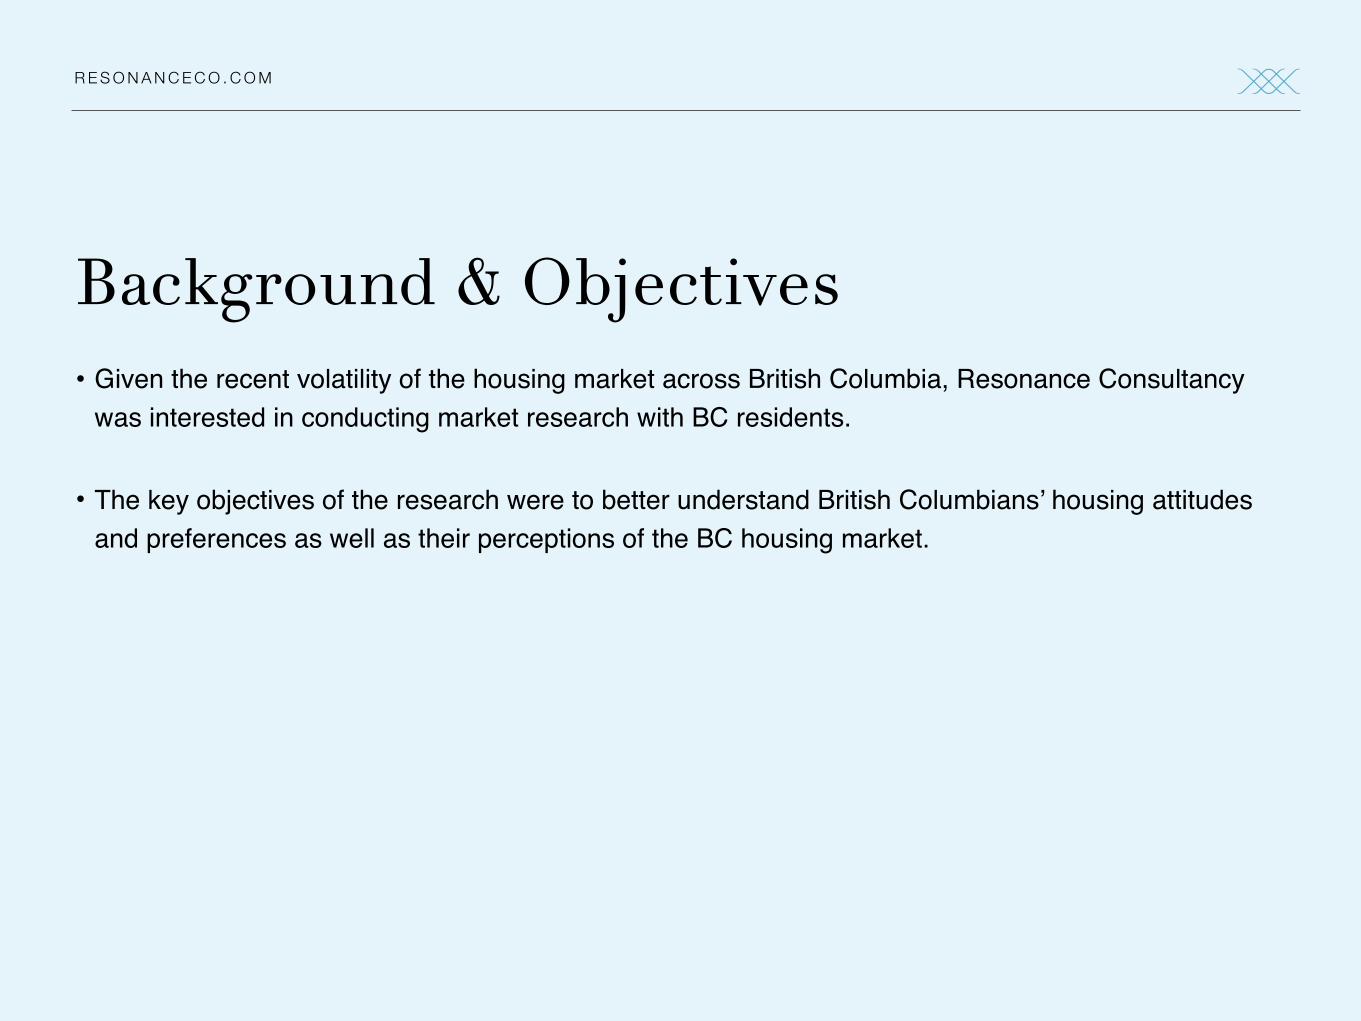
Background & Objectives
R E S O N A N C E C O . C O M
• Given the recent volatility of the housing market across British Columbia, Resonance Consultancy was interested in conducting market research with BC residents.
• The key objectives of the research were to better understand British Columbians’ housing attitudes and preferences as well as their perceptions of the BC housing market.
4
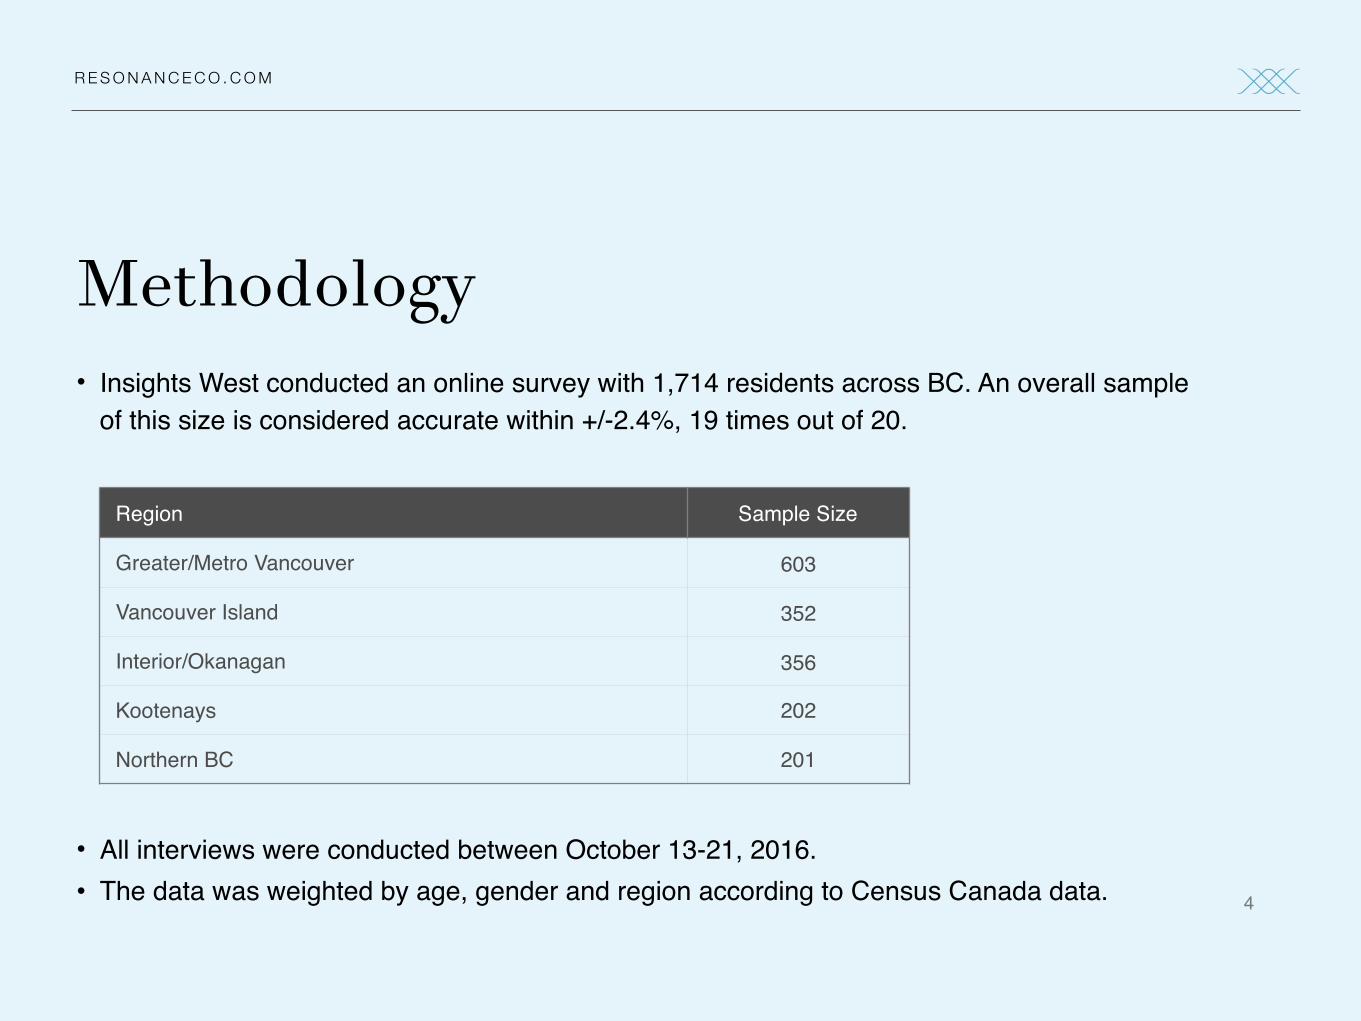
• Insights West conducted an online survey with 1,714 residents across BC. An overall sample of this size is considered accurate within +/-2.4%, 19 times out of 20.
• All interviews were conducted between October 13-21, 2016.• The data was weighted by age, gender and region according to Census Canada data.
Region Sample Size
Greater/Metro Vancouver 603
Vancouver Island 352
Interior/Okanagan 356
Kootenays 202
Northern BC 201
R E S O N A N C E C O . C O M
Methodology

A PROVINCE ON THE MOVE
R E S O N A N C E C O . C O M
R E S O N A N C E C O . C O M
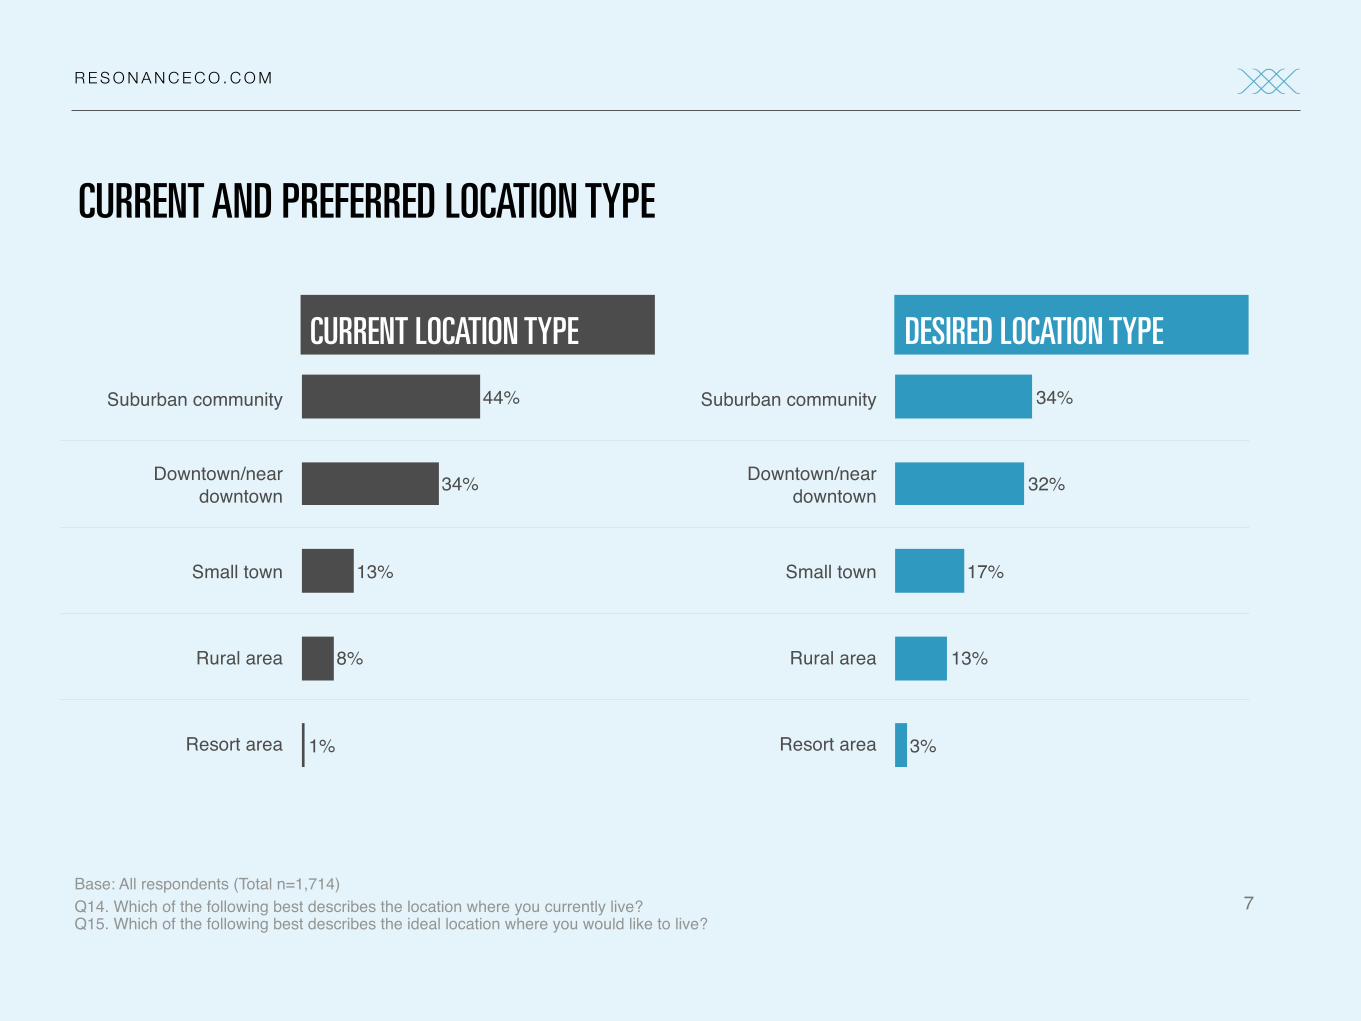
Most British Columbians currently live in a suburban community or downtown/near downtown,which are also the two most desired locations.
R E S O N A N C E C O . C O M
7Base: All respondents (Total n=1,714)Q14. Which of the following best describes the location where you currently live? Q15. Which of the following best describes the ideal location where you would like to live?
CURRENT LOCATION TYPE DESIRED LOCATION TYPE
Suburban community Suburban community
Downtown/near downtown
Downtown/near downtown
Small town Small town
Rural area Rural area
Resort area Resort area 3%
13%
17%
32%
34%
1%
8%
13%
34%
44%
CURRENT AND PREFERRED LOCATION TYPE
R E S O N A N C E C O . C O M
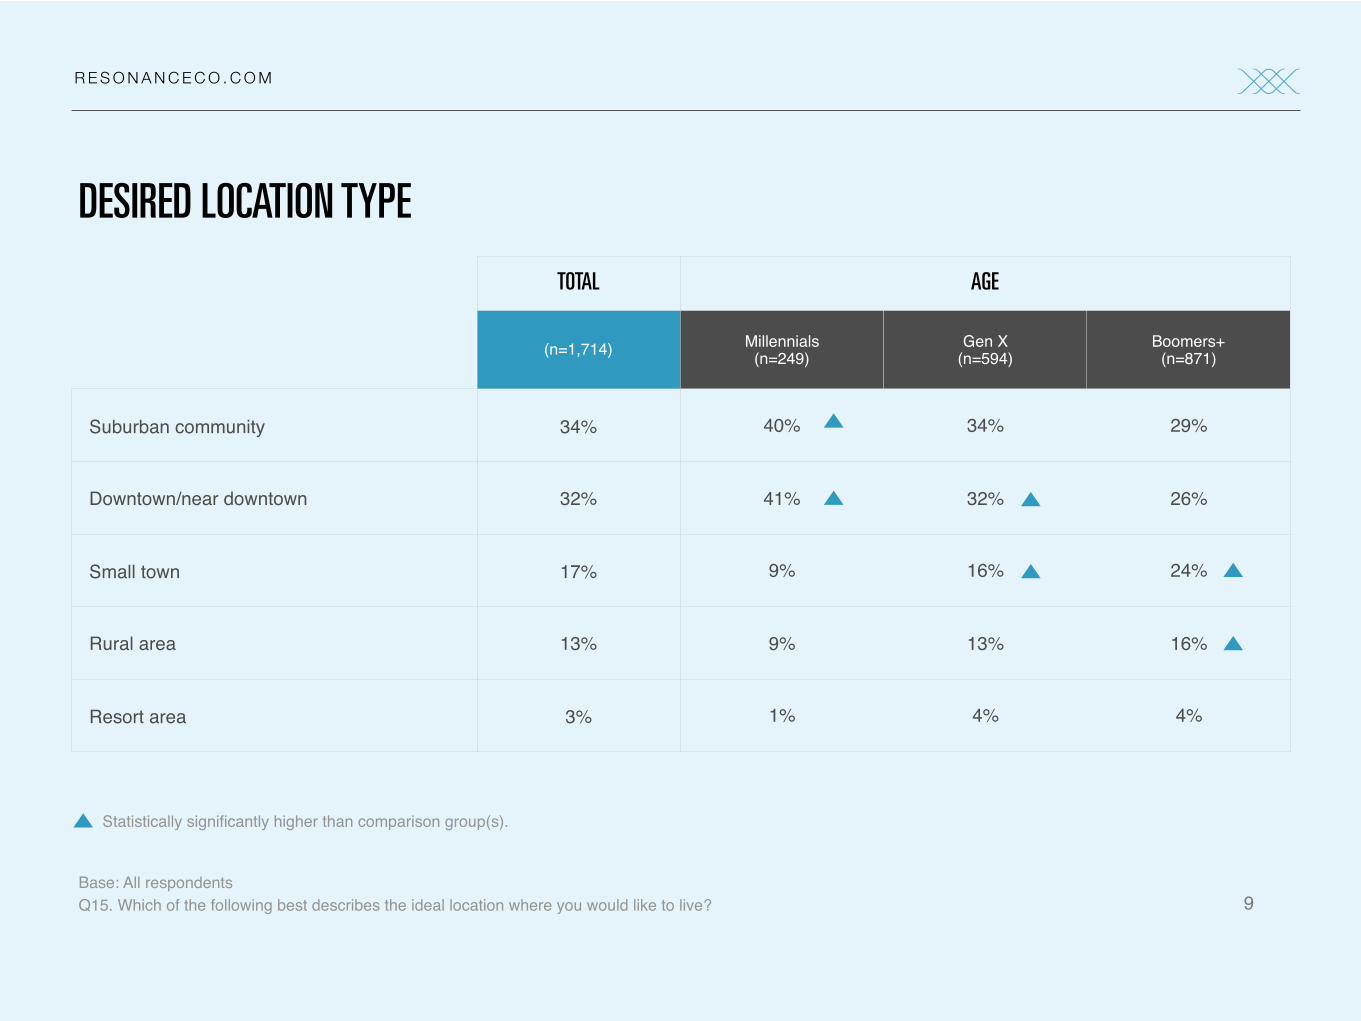
Millennials’ location preference is equally divided between urban and suburban locations.
R E S O N A N C E C O . C O M
9Base: All respondentsQ15. Which of the following best describes the ideal location where you would like to live?
TOTAL AGE
(n=1,714) Millennials(n=249)
Gen X(n=594)
Boomers+(n=871)
Suburban community 34% 40% 34% 29%
Downtown/near downtown 32% 41% 32% 26%
Small town 17% 9% 16% 24%
Rural area 13% 9% 13% 16%
Resort area 3% 1% 4% 4%
Statistically significantly higher than comparison group(s).
DESIRED LOCATION TYPE

R E S O N A N C E C O . C O M
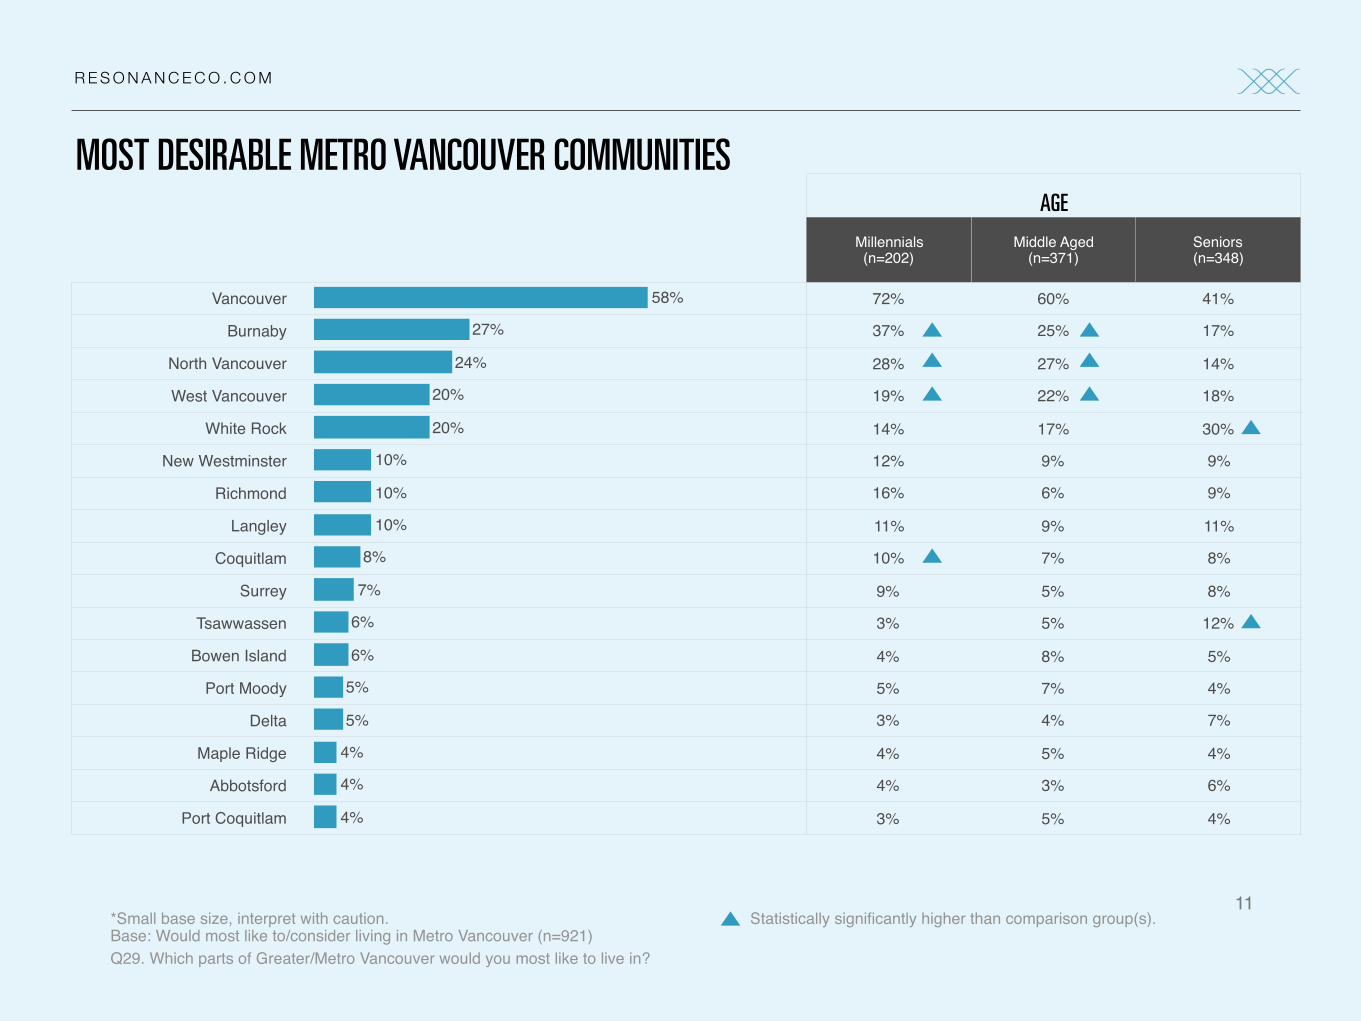
Vancouver is viewed to be the most desirable city in Metro Vancouver, followed by Burnaby in a distant 2nd
AGE
Millennials(n=202)
Middle Aged (n=371)
Seniors(n=348)
Vancouver 72% 60% 41%
Burnaby 37% 25% 17%
North Vancouver 28% 27% 14%
West Vancouver 19% 22% 18%
White Rock 14% 17% 30%
New Westminster 12% 9% 9%
Richmond 16% 6% 9%
Langley 11% 9% 11%
Coquitlam 10% 7% 8%
Surrey 9% 5% 8%
Tsawwassen 3% 5% 12%
Bowen Island 4% 8% 5%
Port Moody 5% 7% 4%
Delta 3% 4% 7%
Maple Ridge 4% 5% 4%
Abbotsford 4% 3% 6%
Port Coquitlam 3% 5% 4%
R E S O N A N C E C O . C O M
11*Small base size, interpret with caution.Base: Would most like to/consider living in Metro Vancouver (n=921)Q29. Which parts of Greater/Metro Vancouver would you most like to live in?
Statistically significantly higher than comparison group(s).
MOST DESIRABLE METRO VANCOUVER COMMUNITIES
4%
4%
4%
5%
5%
6%
6%
7%
8%
10%
10%
10%
20%
20%
24%
27%
58%
More than 4-in-10 home owners and 7-in-10 renters are planning to buy/rent a different home in the next 5 years.
R E S O N A N C E C O . C O M
R E S O N A N C E C O . C O M
Among those likely to move in the next 5 years, three-quarters are likely to stay in the same city/region, with Vancouver Island residents being the most likely to stay in the same city/region.
R E S O N A N C E C O . C O M
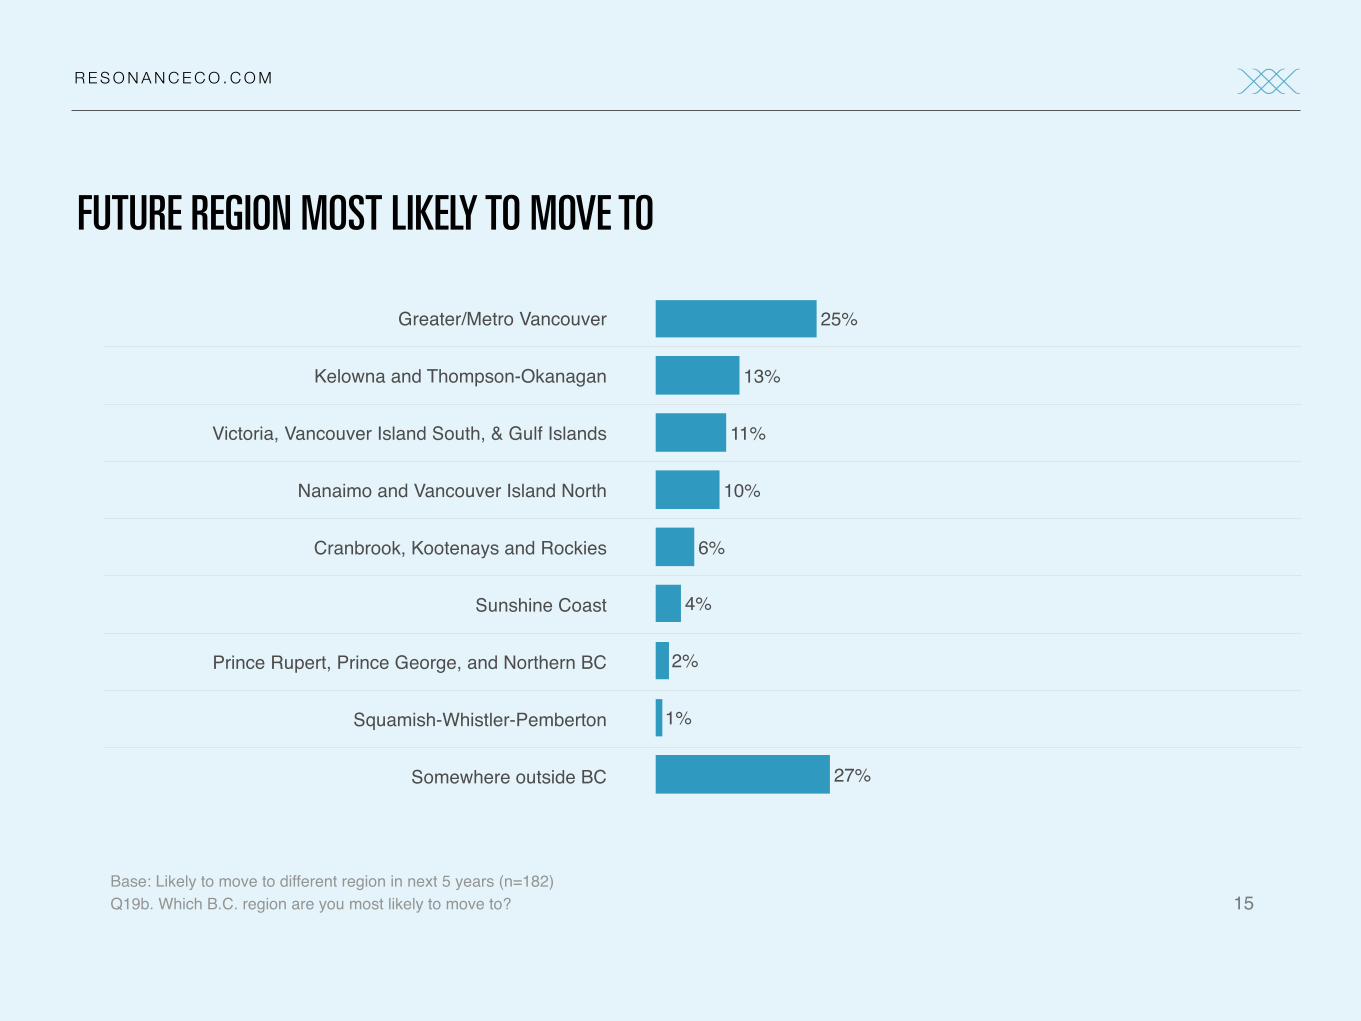
Among the 1-in-4 residents who plan to move to a different region, one-quarter are most likely to move to Metro Vancouver, while another quarter are likely to move outside BC.
R E S O N A N C E C O . C O M
Greater/Metro Vancouver
Kelowna and Thompson-Okanagan
Victoria, Vancouver Island South, & Gulf Islands
Nanaimo and Vancouver Island North
Cranbrook, Kootenays and Rockies
Sunshine Coast
Prince Rupert, Prince George, and Northern BC
Squamish-Whistler-Pemberton
Somewhere outside BC
15Base: Likely to move to different region in next 5 years (n=182)Q19b. Which B.C. region are you most likely to move to?
27%
1%
2%
4%
6%
10%
11%
13%
25%
FUTURE REGION MOST LIKELY TO MOVE TO
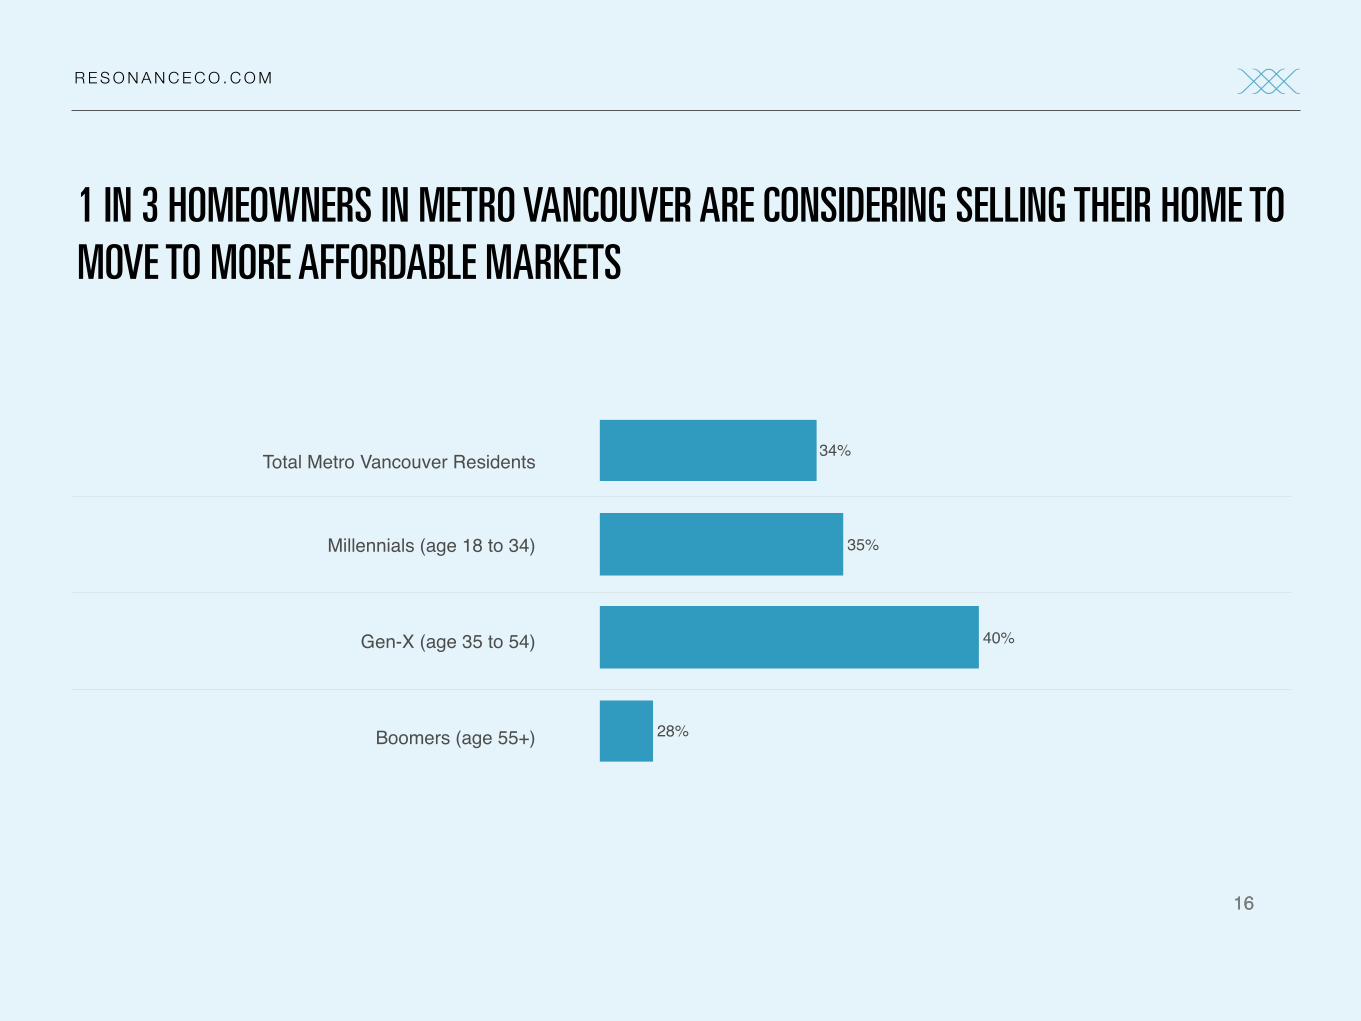
1 IN 3 HOMEOWNERS IN METRO VANCOUVER ARE CONSIDERING SELLING THEIR HOME TO MOVE TO MORE AFFORDABLE MARKETS
Total Metro Vancouver Residents
Millennials (age 18 to 34)
Gen-X (age 35 to 54)
Boomers (age 55+)
R E S O N A N C E C O . C O M
1616
28%
40%
35%
34%
R E S O N A N C E C O . C O M
17
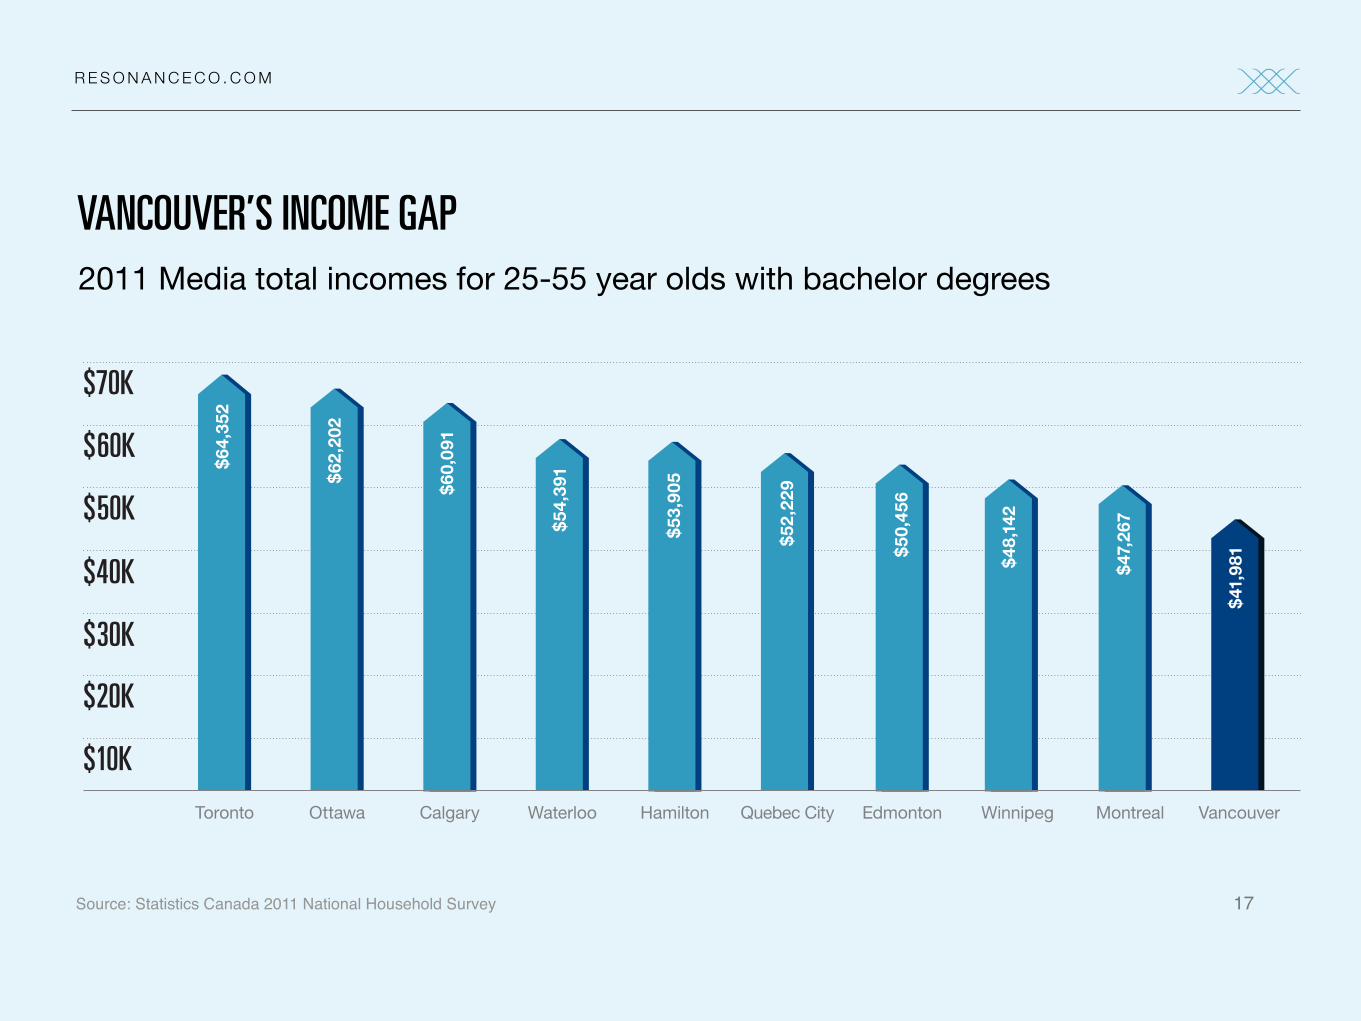
VANCOUVER’S INCOME GAP
$10K
$30K
$50K
$20K
$40K
$60K
$70K
$62,20
2
$60,09
1
$54,39
1
$53,90
5
$52,22
9
$50,45
6
$48,14
2
$47,26
7
$41,98
1
$64,35
2
Toronto HamiltonCalgary Edmonton MontrealOttawa Quebec CityWaterloo Winnipeg Vancouver
Source: Statistics Canada 2011 National Household Survey
2011 Media total incomes for 25-55 year olds with bachelor degrees

R E S O N A N C E C O . C O M
PREFERRED PRODUCTS

R E S O N A N C E C O . C O M
Single family homes are the top property types currently owned, while vacation homes and single family homes are the most desired property types.
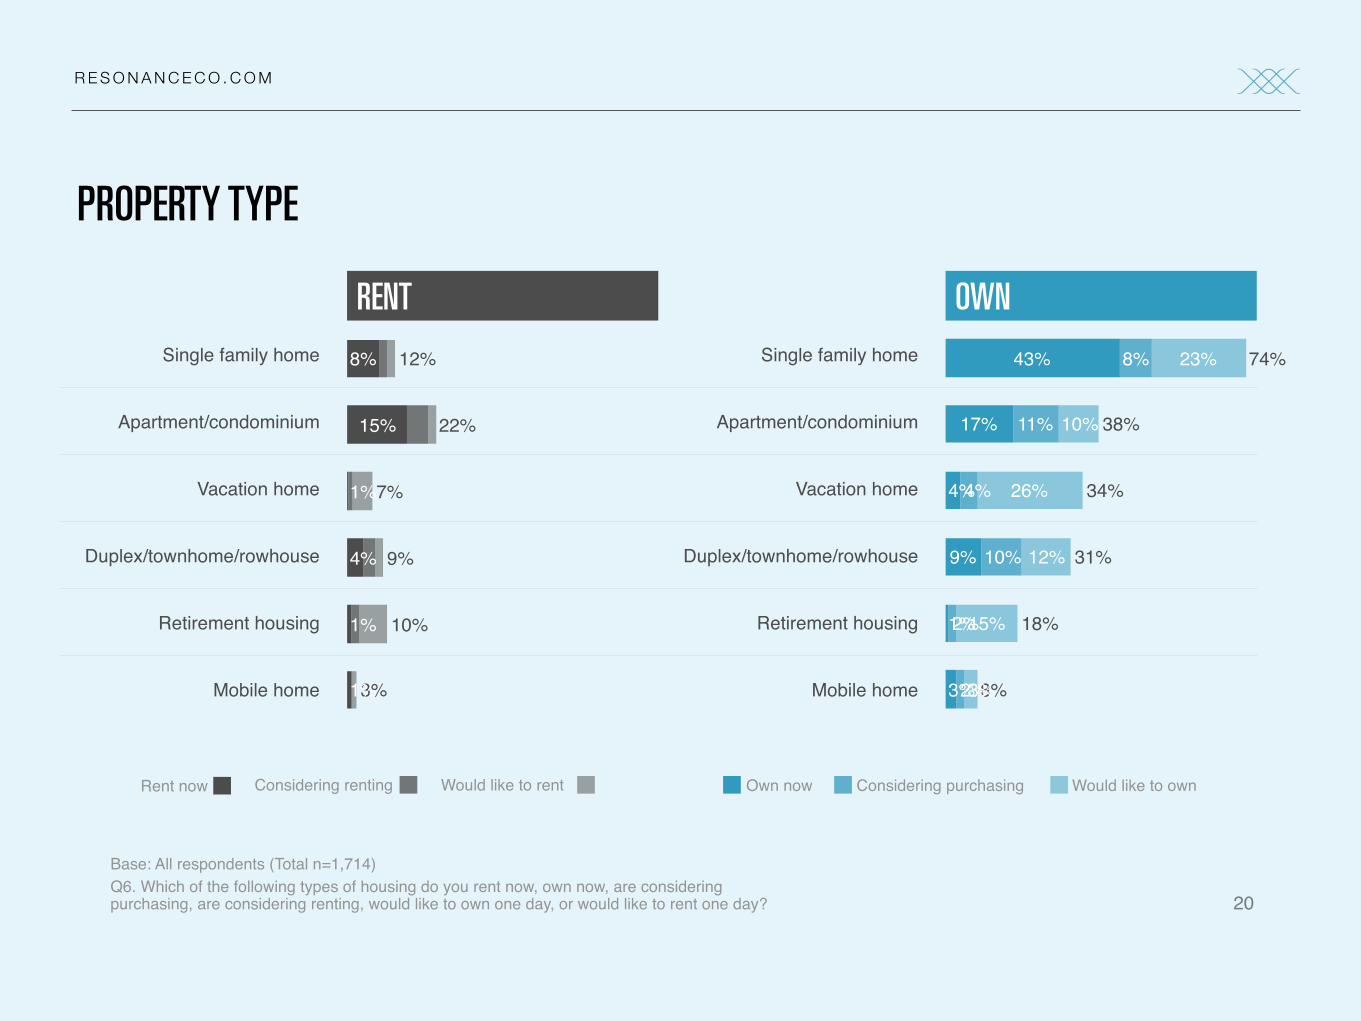
R E S O N A N C E C O . C O M
20
Base: All respondents (Total n=1,714)Q6. Which of the following types of housing do you rent now, own now, are considering purchasing, are considering renting, would like to own one day, or would like to rent one day?
RENT OWN
Single family home Single family home
Apartment/condominium Apartment/condominium
Vacation home Vacation home
Duplex/townhome/rowhouse Duplex/townhome/rowhouse
Retirement housing Retirement housing
Mobile home Mobile home 8%
18%
31%
34%
38%
74%
3%
15%
12%
26%
10%
23%
2%
2%
10%
4%
11%
8%
3%
1%
9%
4%
17%
43%
3%
10%
9%
7%
22%
12%
1%
1%
4%
1%
15%
8%
Own now Considering purchasing Would like to ownRent now Considering renting Would like to rent
PROPERTY TYPE
R E S O N A N C E C O . C O M
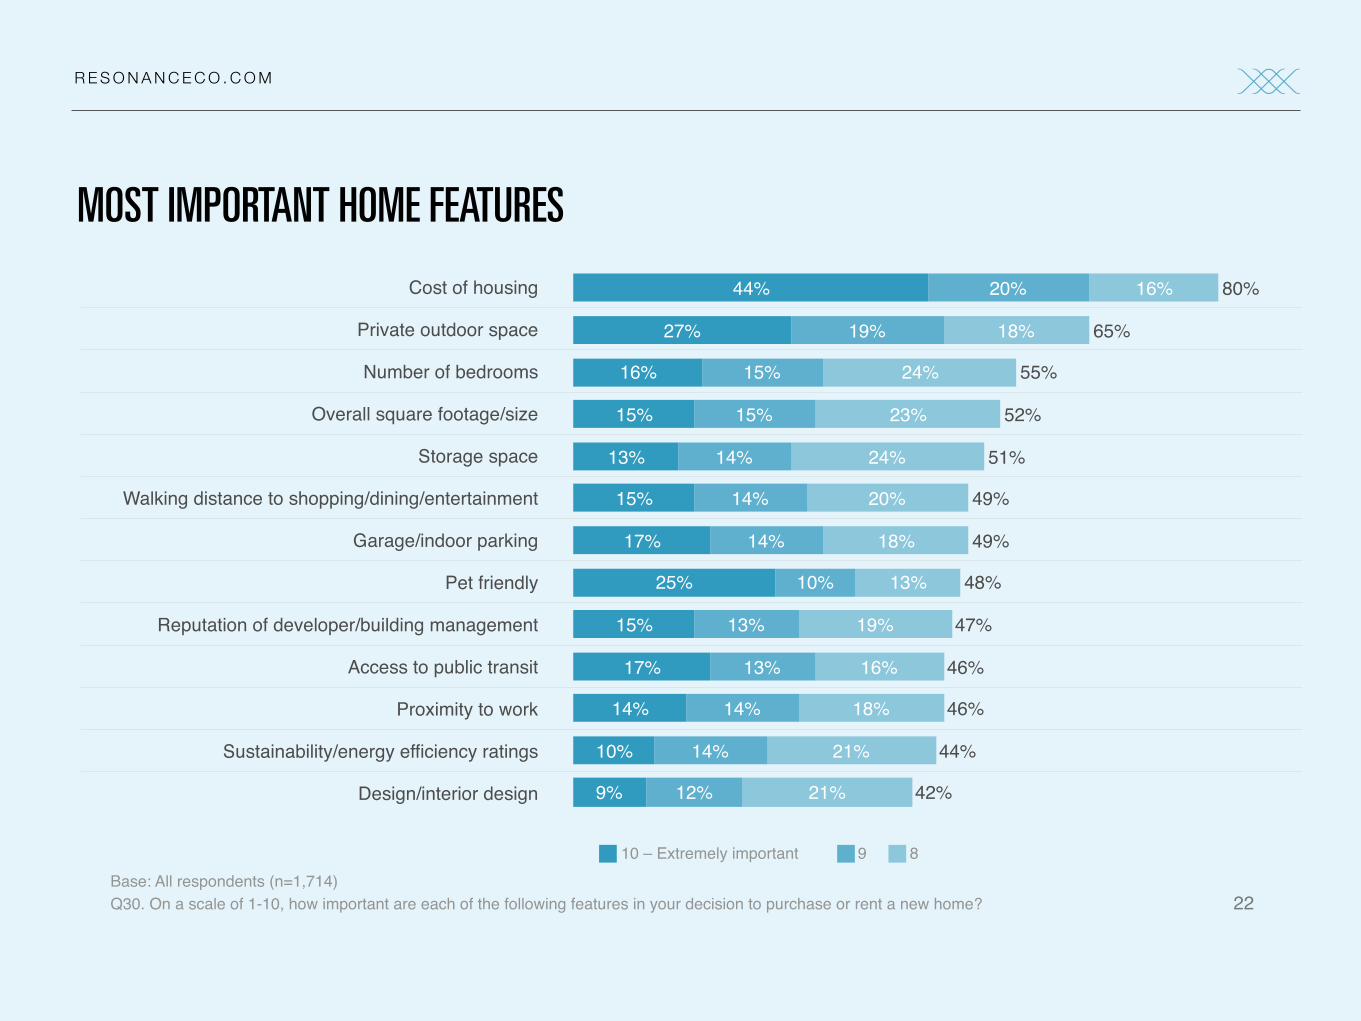
Cost of housing is the most important feature when deciding to purchase/rent a new home, followed by private outdoor space.
R E S O N A N C E C O . C O M
22Base: All respondents (n=1,714)Q30. On a scale of 1-10, how important are each of the following features in your decision to purchase or rent a new home?
Cost of housing
Private outdoor space
Number of bedrooms
Overall square footage/size
Storage space
Walking distance to shopping/dining/entertainment
Garage/indoor parking
Pet friendly
Reputation of developer/building management
Access to public transit
Proximity to work
Sustainability/energy efficiency ratings
Design/interior design 42%
44%
46%
46%
47%
48%
49%
49%
51%
52%
55%
65%
80%
21%
21%
18%
16%
19%
13%
18%
20%
24%
23%
24%
18%
16%
12%
14%
14%
13%
13%
10%
14%
14%
14%
15%
15%
19%
20%
9%
10%
14%
17%
15%
25%
17%
15%
13%
15%
16%
27%
44%
10 – Extremely important 9 8
MOST IMPORTANT HOME FEATURES
R E S O N A N C E C O . C O M
Age of home/building
Guestrooms for friends/family
Air-conditioning
Gourmet kitchen
Proximity to good schools
Access to fitness facilities
Formal dining room
In-law/rental suite
Access to swimming pool
Proximity to good child care
Community room/clubhouse
Electric car charging station
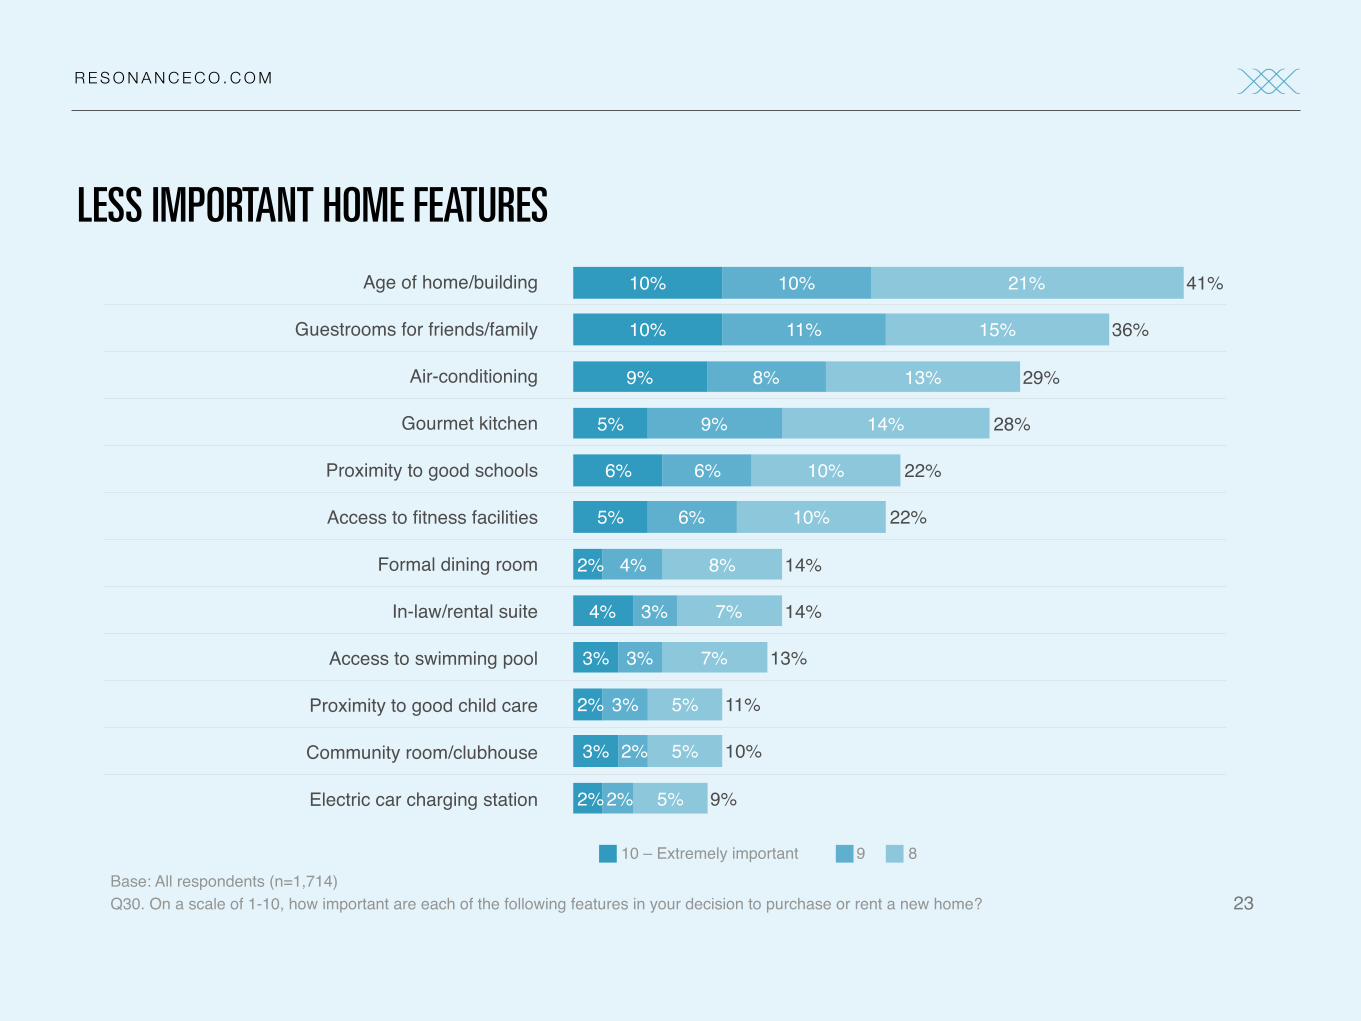
23Base: All respondents (n=1,714)Q30. On a scale of 1-10, how important are each of the following features in your decision to purchase or rent a new home?
9%
10%
11%
13%
14%
14%
22%
22%
28%
29%
36%
41%
5%
5%
5%
7%
7%
8%
10%
10%
14%
13%
15%
21%
2%
2%
3%
3%
3%
4%
6%
6%
9%
8%
11%
10%
2%
3%
2%
3%
4%
2%
5%
6%
5%
9%
10%
10%
10 – Extremely important 9 8
LESS IMPORTANT HOME FEATURES
R E S O N A N C E C O . C O M
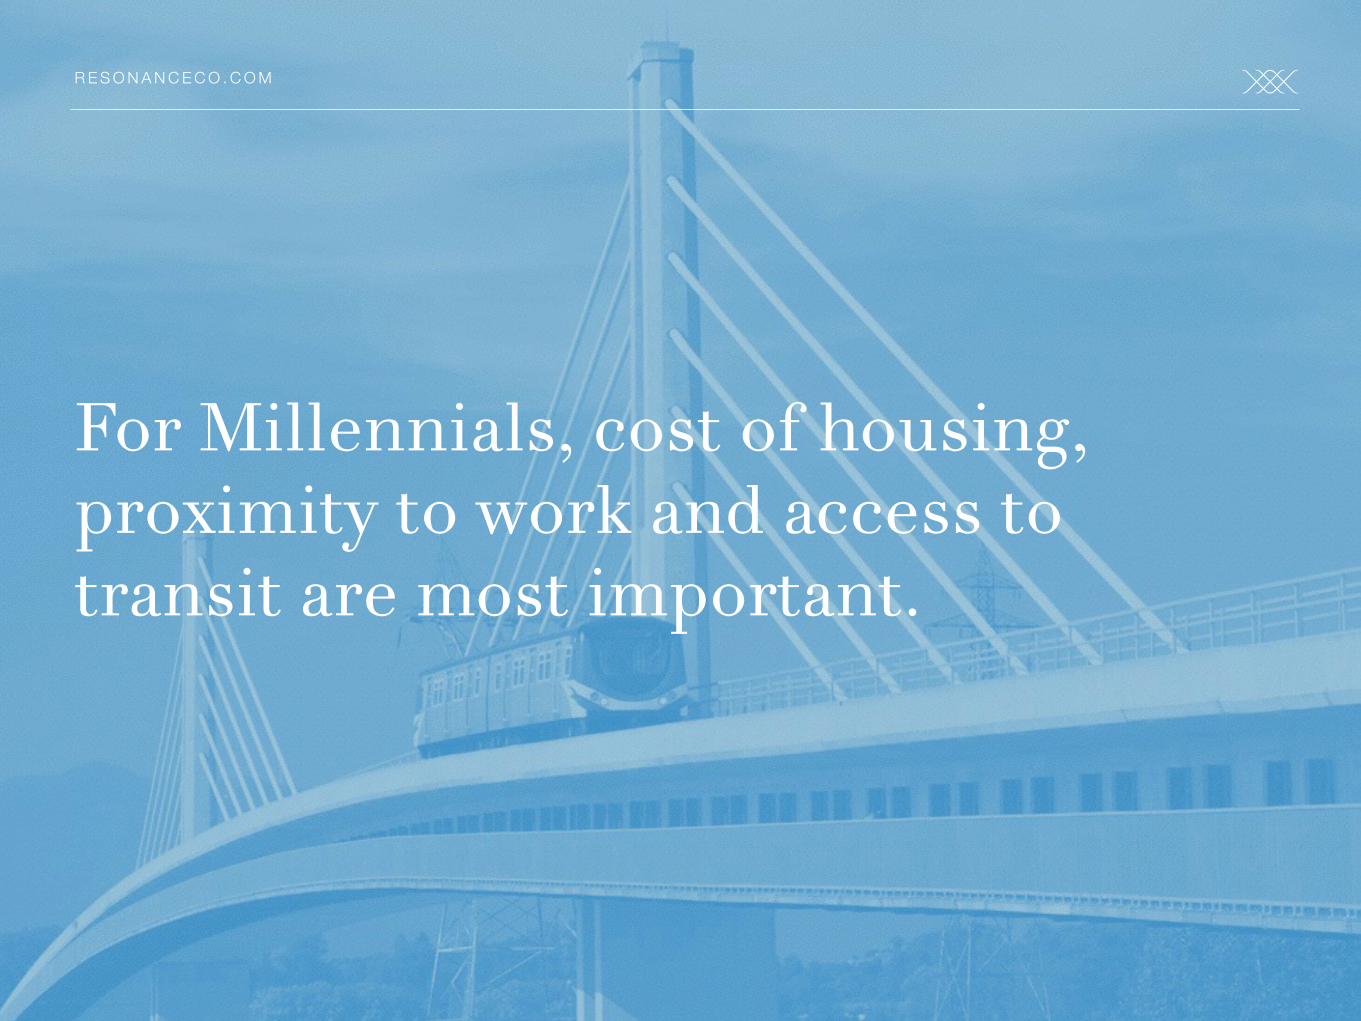
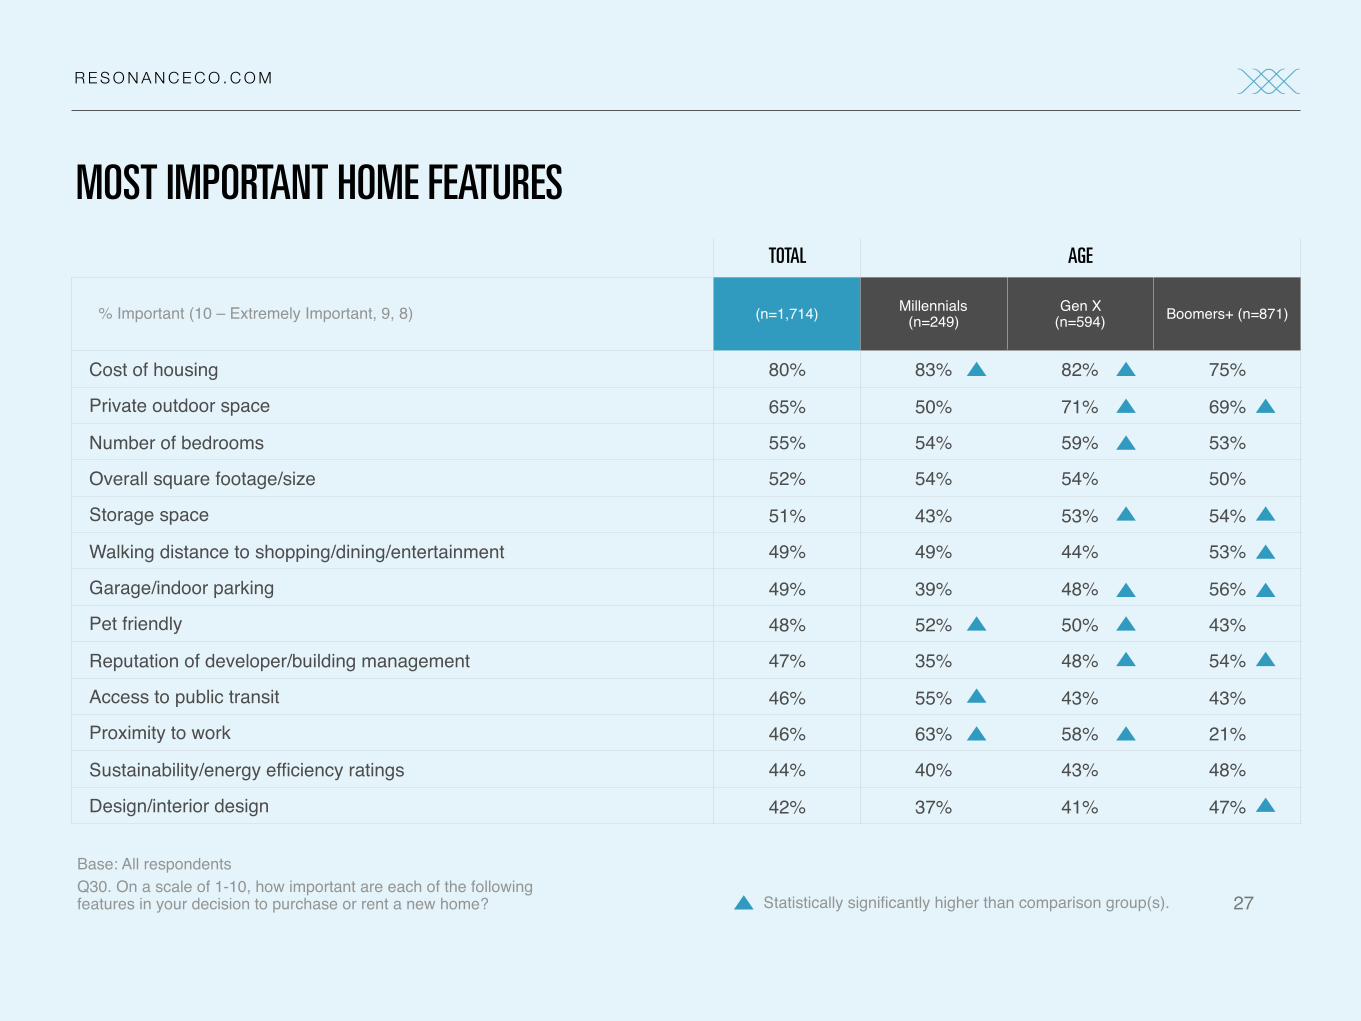
For Millennials, cost of housing, proximity to work and access to transit are most important.
R E S O N A N C E C O . C O M
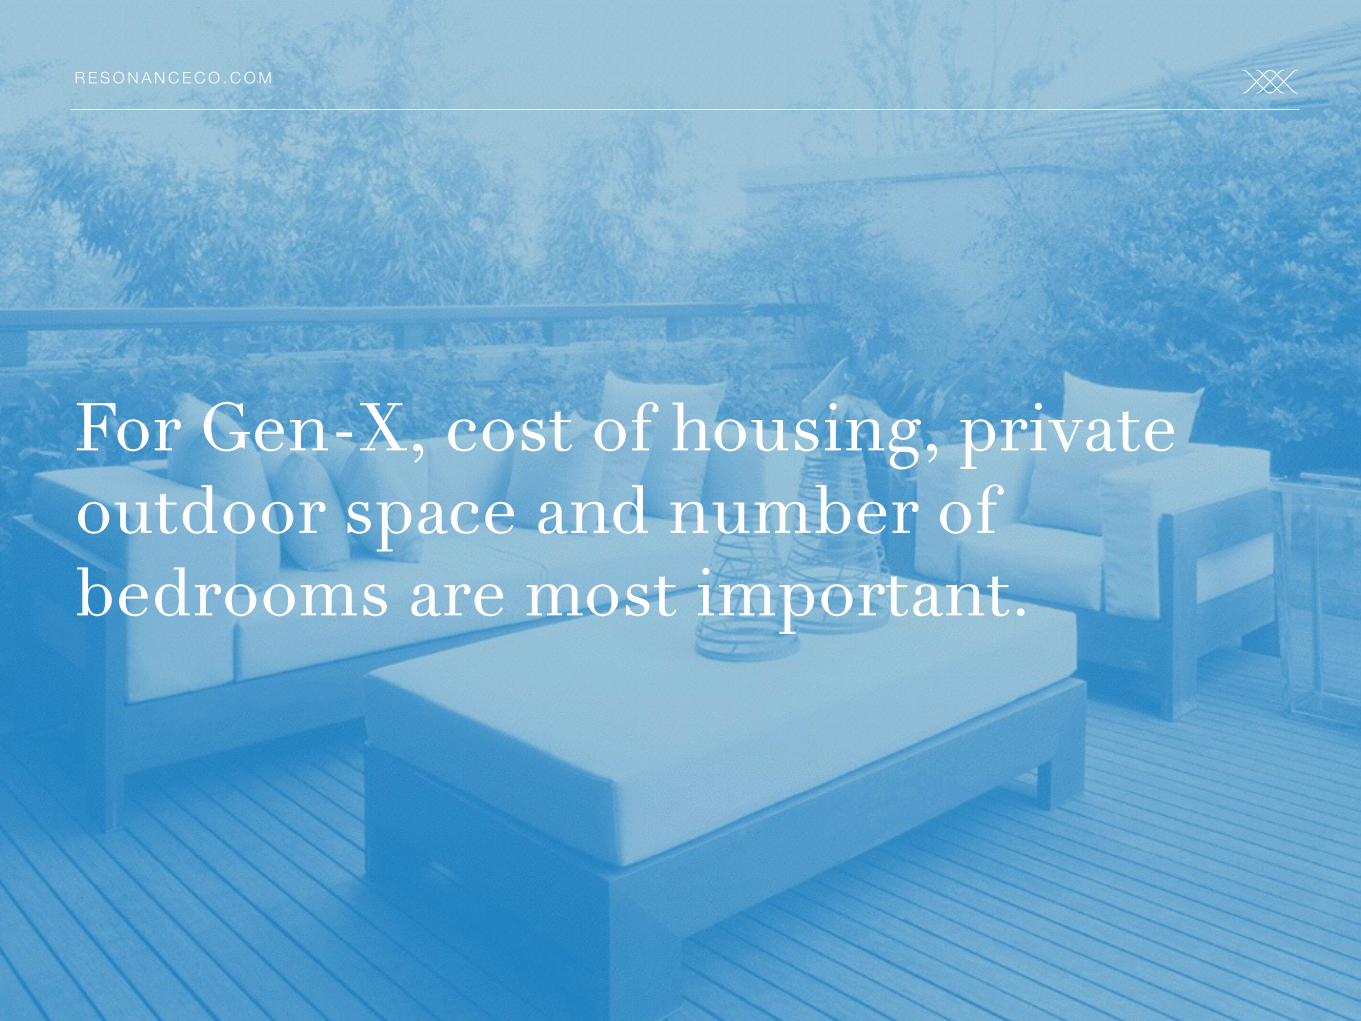
For Gen-X, cost of housing, private outdoor space and number of bedrooms are most important.
R E S O N A N C E C O . C O M
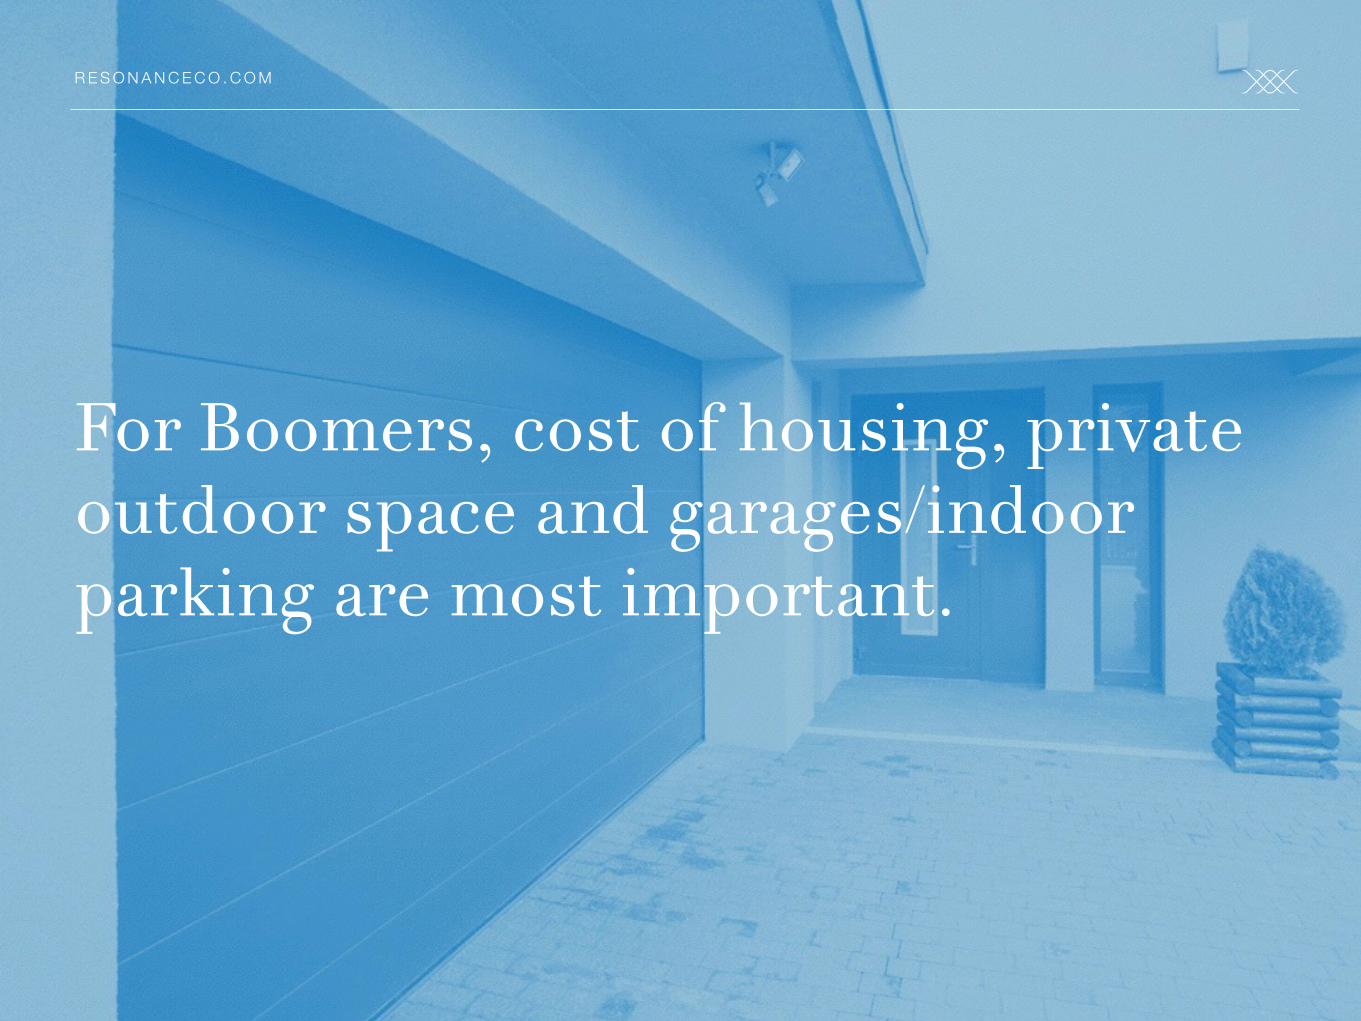
For Boomers, cost of housing, private outdoor space and garages/indoor parking are most important.
R E S O N A N C E C O . C O M
27
Base: All respondents Q30. On a scale of 1-10, how important are each of the following features in your decision to purchase or rent a new home?
TOTAL AGE
% Important (10 – Extremely Important, 9, 8) (n=1,714) Millennials(n=249)
Gen X(n=594) Boomers+ (n=871)
Cost of housing 80% 83% 82% 75%
Private outdoor space 65% 50% 71% 69%
Number of bedrooms 55% 54% 59% 53%
Overall square footage/size 52% 54% 54% 50%
Storage space 51% 43% 53% 54%
Walking distance to shopping/dining/entertainment 49% 49% 44% 53%
Garage/indoor parking 49% 39% 48% 56%
Pet friendly 48% 52% 50% 43%
Reputation of developer/building management 47% 35% 48% 54%
Access to public transit 46% 55% 43% 43%
Proximity to work 46% 63% 58% 21%
Sustainability/energy efficiency ratings 44% 40% 43% 48%
Design/interior design 42% 37% 41% 47%
Statistically significantly higher than comparison group(s).
MOST IMPORTANT HOME FEATURES
R E S O N A N C E C O . C O M
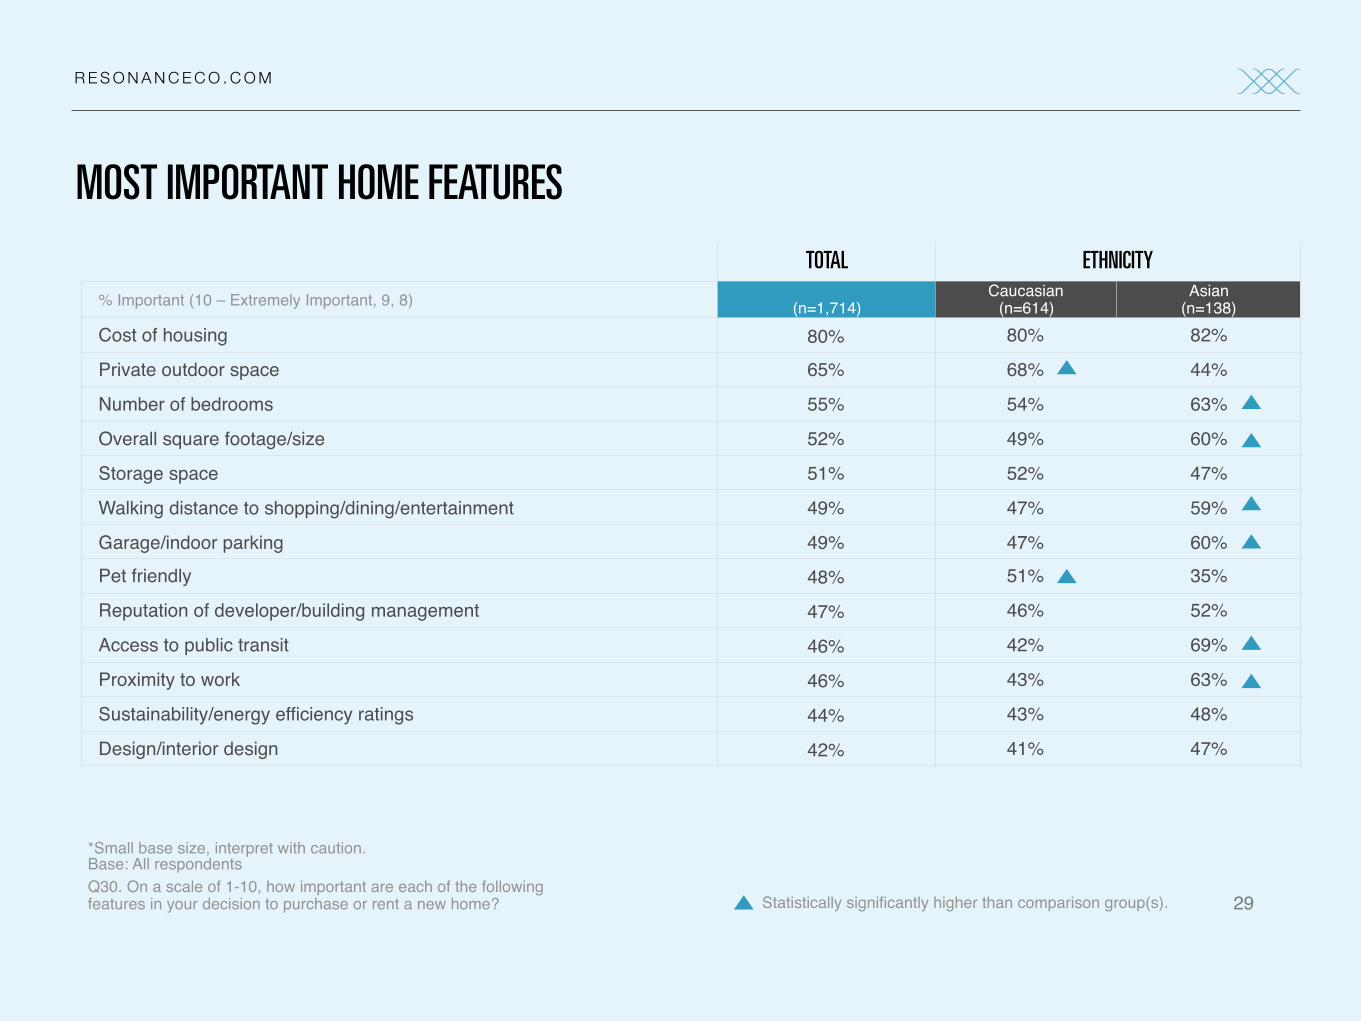
Asians are less concerned with private outdoor space and pet friendliness, but more concerned with access to public transit, number of bedrooms, proximity to work, overall size, garage and walking distance to entertainment.
R E S O N A N C E C O . C O M
29
*Small base size, interpret with caution.Base: All respondents Q30. On a scale of 1-10, how important are each of the following features in your decision to purchase or rent a new home?
TOTAL ETHNICITY
% Important (10 – Extremely Important, 9, 8) (n=1,714)Caucasian
(n=614)Asian
(n=138)Cost of housing 80% 80% 82%
Private outdoor space 65% 68% 44%
Number of bedrooms 55% 54% 63%
Overall square footage/size 52% 49% 60%
Storage space 51% 52% 47%
Walking distance to shopping/dining/entertainment 49% 47% 59%
Garage/indoor parking 49% 47% 60%Pet friendly 48% 51% 35%
Reputation of developer/building management 47% 46% 52%
Access to public transit 46% 42% 69%
Proximity to work 46% 43% 63%
Sustainability/energy efficiency ratings 44% 43% 48%
Design/interior design 42% 41% 47%
Statistically significantly higher than comparison group(s).
MOST IMPORTANT HOME FEATURES
R E S O N A N C E C O . C O M
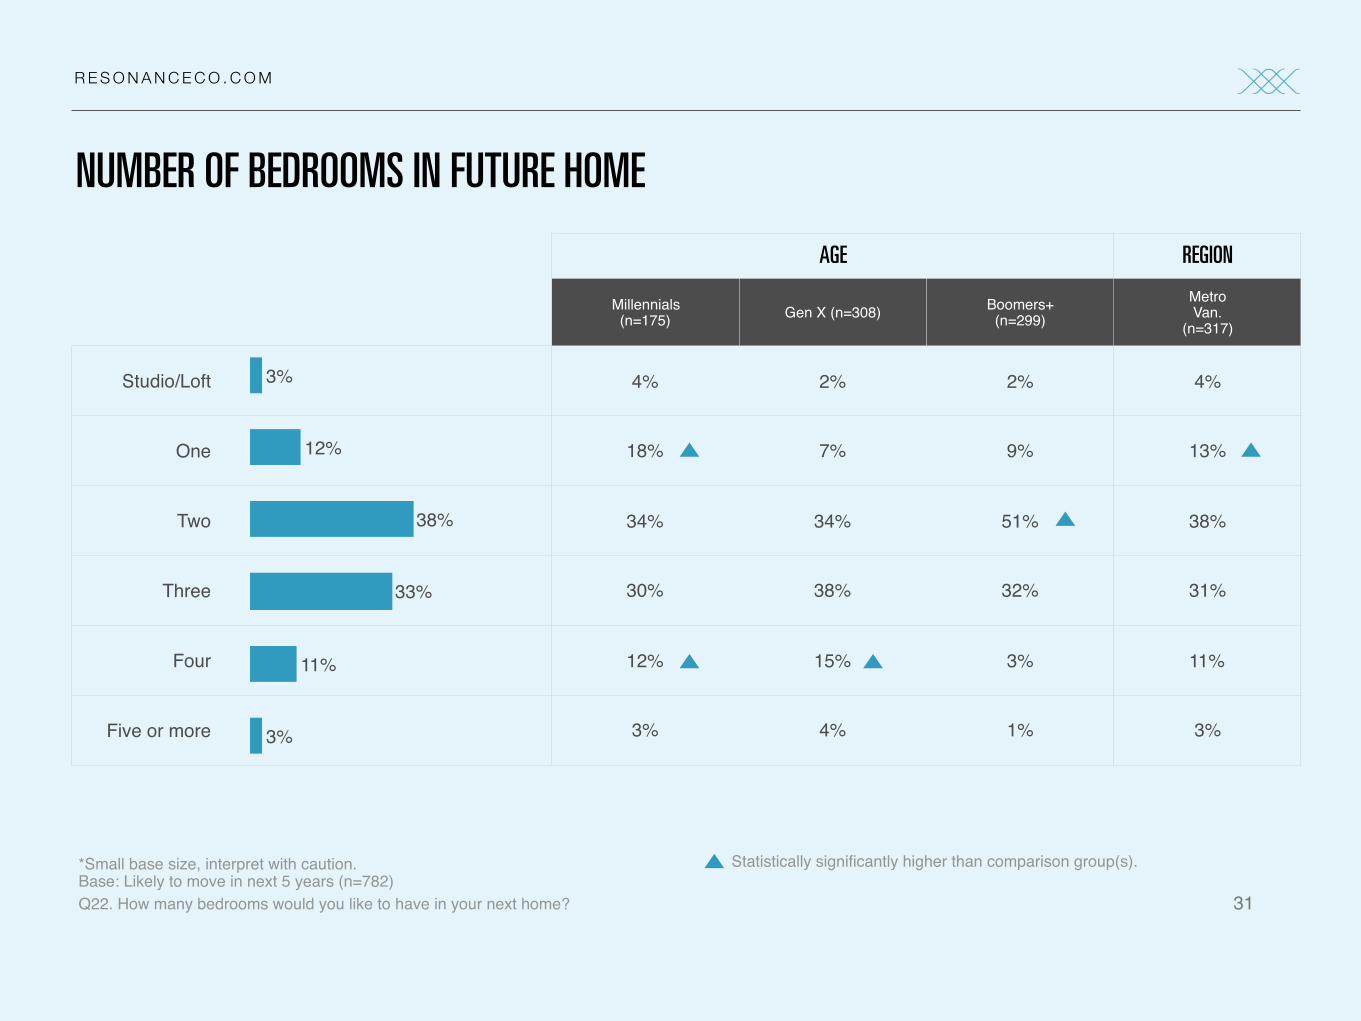
Most future home buyers prefer to have 2 or 3 bedrooms in their future home.
R E S O N A N C E C O . C O M
AGE REGION
Millennials(n=175) Gen X (n=308) Boomers+
(n=299)Metro Van.
(n=317)
Studio/Loft 4% 2% 2% 4%
One 18% 7% 9% 13%
Two 34% 34% 51% 38%
Three 30% 38% 32% 31%
Four 12% 15% 3% 11%
Five or more 3% 4% 1% 3%
31
*Small base size, interpret with caution.Base: Likely to move in next 5 years (n=782)Q22. How many bedrooms would you like to have in your next home?
Statistically significantly higher than comparison group(s).
3%
11%
33%
38%
12%
3%
NUMBER OF BEDROOMS IN FUTURE HOME
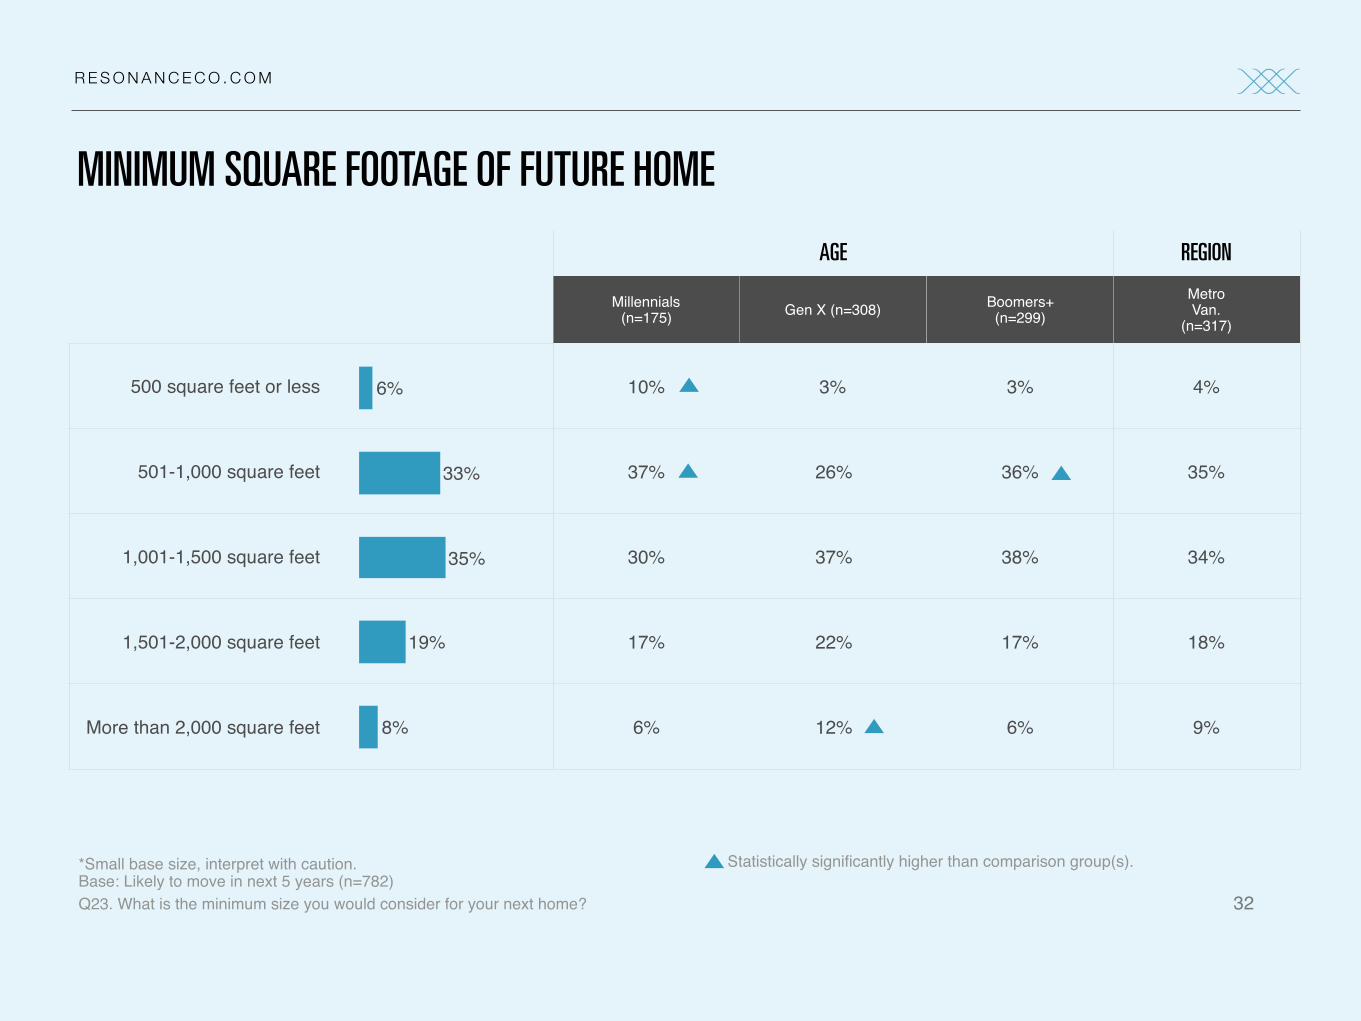
R E S O N A N C E C O . C O M
AGE REGION
Millennials(n=175) Gen X (n=308) Boomers+
(n=299)Metro Van.
(n=317)
500 square feet or less 10% 3% 3% 4%
501-1,000 square feet 37% 26% 36% 35%
1,001-1,500 square feet 30% 37% 38% 34%
1,501-2,000 square feet 17% 22% 17% 18%
More than 2,000 square feet 6% 12% 6% 9%
32
*Small base size, interpret with caution.Base: Likely to move in next 5 years (n=782)Q23. What is the minimum size you would consider for your next home?
8%
19%
35%
33%
6%
Statistically significantly higher than comparison group(s).
MINIMUM SQUARE FOOTAGE OF FUTURE HOME

R E S O N A N C E C O . C O M
HOUSING COMPROMISES
R E S O N A N C E C O . C O M
The top 2 housing compromises BC residents are willing to consider are living in a smaller home to be closer to transit, shops and and restaurants and living in a smaller home to be closer to work.
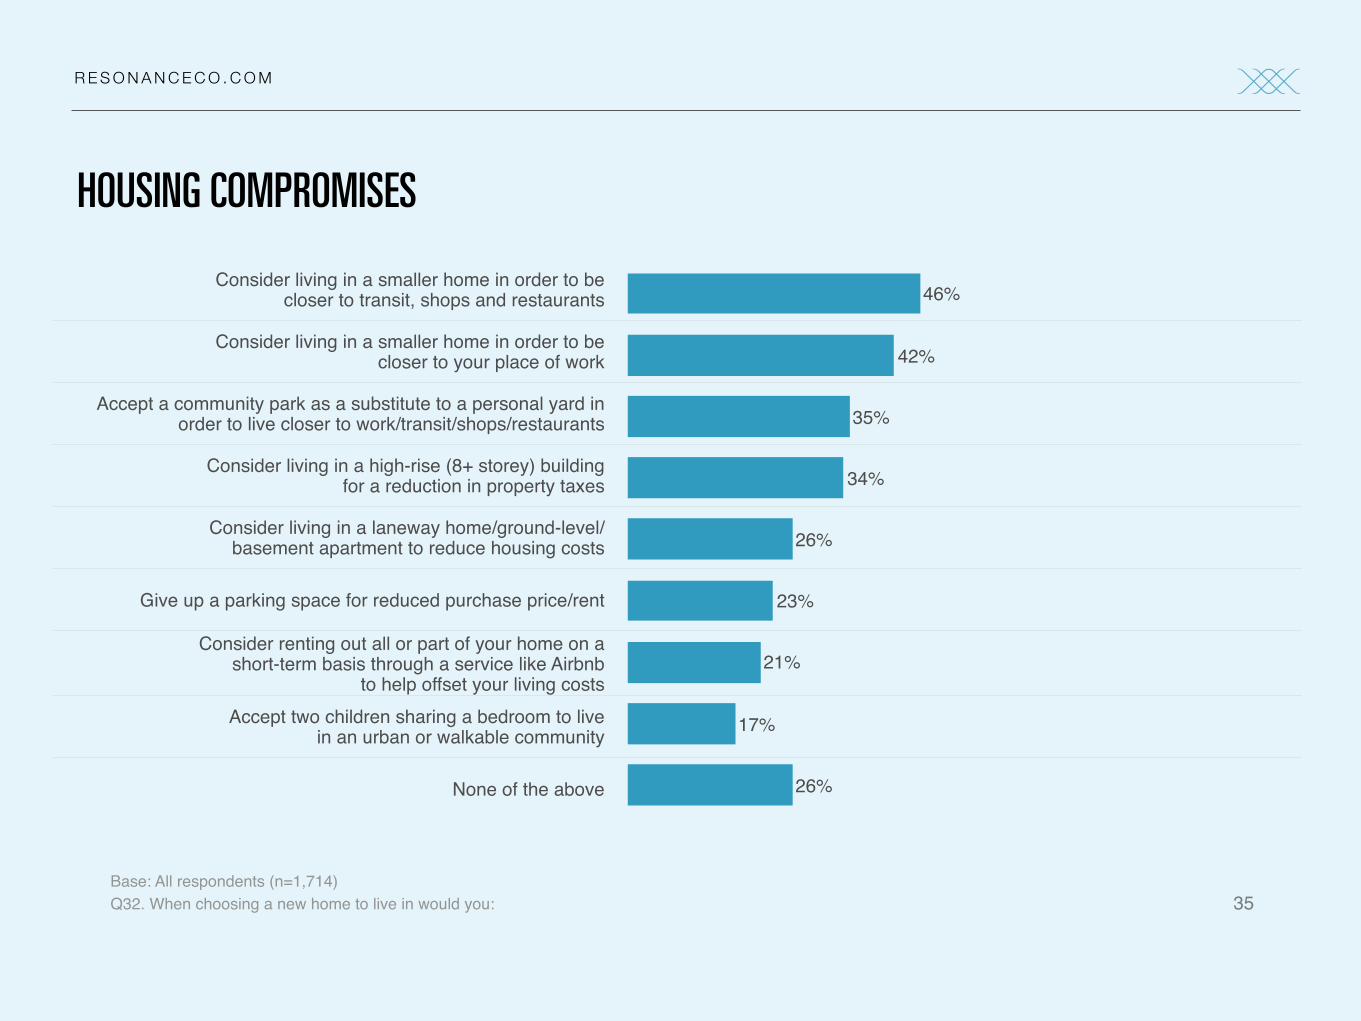
R E S O N A N C E C O . C O M
35Base: All respondents (n=1,714)Q32. When choosing a new home to live in would you:
Consider living in a smaller home in order to be closer to transit, shops and restaurants
Consider living in a smaller home in order to be closer to your place of work
Accept a community park as a substitute to a personal yard in order to live closer to work/transit/shops/restaurants
Consider living in a high-rise (8+ storey) building for a reduction in property taxes
Consider living in a laneway home/ground-level/ basement apartment to reduce housing costs
Give up a parking space for reduced purchase price/rent
Consider renting out all or part of your home on a short-term basis through a service like Airbnb
to help offset your living costsAccept two children sharing a bedroom to live
in an urban or walkable community
None of the above 26%
17%
21%
23%
26%
34%
35%
42%
46%
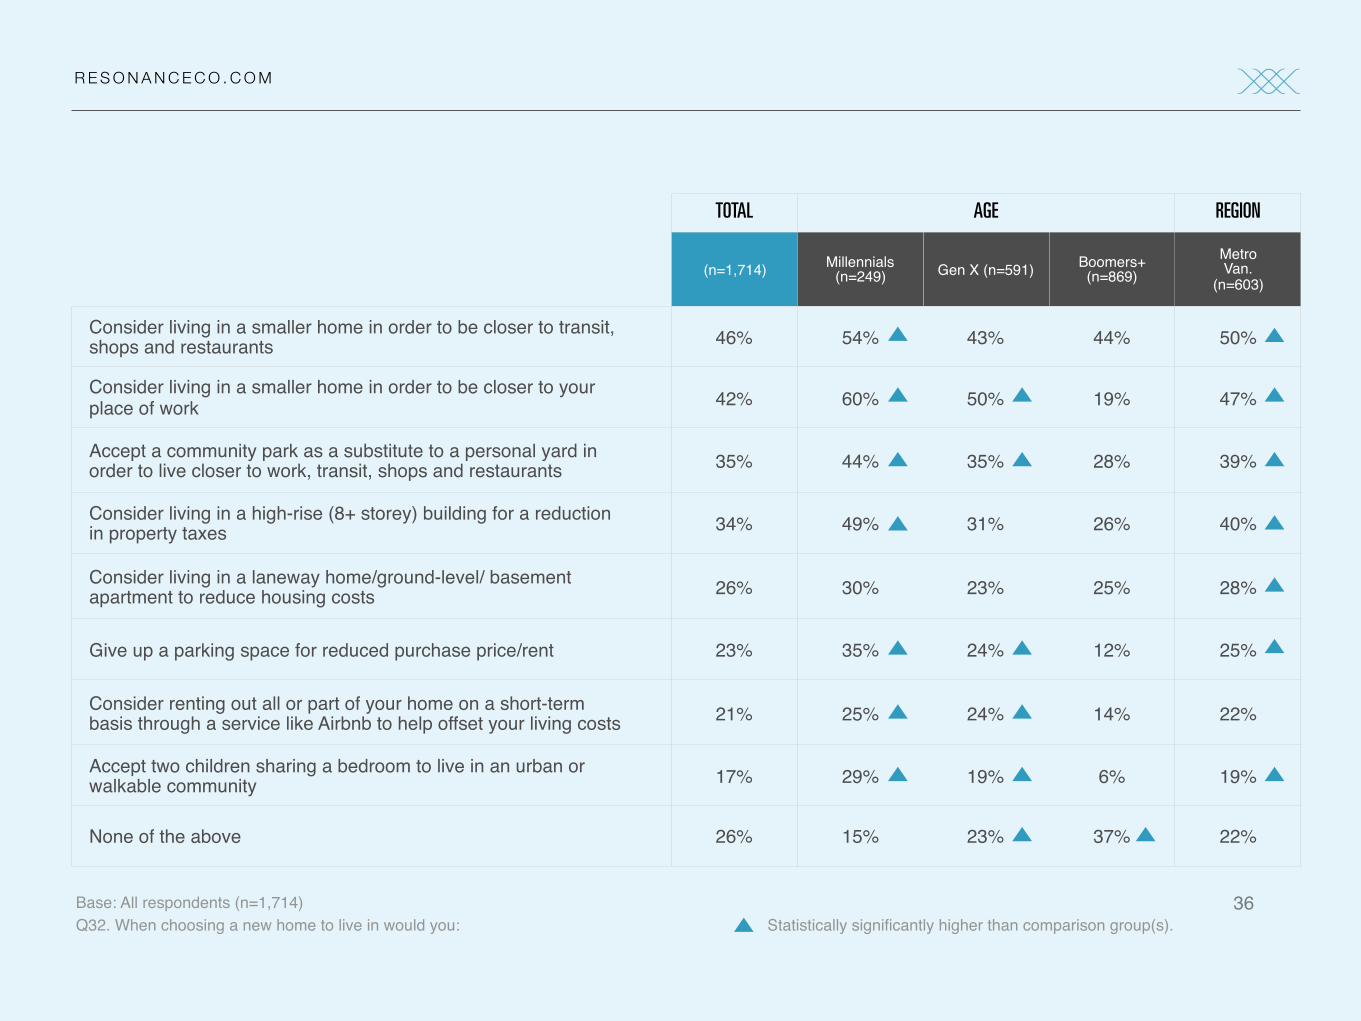
HOUSING COMPROMISES
R E S O N A N C E C O . C O M
36Base: All respondents (n=1,714)Q32. When choosing a new home to live in would you: Statistically significantly higher than comparison group(s).
TOTAL AGE REGION
(n=1,714) Millennials(n=249) Gen X (n=591) Boomers+
(n=869)Metro Van.
(n=603)
Consider living in a smaller home in order to be closer to transit, shops and restaurants 46% 54% 43% 44% 50%
Consider living in a smaller home in order to be closer to your place of work 42% 60% 50% 19% 47%
Accept a community park as a substitute to a personal yard in order to live closer to work, transit, shops and restaurants 35% 44% 35% 28% 39%
Consider living in a high-rise (8+ storey) building for a reduction in property taxes 34% 49% 31% 26% 40%
Consider living in a laneway home/ground-level/ basement apartment to reduce housing costs 26% 30% 23% 25% 28%
Give up a parking space for reduced purchase price/rent 23% 35% 24% 12% 25%
Consider renting out all or part of your home on a short-term basis through a service like Airbnb to help offset your living costs 21% 25% 24% 14% 22%
Accept two children sharing a bedroom to live in an urban or walkable community 17% 29% 19% 6% 19%
None of the above 26% 15% 23% 37% 22%

R E S O N A N C E C O . C O M
BC residents are most likely to feel that taxing foreign investment and limiting foreign investment in the housing market are sustainable solutions to address the current affordability issue in BC.

R E S O N A N C E C O . C O M
38
Base: All respondents Q39. What do you think would be a more sustainable solution in order to address the current housing affordability issue in BC?
TOTAL AGE REGION
(n=1,714) Millennials(n=249)
Gen X (n=594)
Boomers+(n=871)
Metro Van.
(n=603)
Tax foreign investment in the housing market 70% 70% 69% 70% 71%
Limit foreign investment in the housing market 67% 71% 67% 65% 70%
Invest in more amenities and infrastructure in suburban areas to create new economic centres outside downtown 47% 45% 45% 51% 51%
Increase the housing supply by fast tracking approvals of new rental buildings 45% 41% 42% 53% 48%
Revise zoning in suburban areas to permit development of more multi-family housing 44% 44% 40% 48% 46%
Increase property taxes on single family homes to encourage higher density development 10% 15% 11% 4% 13%
Statistically significantly higher than comparison group(s).
POTENTIAL SOLUTIONS FOR ADDRESSING HOUSING AFFORDABILITY IN BC