Embed Size (px)
Citation preview
Housing the Region’s
Future Workforce
2012-2032
by
Lisa Sturtevant, PhD
Jeannette Chapman
George Mason University School of Public Policy
Center for Regional Analysis
Arlington, Virginia
December 2013

George Mason University Center for Regional Analysis
Acknowledgements
The Center for Regional Analysis would like to thank the following sponsors for their support for this
research project:
Metropolitan Washington Council of Governments
Greater Washington Board of Trade
Urban Land Institute Washington
Federal City Council
2030 Group
George Mason University Center for Regional Analysis Page 1
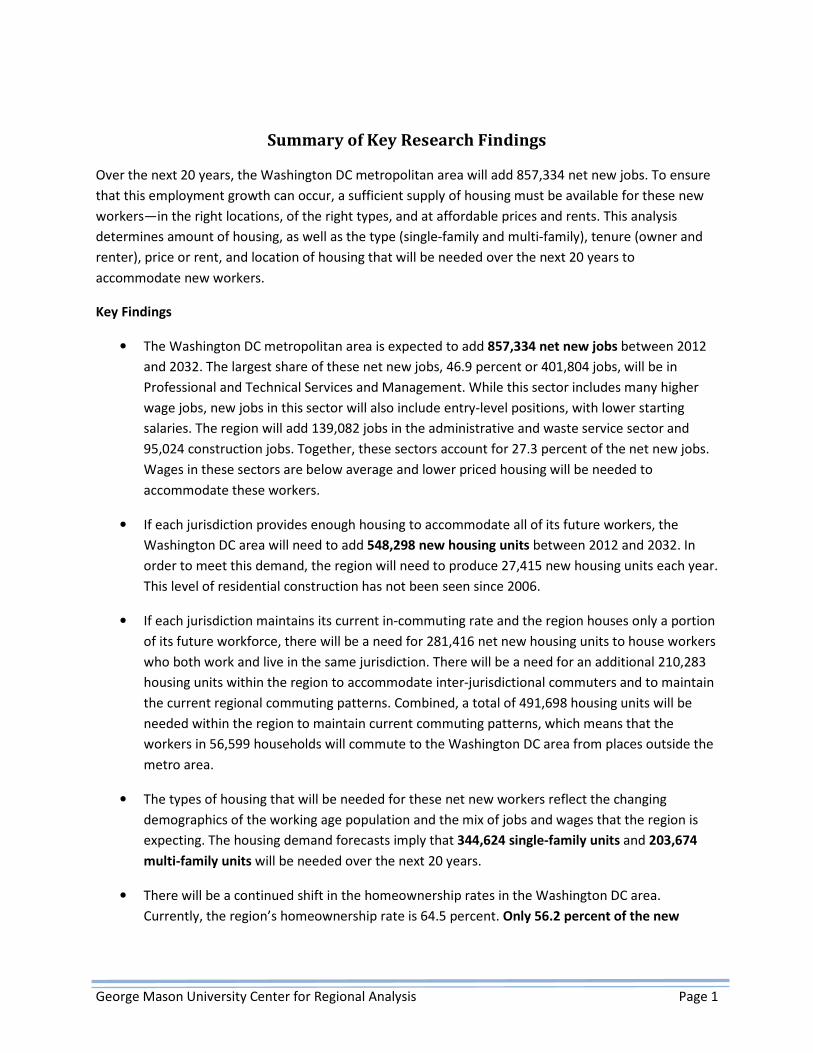
Summary of Key Research Findings
Over the next 20 years, the Washington DC metropolitan area will add 857,334 net new jobs. To ensure
that this employment growth can occur, a sufficient supply of housing must be available for these new
workers—in the right locations, of the right types, and at affordable prices and rents. This analysis
determines amount of housing, as well as the type (single-family and multi-family), tenure (owner and
renter), price or rent, and location of housing that will be needed over the next 20 years to
accommodate new workers.
Key Findings
• The Washington DC metropolitan area is expected to add 857,334 net new jobs between 2012
and 2032. The largest share of these net new jobs, 46.9 percent or 401,804 jobs, will be in
Professional and Technical Services and Management. While this sector includes many higher
wage jobs, new jobs in this sector will also include entry-level positions, with lower starting
salaries. The region will add 139,082 jobs in the administrative and waste service sector and
95,024 construction jobs. Together, these sectors account for 27.3 percent of the net new jobs.
Wages in these sectors are below average and lower priced housing will be needed to
accommodate these workers.
• If each jurisdiction provides enough housing to accommodate all of its future workers, the
Washington DC area will need to add 548,298 new housing units between 2012 and 2032. In
order to meet this demand, the region will need to produce 27,415 new housing units each year.
This level of residential construction has not been seen since 2006.
• If each jurisdiction maintains its current in-commuting rate and the region houses only a portion
of its future workforce, there will be a need for 281,416 net new housing units to house workers
who both work and live in the same jurisdiction. There will be a need for an additional 210,283
housing units within the region to accommodate inter-jurisdictional commuters and to maintain
the current regional commuting patterns. Combined, a total of 491,698 housing units will be
needed within the region to maintain current commuting patterns, which means that the
workers in 56,599 households will commute to the Washington DC area from places outside the
metro area.
• The types of housing that will be needed for these net new workers reflect the changing
demographics of the working age population and the mix of jobs and wages that the region is
expecting. The housing demand forecasts imply that 344,624 single-family units and 203,674
multi-family units will be needed over the next 20 years.
• There will be a continued shift in the homeownership rates in the Washington DC area.
Currently, the region’s homeownership rate is 64.5 percent. Only 56.2 percent of the new

George Mason University Center for Regional Analysis Page 2
households resulting from these net new workers will be homeowners, while 43.8 percent will
rent.
• The region’s new housing must be priced so that it is affordable to these new workers. Based on
the housing need forecasts, 44.1 percent of rental units will need to have rents of less than
$1,250 a month, while only 2.4 percent of the rental demand will be for units priced at $2,250 a
month or more. About 16.4 percent of the owner-occupied units forecasted need to be valued
at less than $200,000 and only 13.5 percent at over $600,000.

George Mason University Center for Regional Analysis Page 3
Economic Growth and Housing Demand in the Washington DC Area
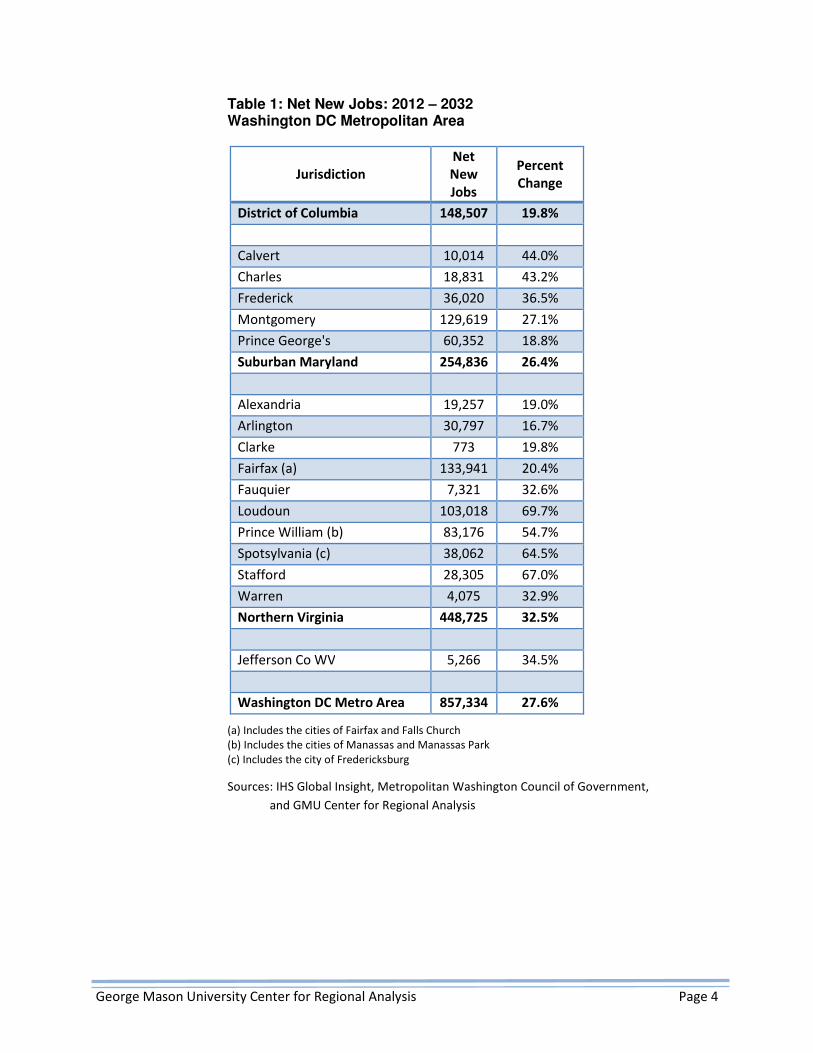
While the Washington DC area’s future economic growth will not continue at the rapid pace it did
between 1980 and 2010, current economic forecasts indicate substantial job growth over the next 20
years. Between 2012 and 2032, total regional employment will increase 27.6 percent, adding 857,334
net new jobs (Table 1). But there are potential obstacles that may prevent this job growth from
occurring. At the most fundamental level, the projected job growth will not materialize without a
sufficient number of workers to fill these new jobs. To attract new workers, the region will need to have
a sufficient supply of housing that meets the needs of the future workforce, is affordable given the
changing wage structure of the economy, and is located near emerging and growing job centers.
There are significant consequences associated with not having enough housing to accommodate the
region’s future workforce close to where jobs are projected. Without an adequate supply of housing,
there will be untenable strains on the region’s transportation and transit networks, and an erosion of
the region’s economic base. The resources that would be needed to expand the region’s transportation
capacity to accommodate thousands of additional commuters from outside the region and hundreds of
thousands additional inter-jurisdiction commuters are not available. Even if the long-distance
commuting capacity could be provided, there would still be a substantial loss of wealth from the region
to adjacent jurisdictions and an erosion of the region’s tax base. There would also be serious and
growing environmental impacts associated with a growing number of workers commuting into the
Washington DC metro area each day. Thus, housing the future workforce within the region not only
reduces the transportation needs, but also increases local spending and tax revenue, which provides
more local funding to for regional investments.
The Washington DC area economy is evolving, and the types of jobs coming to the region over the next
20 years are somewhat different from the jobs added over the past 20 years. Future job growth will be
driven primarily by three sectors: Professional and Business Services, Education and Health Services, and
Construction. Many of the region’s new workers will have substantially lower wages than the current
workforce. The sectoral changes in the economy—along with changing demographics that are leading to
a younger, more racially and ethnically diverse workforce—will have important implications for the
types of housing that will be demanded. In order to accommodate the region’s new workforce, there
will be greater needs for smaller homes, multi-family buildings, and homes available to renters. Without
sufficient housing—in the right locations, of the right types, and at the right prices—the Washington DC
area faces the possibility of slower economic growth, increasing traffic congestion and worsening quality
of life.
George Mason University Center for Regional Analysis Page 4
Table 1: Net New Jobs: 2012 – 2032 Washington DC Metropolitan Area
Jurisdiction
Net
New
Jobs
Percent
Change
District of Columbia 148,507 19.8%
Calvert 10,014 44.0%
Charles 18,831 43.2%
Frederick 36,020 36.5%
Montgomery 129,619 27.1%
Prince George's 60,352 18.8%
Suburban Maryland 254,836 26.4%
Alexandria 19,257 19.0%
Arlington 30,797 16.7%
Clarke 773 19.8%
Fairfax (a) 133,941 20.4%
Fauquier 7,321 32.6%
Loudoun 103,018 69.7%
Prince William (b) 83,176 54.7%
Spotsylvania (c) 38,062 64.5%
Stafford 28,305 67.0%
Warren 4,075 32.9%
Northern Virginia 448,725 32.5%
Jefferson Co WV 5,266 34.5%
Washington DC Metro Area 857,334 27.6%
(a) Includes the cities of Fairfax and Falls Church
(b) Includes the cities of Manassas and Manassas Park
(c) Includes the city of Fredericksburg
Sources: IHS Global Insight, Metropolitan Washington Council of Government,
and GMU Center for Regional Analysis
George Mason University Center for Regional Analysis Page 5
Forecasts of Housing Need to Support Regional Economic Growth
This research builds upon the “Housing the Region’s Future Workforce” report published in 20111. Like
the 2011 report, the objective of this research is to forecast the amount of housing that will be needed
for the region’s future workers. These housing forecasts are derived solely from the region’s net new
workers and therefore excludes units that will be needed for replacement workers and non-working
households. As a result, these housing demand forecasts should be considered a lower bound of the
region’s future comprehensive housing needs. Estimates of employment growth by sector and by
jurisdiction form the basis of these housing demand forecasts. Assumptions about workers’ wages, age
structure, and household composition are used to forecast the amount, type and price of housing that
the region will need over the 2012 – 2032 period.
Four main questions are analyzed in this research:
1. How much housing will be needed to accommodate the region’s new workers? The forecasts
estimate the total number of housing units that will be needed to accommodate the
Washington DC area’s net new workers between 2012 and 2022, and between 2022 and 2032.
2. Where should this housing be located? The location of the new housing units is analyzed two
ways:
a. The first method assumes each worker is housed in the same jurisdiction where he/she
works. This method keeps the levels of inter-jurisdiction commuting stable and
therefore assumes no worsening of traffic congestion. The forecasts of units resulting
from this method are referred to as the “By Work Location” estimates.
b. Alternatively, the second method is based on current commuting patterns. This method
assumes that each jurisdiction houses the same share of new workers as it does for
existing workers in the region. These forecasts are broken down by workers who are
both non-commuters (i.e. people who live and work in the same jurisdiction) and
jurisdiction-to-jurisdiction commuters. The forecasts of units resulting from this method
are referred to as the “By Current Commuting Patterns” estimates.
3. What types of housing units will be needed? These forecasts assess the demand for single-
family (detached and attached/townhouse) and multi-family housing. The housing type is
further divided by tenure (owner/renter) resulting in four mutually exclusive housing types—
single-family owner, single-family renter, multi-family owner and multi-family renter.
4. What prices and rents will new workers be able to afford? The forecasts take into account the
wages of the net new workers and the number of workers per household to determine the
demand for housing at different price and rental levels.
1 This research is not directly comparable to the 2011 report due to methodological differences. See the Appendix for a detailed
methodology.
George Mason University Center for Regional Analysis Page 6
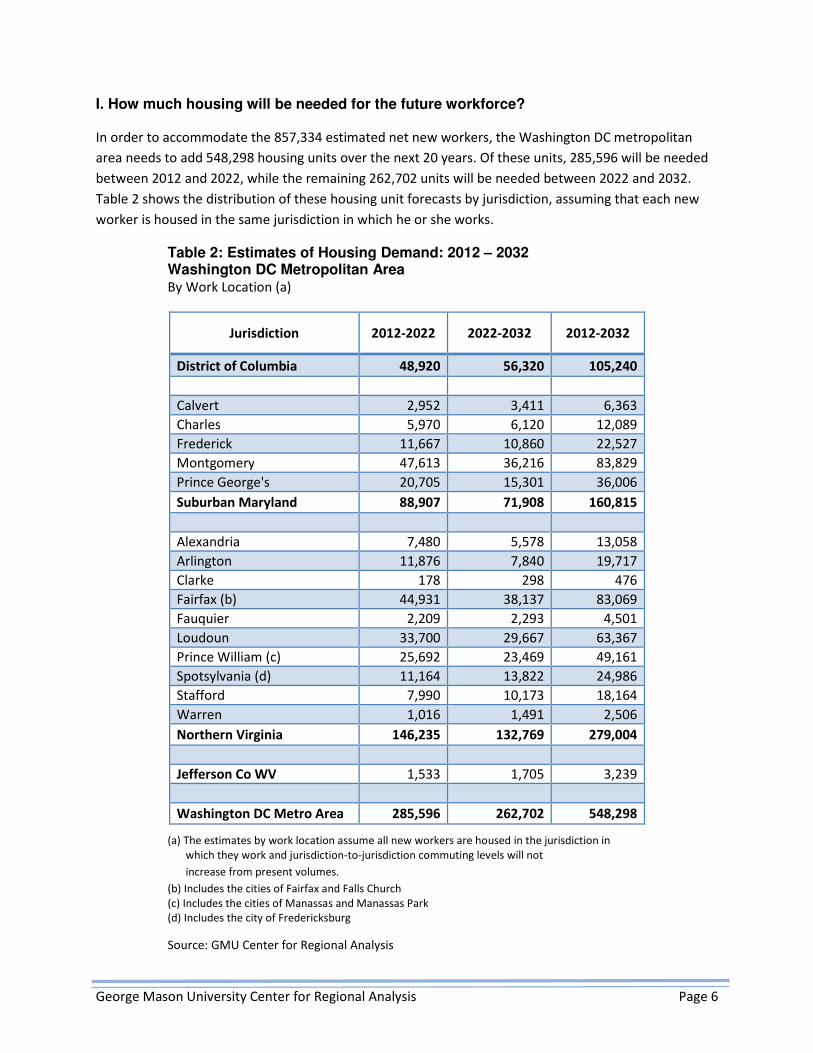
I. How much housing will be needed for the future workforce?
In order to accommodate the 857,334 estimated net new workers, the Washington DC metropolitan
area needs to add 548,298 housing units over the next 20 years. Of these units, 285,596 will be needed
between 2012 and 2022, while the remaining 262,702 units will be needed between 2022 and 2032.
Table 2 shows the distribution of these housing unit forecasts by jurisdiction, assuming that each new
worker is housed in the same jurisdiction in which he or she works.
Table 2: Estimates of Housing Demand: 2012 – 2032 Washington DC Metropolitan Area By Work Location (a)
Jurisdiction 2012-2022 2022-2032 2012-2032
District of Columbia 48,920 56,320 105,240
Calvert 2,952 3,411 6,363
Charles 5,970 6,120 12,089
Frederick 11,667 10,860 22,527
Montgomery 47,613 36,216 83,829
Prince George's 20,705 15,301 36,006
Suburban Maryland 88,907 71,908 160,815
Alexandria 7,480 5,578 13,058
Arlington 11,876 7,840 19,717
Clarke 178 298 476
Fairfax (b) 44,931 38,137 83,069
Fauquier 2,209 2,293 4,501
Loudoun 33,700 29,667 63,367
Prince William (c) 25,692 23,469 49,161
Spotsylvania (d) 11,164 13,822 24,986
Stafford 7,990 10,173 18,164
Warren 1,016 1,491 2,506
Northern Virginia 146,235 132,769 279,004
Jefferson Co WV 1,533 1,705 3,239
Washington DC Metro Area 285,596 262,702 548,298
(a) The estimates by work location assume all new workers are housed in the jurisdiction in
which they work and jurisdiction-to-jurisdiction commuting levels will not
increase from present volumes.
(b) Includes the cities of Fairfax and Falls Church
(c) Includes the cities of Manassas and Manassas Park
(d) Includes the city of Fredericksburg
Source: GMU Center for Regional Analysis

George Mason University Center for Regional Analysis Page 7
In order to meet this housing demand, the region will need to produce 27,415 units annually during the
next two decades. While this annual production is consistent with the average level of residential
construction between 1990 and 2012, this level of residential construction activity has not been seen in
the region since 2006. Moreover, the types of housing that will be needed are projected to differ from
those that have been produced historically.
Of course, workers often live and work in different jurisdictions—sometimes by preference and
sometimes by necessity. Some of the region’s current workforce lives outside of the Washington DC
metro area and commute in, which results in serious strains on the region’s transportation networks and
results in a loss of economic potential within the region. Many others commute from one jurisdiction to
another, which has led to severe traffic problems. If current commuting patterns persisted for net new
workers, these problems would be aggravated. Under those assumptions, however, the region would
still need to add 461,699 housing units over the next two decades, and workers in 56,599 households
would commute to the metro area from places outside.
George Mason University Center for Regional Analysis Page 8
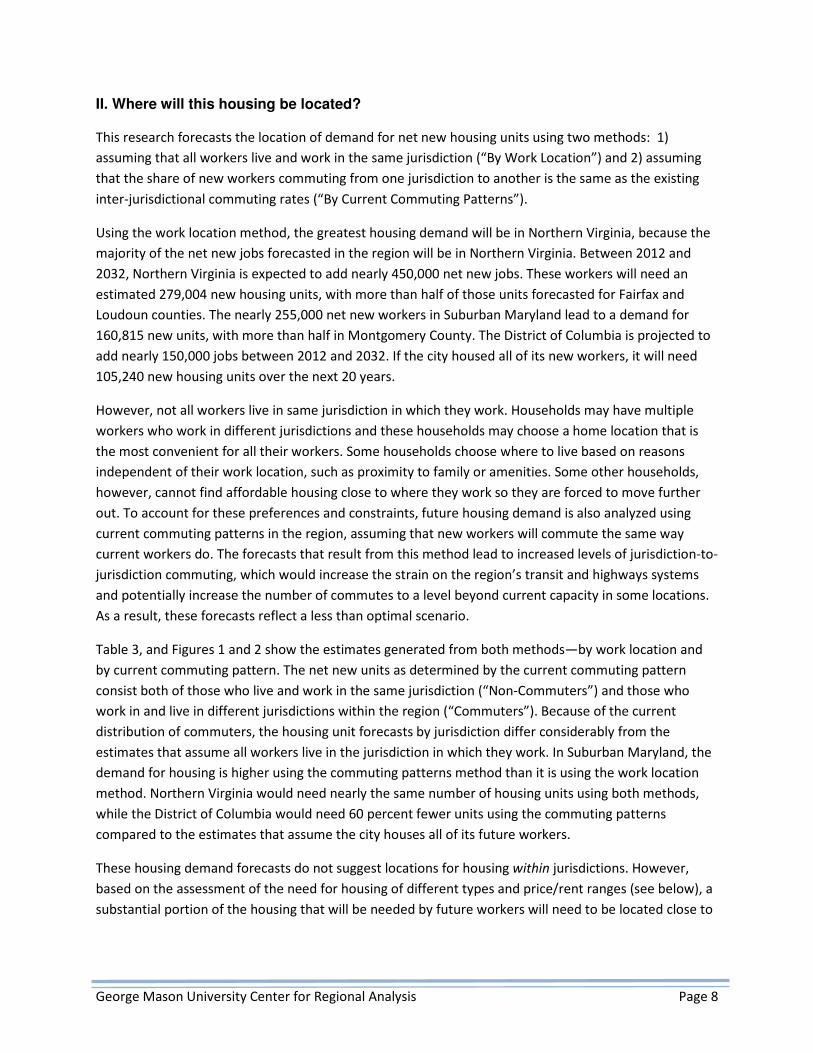
II. Where will this housing be located?
This research forecasts the location of demand for net new housing units using two methods: 1)
assuming that all workers live and work in the same jurisdiction (“By Work Location”) and 2) assuming
that the share of new workers commuting from one jurisdiction to another is the same as the existing
inter-jurisdictional commuting rates (“By Current Commuting Patterns”).
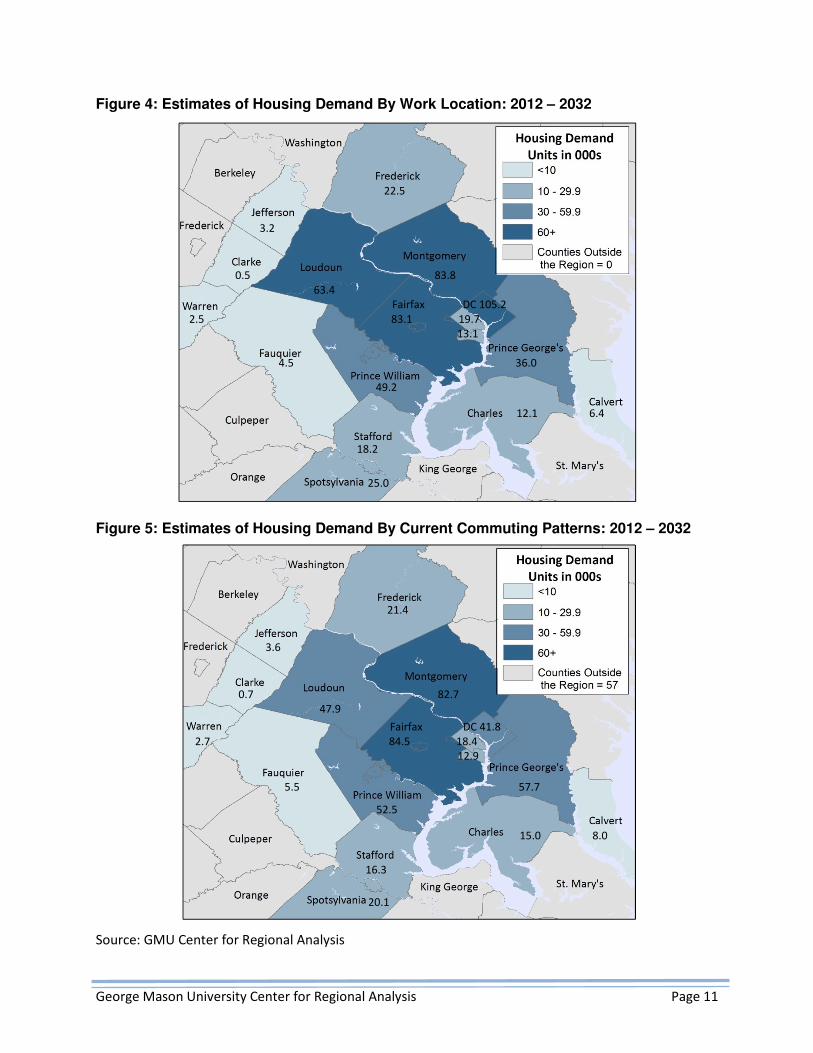
Using the work location method, the greatest housing demand will be in Northern Virginia, because the
majority of the net new jobs forecasted in the region will be in Northern Virginia. Between 2012 and
2032, Northern Virginia is expected to add nearly 450,000 net new jobs. These workers will need an
estimated 279,004 new housing units, with more than half of those units forecasted for Fairfax and
Loudoun counties. The nearly 255,000 net new workers in Suburban Maryland lead to a demand for
160,815 new units, with more than half in Montgomery County. The District of Columbia is projected to
add nearly 150,000 jobs between 2012 and 2032. If the city housed all of its new workers, it will need
105,240 new housing units over the next 20 years.
However, not all workers live in same jurisdiction in which they work. Households may have multiple
workers who work in different jurisdictions and these households may choose a home location that is
the most convenient for all their workers. Some households choose where to live based on reasons
independent of their work location, such as proximity to family or amenities. Some other households,
however, cannot find affordable housing close to where they work so they are forced to move further
out. To account for these preferences and constraints, future housing demand is also analyzed using
current commuting patterns in the region, assuming that new workers will commute the same way
current workers do. The forecasts that result from this method lead to increased levels of jurisdiction-to-
jurisdiction commuting, which would increase the strain on the region’s transit and highways systems
and potentially increase the number of commutes to a level beyond current capacity in some locations.
As a result, these forecasts reflect a less than optimal scenario.
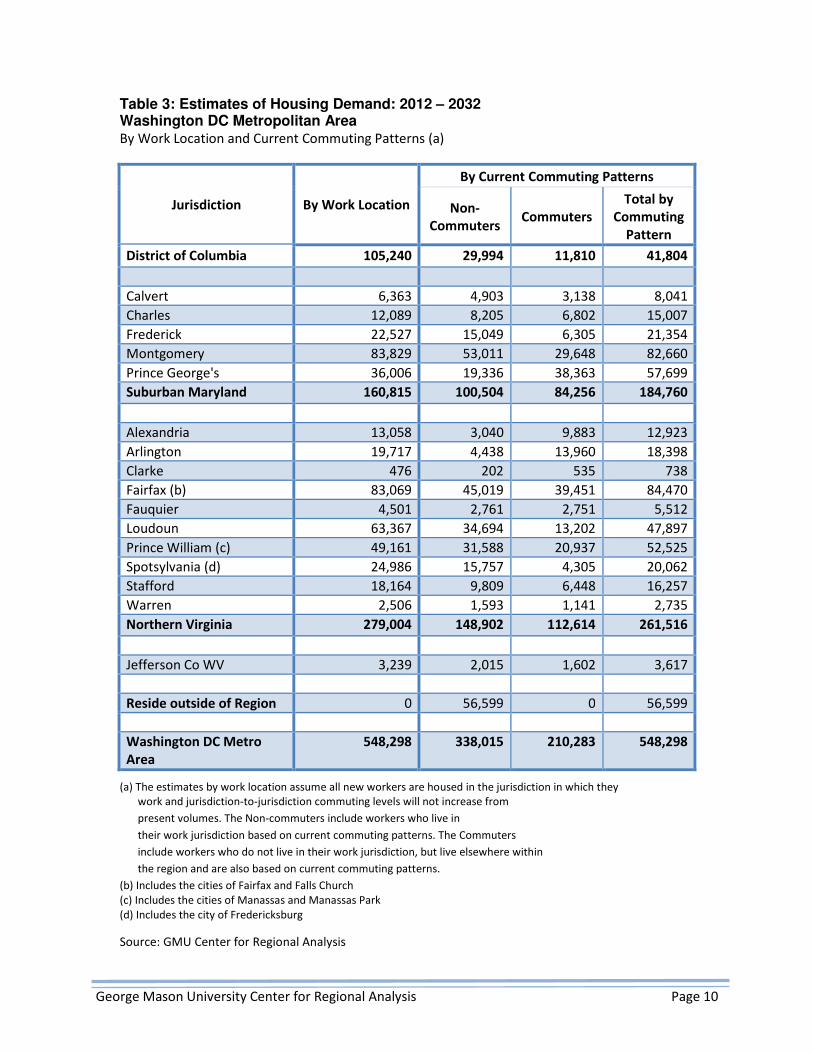
Table 3, and Figures 1 and 2 show the estimates generated from both methods—by work location and
by current commuting pattern. The net new units as determined by the current commuting pattern
consist both of those who live and work in the same jurisdiction (“Non-Commuters”) and those who
work in and live in different jurisdictions within the region (“Commuters”). Because of the current
distribution of commuters, the housing unit forecasts by jurisdiction differ considerably from the
estimates that assume all workers live in the jurisdiction in which they work. In Suburban Maryland, the
demand for housing is higher using the commuting patterns method than it is using the work location
method. Northern Virginia would need nearly the same number of housing units using both methods,
while the District of Columbia would need 60 percent fewer units using the commuting patterns
compared to the estimates that assume the city houses all of its future workers.
These housing demand forecasts do not suggest locations for housing within jurisdictions. However,
based on the assessment of the need for housing of different types and price/rent ranges (see below), a
substantial portion of the housing that will be needed by future workers will need to be located close to

George Mason University Center for Regional Analysis Page 9
established and growing employment centers, near transit and transportation networks, and in more
compact developments.
George Mason University Center for Regional Analysis Page 10
Table 3: Estimates of Housing Demand: 2012 – 2032 Washington DC Metropolitan Area By Work Location and Current Commuting Patterns (a)
Jurisdiction By Work Location
By Current Commuting Patterns
Non-
Commuters Commuters
Total by
Commuting
Pattern
District of Columbia 105,240 29,994 11,810 41,804
Calvert 6,363 4,903 3,138 8,041
Charles 12,089 8,205 6,802 15,007
Frederick 22,527 15,049 6,305 21,354
Montgomery 83,829 53,011 29,648 82,660
Prince George's 36,006 19,336 38,363 57,699
Suburban Maryland 160,815 100,504 84,256 184,760
Alexandria 13,058 3,040 9,883 12,923
Arlington 19,717 4,438 13,960 18,398
Clarke 476 202 535 738
Fairfax (b) 83,069 45,019 39,451 84,470
Fauquier 4,501 2,761 2,751 5,512
Loudoun 63,367 34,694 13,202 47,897
Prince William (c) 49,161 31,588 20,937 52,525
Spotsylvania (d) 24,986 15,757 4,305 20,062
Stafford 18,164 9,809 6,448 16,257
Warren 2,506 1,593 1,141 2,735
Northern Virginia 279,004 148,902 112,614 261,516
Jefferson Co WV 3,239 2,015 1,602 3,617
Reside outside of Region 0 56,599 0 56,599
Washington DC Metro
Area
548,298 338,015 210,283 548,298
(a) The estimates by work location assume all new workers are housed in the jurisdiction in which they
work and jurisdiction-to-jurisdiction commuting levels will not increase from
present volumes. The Non-commuters include workers who live in
their work jurisdiction based on current commuting patterns. The Commuters
include workers who do not live in their work jurisdiction, but live elsewhere within
the region and are also based on current commuting patterns.
(b) Includes the cities of Fairfax and Falls Church
(c) Includes the cities of Manassas and Manassas Park
(d) Includes the city of Fredericksburg
Source: GMU Center for Regional Analysis
George Mason University Center for Regional Analysis Page 11
Figure 4: Estimates of Housing Demand By Work Location: 2012 – 2032
Figure 5: Estimates of Housing Demand By Current Commuting Patterns: 2012 – 2032
Source: GMU Center for Regional Analysis
22.5
3.2
0.5 83.8
63.4
Fairfax DC 105.2
2.5 83.1 19.7
13.1
4.5 36.0
49.2
12.1 6.4
18.2
25.0
21.4
3.6
0.7 82.7
47.9
Fairfax DC 41.8
2.7 84.5 18.4
12.9
5.5 57.7
52.5
15.0 8.0
16.3
20.1
George Mason University Center for Regional Analysis Page 12
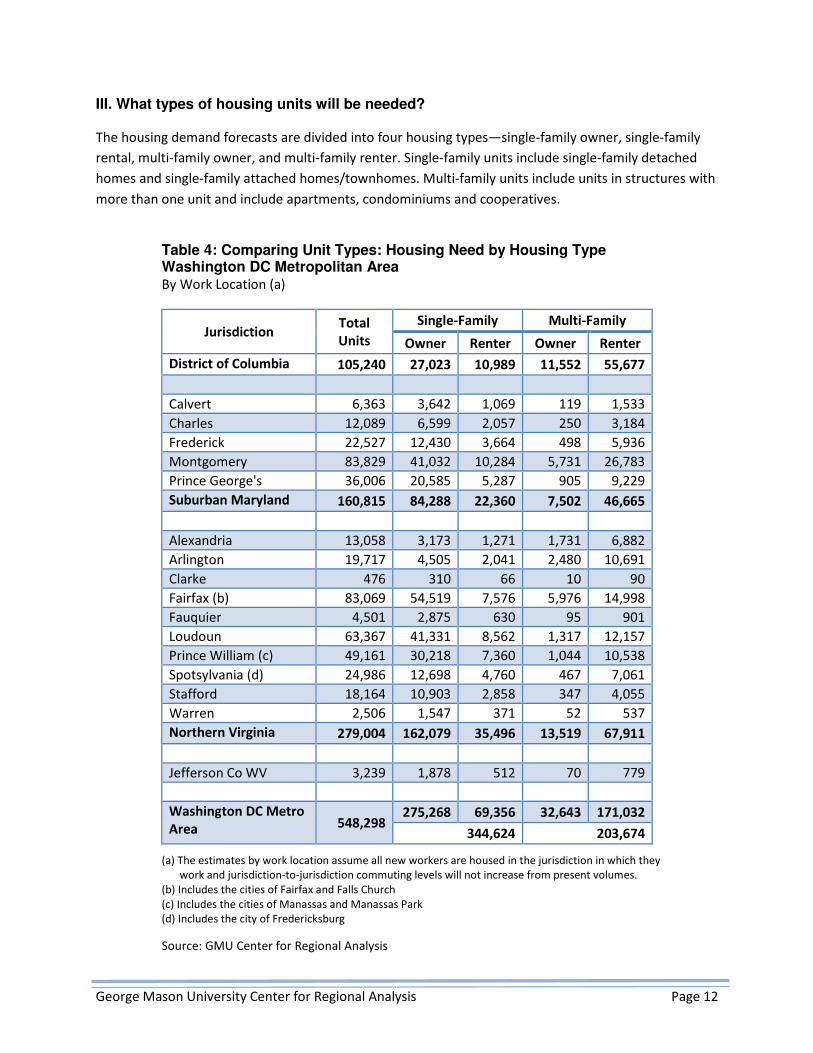
III. What types of housing units will be needed?
The housing demand forecasts are divided into four housing types—single-family owner, single-family
rental, multi-family owner, and multi-family renter. Single-family units include single-family detached
homes and single-family attached homes/townhomes. Multi-family units include units in structures with
more than one unit and include apartments, condominiums and cooperatives.
Table 4: Comparing Unit Types: Housing Need by Housing Type Washington DC Metropolitan Area By Work Location (a)
Jurisdiction Total
Units
Single-Family Multi-Family
Owner Renter Owner Renter
District of Columbia 105,240 27,023 10,989 11,552 55,677
Calvert 6,363 3,642 1,069 119 1,533
Charles 12,089 6,599 2,057 250 3,184
Frederick 22,527 12,430 3,664 498 5,936
Montgomery 83,829 41,032 10,284 5,731 26,783
Prince George's 36,006 20,585 5,287 905 9,229
Suburban Maryland 160,815 84,288 22,360 7,502 46,665
Alexandria 13,058 3,173 1,271 1,731 6,882
Arlington 19,717 4,505 2,041 2,480 10,691
Clarke 476 310 66 10 90
Fairfax (b) 83,069 54,519 7,576 5,976 14,998
Fauquier 4,501 2,875 630 95 901
Loudoun 63,367 41,331 8,562 1,317 12,157
Prince William (c) 49,161 30,218 7,360 1,044 10,538
Spotsylvania (d) 24,986 12,698 4,760 467 7,061
Stafford 18,164 10,903 2,858 347 4,055
Warren 2,506 1,547 371 52 537
Northern Virginia 279,004 162,079 35,496 13,519 67,911
Jefferson Co WV 3,239 1,878 512 70 779
Washington DC Metro
Area 548,298 275,268 69,356 32,643 171,032
344,624 203,674
(a) The estimates by work location assume all new workers are housed in the jurisdiction in which they
work and jurisdiction-to-jurisdiction commuting levels will not increase from present volumes.
(b) Includes the cities of Fairfax and Falls Church
(c) Includes the cities of Manassas and Manassas Park
(d) Includes the city of Fredericksburg
Source: GMU Center for Regional Analysis
George Mason University Center for Regional Analysis Page 13
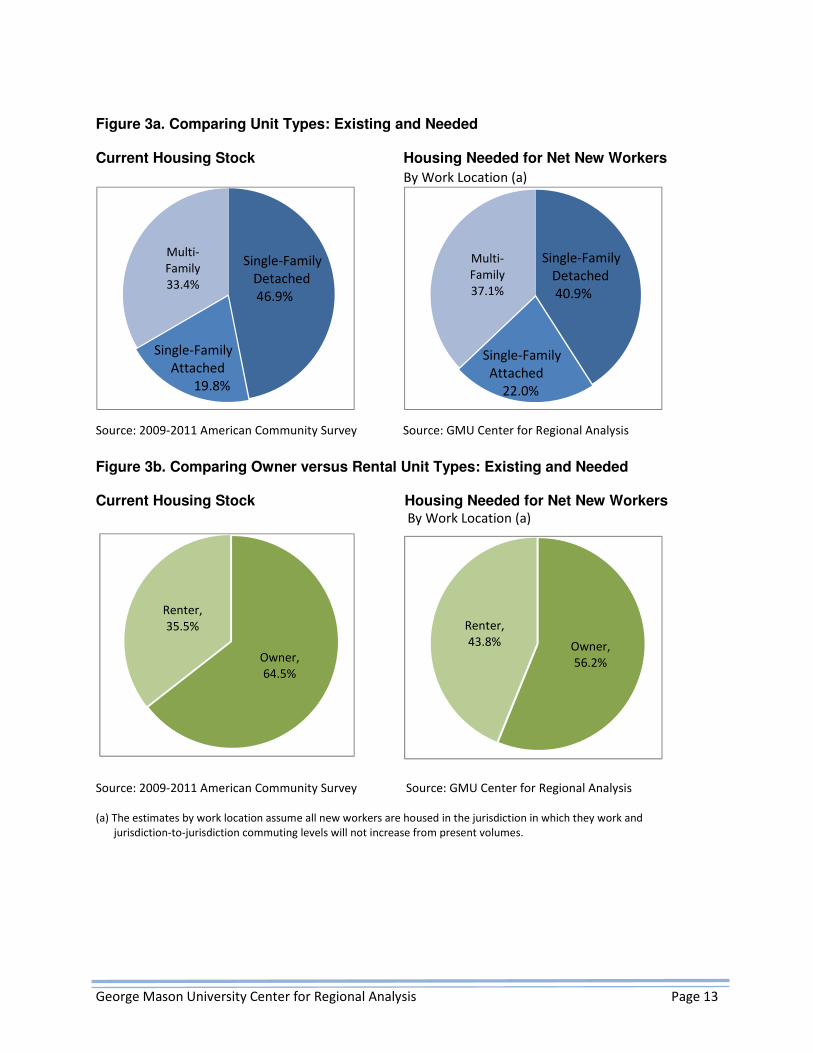
Figure 3a. Comparing Unit Types: Existing and Needed
Current Housing Stock
Housing Needed for Net New Workers
By Work Location (a)
Source: 2009-2011 American Community Survey Source: GMU Center for Regional Analysis
Figure 3b. Comparing Owner versus Rental Unit Types: Existing and Needed
Current Housing Stock Housing Needed for Net New Workers
By Work Location (a)
Source: 2009-2011 American Community Survey Source: GMU Center for Regional Analysis
(a) The estimates by work location assume all new workers are housed in the jurisdiction in which they work and
jurisdiction-to-jurisdiction commuting levels will not increase from present volumes.
Multi-
Family
37.1%
Owner,
56.2%
Renter,
43.8%
Owner,
64.5%
Renter,
35.5%
Multi-
Family
33.4%
Single-Family
Detached
46.9%
Single-Family
Attached
19.8%
Single-Family
Detached
40.9%
Single-Family
Attached
22.0%
George Mason University Center for Regional Analysis Page 14
The demographic characteristics of new workers, the types of jobs they will hold and the locations of the
forecasted units are used to determine the types of housing units that will be needed to accommodate
net new workers to the Washington DC area. As shown in Table 4, the forecasts suggest a need for
344,624 single-family units and 203,674 multi-family units. Of the single-family units, the largest need is
for owner-occupied units. Single-family owner housing is projected to be half (50.2 percent) of all
housing demand, which is the highest of all housing types. The second largest need will be for multi-
family rental units which accounts for 31.2 percent of all housing demand. Single-family renter units and
multi-family owner units account for 12.6 percent and 6.0 percent, respectively, of the housing demand
forecast.
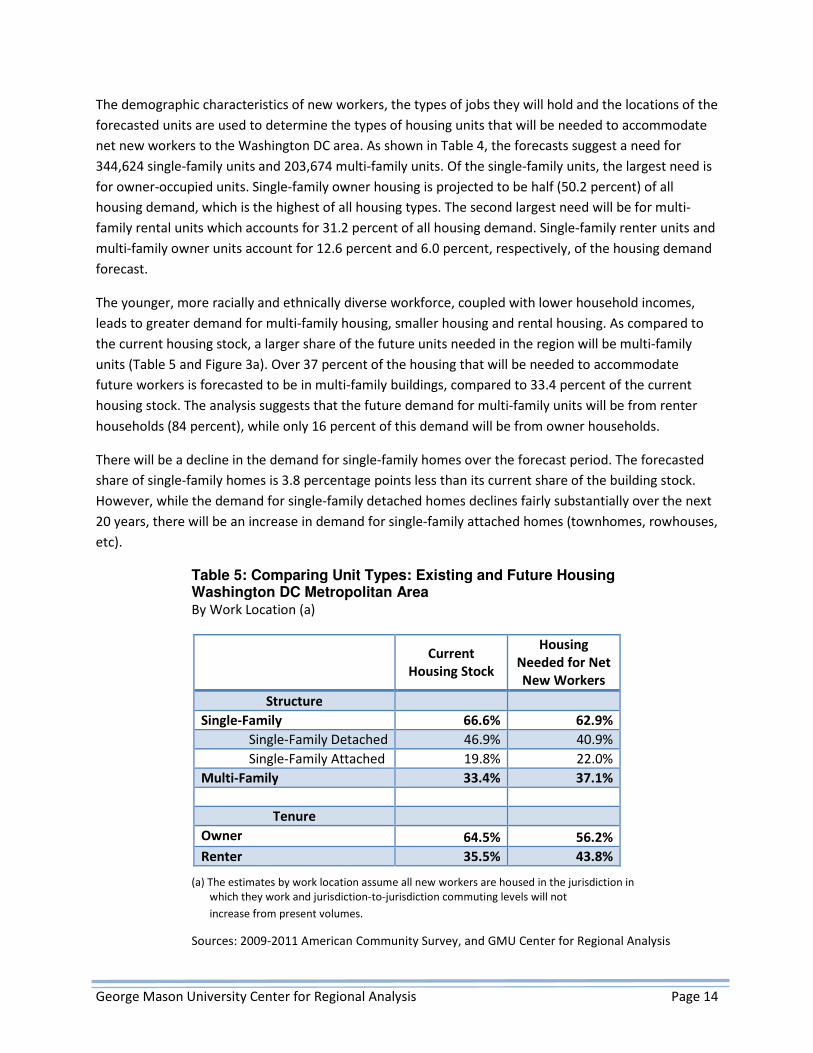
The younger, more racially and ethnically diverse workforce, coupled with lower household incomes,
leads to greater demand for multi-family housing, smaller housing and rental housing. As compared to
the current housing stock, a larger share of the future units needed in the region will be multi-family
units (Table 5 and Figure 3a). Over 37 percent of the housing that will be needed to accommodate
future workers is forecasted to be in multi-family buildings, compared to 33.4 percent of the current
housing stock. The analysis suggests that the future demand for multi-family units will be from renter
households (84 percent), while only 16 percent of this demand will be from owner households.
There will be a decline in the demand for single-family homes over the forecast period. The forecasted
share of single-family homes is 3.8 percentage points less than its current share of the building stock.
However, while the demand for single-family detached homes declines fairly substantially over the next
20 years, there will be an increase in demand for single-family attached homes (townhomes, rowhouses,
etc).
Table 5: Comparing Unit Types: Existing and Future Housing Washington DC Metropolitan Area By Work Location (a)
Current
Housing Stock
Housing
Needed for Net
New Workers
Structure
Single-Family 66.6% 62.9%
Single-Family Detached 46.9% 40.9%
Single-Family Attached 19.8% 22.0%
Multi-Family 33.4% 37.1%
Tenure
Owner 64.5% 56.2%
Renter 35.5% 43.8%
(a) The estimates by work location assume all new workers are housed in the jurisdiction in
which they work and jurisdiction-to-jurisdiction commuting levels will not
increase from present volumes.
Sources: 2009-2011 American Community Survey, and GMU Center for Regional Analysis
George Mason University Center for Regional Analysis Page 15
There will also be a downward shift in the homeownership rate among future workers of the
Washington DC area. Currently, 64.5 percent of households in the Washington DC area are homeowners.
Among future new workers, the projected homeownership rate is just 56.2 percent. During the forecast
period, there will be increases in the demand for single-family rental housing, largely caused by the
increase in demand for single-family attached homes. A larger share of single-family attached homes is
projected to be rental units (30 percent) than their detached counterparts (15 percent). Combined with
the increase in demand for multi-family rental units, the share of rental units is forecasted to be 43.8
percent, compared to 35.5 percent of the current housing stock (Figure 3b and Table 5).
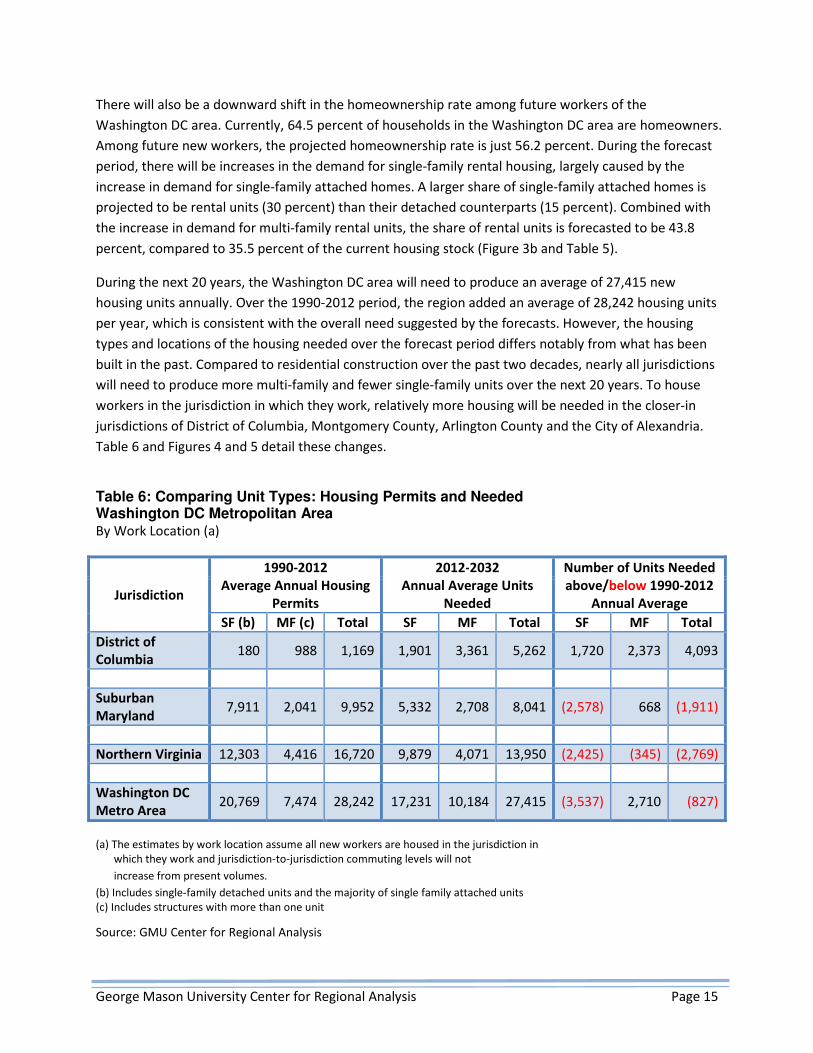
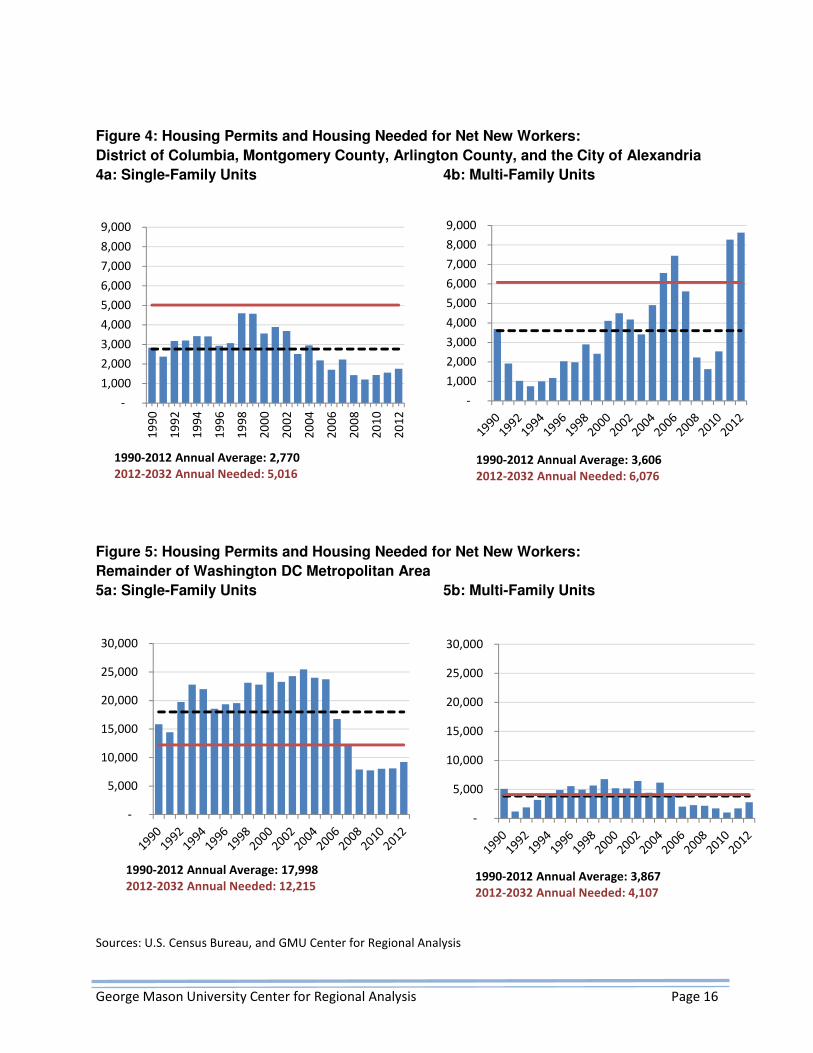
During the next 20 years, the Washington DC area will need to produce an average of 27,415 new
housing units annually. Over the 1990-2012 period, the region added an average of 28,242 housing units
per year, which is consistent with the overall need suggested by the forecasts. However, the housing
types and locations of the housing needed over the forecast period differs notably from what has been
built in the past. Compared to residential construction over the past two decades, nearly all jurisdictions
will need to produce more multi-family and fewer single-family units over the next 20 years. To house
workers in the jurisdiction in which they work, relatively more housing will be needed in the closer-in
jurisdictions of District of Columbia, Montgomery County, Arlington County and the City of Alexandria.
Table 6 and Figures 4 and 5 detail these changes.
Table 6: Comparing Unit Types: Housing Permits and Needed Washington DC Metropolitan Area By Work Location (a)
Jurisdiction
1990-2012
Average Annual Housing
Permits
2012-2032
Annual Average Units
Needed
Number of Units Needed
above/below 1990-2012
Annual Average
SF (b) MF (c) Total SF MF Total SF MF Total
District of
Columbia 180 988 1,169 1,901 3,361 5,262 1,720 2,373 4,093
Suburban
Maryland 7,911 2,041 9,952 5,332 2,708 8,041 (2,578) 668 (1,911)
Northern Virginia 12,303 4,416 16,720 9,879 4,071 13,950 (2,425) (345) (2,769)
Washington DC
Metro Area 20,769 7,474 28,242 17,231 10,184 27,415 (3,537) 2,710 (827)
(a) The estimates by work location assume all new workers are housed in the jurisdiction in
which they work and jurisdiction-to-jurisdiction commuting levels will not
increase from present volumes.
(b) Includes single-family detached units and the majority of single family attached units
(c) Includes structures with more than one unit
Source: GMU Center for Regional Analysis
George Mason University Center for Regional Analysis Page 16
-
1,000
2,000
3,000
4,000
5,000
6,000
7,000
8,000
9,000
1990-2012 Annual Average: 3,606
2012-2032 Annual Needed: 6,076
-
5,000
10,000
15,000
20,000
25,000
30,000
1990-2012 Annual Average: 3,867
2012-2032 Annual Needed: 4,107
Figure 4: Housing Permits and Housing Needed for Net New Workers:
District of Columbia, Montgomery County, Arlington County, and the City of Alexandria
4a: Single-Family Units 4b: Multi-Family Units
Figure 5: Housing Permits and Housing Needed for Net New Workers:
Remainder of Washington DC Metropolitan Area
5a: Single-Family Units 5b: Multi-Family Units
Sources: U.S. Census Bureau, and GMU Center for Regional Analysis
-
1,000
2,000
3,000
4,000
5,000
6,000
7,000
8,000
9,000
19
90
19
92
19
94
19
96
19
98
20
00
20
02
20
04
20
06
20
08
20
10
20
12
1990-2012 Annual Average: 2,770
2012-2032 Annual Needed: 5,016
-
5,000
10,000
15,000
20,000
25,000
30,000
1990-2012 Annual Average: 17,998
2012-2032 Annual Needed: 12,215
George Mason University Center for Regional Analysis Page 17
IV. What housing costs can future new workers afford?
Even with a sufficient supply of housing in optimal locations, new workers may locate outside of the
region if housing costs are unaffordable. Or they may choose not to come to work in the region at all,
opting for jobs in lower cost regions. The region’s housing must be priced so that it is affordable to new
workers. The new workers coming to the Washington DC area will have a range of wages and, therefore,
there will be a need for housing at a range of prices and rents. While the industries with relatively higher
wages will have job growth, there will be substantial employment growth in lower-wage sectors. In
addition to the shifting wage structure, a growing share of workers will live alone and will therefore
have only one income. As a result, the Washington DC area will need a substantial amount of housing at
relatively moderate prices and rents.
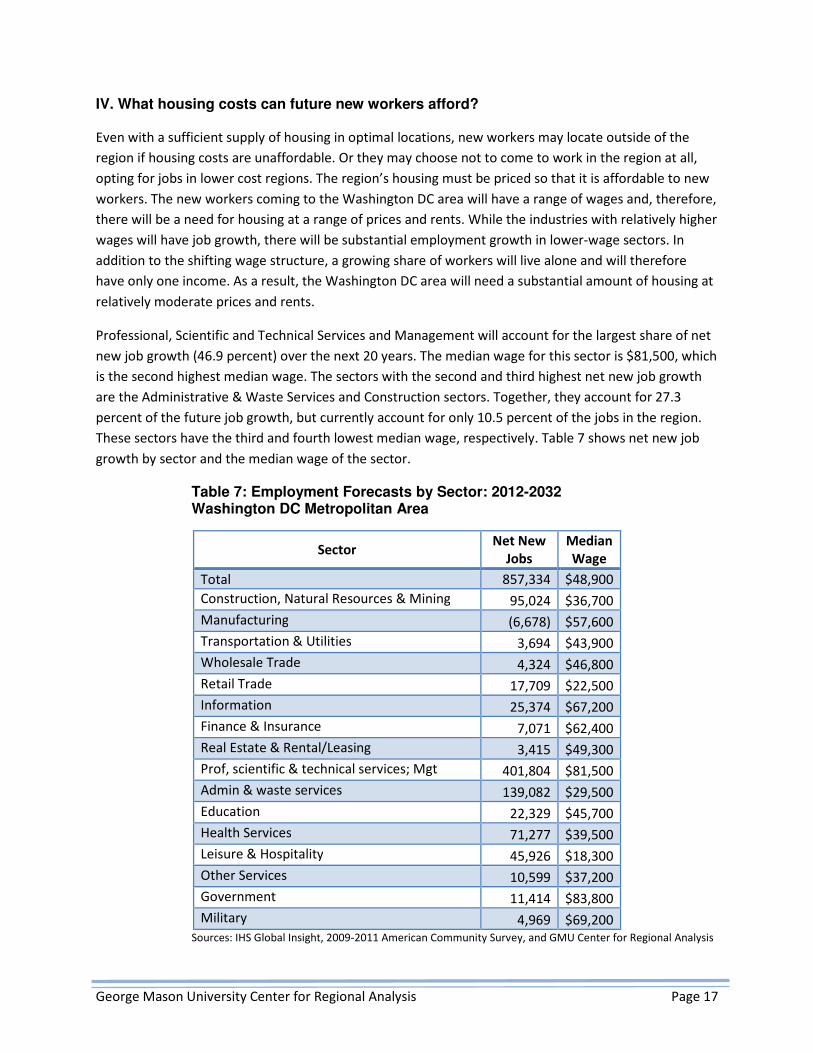
Professional, Scientific and Technical Services and Management will account for the largest share of net
new job growth (46.9 percent) over the next 20 years. The median wage for this sector is $81,500, which
is the second highest median wage. The sectors with the second and third highest net new job growth
are the Administrative & Waste Services and Construction sectors. Together, they account for 27.3
percent of the future job growth, but currently account for only 10.5 percent of the jobs in the region.
These sectors have the third and fourth lowest median wage, respectively. Table 7 shows net new job
growth by sector and the median wage of the sector.
Table 7: Employment Forecasts by Sector: 2012-2032 Washington DC Metropolitan Area
Sector Net New
Jobs
Median
Wage
Total 857,334 $48,900
Construction, Natural Resources & Mining 95,024 $36,700
Manufacturing (6,678) $57,600
Transportation & Utilities 3,694 $43,900
Wholesale Trade 4,324 $46,800
Retail Trade 17,709 $22,500
Information 25,374 $67,200
Finance & Insurance 7,071 $62,400
Real Estate & Rental/Leasing 3,415 $49,300
Prof, scientific & technical services; Mgt 401,804 $81,500
Admin & waste services 139,082 $29,500
Education 22,329 $45,700
Health Services 71,277 $39,500
Leisure & Hospitality 45,926 $18,300
Other Services 10,599 $37,200
Government 11,414 $83,800
Military 4,969 $69,200 Sources: IHS Global Insight, 2009-2011 American Community Survey, and GMU Center for Regional Analysis

George Mason University Center for Regional Analysis Page 18
The median wages by sector and by work jurisdiction are combined with assumptions about the average
number of workers per household for different household types to calculate household incomes.
Affordable rents and homes prices are then based on household incomes. The maximum affordable
home price is assumed to be no more than four times the annual household income. The maximum
monthly rent that is affordable to a household depends on household income, and is assumed to be no
more than 30 percent of the monthly household income (Table 8).
Table 8: Household Income and Maximum Home Prices and Monthly Rents
Household Income Home Price Monthly Rent
Less than $50,000 Less than $200,000 Less than $1,250
$50,000-74,999 $200,000-299,999 $1,250-1,314
$75,000-99,999 $300,000-399,999 $1,315-1,749
$100,000-124,999 $400,000-499,999 $1,750-1,874
$125,000-149,999 $500,000-599,999 $1,875-2,249
$150,000 or more $600,000 or more $2,250 or more
Source: GMU Center for Regional
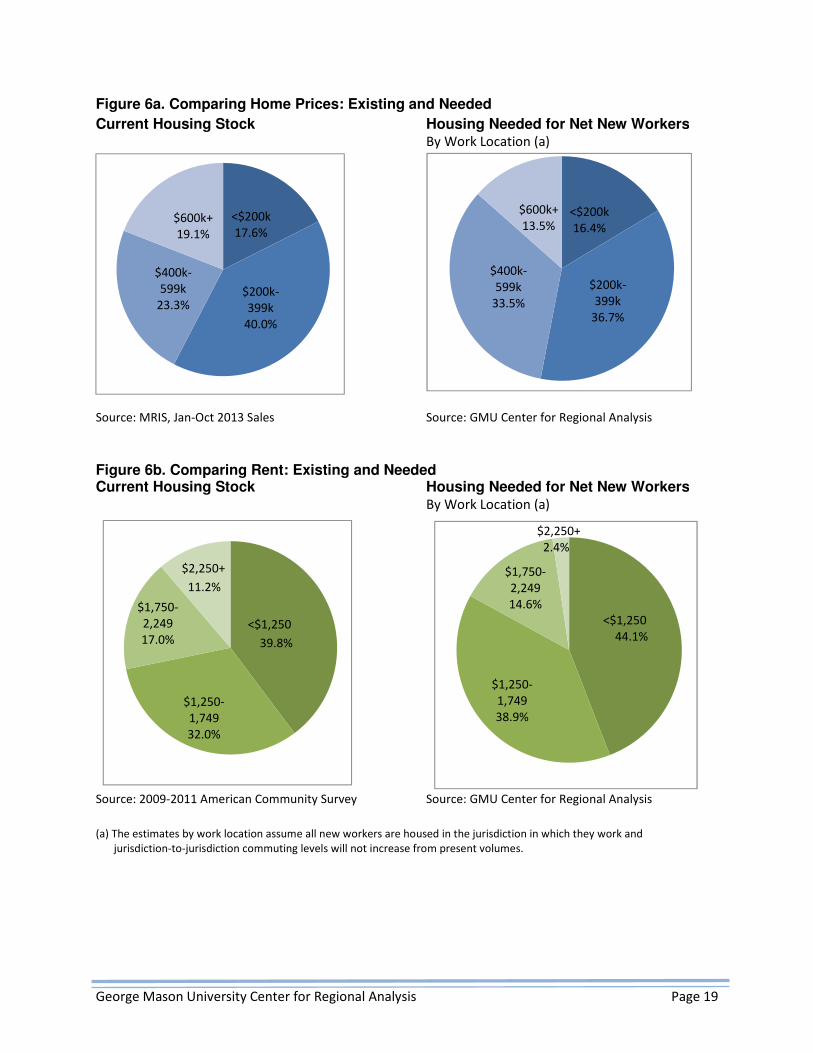
About 16 percent of the owner-occupied homes that will be needed to house new workers will need to
be priced below $200,000 (Figure 6a and Table 9). An additional 16.9 percent of new owner households
will be able to afford homes priced between $200,000 and $299,999. Only 13.5 percent of new owners
in the region will be able to afford a home priced at $600,000 or more given then wages and household
demographics of new workers. By contrast, 19.1 percent of 2013 home sales were for houses that sold
for $600,000 or more.2
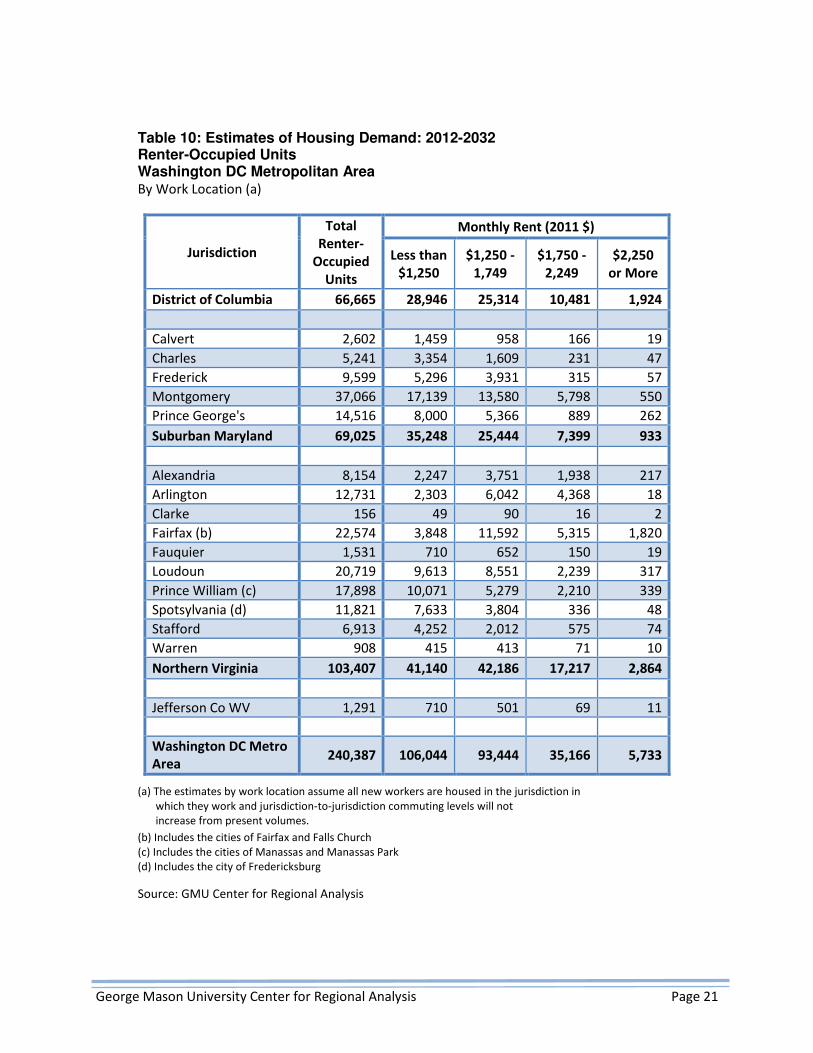
There will be a substantial need for moderately priced rental units to accommodate the region’s future
workforce. Among new renter households, 44.1 percent will be able to afford a maximum monthly rent
of $1,250 (Figure 6b and Table 10). Another 21.2 percent will be able to afford a unit renting for
between $1,250 and $1,314. Only 2.4 percent of renter households will have a household income
sufficient to afford to rent a unit for $2,250 or more. By contrast, 11.2 percent of current renters are
paying $2,250 or more, and a significant share of new rental construction targets this upper income
group.
The demand for moderately priced owner and rental units does not mean that all of these more
affordable units will be new construction. In some local markets, it would be very difficult to build new
units at these lower price and rent levels without significant subsidy. Therefore, these forecasts suggest
that a large share of the lower cost housing that will be needed in the future will have to come through
preservation of existing affordable housing.
2 Source: MRIS, January through October 2013 Sales
George Mason University Center for Regional Analysis Page 19
Figure 6a. Comparing Home Prices: Existing and Needed
Current Housing Stock Housing Needed for Net New Workers By Work Location (a)
Source: MRIS, Jan-Oct 2013 Sales Source: GMU Center for Regional Analysis
Figure 6b. Comparing Rent: Existing and Needed Current Housing Stock Housing Needed for Net New Workers By Work Location (a)
Source: 2009-2011 American Community Survey
Source: GMU Center for Regional Analysis
(a) The estimates by work location assume all new workers are housed in the jurisdiction in which they work and
jurisdiction-to-jurisdiction commuting levels will not increase from present volumes.
<$200k
16.4%
$200k-
399k
36.7%
$400k-
599k
33.5%
$600k+
13.5%
$1,250-
1,749
38.9%
$1,750-
2,249
14.6%
$1,250-
1,749
32.0%
$1,750-
2,249
17.0%
<$200k
17.6%
$200k-
399k
40.0%
$400k-
599k
23.3%
$600k+
19.1%
$2,250+
11.2%
<$1,250
39.8%
$2,250+
2.4%
<$1,250
44.1%
George Mason University Center for Regional Analysis Page 20
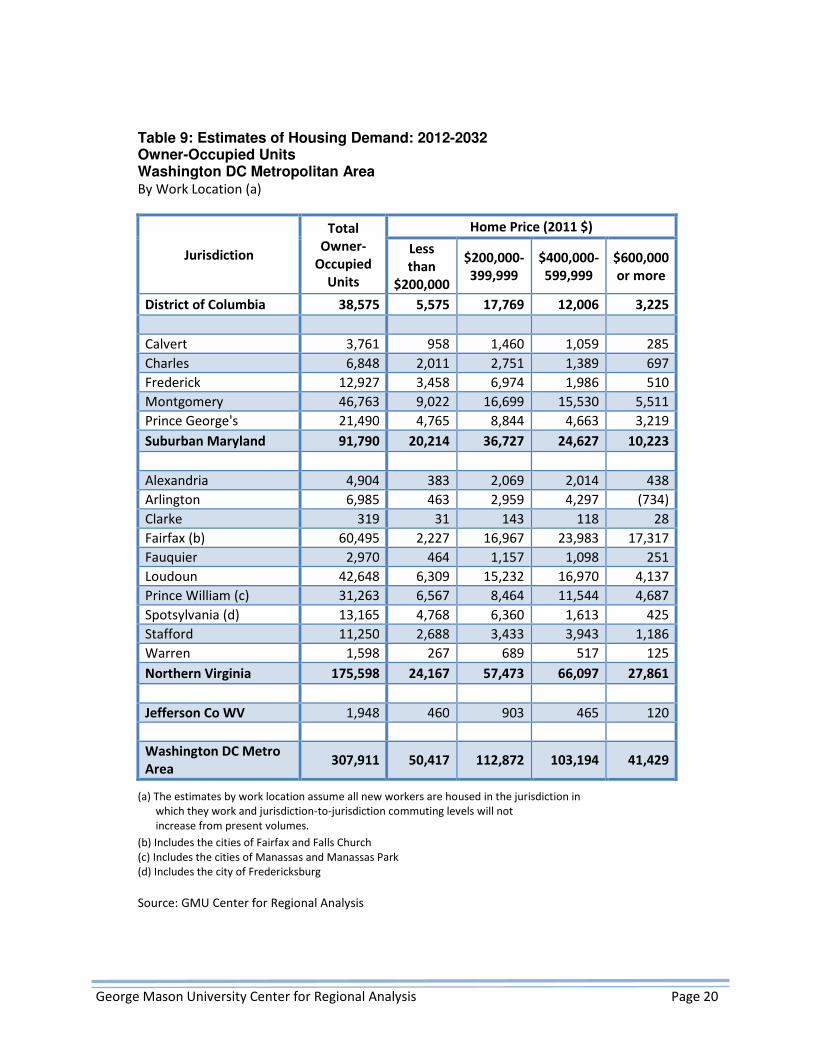
Table 9: Estimates of Housing Demand: 2012-2032 Owner-Occupied Units Washington DC Metropolitan Area By Work Location (a)
Jurisdiction
Total
Owner-
Occupied
Units
Home Price (2011 $)
Less
than
$200,000
$200,000-
399,999
$400,000-
599,999
$600,000
or more
District of Columbia 38,575 5,575 17,769 12,006 3,225
Calvert 3,761 958 1,460 1,059 285
Charles 6,848 2,011 2,751 1,389 697
Frederick 12,927 3,458 6,974 1,986 510
Montgomery 46,763 9,022 16,699 15,530 5,511
Prince George's 21,490 4,765 8,844 4,663 3,219
Suburban Maryland 91,790 20,214 36,727 24,627 10,223
Alexandria 4,904 383 2,069 2,014 438
Arlington 6,985 463 2,959 4,297 (734)
Clarke 319 31 143 118 28
Fairfax (b) 60,495 2,227 16,967 23,983 17,317
Fauquier 2,970 464 1,157 1,098 251
Loudoun 42,648 6,309 15,232 16,970 4,137
Prince William (c) 31,263 6,567 8,464 11,544 4,687
Spotsylvania (d) 13,165 4,768 6,360 1,613 425
Stafford 11,250 2,688 3,433 3,943 1,186
Warren 1,598 267 689 517 125
Northern Virginia 175,598 24,167 57,473 66,097 27,861
Jefferson Co WV 1,948 460 903 465 120
Washington DC Metro
Area 307,911 50,417 112,872 103,194 41,429
(a) The estimates by work location assume all new workers are housed in the jurisdiction in
which they work and jurisdiction-to-jurisdiction commuting levels will not
increase from present volumes.
(b) Includes the cities of Fairfax and Falls Church
(c) Includes the cities of Manassas and Manassas Park
(d) Includes the city of Fredericksburg
Source: GMU Center for Regional Analysis
George Mason University Center for Regional Analysis Page 21
Table 10: Estimates of Housing Demand: 2012-2032 Renter-Occupied Units Washington DC Metropolitan Area By Work Location (a)
Jurisdiction
Total
Renter-
Occupied
Units
Monthly Rent (2011 $)
Less than
$1,250
$1,250 -
1,749
$1,750 -
2,249
$2,250
or More
District of Columbia 66,665 28,946 25,314 10,481 1,924
Calvert 2,602 1,459 958 166 19
Charles 5,241 3,354 1,609 231 47
Frederick 9,599 5,296 3,931 315 57
Montgomery 37,066 17,139 13,580 5,798 550
Prince George's 14,516 8,000 5,366 889 262
Suburban Maryland 69,025 35,248 25,444 7,399 933
Alexandria 8,154 2,247 3,751 1,938 217
Arlington 12,731 2,303 6,042 4,368 18
Clarke 156 49 90 16 2
Fairfax (b) 22,574 3,848 11,592 5,315 1,820
Fauquier 1,531 710 652 150 19
Loudoun 20,719 9,613 8,551 2,239 317
Prince William (c) 17,898 10,071 5,279 2,210 339
Spotsylvania (d) 11,821 7,633 3,804 336 48
Stafford 6,913 4,252 2,012 575 74
Warren 908 415 413 71 10
Northern Virginia 103,407 41,140 42,186 17,217 2,864
Jefferson Co WV 1,291 710 501 69 11
Washington DC Metro
Area 240,387 106,044 93,444 35,166 5,733
(a) The estimates by work location assume all new workers are housed in the jurisdiction in
which they work and jurisdiction-to-jurisdiction commuting levels will not
increase from present volumes.
(b) Includes the cities of Fairfax and Falls Church
(c) Includes the cities of Manassas and Manassas Park
(d) Includes the city of Fredericksburg
Source: GMU Center for Regional Analysis
George Mason University Center for Regional Analysis Page 22
Policy Implications
Housing Should be Part of a Regional Economic Development Strategy
A sufficient supply of housing is essential to ensuring that the Washington DC area is able to achieve its
full economic potential. New jobs cannot be filled without workers available to fill them. And while
some workers may be willing to commute long distances or from outside the region, the wage of the job
must be high enough to justify the commute and the transportation infrastructure must have the
capacity for these workers. Many workers, however, will look elsewhere for jobs if they cannot find
appropriate and affordable housing close to work.
A strategy to supply sufficient housing for the future workforce is a key component of an overall regional
economic development strategy. Regions that have adequate housing to accommodate future workers
will have a competitive advantage over other places. Regions with housing close to employment centers
also benefit by not having to supply extension additional transportation services and can benefit from
additional worker spending in the region.
For the Washington DC area to realize its economic development potential, all jurisdictions need to have
a housing policy that reflects their specific housing requirements to accommodate future economic
growth and the workforce housing demands that this desired growth implies.
Housing is where the workforce lives. It is where workers spend a large share of their incomes and
where they pay their taxes. Recognizing this critical link between housing and regional economic growth
is critical to the future vitality of the Washington DC area economy. The Washington DC area cannot
achieve its projected growth potential without new workers. And this workforce will not be available to
the region’s future businesses in the absence of sufficient housing, located to minimize commuting, and
priced at levels affordable to new workers. As the structure of the Washington DC area economy evolves
and becomes less dependent on the Federal government, it is important for the region to find ways to
be as competitive as possible. Without meeting the projected future demand for housing, the
Washington DC area will lose position to other metropolitan area economies that have now rebounded
from the economic downturn and have achieved a better balance between housing and their future
workforce requirements.
Housing Needed for Net New Workers is Just Part of the Total Future Need
These housing demand forecasts are not comprehensive; they include estimates only of the housing that
will be needed to accommodate the region’s net new workers. The forecasts do not include the housing
that will be demanded by the replacement workers in the region over the next 20 years, which is
estimated to be 40 percent more than the number of net new workers. Some replacement jobs will
result from current workers leaving the region, which will therefore free up a housing unit for another
worker. However, a substantial share of the region’s replacement workers will need additional housing
that is not accounted for in these forecasts. This is particularly true for workers backfilling jobs vacated
by retirees. Between 50 and 60 percent of retirees stay in the region in which they were working; while
George Mason University Center for Regional Analysis Page 23
they may move to a different type of house within the region, they will not make a housing unit
available to the workers who move to the region to fill their jobs.
There are additional housing needs in the region for non-working households, including retirees,
students, volunteers and interns, which are also not included in these forecasts. Lastly, there will need
to be an additional number of vacant housing units to allow for current and future households to move
as their needs change. For the 548,298 new units needed to accommodate the net new workers alone, it
is estimated that an additional 14,000 units will be needed for this frictional vacancy.
Multi-family Housing, Rental Housing and More Affordable Housing Will Be in Demand
These forecasts suggest that the housing that will be needed for the future workforce will include more
multi-family units (including rental and condominium), and will need to include a substantial share of
units at moderate prices and rents, compared to the existing housing stock. The reasons for the shift
towards smaller, less expensive and rental housing relates to the changing demographics of the labor
force and the distribution of wages of new jobs as the region’s economy evolves. The workers coming
into the region over the next 20 years will be younger than the existing workforce, and they will be more
likely to live in one-person households. Furthermore, they will be more likely to work in somewhat
lower-wage jobs than current workers.
There has been a surge in multi-family construction in the region over the last few years. However,
much of this new rental construction targets the highest end of the market. Housing that is affordable to
lower-income working households is very difficult to build in many places in the Washington DC area
without significant subsidies or incentives. Local commitment of dedicated funding for affordable
housing can help facilitate the development of lower cost housing. However, much of the more
affordable housing that will be demanded by new workers is existing, rather than new, housing.
Therefore, it is essential that there is an inventory of market rate and subsidized affordable housing
units in the region, and that efforts are made to preserve existing lower priced housing, particularly in
the fastest-growing and in-demand locations.
Without Sufficient Housing, Traffic Congestion and Quality of Life Worsen
A lack of sufficient housing within the Washington DC area and located in proximity to the region’s
employment centers and to transit will lead to increased traffic and transit congestion, and will result in
longer commutes, lower worker productivity, and declining quality of life for all residents of the region.
Increased funding for transportation expansions and improvements beyond those that have been
planned currently is unlikely. Therefore, the ability to build out of the region’s traffic problems is
untenable. Allowing land use and zoning changes that permit the construction of more housing near
jobs, which will require less commuting, is a critical implication of these housing demand forecasts.
The lack of housing, increasing traffic congestion and declining quality of life will make it more difficult
for businesses to recruit workers and will make it less attractive for new firms to locate in the region.
Other parts of the country have achieved a better balance between their housing supply and economic
growth. Workers may choose to leave the Washington DC area for places with more affordable housing

George Mason University Center for Regional Analysis Page 24
closer to jobs and with shorter, less stressful commutes. The pull of the Federal government is lessening.
And while the Washington DC area has many amenities that will continue to be attractive to workers
and businesses, there are many other choices as both firms and labor are increasingly footloose.

George Mason University Center for Regional Analysis Page 25
Appendix
George Mason University Center for Regional Analysis Page 26
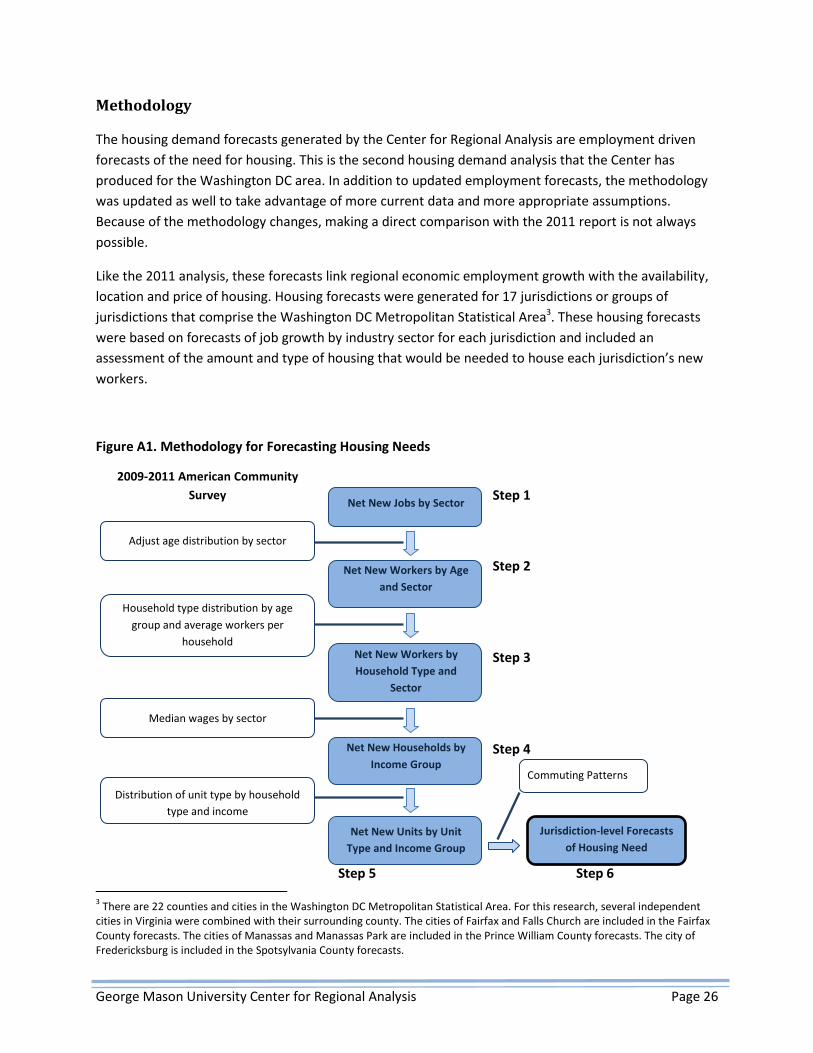
Methodology
The housing demand forecasts generated by the Center for Regional Analysis are employment driven
forecasts of the need for housing. This is the second housing demand analysis that the Center has
produced for the Washington DC area. In addition to updated employment forecasts, the methodology
was updated as well to take advantage of more current data and more appropriate assumptions.
Because of the methodology changes, making a direct comparison with the 2011 report is not always
possible.
Like the 2011 analysis, these forecasts link regional economic employment growth with the availability,
location and price of housing. Housing forecasts were generated for 17 jurisdictions or groups of
jurisdictions that comprise the Washington DC Metropolitan Statistical Area3. These housing forecasts
were based on forecasts of job growth by industry sector for each jurisdiction and included an
assessment of the amount and type of housing that would be needed to house each jurisdiction’s new
workers.
Figure A1. Methodology for Forecasting Housing Needs
3 There are 22 counties and cities in the Washington DC Metropolitan Statistical Area. For this research, several independent
cities in Virginia were combined with their surrounding county. The cities of Fairfax and Falls Church are included in the Fairfax
County forecasts. The cities of Manassas and Manassas Park are included in the Prince William County forecasts. The city of
Fredericksburg is included in the Spotsylvania County forecasts.
Step 1
Step 2
Step 3
Step 4
Step 5 Step 6
2009-2011 American Community
Survey
Adjust age distribution by sector
Household type distribution by age
group and average workers per
household
Median wages by sector
Distribution of unit type by household
type and income
Net New Jobs by Sector
Net New Workers by Age
and Sector
Net New Workers by
Household Type and
Sector
Net New Households by
Income Group
Net New Units by Unit
Type and Income Group
Jurisdiction-level Forecasts
of Housing Need
Commuting Patterns
George Mason University Center for Regional Analysis Page 27
The Center conducted a six-step model for generating housing demand forecasts (see Figure A1). Each
step in the process was important for modeling not simply the overall demand for housing, but also the
need for housing in different jurisdictions, of different types, and at different price/rent points. The
characteristics of the housing units needed for the region’s future workers depend on the age,
household composition, and household income of new workers, which are all factors included in the
analysis. This section briefly outlines the methodology and data used to derive the forecasts.
1. Determine job growth by industry
It is important to understand the types of jobs coming to the region so we can develop estimates of
worker age and household income, which will determine household composition, housing types and
affordability levels. IHS Global Insight provides annual job forecasts for each of the region’s jurisdictions.
These employment forecasts are based on a county-level econometric model that Global Insight updates
regularly. The forecasts include payroll jobs only, excluding unincorporated self-employed persons.
Therefore, the Global Insight figures undercount the total employment activity in the region.
The Global Insight forecasts include 13 major industry sectors. In some cases, we split the Global Insight
sectors into subsectors if the workers in different subsectors were likely to have different wages. We
split the Global Insight transportation, trade and utilities sector into transportation and utilities,
wholesale trade and retail trade. We divided the education and health services sector into two sectors.
We split the financial services sector into finance and insurance and real estate. Finally, we split the
professional and business services sector into professional and technical services/management and
administrative/waste services. Sub-regional4 employment data from the U.S. Bureaus of Labor Statistics
was used to divide the sectors. Tables A1-1 through A1-17 summarize the employment change by sector
for each jurisdiction.
2. Assign net new jobs to workers by age category
Understanding the age distribution by sector of the region’s future workforce is important for estimating
housing demand, since the demand for different types of housing is strongly associated with individuals’
ages. The first step in moving from jobs to housing demand is to estimate the age distribution of the net
new workers. For each jurisdiction and job sector, we assigned some share of the net new workers in
each sector to one of three age groups: under 30, 30-44 or 45-64. We assumed no net new workers are
aged 65 or older.
New workers will be somewhat younger than the existing workforce We analyzed data from the 2009-
2011 American Community Survey (3-year microdata sample) to estimate the age distribution of current
4 The divisions consist of Washington, DC; the entirety of Northern Virginia; Montgomery and Frederick counties combined; and
Prince George’s, Calvert and Charles counties combined.
George Mason University Center for Regional Analysis Page 28
workers for each industry sector. This analysis was done separately for each jurisdiction or combination
of jurisdictions if the county/city was too small.5
We then adjusted the age distribution to account for the fact that net new workers would be younger by
analyzing 2009-2011 ACS data on the age distribution of workers6 who had recently moved in the
Washington DC area. Through this analysis, we found that recent movers were more likely to be 18-29
or 30-44 than existing workers. Recent movers were less likely to be 45-64. Tables A2-1 through A2-17
summarize the age distribution of the net new workers by sector for each jurisdiction.
3. Assign net new workers to a household type and sector
This process of assigning workers to households consisted of two steps: i) determining the type of
household to which a worker is most likely to belong based on age and job sector, and then ii)
calculating the average number of workers within each household type to determine the number of net
new households.
i) Determine the household type
Age is an important determinant of housing demand largely because of the household composition
implied by the ages of the individuals in the households. For example, workers under age 30 are more
likely to live in one-person households or two adult-no children households and workers age 30 to 44
are more likely to live in households with children.
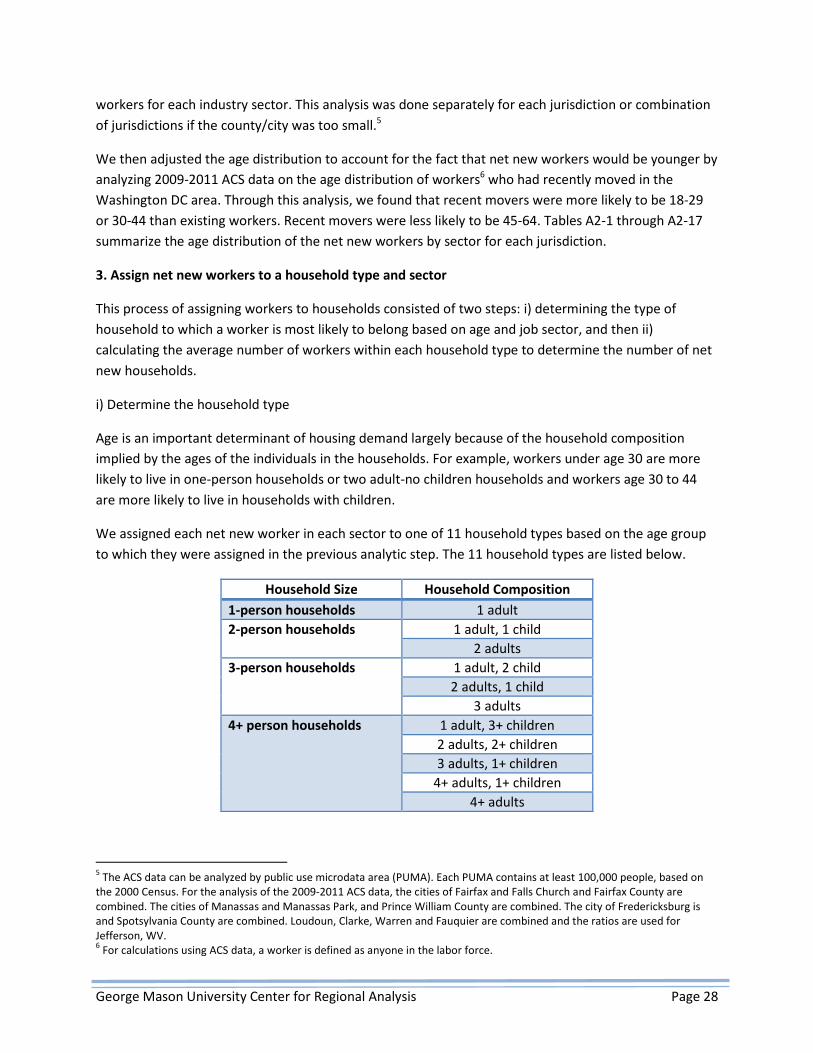
We assigned each net new worker in each sector to one of 11 household types based on the age group
to which they were assigned in the previous analytic step. The 11 household types are listed below.
Household Size Household Composition
1-person households 1 adult
2-person households 1 adult, 1 child
2 adults
3-person households 1 adult, 2 child
2 adults, 1 child
3 adults
4+ person households 1 adult, 3+ children
2 adults, 2+ children
3 adults, 1+ children
4+ adults, 1+ children
4+ adults
5 The ACS data can be analyzed by public use microdata area (PUMA). Each PUMA contains at least 100,000 people, based on
the 2000 Census. For the analysis of the 2009-2011 ACS data, the cities of Fairfax and Falls Church and Fairfax County are
combined. The cities of Manassas and Manassas Park, and Prince William County are combined. The city of Fredericksburg is
and Spotsylvania County are combined. Loudoun, Clarke, Warren and Fauquier are combined and the ratios are used for
Jefferson, WV. 6 For calculations using ACS data, a worker is defined as anyone in the labor force.
George Mason University Center for Regional Analysis Page 29
We used the 2009-2011 ACS 3-year data and analyzed the current distribution of household types for
each age group and for each jurisdiction. Thus, for each jurisdiction, we assessed the percent of workers
under 30 who live in one-adult households, the percent who live in one-adult, one-child households and
so on. From step 2 above, we know how many workers in each sector are in each age group (under 30,
30-44, and 45-64) for each jurisdiction. We used the distribution of household types by age from the
2009-2011 ACS to assign workers in each sector and age group to a household type. Tables A3-1 through
A3-17 summarize the distribution of household types by age group for each sector.
ii) Calculate the average number of workers per household
We then used the 2009-2011 ACS 3-year data to calculate the average number of workers in each
household. Because this forecast is for net new workers only, this average includes only households with
a worker.
The average number of workers in each of the 11 household types is used to convert workers into
households. This was calculated by dividing the total number of workers assigned to each household
type by the average number of workers in each household type. (See Figure A2 for example.) This step
assumes that workers who live in the same household also work in the same sector and jurisdiction.
Tables A3-1 through A3-17 summarize the average workers per household by household type for each
jurisdiction.
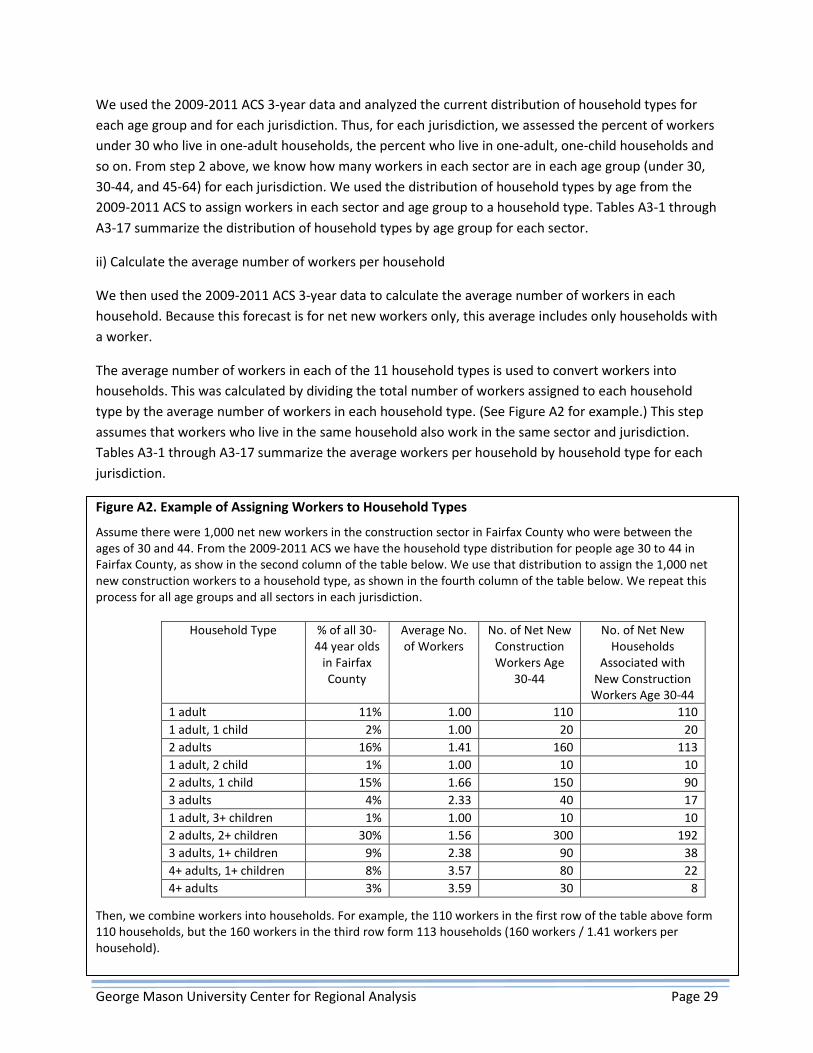
Figure A2. Example of Assigning Workers to Household Types
Assume there were 1,000 net new workers in the construction sector in Fairfax County who were between the
ages of 30 and 44. From the 2009-2011 ACS we have the household type distribution for people age 30 to 44 in
Fairfax County, as show in the second column of the table below. We use that distribution to assign the 1,000 net
new construction workers to a household type, as shown in the fourth column of the table below. We repeat this
process for all age groups and all sectors in each jurisdiction.
Household Type % of all 30-
44 year olds
in Fairfax
County
Average No.
of Workers
No. of Net New
Construction
Workers Age
30-44
No. of Net New
Households
Associated with
New Construction
Workers Age 30-44
1 adult 11% 1.00 110 110
1 adult, 1 child 2% 1.00 20 20
2 adults 16% 1.41 160 113
1 adult, 2 child 1% 1.00 10 10
2 adults, 1 child 15% 1.66 150 90
3 adults 4% 2.33 40 17
1 adult, 3+ children 1% 1.00 10 10
2 adults, 2+ children 30% 1.56 300 192
3 adults, 1+ children 9% 2.38 90 38
4+ adults, 1+ children 8% 3.57 80 22
4+ adults 3% 3.59 30 8
Then, we combine workers into households. For example, the 110 workers in the first row of the table above form
110 households, but the 160 workers in the third row form 113 households (160 workers / 1.41 workers per
household).
George Mason University Center for Regional Analysis Page 30
4. Calculate household income in net new households
Housing demand is driven by housing preferences, which are associated with age and household
composition, but demand is also necessarily related to household income. We calculated median
household incomes for all 11 household types and all industry sectors. Then, we tabulate the total
number of households in each of six income categories: less than $50,000; $50,000 – 74,999; $75,000 –
99,999; $100,000 - 124,999; $125,000 – 149,999; and $150,000 and greater.
We used the 2009-2011 ACS 3-year data to calculate the median wages by industry for each jurisdiction.
Tables A4-1 through A4-17 summarize the median wages by sector for each jurisdiction. Using the
median wage by industry and the average number of workers per household (assuming both are in the
same industry), we calculate the household income for each household type and sector for each
jurisdiction. We then sum up—across sectors—the number of households in each of the six income
categories for each of the ten household types. Thus, we have a count of the numbers of 1 adult
households in each income group, the numbers of 1 adult, 1 child households in each income group, and
so on.
5. Assign each household a unit type by income group
After step 4, we have a count of the number of households by household type and household income
that are associated with net new job growth. Household type and household income are both associated
with the type of housing demand. Therefore, we use these counts to estimate the need for four
different types of housing units in six rent/price categories. The four housing unit types are: single-family
(included single-family detached and townhouse/single-family attached) owner and renter, and multi-
family owner and renter. The six rent/price categories are associated with the six income groups and
represent the maximum rent or home price affordable to households in each income group.
We used the 2009-2011 ACS 3-year data to run crosstabulations of housing type (i.e. four types) by
household composition (i.e. 11 household types) for each of the six income groups. The results of this
analysis show the current distribution of housing types for different household types and household
incomes.
We ran this analysis for the following jurisdictions: Washington, DC, for Arlington and Alexandria
combined, for Fairfax and Montgomery combined, and for Prince William, Loudoun, Spotsylvania, Prince
George’s and Frederick combined. We did not run the analysis for all jurisdictions because the sample
sizes were too small.
We then applied these distributions to the projected households for each jurisdiction to estimate the
need for housing by unit type and rent/price. This step assumes that housing preferences do not change
in the future.
We made assumptions about the affordable price and rent levels for households in each income group.
The maximum affordable rent was set as a percentage of household income. We assumed that rents
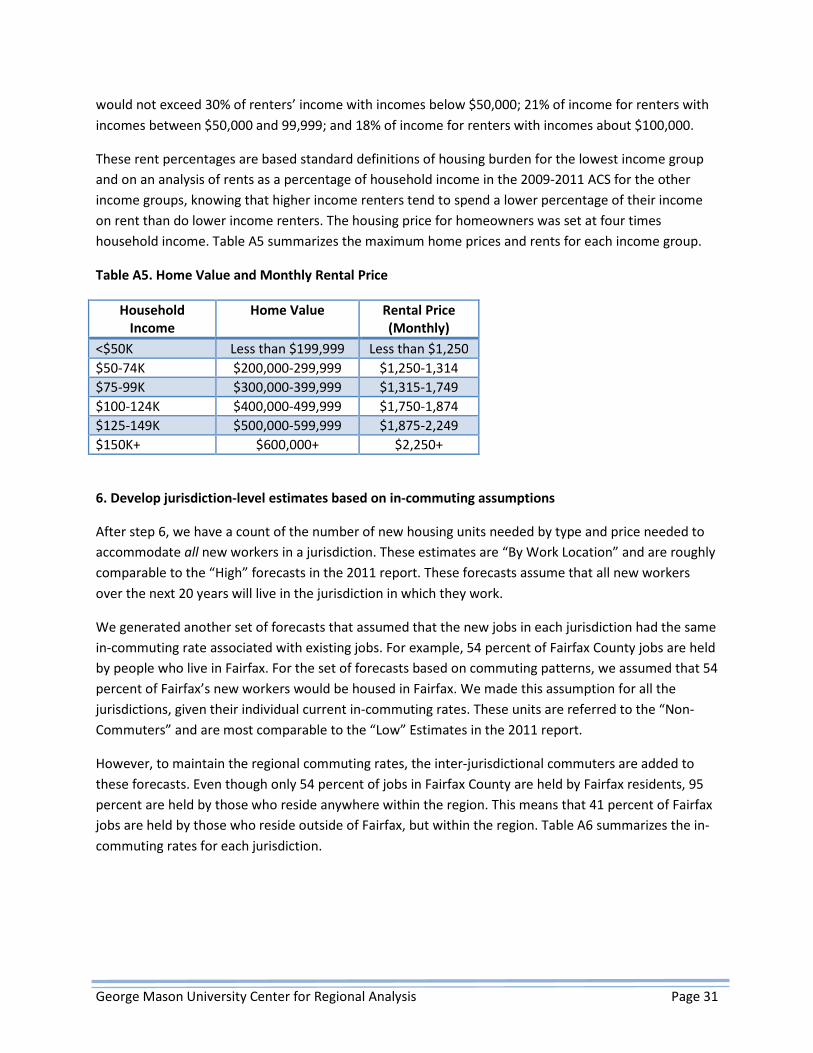
George Mason University Center for Regional Analysis Page 31
would not exceed 30% of renters’ income with incomes below $50,000; 21% of income for renters with
incomes between $50,000 and 99,999; and 18% of income for renters with incomes about $100,000.
These rent percentages are based standard definitions of housing burden for the lowest income group
and on an analysis of rents as a percentage of household income in the 2009-2011 ACS for the other
income groups, knowing that higher income renters tend to spend a lower percentage of their income
on rent than do lower income renters. The housing price for homeowners was set at four times
household income. Table A5 summarizes the maximum home prices and rents for each income group.
Table A5. Home Value and Monthly Rental Price
Household
Income
Home Value Rental Price
(Monthly)
<$50K Less than $199,999 Less than $1,250
$50-74K $200,000-299,999 $1,250-1,314
$75-99K $300,000-399,999 $1,315-1,749
$100-124K $400,000-499,999 $1,750-1,874
$125-149K $500,000-599,999 $1,875-2,249
$150K+ $600,000+ $2,250+
6. Develop jurisdiction-level estimates based on in-commuting assumptions
After step 6, we have a count of the number of new housing units needed by type and price needed to
accommodate all new workers in a jurisdiction. These estimates are “By Work Location” and are roughly
comparable to the “High” forecasts in the 2011 report. These forecasts assume that all new workers
over the next 20 years will live in the jurisdiction in which they work.
We generated another set of forecasts that assumed that the new jobs in each jurisdiction had the same
in-commuting rate associated with existing jobs. For example, 54 percent of Fairfax County jobs are held
by people who live in Fairfax. For the set of forecasts based on commuting patterns, we assumed that 54
percent of Fairfax’s new workers would be housed in Fairfax. We made this assumption for all the
jurisdictions, given their individual current in-commuting rates. These units are referred to the “Non-
Commuters” and are most comparable to the “Low” Estimates in the 2011 report.
However, to maintain the regional commuting rates, the inter-jurisdictional commuters are added to
these forecasts. Even though only 54 percent of jobs in Fairfax County are held by Fairfax residents, 95
percent are held by those who reside anywhere within the region. This means that 41 percent of Fairfax
jobs are held by those who reside outside of Fairfax, but within the region. Table A6 summarizes the in-
commuting rates for each jurisdiction.
George Mason University Center for Regional Analysis Page 32
Study Limitations
The demand for housing depends on many factors. Modeling this housing demand necessarily involves
making several simplifying assumptions. Some of the complexity of housing need will be excluded from
the analysis and some of the limitations of the research are described briefly in this section.
The housing demand forecasts exclude the housing needed to accommodate replacement workers, as
well as other non-paid working households. This analysis excludes the housing needs for replacement
workers resulting from the aging of the current workforce ages and retirement. Some retiring workers
will leave the region, thus freeing up housing units for new or replacement workers. However, many of
the retiring workers will stay in the region. As a result, the housing demand forecasts presented in this
report understate the actual need for housing over the next 20 years.
It is assumed that there are no major shifts in the housing unit preferences of future cohorts or in the
direction of Federal policies related to homeownership. These forecasts are based on data on the
housing characteristics of current residents by age group, household composition and household income
in order to make estimates of future housing needs. This method assumes that there are no major
changes in the housing unit preferences of future cohorts.
In addition, this research makes no assumptions about the direction of Federal policies related to
homeownership which might make owning relatively less attractive or feasible over time. If there are
major changes to the federal mortgage interest deduction or to regulation related to down payment and
other requirements for securing a home mortgage, then homeownership may be less desirable or less
achievable for future workers. Thus, there could be a shift to a need for even more rental housing in the
region.
It is assumed that workers’ housing location choices are related solely to their place of work. The
forecasts by work location were generated to keep current jurisdiction-to-jurisdiction commuting levels
constant over the next 20 years. The means to achieving this goal is to place all workers’ homes in the
jurisdictions in which they work. This is an oversimplification of the decisions people make about where
to live. Many households with multiple workers have work places in different jurisdictions. Workers
have become increasingly more mobile with respect to work, changing jobs more frequently than in the
past. And while telecommuting is still a small part of the labor force, with a very small share of workers
regularly working from home, some workers are not tied to a physical workplace. These housing
demand forecasts are not meant to suggest that people should live in the same jurisdiction in which
they work. Rather, these forecasts provide guidance for the amount of housing that would be required
so that workers have the options for affordable housing closer to where they work. The overall quantity
of housing needed could be redistributed somewhat throughout the region given other factors that
influence housing choice.
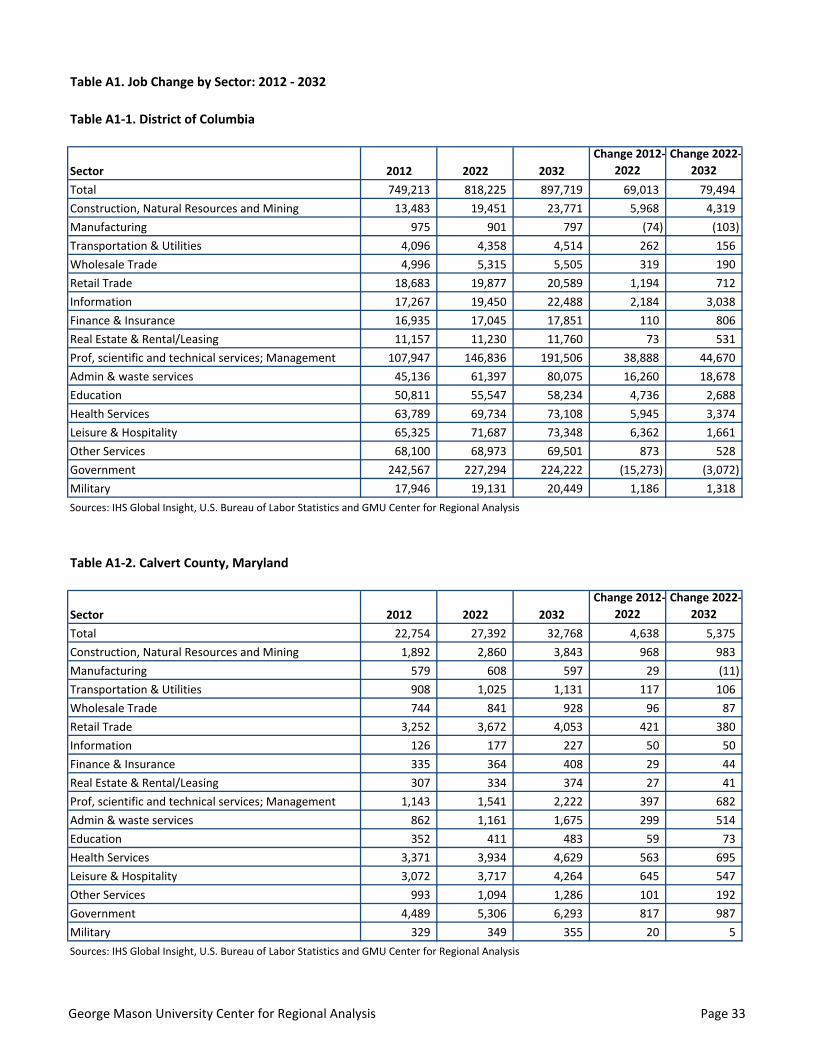
Table A1. Job Change by Sector: 2012 - 2032
Table A1-1. District of Columbia
Sector 2012 2022 2032
Change 2012-
2022
Change 2022-
2032
Total 749,213 818,225 897,719 69,013 79,494
Construction, Natural Resources and Mining 13,483 19,451 23,771 5,968 4,319
Manufacturing 975 901 797 (74) (103)
Transportation & Utilities 4,096 4,358 4,514 262 156
Wholesale Trade 4,996 5,315 5,505 319 190
Retail Trade 18,683 19,877 20,589 1,194 712
Information 17,267 19,450 22,488 2,184 3,038
Finance & Insurance 16,935 17,045 17,851 110 806
Real Estate & Rental/Leasing 11,157 11,230 11,760 73 531
Prof, scientific and technical services; Management 107,947 146,836 191,506 38,888 44,670
Admin & waste services 45,136 61,397 80,075 16,260 18,678
Education 50,811 55,547 58,234 4,736 2,688
Health Services 63,789 69,734 73,108 5,945 3,374
Leisure & Hospitality 65,325 71,687 73,348 6,362 1,661
Other Services 68,100 68,973 69,501 873 528
Government 242,567 227,294 224,222 (15,273) (3,072)
Military 17,946 19,131 20,449 1,186 1,318
Sources: IHS Global Insight, U.S. Bureau of Labor Statistics and GMU Center for Regional Analysis
Table A1-2. Calvert County, Maryland
Sector 2012 2022 2032
Change 2012-
2022
Change 2022-
2032
Total 22,754 27,392 32,768 4,638 5,375
Construction, Natural Resources and Mining 1,892 2,860 3,843 968 983
Manufacturing 579 608 597 29 (11)
Transportation & Utilities 908 1,025 1,131 117 106
Wholesale Trade 744 841 928 96 87
Retail Trade 3,252 3,672 4,053 421 380
Information 126 177 227 50 50
Finance & Insurance 335 364 408 29 44
Real Estate & Rental/Leasing 307 334 374 27 41
Prof, scientific and technical services; Management 1,143 1,541 2,222 397 682
Admin & waste services 862 1,161 1,675 299 514
Education 352 411 483 59 73
Health Services 3,371 3,934 4,629 563 695
Leisure & Hospitality 3,072 3,717 4,264 645 547
Other Services 993 1,094 1,286 101 192
Government 4,489 5,306 6,293 817 987
Military 329 349 355 20 5
Sources: IHS Global Insight, U.S. Bureau of Labor Statistics and GMU Center for Regional Analysis
George Mason University Center for Regional Analysis Page 33
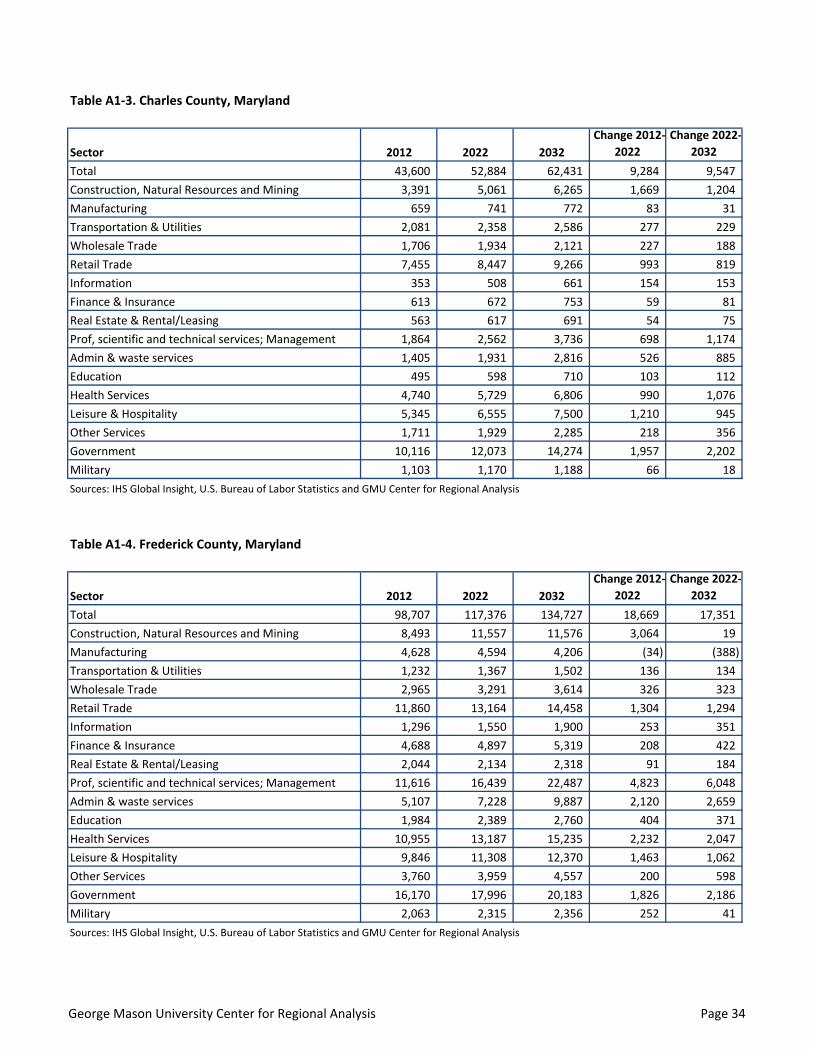
Table A1-3. Charles County, Maryland
Sector 2012 2022 2032
Change 2012-
2022
Change 2022-
2032
Total 43,600 52,884 62,431 9,284 9,547
Construction, Natural Resources and Mining 3,391 5,061 6,265 1,669 1,204
Manufacturing 659 741 772 83 31
Transportation & Utilities 2,081 2,358 2,586 277 229
Wholesale Trade 1,706 1,934 2,121 227 188
Retail Trade 7,455 8,447 9,266 993 819
Information 353 508 661 154 153
Finance & Insurance 613 672 753 59 81
Real Estate & Rental/Leasing 563 617 691 54 75
Prof, scientific and technical services; Management 1,864 2,562 3,736 698 1,174
Admin & waste services 1,405 1,931 2,816 526 885
Education 495 598 710 103 112
Health Services 4,740 5,729 6,806 990 1,076
Leisure & Hospitality 5,345 6,555 7,500 1,210 945
Other Services 1,711 1,929 2,285 218 356
Government 10,116 12,073 14,274 1,957 2,202
Military 1,103 1,170 1,188 66 18
Sources: IHS Global Insight, U.S. Bureau of Labor Statistics and GMU Center for Regional Analysis
Table A1-4. Frederick County, Maryland
Sector 2012 2022 2032
Change 2012-
2022
Change 2022-
2032
Total 98,707 117,376 134,727 18,669 17,351
Construction, Natural Resources and Mining 8,493 11,557 11,576 3,064 19
Manufacturing 4,628 4,594 4,206 (34) (388)
Transportation & Utilities 1,232 1,367 1,502 136 134
Wholesale Trade 2,965 3,291 3,614 326 323
Retail Trade 11,860 13,164 14,458 1,304 1,294
Information 1,296 1,550 1,900 253 351
Finance & Insurance 4,688 4,897 5,319 208 422
Real Estate & Rental/Leasing 2,044 2,134 2,318 91 184
Prof, scientific and technical services; Management 11,616 16,439 22,487 4,823 6,048
Admin & waste services 5,107 7,228 9,887 2,120 2,659
Education 1,984 2,389 2,760 404 371
Health Services 10,955 13,187 15,235 2,232 2,047
Leisure & Hospitality 9,846 11,308 12,370 1,463 1,062
Other Services 3,760 3,959 4,557 200 598
Government 16,170 17,996 20,183 1,826 2,186
Military 2,063 2,315 2,356 252 41
Sources: IHS Global Insight, U.S. Bureau of Labor Statistics and GMU Center for Regional Analysis
George Mason University Center for Regional Analysis Page 34
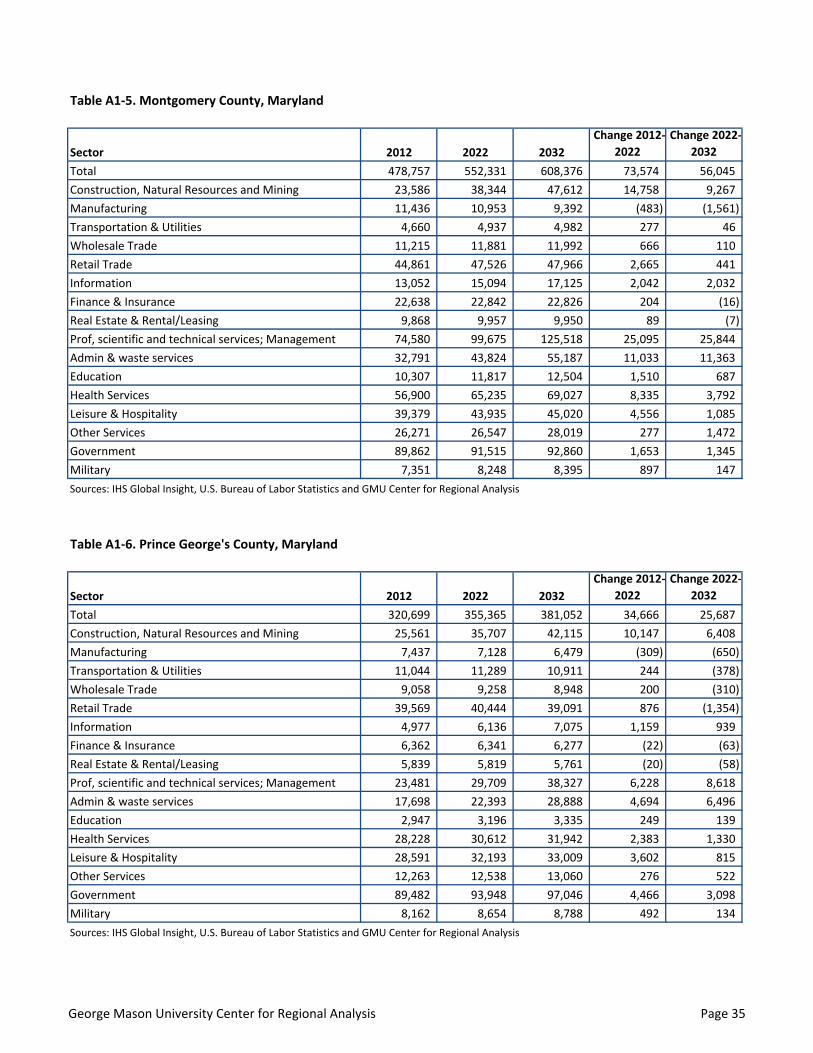
Table A1-5. Montgomery County, Maryland
Sector 2012 2022 2032
Change 2012-
2022
Change 2022-
2032
Total 478,757 552,331 608,376 73,574 56,045
Construction, Natural Resources and Mining 23,586 38,344 47,612 14,758 9,267
Manufacturing 11,436 10,953 9,392 (483) (1,561)
Transportation & Utilities 4,660 4,937 4,982 277 46
Wholesale Trade 11,215 11,881 11,992 666 110
Retail Trade 44,861 47,526 47,966 2,665 441
Information 13,052 15,094 17,125 2,042 2,032
Finance & Insurance 22,638 22,842 22,826 204 (16)
Real Estate & Rental/Leasing 9,868 9,957 9,950 89 (7)
Prof, scientific and technical services; Management 74,580 99,675 125,518 25,095 25,844
Admin & waste services 32,791 43,824 55,187 11,033 11,363
Education 10,307 11,817 12,504 1,510 687
Health Services 56,900 65,235 69,027 8,335 3,792
Leisure & Hospitality 39,379 43,935 45,020 4,556 1,085
Other Services 26,271 26,547 28,019 277 1,472
Government 89,862 91,515 92,860 1,653 1,345
Military 7,351 8,248 8,395 897 147
Sources: IHS Global Insight, U.S. Bureau of Labor Statistics and GMU Center for Regional Analysis
Table A1-6. Prince George's County, Maryland
Sector 2012 2022 2032
Change 2012-
2022
Change 2022-
2032
Total 320,699 355,365 381,052 34,666 25,687
Construction, Natural Resources and Mining 25,561 35,707 42,115 10,147 6,408
Manufacturing 7,437 7,128 6,479 (309) (650)
Transportation & Utilities 11,044 11,289 10,911 244 (378)
Wholesale Trade 9,058 9,258 8,948 200 (310)
Retail Trade 39,569 40,444 39,091 876 (1,354)
Information 4,977 6,136 7,075 1,159 939
Finance & Insurance 6,362 6,341 6,277 (22) (63)
Real Estate & Rental/Leasing 5,839 5,819 5,761 (20) (58)
Prof, scientific and technical services; Management 23,481 29,709 38,327 6,228 8,618
Admin & waste services 17,698 22,393 28,888 4,694 6,496
Education 2,947 3,196 3,335 249 139
Health Services 28,228 30,612 31,942 2,383 1,330
Leisure & Hospitality 28,591 32,193 33,009 3,602 815
Other Services 12,263 12,538 13,060 276 522
Government 89,482 93,948 97,046 4,466 3,098
Military 8,162 8,654 8,788 492 134
Sources: IHS Global Insight, U.S. Bureau of Labor Statistics and GMU Center for Regional Analysis
George Mason University Center for Regional Analysis Page 35
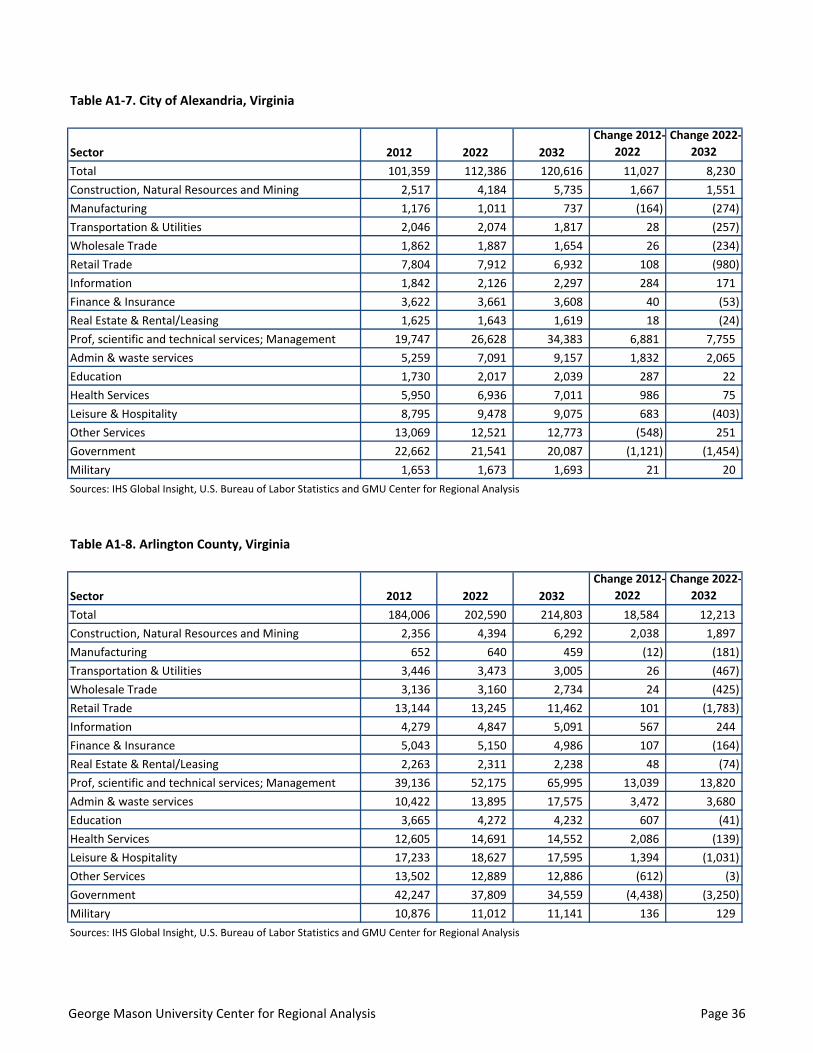
Table A1-7. City of Alexandria, Virginia
Sector 2012 2022 2032
Change 2012-
2022
Change 2022-
2032
Total 101,359 112,386 120,616 11,027 8,230
Construction, Natural Resources and Mining 2,517 4,184 5,735 1,667 1,551
Manufacturing 1,176 1,011 737 (164) (274)
Transportation & Utilities 2,046 2,074 1,817 28 (257)
Wholesale Trade 1,862 1,887 1,654 26 (234)
Retail Trade 7,804 7,912 6,932 108 (980)
Information 1,842 2,126 2,297 284 171
Finance & Insurance 3,622 3,661 3,608 40 (53)
Real Estate & Rental/Leasing 1,625 1,643 1,619 18 (24)
Prof, scientific and technical services; Management 19,747 26,628 34,383 6,881 7,755
Admin & waste services 5,259 7,091 9,157 1,832 2,065
Education 1,730 2,017 2,039 287 22
Health Services 5,950 6,936 7,011 986 75
Leisure & Hospitality 8,795 9,478 9,075 683 (403)
Other Services 13,069 12,521 12,773 (548) 251
Government 22,662 21,541 20,087 (1,121) (1,454)
Military 1,653 1,673 1,693 21 20
Sources: IHS Global Insight, U.S. Bureau of Labor Statistics and GMU Center for Regional Analysis
Table A1-8. Arlington County, Virginia
Sector 2012 2022 2032
Change 2012-
2022
Change 2022-
2032
Total 184,006 202,590 214,803 18,584 12,213
Construction, Natural Resources and Mining 2,356 4,394 6,292 2,038 1,897
Manufacturing 652 640 459 (12) (181)
Transportation & Utilities 3,446 3,473 3,005 26 (467)
Wholesale Trade 3,136 3,160 2,734 24 (425)
Retail Trade 13,144 13,245 11,462 101 (1,783)
Information 4,279 4,847 5,091 567 244
Finance & Insurance 5,043 5,150 4,986 107 (164)
Real Estate & Rental/Leasing 2,263 2,311 2,238 48 (74)
Prof, scientific and technical services; Management 39,136 52,175 65,995 13,039 13,820
Admin & waste services 10,422 13,895 17,575 3,472 3,680
Education 3,665 4,272 4,232 607 (41)
Health Services 12,605 14,691 14,552 2,086 (139)
Leisure & Hospitality 17,233 18,627 17,595 1,394 (1,031)
Other Services 13,502 12,889 12,886 (612) (3)
Government 42,247 37,809 34,559 (4,438) (3,250)
Military 10,876 11,012 11,141 136 129
Sources: IHS Global Insight, U.S. Bureau of Labor Statistics and GMU Center for Regional Analysis
George Mason University Center for Regional Analysis Page 36
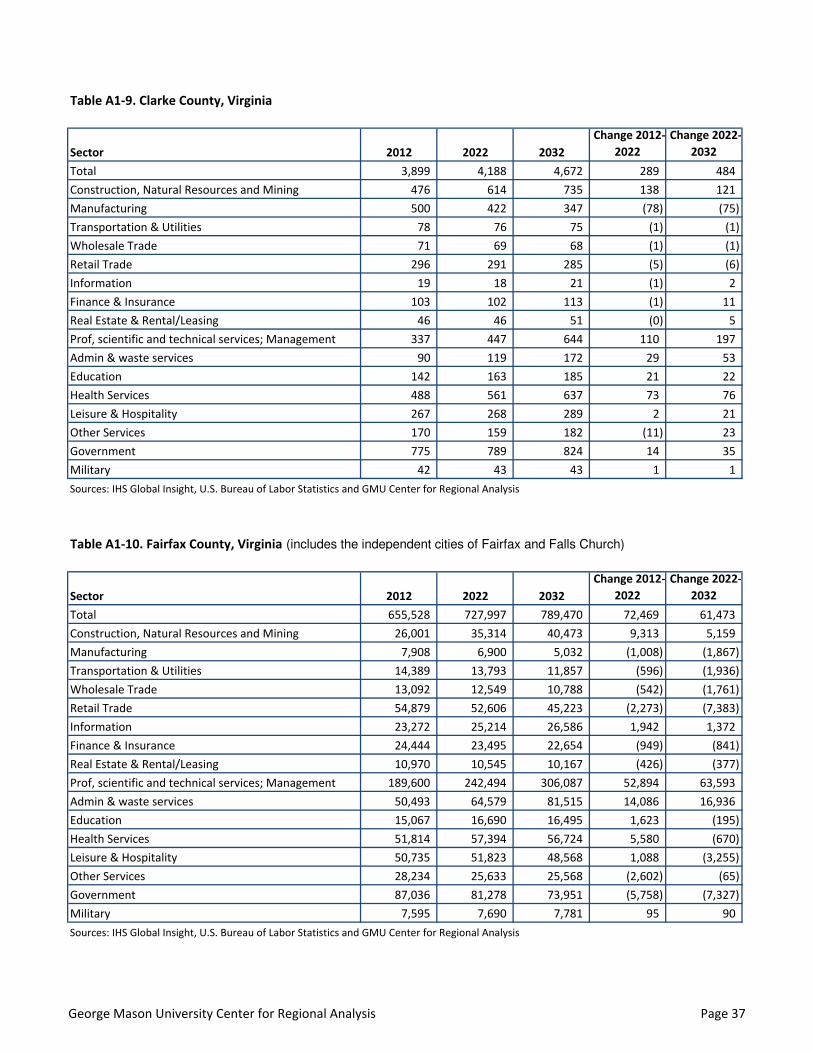
Table A1-9. Clarke County, Virginia
Sector 2012 2022 2032
Change 2012-
2022
Change 2022-
2032
Total 3,899 4,188 4,672 289 484
Construction, Natural Resources and Mining 476 614 735 138 121
Manufacturing 500 422 347 (78) (75)
Transportation & Utilities 78 76 75 (1) (1)
Wholesale Trade 71 69 68 (1) (1)
Retail Trade 296 291 285 (5) (6)
Information 19 18 21 (1) 2
Finance & Insurance 103 102 113 (1) 11
Real Estate & Rental/Leasing 46 46 51 (0) 5
Prof, scientific and technical services; Management 337 447 644 110 197
Admin & waste services 90 119 172 29 53
Education 142 163 185 21 22
Health Services 488 561 637 73 76
Leisure & Hospitality 267 268 289 2 21
Other Services 170 159 182 (11) 23
Government 775 789 824 14 35
Military 42 43 43 1 1
Sources: IHS Global Insight, U.S. Bureau of Labor Statistics and GMU Center for Regional Analysis
Table A1-10. Fairfax County, Virginia (includes the independent cities of Fairfax and Falls Church)
Sector 2012 2022 2032
Change 2012-
2022
Change 2022-
2032
Total 655,528 727,997 789,470 72,469 61,473
Construction, Natural Resources and Mining 26,001 35,314 40,473 9,313 5,159
Manufacturing 7,908 6,900 5,032 (1,008) (1,867)
Transportation & Utilities 14,389 13,793 11,857 (596) (1,936)
Wholesale Trade 13,092 12,549 10,788 (542) (1,761)
Retail Trade 54,879 52,606 45,223 (2,273) (7,383)
Information 23,272 25,214 26,586 1,942 1,372
Finance & Insurance 24,444 23,495 22,654 (949) (841)
Real Estate & Rental/Leasing 10,970 10,545 10,167 (426) (377)
Prof, scientific and technical services; Management 189,600 242,494 306,087 52,894 63,593
Admin & waste services 50,493 64,579 81,515 14,086 16,936
Education 15,067 16,690 16,495 1,623 (195)
Health Services 51,814 57,394 56,724 5,580 (670)
Leisure & Hospitality 50,735 51,823 48,568 1,088 (3,255)
Other Services 28,234 25,633 25,568 (2,602) (65)
Government 87,036 81,278 73,951 (5,758) (7,327)
Military 7,595 7,690 7,781 95 90
Sources: IHS Global Insight, U.S. Bureau of Labor Statistics and GMU Center for Regional Analysis
George Mason University Center for Regional Analysis Page 37
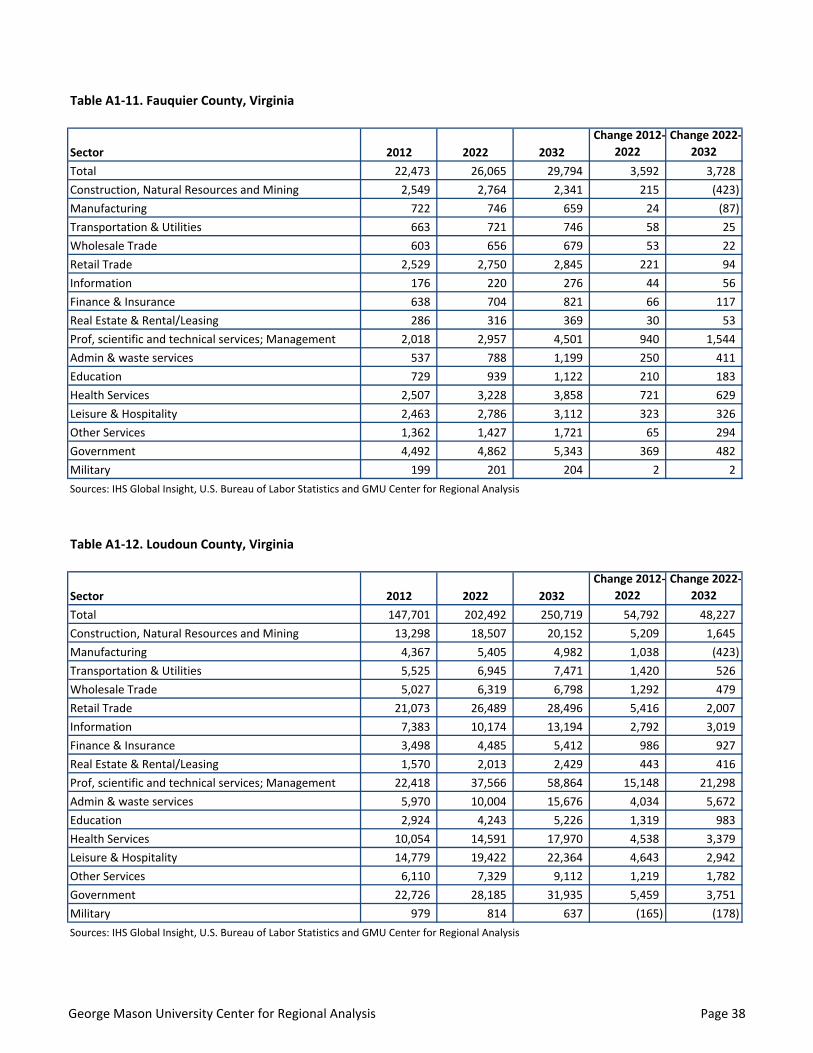
Table A1-11. Fauquier County, Virginia
Sector 2012 2022 2032
Change 2012-
2022
Change 2022-
2032
Total 22,473 26,065 29,794 3,592 3,728
Construction, Natural Resources and Mining 2,549 2,764 2,341 215 (423)
Manufacturing 722 746 659 24 (87)
Transportation & Utilities 663 721 746 58 25
Wholesale Trade 603 656 679 53 22
Retail Trade 2,529 2,750 2,845 221 94
Information 176 220 276 44 56
Finance & Insurance 638 704 821 66 117
Real Estate & Rental/Leasing 286 316 369 30 53
Prof, scientific and technical services; Management 2,018 2,957 4,501 940 1,544
Admin & waste services 537 788 1,199 250 411
Education 729 939 1,122 210 183
Health Services 2,507 3,228 3,858 721 629
Leisure & Hospitality 2,463 2,786 3,112 323 326
Other Services 1,362 1,427 1,721 65 294
Government 4,492 4,862 5,343 369 482
Military 199 201 204 2 2
Sources: IHS Global Insight, U.S. Bureau of Labor Statistics and GMU Center for Regional Analysis
Table A1-12. Loudoun County, Virginia
Sector 2012 2022 2032
Change 2012-
2022
Change 2022-
2032
Total 147,701 202,492 250,719 54,792 48,227
Construction, Natural Resources and Mining 13,298 18,507 20,152 5,209 1,645
Manufacturing 4,367 5,405 4,982 1,038 (423)
Transportation & Utilities 5,525 6,945 7,471 1,420 526
Wholesale Trade 5,027 6,319 6,798 1,292 479
Retail Trade 21,073 26,489 28,496 5,416 2,007
Information 7,383 10,174 13,194 2,792 3,019
Finance & Insurance 3,498 4,485 5,412 986 927
Real Estate & Rental/Leasing 1,570 2,013 2,429 443 416
Prof, scientific and technical services; Management 22,418 37,566 58,864 15,148 21,298
Admin & waste services 5,970 10,004 15,676 4,034 5,672
Education 2,924 4,243 5,226 1,319 983
Health Services 10,054 14,591 17,970 4,538 3,379
Leisure & Hospitality 14,779 19,422 22,364 4,643 2,942
Other Services 6,110 7,329 9,112 1,219 1,782
Government 22,726 28,185 31,935 5,459 3,751
Military 979 814 637 (165) (178)
Sources: IHS Global Insight, U.S. Bureau of Labor Statistics and GMU Center for Regional Analysis
George Mason University Center for Regional Analysis Page 38
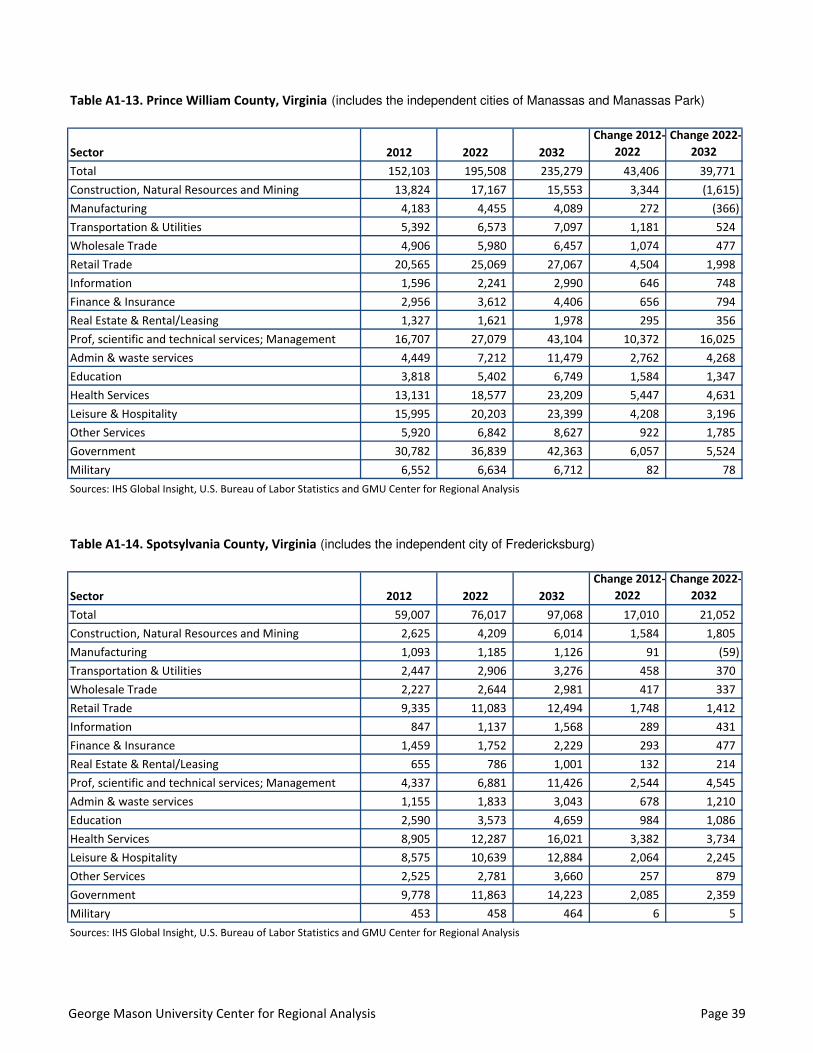
Table A1-13. Prince William County, Virginia (includes the independent cities of Manassas and Manassas Park)
Sector 2012 2022 2032
Change 2012-
2022
Change 2022-
2032
Total 152,103 195,508 235,279 43,406 39,771
Construction, Natural Resources and Mining 13,824 17,167 15,553 3,344 (1,615)
Manufacturing 4,183 4,455 4,089 272 (366)
Transportation & Utilities 5,392 6,573 7,097 1,181 524
Wholesale Trade 4,906 5,980 6,457 1,074 477
Retail Trade 20,565 25,069 27,067 4,504 1,998
Information 1,596 2,241 2,990 646 748
Finance & Insurance 2,956 3,612 4,406 656 794
Real Estate & Rental/Leasing 1,327 1,621 1,978 295 356
Prof, scientific and technical services; Management 16,707 27,079 43,104 10,372 16,025
Admin & waste services 4,449 7,212 11,479 2,762 4,268
Education 3,818 5,402 6,749 1,584 1,347
Health Services 13,131 18,577 23,209 5,447 4,631
Leisure & Hospitality 15,995 20,203 23,399 4,208 3,196
Other Services 5,920 6,842 8,627 922 1,785
Government 30,782 36,839 42,363 6,057 5,524
Military 6,552 6,634 6,712 82 78
Sources: IHS Global Insight, U.S. Bureau of Labor Statistics and GMU Center for Regional Analysis
Table A1-14. Spotsylvania County, Virginia (includes the independent city of Fredericksburg)
Sector 2012 2022 2032
Change 2012-
2022
Change 2022-
2032
Total 59,007 76,017 97,068 17,010 21,052
Construction, Natural Resources and Mining 2,625 4,209 6,014 1,584 1,805
Manufacturing 1,093 1,185 1,126 91 (59)
Transportation & Utilities 2,447 2,906 3,276 458 370
Wholesale Trade 2,227 2,644 2,981 417 337
Retail Trade 9,335 11,083 12,494 1,748 1,412
Information 847 1,137 1,568 289 431
Finance & Insurance 1,459 1,752 2,229 293 477
Real Estate & Rental/Leasing 655 786 1,001 132 214
Prof, scientific and technical services; Management 4,337 6,881 11,426 2,544 4,545
Admin & waste services 1,155 1,833 3,043 678 1,210
Education 2,590 3,573 4,659 984 1,086
Health Services 8,905 12,287 16,021 3,382 3,734
Leisure & Hospitality 8,575 10,639 12,884 2,064 2,245
Other Services 2,525 2,781 3,660 257 879
Government 9,778 11,863 14,223 2,085 2,359
Military 453 458 464 6 5
Sources: IHS Global Insight, U.S. Bureau of Labor Statistics and GMU Center for Regional Analysis
George Mason University Center for Regional Analysis Page 39
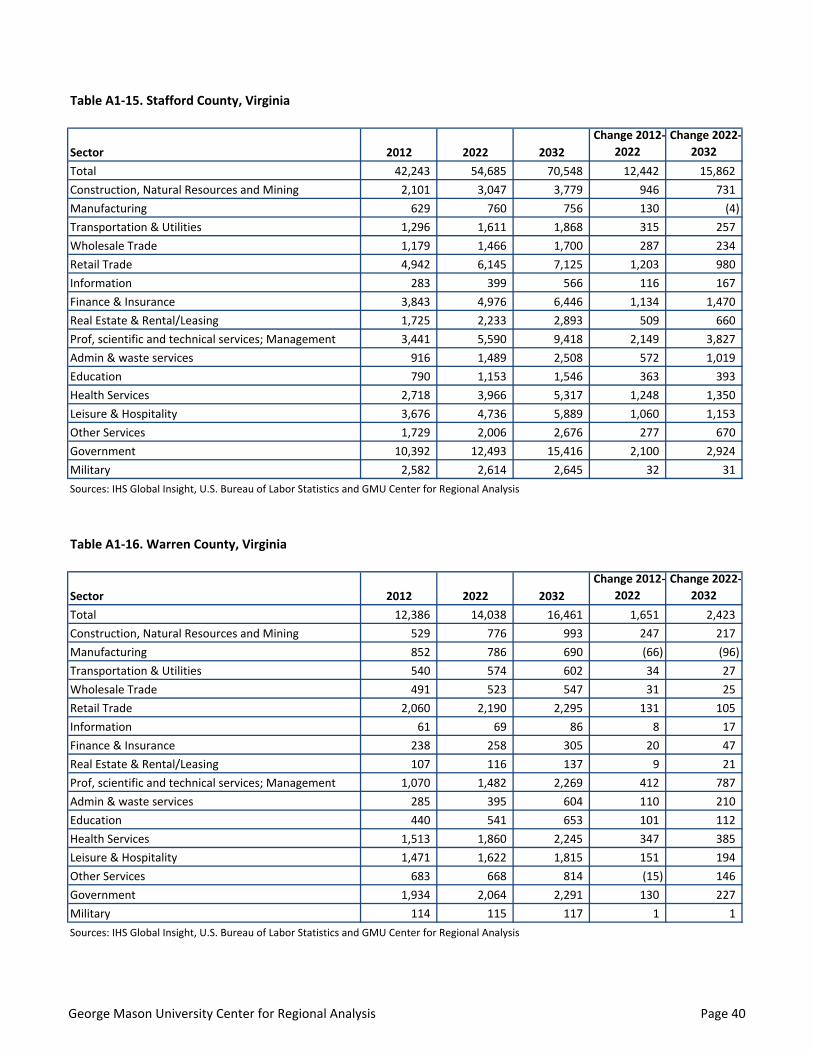
Table A1-15. Stafford County, Virginia
Sector 2012 2022 2032
Change 2012-
2022
Change 2022-
2032
Total 42,243 54,685 70,548 12,442 15,862
Construction, Natural Resources and Mining 2,101 3,047 3,779 946 731
Manufacturing 629 760 756 130 (4)
Transportation & Utilities 1,296 1,611 1,868 315 257
Wholesale Trade 1,179 1,466 1,700 287 234
Retail Trade 4,942 6,145 7,125 1,203 980
Information 283 399 566 116 167
Finance & Insurance 3,843 4,976 6,446 1,134 1,470
Real Estate & Rental/Leasing 1,725 2,233 2,893 509 660
Prof, scientific and technical services; Management 3,441 5,590 9,418 2,149 3,827
Admin & waste services 916 1,489 2,508 572 1,019
Education 790 1,153 1,546 363 393
Health Services 2,718 3,966 5,317 1,248 1,350
Leisure & Hospitality 3,676 4,736 5,889 1,060 1,153
Other Services 1,729 2,006 2,676 277 670
Government 10,392 12,493 15,416 2,100 2,924
Military 2,582 2,614 2,645 32 31
Sources: IHS Global Insight, U.S. Bureau of Labor Statistics and GMU Center for Regional Analysis
Table A1-16. Warren County, Virginia
Sector 2012 2022 2032
Change 2012-
2022
Change 2022-
2032
Total 12,386 14,038 16,461 1,651 2,423
Construction, Natural Resources and Mining 529 776 993 247 217
Manufacturing 852 786 690 (66) (96)
Transportation & Utilities 540 574 602 34 27
Wholesale Trade 491 523 547 31 25
Retail Trade 2,060 2,190 2,295 131 105
Information 61 69 86 8 17
Finance & Insurance 238 258 305 20 47
Real Estate & Rental/Leasing 107 116 137 9 21
Prof, scientific and technical services; Management 1,070 1,482 2,269 412 787
Admin & waste services 285 395 604 110 210
Education 440 541 653 101 112
Health Services 1,513 1,860 2,245 347 385
Leisure & Hospitality 1,471 1,622 1,815 151 194
Other Services 683 668 814 (15) 146
Government 1,934 2,064 2,291 130 227
Military 114 115 117 1 1
Sources: IHS Global Insight, U.S. Bureau of Labor Statistics and GMU Center for Regional Analysis
George Mason University Center for Regional Analysis Page 40
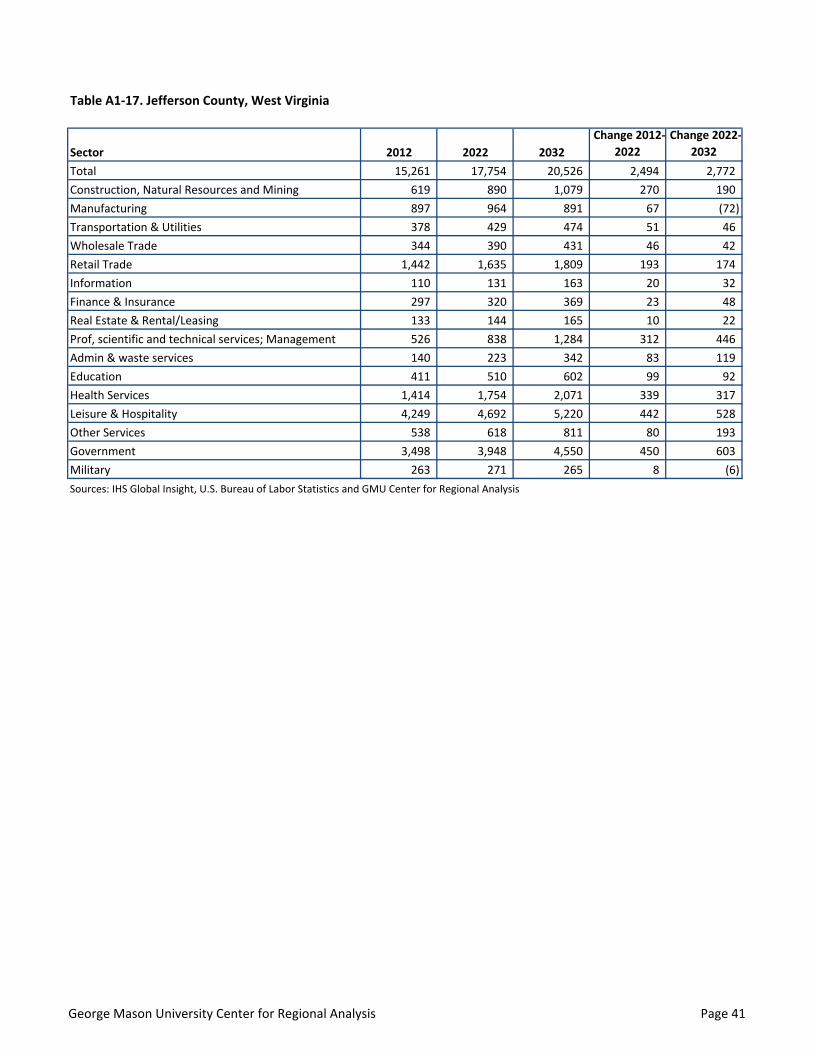
Table A1-17. Jefferson County, West Virginia
Sector 2012 2022 2032
Change 2012-
2022
Change 2022-
2032
Total 15,261 17,754 20,526 2,494 2,772
Construction, Natural Resources and Mining 619 890 1,079 270 190
Manufacturing 897 964 891 67 (72)
Transportation & Utilities 378 429 474 51 46
Wholesale Trade 344 390 431 46 42
Retail Trade 1,442 1,635 1,809 193 174
Information 110 131 163 20 32
Finance & Insurance 297 320 369 23 48
Real Estate & Rental/Leasing 133 144 165 10 22
Prof, scientific and technical services; Management 526 838 1,284 312 446
Admin & waste services 140 223 342 83 119
Education 411 510 602 99 92
Health Services 1,414 1,754 2,071 339 317
Leisure & Hospitality 4,249 4,692 5,220 442 528
Other Services 538 618 811 80 193
Government 3,498 3,948 4,550 450 603
Military 263 271 265 8 (6)
Sources: IHS Global Insight, U.S. Bureau of Labor Statistics and GMU Center for Regional Analysis
George Mason University Center for Regional Analysis Page 41
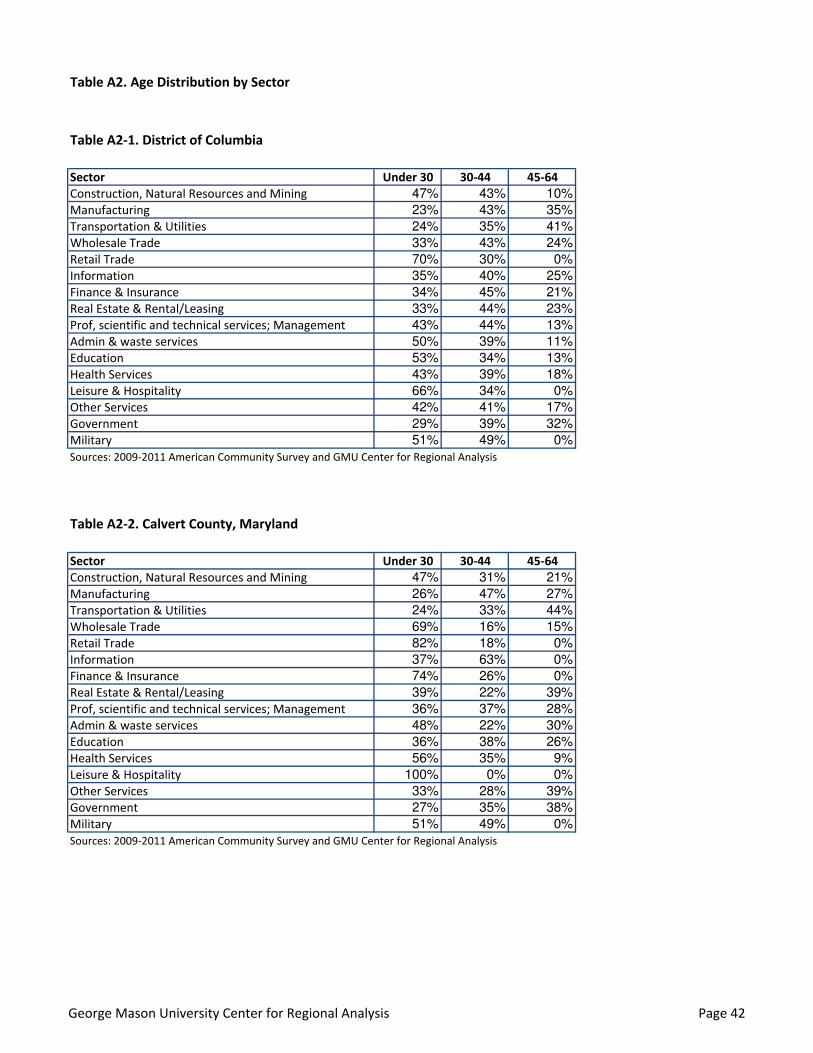
Table A2. Age Distribution by Sector
Table A2-1. District of Columbia
Sector Under 30 30-44 45-64
Construction, Natural Resources and Mining 47% 43% 10%
Manufacturing 23% 43% 35%
Transportation & Utilities 24% 35% 41%
Wholesale Trade 33% 43% 24%
Retail Trade 70% 30% 0%
Information 35% 40% 25%
Finance & Insurance 34% 45% 21%
Real Estate & Rental/Leasing 33% 44% 23%
Prof, scientific and technical services; Management 43% 44% 13%
Admin & waste services 50% 39% 11%
Education 53% 34% 13%
Health Services 43% 39% 18%
Leisure & Hospitality 66% 34% 0%
Other Services 42% 41% 17%
Government 29% 39% 32%
Military 51% 49% 0%
Sources: 2009-2011 American Community Survey and GMU Center for Regional Analysis
Table A2-2. Calvert County, Maryland
Sector Under 30 30-44 45-64
Construction, Natural Resources and Mining 47% 31% 21%
Manufacturing 26% 47% 27%
Transportation & Utilities 24% 33% 44%
Wholesale Trade 69% 16% 15%
Retail Trade 82% 18% 0%
Information 37% 63% 0%
Finance & Insurance 74% 26% 0%
Real Estate & Rental/Leasing 39% 22% 39%
Prof, scientific and technical services; Management 36% 37% 28%
Admin & waste services 48% 22% 30%
Education 36% 38% 26%
Health Services 56% 35% 9%
Leisure & Hospitality 100% 0% 0%
Other Services 33% 28% 39%
Government 27% 35% 38%
Military 51% 49% 0%
Sources: 2009-2011 American Community Survey and GMU Center for Regional Analysis
George Mason University Center for Regional Analysis Page 42
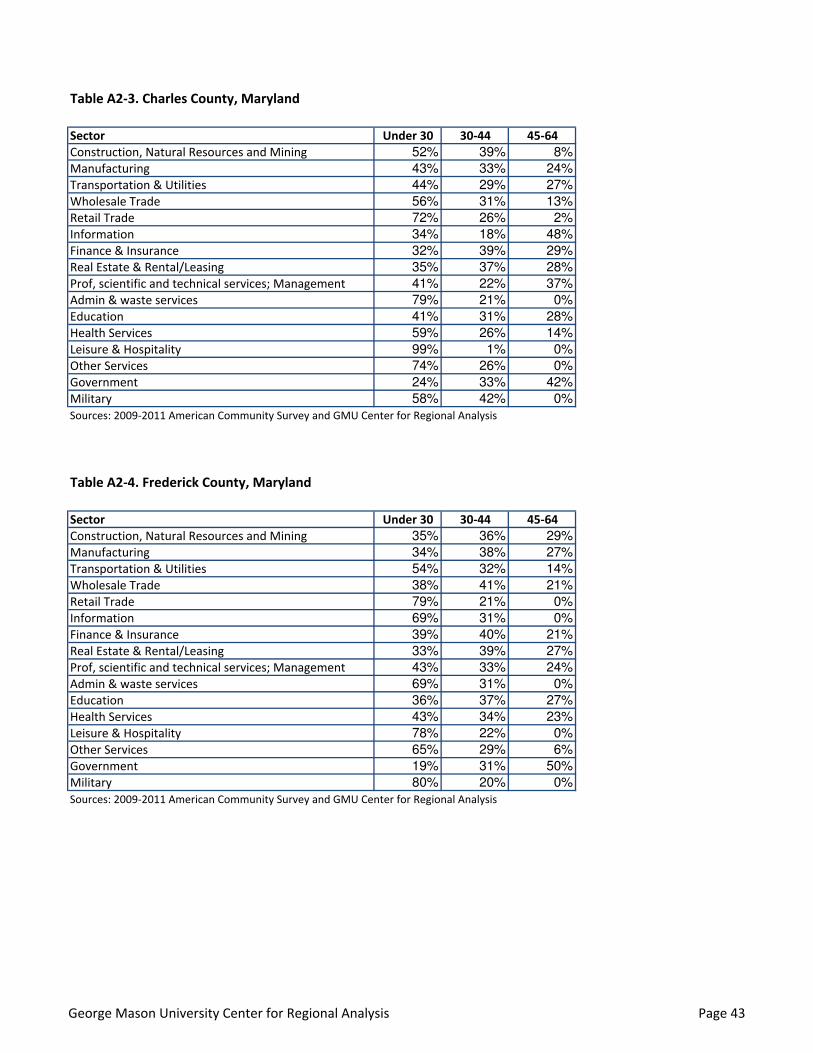
Table A2-3. Charles County, Maryland
Sector Under 30 30-44 45-64
Construction, Natural Resources and Mining 52% 39% 8%
Manufacturing 43% 33% 24%
Transportation & Utilities 44% 29% 27%
Wholesale Trade 56% 31% 13%
Retail Trade 72% 26% 2%
Information 34% 18% 48%
Finance & Insurance 32% 39% 29%
Real Estate & Rental/Leasing 35% 37% 28%
Prof, scientific and technical services; Management 41% 22% 37%
Admin & waste services 79% 21% 0%
Education 41% 31% 28%
Health Services 59% 26% 14%
Leisure & Hospitality 99% 1% 0%
Other Services 74% 26% 0%
Government 24% 33% 42%
Military 58% 42% 0%
Sources: 2009-2011 American Community Survey and GMU Center for Regional Analysis
Table A2-4. Frederick County, Maryland
Sector Under 30 30-44 45-64
Construction, Natural Resources and Mining 35% 36% 29%
Manufacturing 34% 38% 27%
Transportation & Utilities 54% 32% 14%
Wholesale Trade 38% 41% 21%
Retail Trade 79% 21% 0%
Information 69% 31% 0%
Finance & Insurance 39% 40% 21%
Real Estate & Rental/Leasing 33% 39% 27%
Prof, scientific and technical services; Management 43% 33% 24%
Admin & waste services 69% 31% 0%
Education 36% 37% 27%
Health Services 43% 34% 23%
Leisure & Hospitality 78% 22% 0%
Other Services 65% 29% 6%
Government 19% 31% 50%
Military 80% 20% 0%
Sources: 2009-2011 American Community Survey and GMU Center for Regional Analysis
George Mason University Center for Regional Analysis Page 43
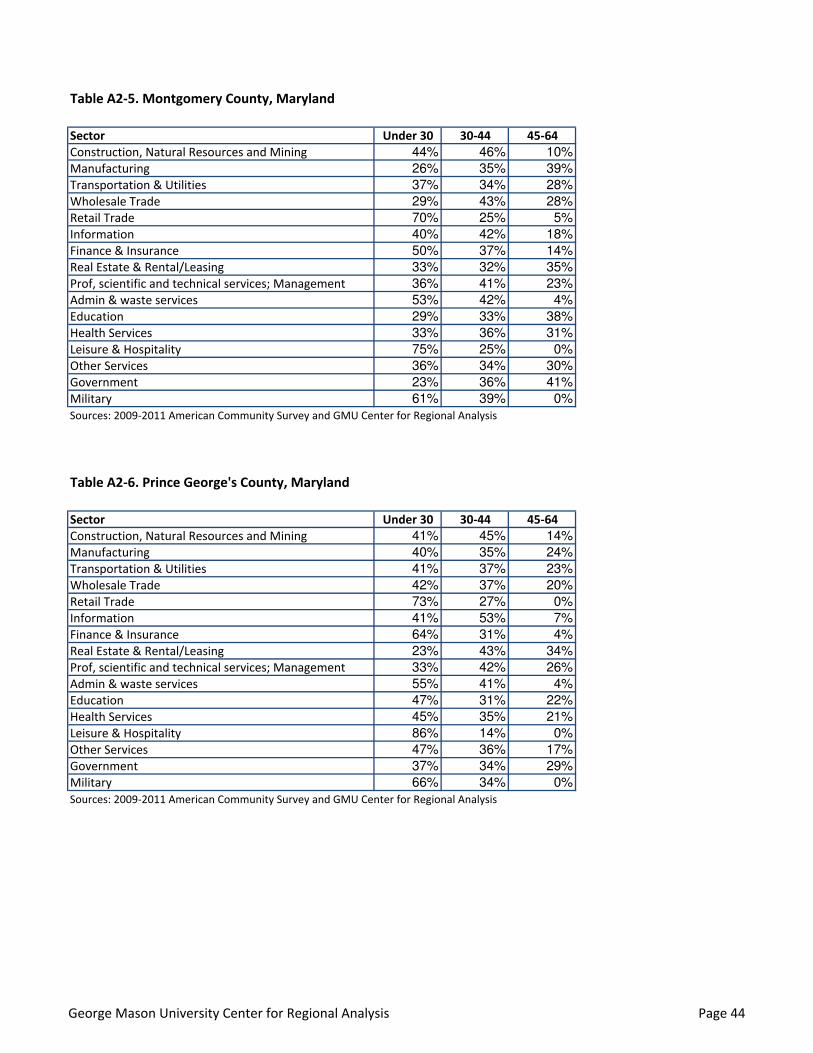
Table A2-5. Montgomery County, Maryland
Sector Under 30 30-44 45-64
Construction, Natural Resources and Mining 44% 46% 10%
Manufacturing 26% 35% 39%
Transportation & Utilities 37% 34% 28%
Wholesale Trade 29% 43% 28%
Retail Trade 70% 25% 5%
Information 40% 42% 18%
Finance & Insurance 50% 37% 14%
Real Estate & Rental/Leasing 33% 32% 35%
Prof, scientific and technical services; Management 36% 41% 23%
Admin & waste services 53% 42% 4%
Education 29% 33% 38%
Health Services 33% 36% 31%
Leisure & Hospitality 75% 25% 0%
Other Services 36% 34% 30%
Government 23% 36% 41%
Military 61% 39% 0%
Sources: 2009-2011 American Community Survey and GMU Center for Regional Analysis
Table A2-6. Prince George's County, Maryland
Sector Under 30 30-44 45-64
Construction, Natural Resources and Mining 41% 45% 14%
Manufacturing 40% 35% 24%
Transportation & Utilities 41% 37% 23%
Wholesale Trade 42% 37% 20%
Retail Trade 73% 27% 0%
Information 41% 53% 7%
Finance & Insurance 64% 31% 4%
Real Estate & Rental/Leasing 23% 43% 34%
Prof, scientific and technical services; Management 33% 42% 26%
Admin & waste services 55% 41% 4%
Education 47% 31% 22%
Health Services 45% 35% 21%
Leisure & Hospitality 86% 14% 0%
Other Services 47% 36% 17%
Government 37% 34% 29%
Military 66% 34% 0%
Sources: 2009-2011 American Community Survey and GMU Center for Regional Analysis
George Mason University Center for Regional Analysis Page 44

Table A2-7. City of Alexandria, Virginia
Sector Under 30 30-44 45-64
Construction, Natural Resources and Mining 38% 48% 14%
Manufacturing 22% 45% 33%
Transportation & Utilities 41% 36% 23%
Wholesale Trade 29% 35% 36%
Retail Trade 58% 41% 1%
Information 59% 41% 0%
Finance & Insurance 22% 44% 34%
Real Estate & Rental/Leasing 44% 40% 17%
Prof, scientific and technical services; Management 43% 37% 20%
Admin & waste services 46% 40% 14%
Education 48% 33% 18%
Health Services 37% 43% 20%
Leisure & Hospitality 65% 35% 0%
Other Services 36% 36% 28%
Government 31% 35% 34%
Military 52% 47% 1%
Sources: 2009-2011 American Community Survey and GMU Center for Regional Analysis
Table A2-8. Arlington County, Virginia
Sector Under 30 30-44 45-64
Construction, Natural Resources and Mining 48% 45% 7%
Manufacturing 23% 34% 42%
Transportation & Utilities 33% 34% 33%
Wholesale Trade 50% 36% 15%
Retail Trade 68% 29% 3%
Information 42% 37% 21%
Finance & Insurance 39% 52% 9%
Real Estate & Rental/Leasing 55% 29% 16%
Prof, scientific and technical services; Management 44% 42% 14%
Admin & waste services 47% 43% 10%
Education 49% 37% 14%
Health Services 42% 47% 11%
Leisure & Hospitality 71% 29% 0%
Other Services 42% 47% 11%
Government 26% 34% 40%
Military 27% 67% 6%
Sources: 2009-2011 American Community Survey and GMU Center for Regional Analysis
George Mason University Center for Regional Analysis Page 45
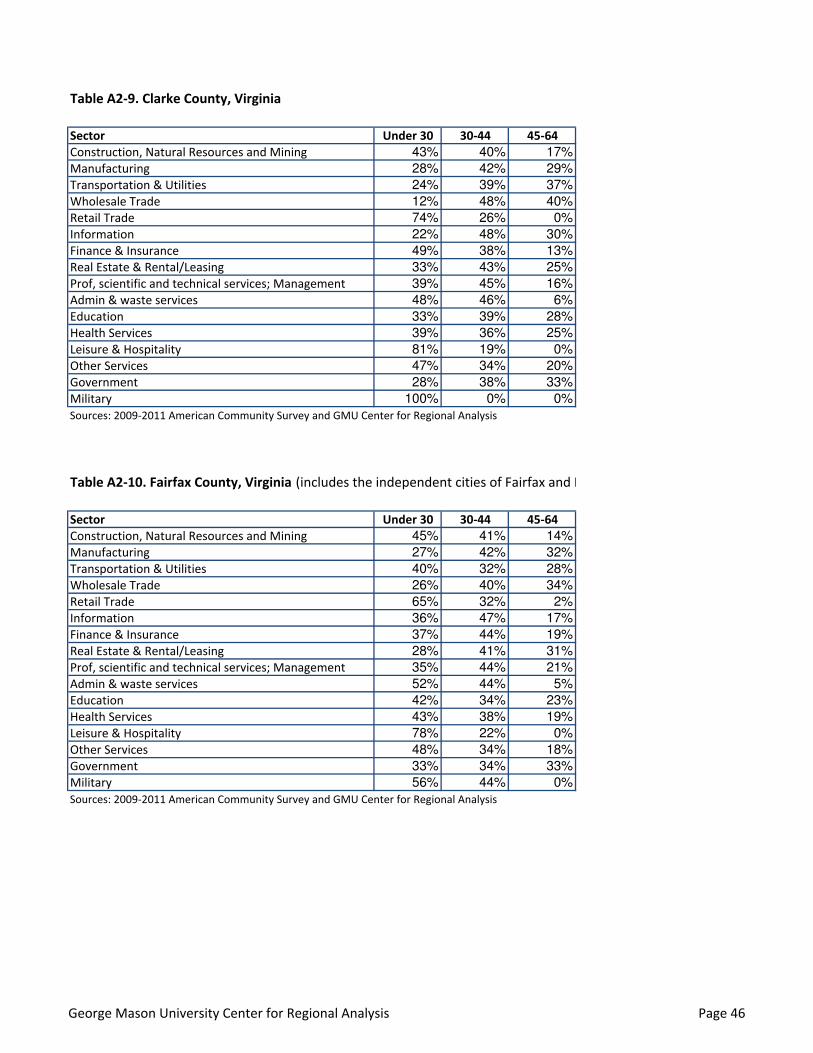
Table A2-9. Clarke County, Virginia
Sector Under 30 30-44 45-64
Construction, Natural Resources and Mining 43% 40% 17%
Manufacturing 28% 42% 29%
Transportation & Utilities 24% 39% 37%
Wholesale Trade 12% 48% 40%
Retail Trade 74% 26% 0%
Information 22% 48% 30%
Finance & Insurance 49% 38% 13%
Real Estate & Rental/Leasing 33% 43% 25%
Prof, scientific and technical services; Management 39% 45% 16%
Admin & waste services 48% 46% 6%
Education 33% 39% 28%
Health Services 39% 36% 25%
Leisure & Hospitality 81% 19% 0%
Other Services 47% 34% 20%
Government 28% 38% 33%
Military 100% 0% 0%
Sources: 2009-2011 American Community Survey and GMU Center for Regional Analysis
Table A2-10. Fairfax County, Virginia (includes the independent cities of Fairfax and Falls Church)
Sector Under 30 30-44 45-64
Construction, Natural Resources and Mining 45% 41% 14%
Manufacturing 27% 42% 32%
Transportation & Utilities 40% 32% 28%
Wholesale Trade 26% 40% 34%
Retail Trade 65% 32% 2%
Information 36% 47% 17%
Finance & Insurance 37% 44% 19%
Real Estate & Rental/Leasing 28% 41% 31%
Prof, scientific and technical services; Management 35% 44% 21%
Admin & waste services 52% 44% 5%
Education 42% 34% 23%
Health Services 43% 38% 19%
Leisure & Hospitality 78% 22% 0%
Other Services 48% 34% 18%
Government 33% 34% 33%
Military 56% 44% 0%
Sources: 2009-2011 American Community Survey and GMU Center for Regional Analysis
George Mason University Center for Regional Analysis Page 46
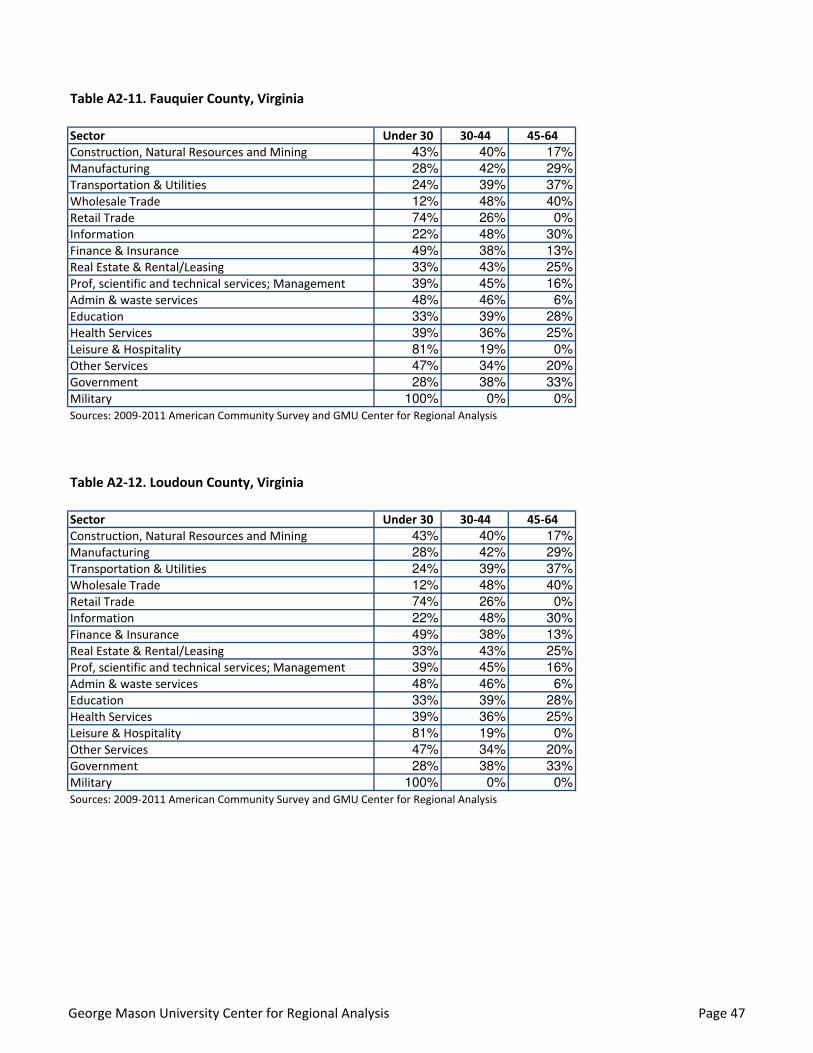
Table A2-11. Fauquier County, Virginia
Sector Under 30 30-44 45-64
Construction, Natural Resources and Mining 43% 40% 17%
Manufacturing 28% 42% 29%
Transportation & Utilities 24% 39% 37%
Wholesale Trade 12% 48% 40%
Retail Trade 74% 26% 0%
Information 22% 48% 30%
Finance & Insurance 49% 38% 13%
Real Estate & Rental/Leasing 33% 43% 25%
Prof, scientific and technical services; Management 39% 45% 16%
Admin & waste services 48% 46% 6%
Education 33% 39% 28%
Health Services 39% 36% 25%
Leisure & Hospitality 81% 19% 0%
Other Services 47% 34% 20%
Government 28% 38% 33%
Military 100% 0% 0%
Sources: 2009-2011 American Community Survey and GMU Center for Regional Analysis
Table A2-12. Loudoun County, Virginia
Sector Under 30 30-44 45-64
Construction, Natural Resources and Mining 43% 40% 17%
Manufacturing 28% 42% 29%
Transportation & Utilities 24% 39% 37%
Wholesale Trade 12% 48% 40%
Retail Trade 74% 26% 0%
Information 22% 48% 30%
Finance & Insurance 49% 38% 13%
Real Estate & Rental/Leasing 33% 43% 25%
Prof, scientific and technical services; Management 39% 45% 16%
Admin & waste services 48% 46% 6%
Education 33% 39% 28%
Health Services 39% 36% 25%
Leisure & Hospitality 81% 19% 0%
Other Services 47% 34% 20%
Government 28% 38% 33%
Military 100% 0% 0%
Sources: 2009-2011 American Community Survey and GMU Center for Regional Analysis
George Mason University Center for Regional Analysis Page 47
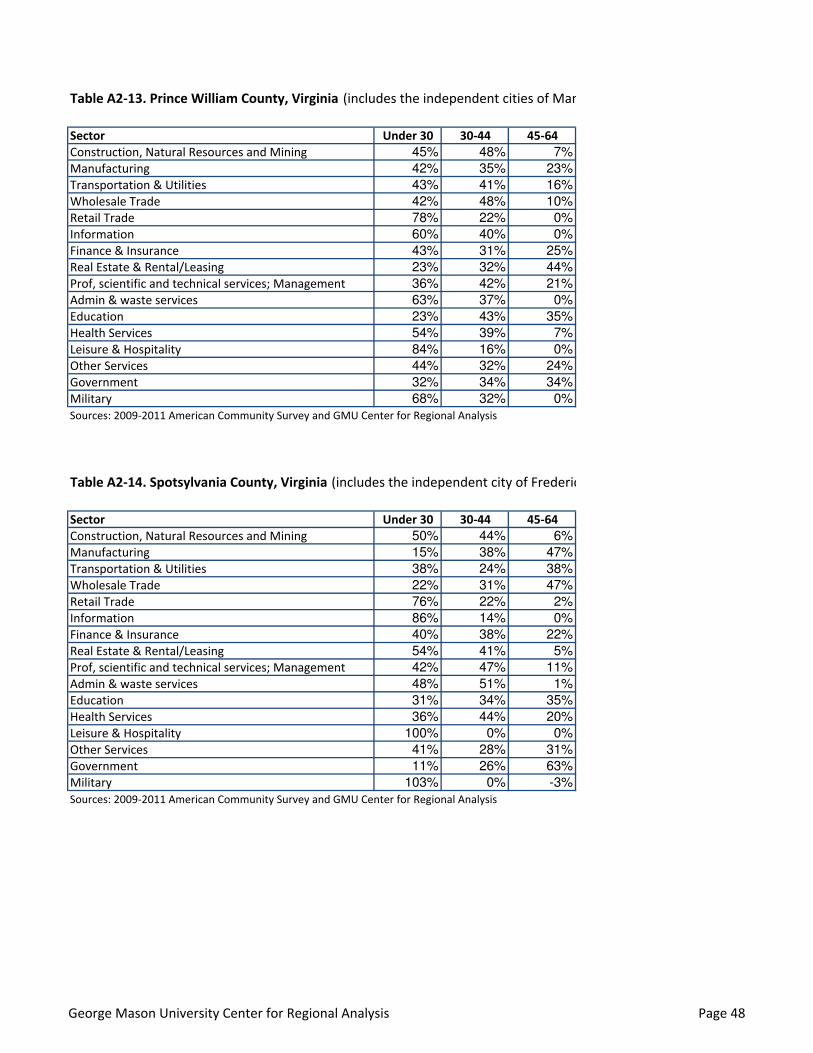
Table A2-13. Prince William County, Virginia (includes the independent cities of Manassas and Manassas Park)
Sector Under 30 30-44 45-64
Construction, Natural Resources and Mining 45% 48% 7%
Manufacturing 42% 35% 23%
Transportation & Utilities 43% 41% 16%
Wholesale Trade 42% 48% 10%
Retail Trade 78% 22% 0%
Information 60% 40% 0%
Finance & Insurance 43% 31% 25%
Real Estate & Rental/Leasing 23% 32% 44%
Prof, scientific and technical services; Management 36% 42% 21%
Admin & waste services 63% 37% 0%
Education 23% 43% 35%
Health Services 54% 39% 7%
Leisure & Hospitality 84% 16% 0%
Other Services 44% 32% 24%
Government 32% 34% 34%
Military 68% 32% 0%
Sources: 2009-2011 American Community Survey and GMU Center for Regional Analysis
Table A2-14. Spotsylvania County, Virginia (includes the independent city of Fredericksburg)
Sector Under 30 30-44 45-64
Construction, Natural Resources and Mining 50% 44% 6%
Manufacturing 15% 38% 47%
Transportation & Utilities 38% 24% 38%
Wholesale Trade 22% 31% 47%
Retail Trade 76% 22% 2%
Information 86% 14% 0%
Finance & Insurance 40% 38% 22%
Real Estate & Rental/Leasing 54% 41% 5%
Prof, scientific and technical services; Management 42% 47% 11%
Admin & waste services 48% 51% 1%
Education 31% 34% 35%
Health Services 36% 44% 20%
Leisure & Hospitality 100% 0% 0%
Other Services 41% 28% 31%
Government 11% 26% 63%
Military 103% 0% -3%
Sources: 2009-2011 American Community Survey and GMU Center for Regional Analysis
George Mason University Center for Regional Analysis Page 48
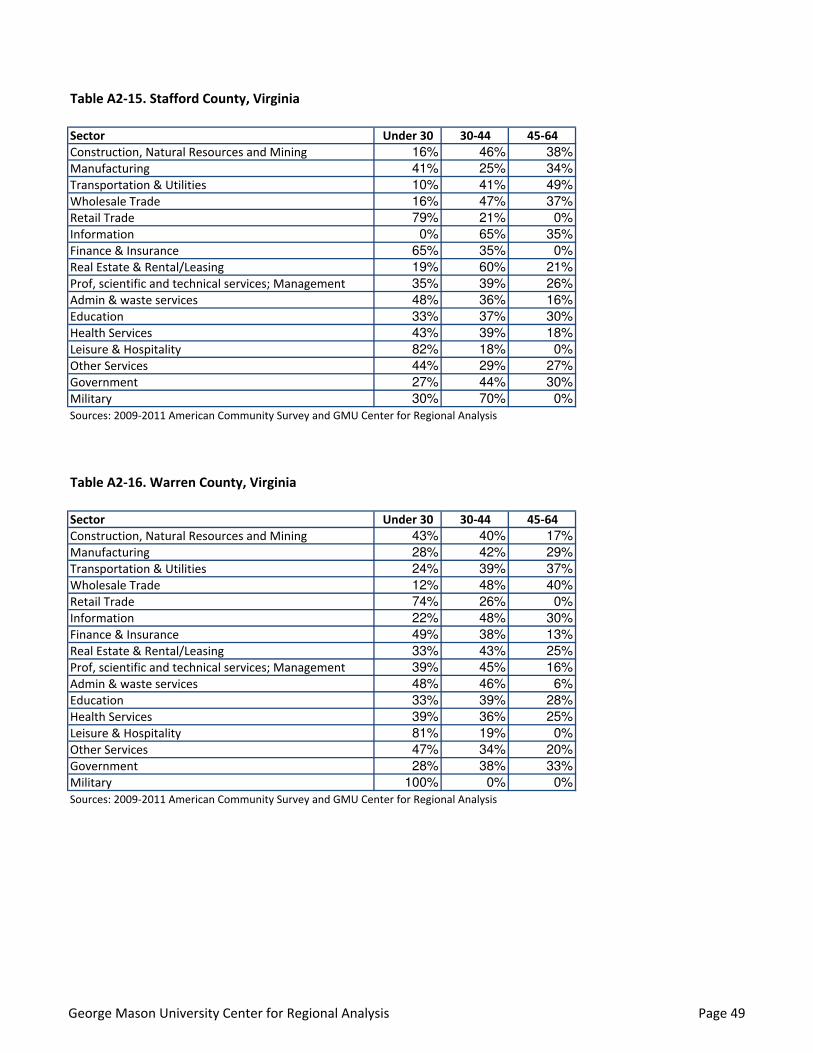
Table A2-15. Stafford County, Virginia
Sector Under 30 30-44 45-64
Construction, Natural Resources and Mining 16% 46% 38%
Manufacturing 41% 25% 34%
Transportation & Utilities 10% 41% 49%
Wholesale Trade 16% 47% 37%
Retail Trade 79% 21% 0%
Information 0% 65% 35%
Finance & Insurance 65% 35% 0%
Real Estate & Rental/Leasing 19% 60% 21%
Prof, scientific and technical services; Management 35% 39% 26%
Admin & waste services 48% 36% 16%
Education 33% 37% 30%
Health Services 43% 39% 18%
Leisure & Hospitality 82% 18% 0%
Other Services 44% 29% 27%
Government 27% 44% 30%
Military 30% 70% 0%
Sources: 2009-2011 American Community Survey and GMU Center for Regional Analysis
Table A2-16. Warren County, Virginia
Sector Under 30 30-44 45-64
Construction, Natural Resources and Mining 43% 40% 17%
Manufacturing 28% 42% 29%
Transportation & Utilities 24% 39% 37%
Wholesale Trade 12% 48% 40%
Retail Trade 74% 26% 0%
Information 22% 48% 30%
Finance & Insurance 49% 38% 13%
Real Estate & Rental/Leasing 33% 43% 25%
Prof, scientific and technical services; Management 39% 45% 16%
Admin & waste services 48% 46% 6%
Education 33% 39% 28%
Health Services 39% 36% 25%
Leisure & Hospitality 81% 19% 0%
Other Services 47% 34% 20%
Government 28% 38% 33%
Military 100% 0% 0%
Sources: 2009-2011 American Community Survey and GMU Center for Regional Analysis
George Mason University Center for Regional Analysis Page 49
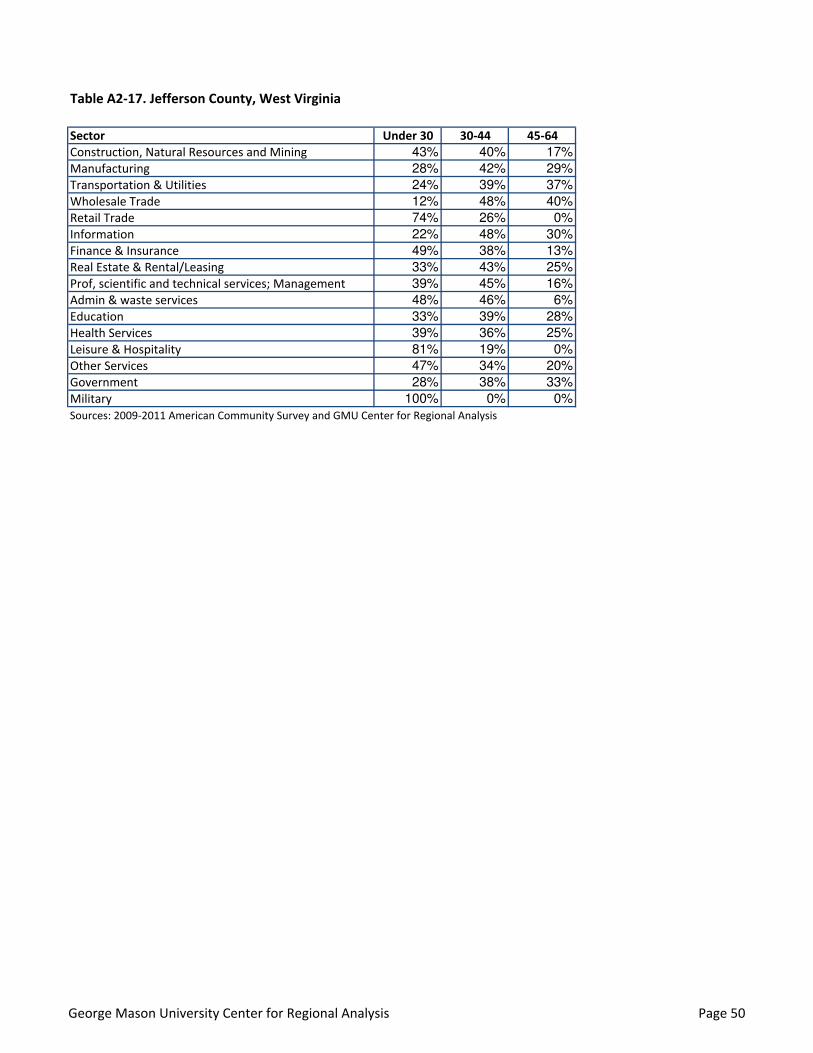
Table A2-17. Jefferson County, West Virginia
Sector Under 30 30-44 45-64
Construction, Natural Resources and Mining 43% 40% 17%
Manufacturing 28% 42% 29%
Transportation & Utilities 24% 39% 37%
Wholesale Trade 12% 48% 40%
Retail Trade 74% 26% 0%
Information 22% 48% 30%
Finance & Insurance 49% 38% 13%
Real Estate & Rental/Leasing 33% 43% 25%
Prof, scientific and technical services; Management 39% 45% 16%
Admin & waste services 48% 46% 6%
Education 33% 39% 28%
Health Services 39% 36% 25%
Leisure & Hospitality 81% 19% 0%
Other Services 47% 34% 20%
Government 28% 38% 33%
Military 100% 0% 0%
Sources: 2009-2011 American Community Survey and GMU Center for Regional Analysis
George Mason University Center for Regional Analysis Page 50
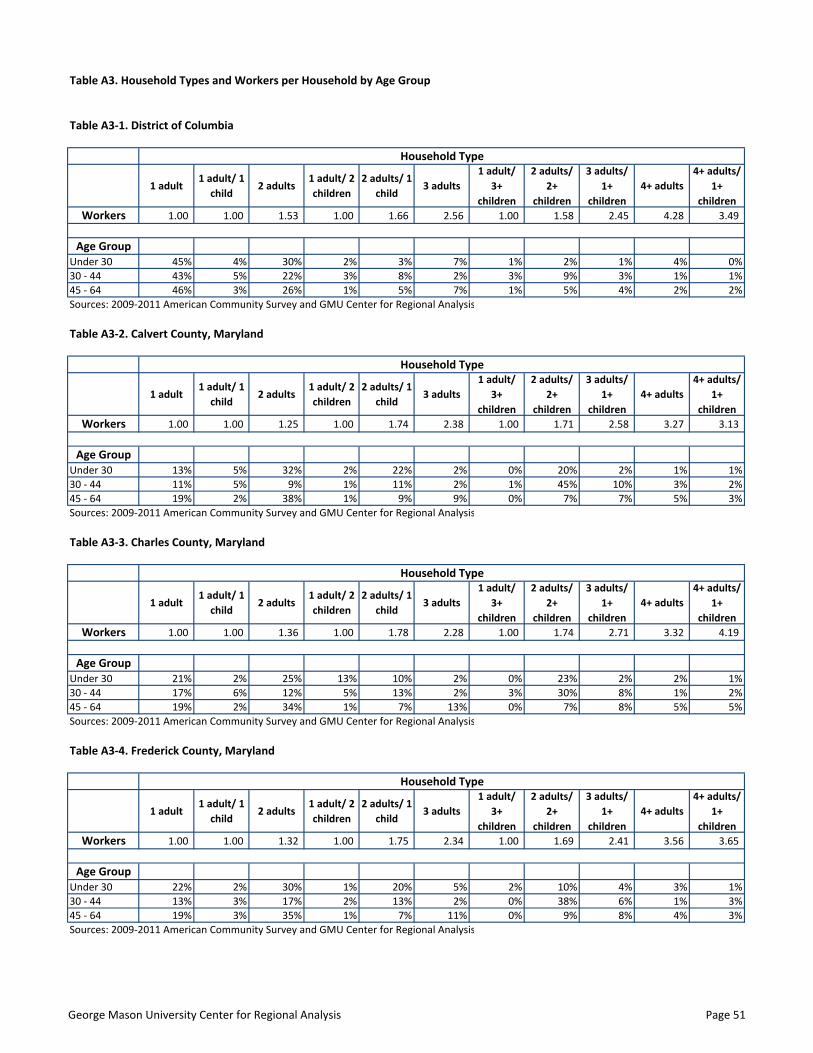
Table A3. Household Types and Workers per Household by Age Group
Table A3-1. District of Columbia
1 adult1 adult/ 1
child2 adults
1 adult/ 2
children
2 adults/ 1
child3 adults
1 adult/
3+
children
2 adults/
2+
children
3 adults/
1+
children
4+ adults
4+ adults/
1+
children
Workers 1.00 1.00 1.53 1.00 1.66 2.56 1.00 1.58 2.45 4.28 3.49
Age Group
Under 30 45% 4% 30% 2% 3% 7% 1% 2% 1% 4% 0%
30 - 44 43% 5% 22% 3% 8% 2% 3% 9% 3% 1% 1%
45 - 64 46% 3% 26% 1% 5% 7% 1% 5% 4% 2% 2%
Sources: 2009-2011 American Community Survey and GMU Center for Regional Analysis
Table A3-2. Calvert County, Maryland
1 adult1 adult/ 1
child2 adults
1 adult/ 2
children
2 adults/ 1
child3 adults
1 adult/
3+
children
2 adults/
2+
children
3 adults/
1+
children
4+ adults
4+ adults/
1+
children
Workers 1.00 1.00 1.25 1.00 1.74 2.38 1.00 1.71 2.58 3.27 3.13
Age Group
Under 30 13% 5% 32% 2% 22% 2% 0% 20% 2% 1% 1%
30 - 44 11% 5% 9% 1% 11% 2% 1% 45% 10% 3% 2%
45 - 64 19% 2% 38% 1% 9% 9% 0% 7% 7% 5% 3%
Sources: 2009-2011 American Community Survey and GMU Center for Regional Analysis
Table A3-3. Charles County, Maryland
1 adult1 adult/ 1
child2 adults
1 adult/ 2
children
2 adults/ 1
child3 adults
1 adult/
3+
children
2 adults/
2+
children
3 adults/
1+
children
4+ adults
4+ adults/
1+
children
Workers 1.00 1.00 1.36 1.00 1.78 2.28 1.00 1.74 2.71 3.32 4.19
Age Group
Under 30 21% 2% 25% 13% 10% 2% 0% 23% 2% 2% 1%
30 - 44 17% 6% 12% 5% 13% 2% 3% 30% 8% 1% 2%
45 - 64 19% 2% 34% 1% 7% 13% 0% 7% 8% 5% 5%
Sources: 2009-2011 American Community Survey and GMU Center for Regional Analysis
Table A3-4. Frederick County, Maryland
1 adult1 adult/ 1
child2 adults
1 adult/ 2
children
2 adults/ 1
child3 adults
1 adult/
3+
children
2 adults/
2+
children
3 adults/
1+
children
4+ adults
4+ adults/
1+
children
Workers 1.00 1.00 1.32 1.00 1.75 2.34 1.00 1.69 2.41 3.56 3.65
Age Group
Under 30 22% 2% 30% 1% 20% 5% 2% 10% 4% 3% 1%
30 - 44 13% 3% 17% 2% 13% 2% 0% 38% 6% 1% 3%
45 - 64 19% 3% 35% 1% 7% 11% 0% 9% 8% 4% 3%
Sources: 2009-2011 American Community Survey and GMU Center for Regional Analysis
Household Type
Household Type
Household Type
Household Type
George Mason University Center for Regional Analysis Page 51
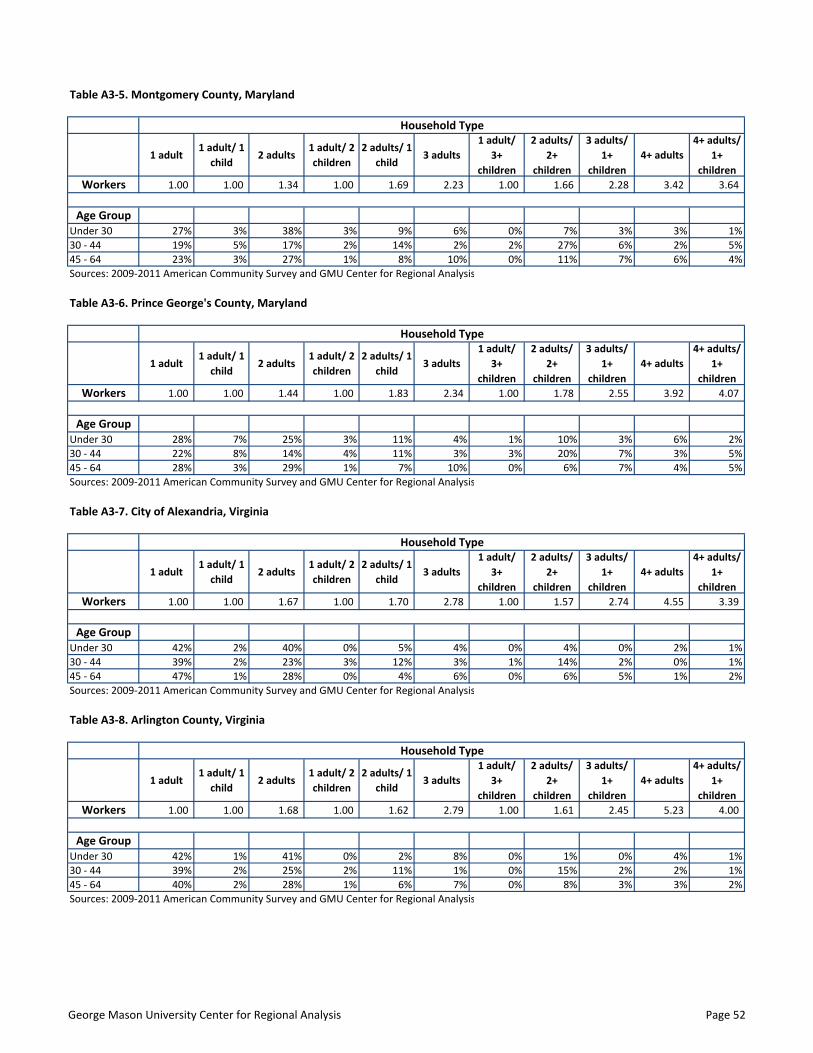
Table A3-5. Montgomery County, Maryland
1 adult1 adult/ 1
child2 adults
1 adult/ 2
children
2 adults/ 1
child3 adults
1 adult/
3+
children
2 adults/
2+
children
3 adults/
1+
children
4+ adults
4+ adults/
1+
children
Workers 1.00 1.00 1.34 1.00 1.69 2.23 1.00 1.66 2.28 3.42 3.64
Age Group
Under 30 27% 3% 38% 3% 9% 6% 0% 7% 3% 3% 1%
30 - 44 19% 5% 17% 2% 14% 2% 2% 27% 6% 2% 5%
45 - 64 23% 3% 27% 1% 8% 10% 0% 11% 7% 6% 4%
Sources: 2009-2011 American Community Survey and GMU Center for Regional Analysis
Table A3-6. Prince George's County, Maryland
1 adult1 adult/ 1
child2 adults
1 adult/ 2
children
2 adults/ 1
child3 adults
1 adult/
3+
children
2 adults/
2+
children
3 adults/
1+
children
4+ adults
4+ adults/
1+
children
Workers 1.00 1.00 1.44 1.00 1.83 2.34 1.00 1.78 2.55 3.92 4.07
Age Group
Under 30 28% 7% 25% 3% 11% 4% 1% 10% 3% 6% 2%
30 - 44 22% 8% 14% 4% 11% 3% 3% 20% 7% 3% 5%
45 - 64 28% 3% 29% 1% 7% 10% 0% 6% 7% 4% 5%
Sources: 2009-2011 American Community Survey and GMU Center for Regional Analysis
Table A3-7. City of Alexandria, Virginia
1 adult1 adult/ 1
child2 adults
1 adult/ 2
children
2 adults/ 1
child3 adults
1 adult/
3+
children
2 adults/
2+
children
3 adults/
1+
children
4+ adults
4+ adults/
1+
children
Workers 1.00 1.00 1.67 1.00 1.70 2.78 1.00 1.57 2.74 4.55 3.39
Age Group
Under 30 42% 2% 40% 0% 5% 4% 0% 4% 0% 2% 1%
30 - 44 39% 2% 23% 3% 12% 3% 1% 14% 2% 0% 1%
45 - 64 47% 1% 28% 0% 4% 6% 0% 6% 5% 1% 2%
Sources: 2009-2011 American Community Survey and GMU Center for Regional Analysis
Table A3-8. Arlington County, Virginia
1 adult1 adult/ 1
child2 adults
1 adult/ 2
children
2 adults/ 1
child3 adults
1 adult/
3+
children
2 adults/
2+
children
3 adults/
1+
children
4+ adults
4+ adults/
1+
children
Workers 1.00 1.00 1.68 1.00 1.62 2.79 1.00 1.61 2.45 5.23 4.00
Age Group
Under 30 42% 1% 41% 0% 2% 8% 0% 1% 0% 4% 1%
30 - 44 39% 2% 25% 2% 11% 1% 0% 15% 2% 2% 1%
45 - 64 40% 2% 28% 1% 6% 7% 0% 8% 3% 3% 2%
Sources: 2009-2011 American Community Survey and GMU Center for Regional Analysis
Household Type
Household Type
Household Type
Household Type
George Mason University Center for Regional Analysis Page 52
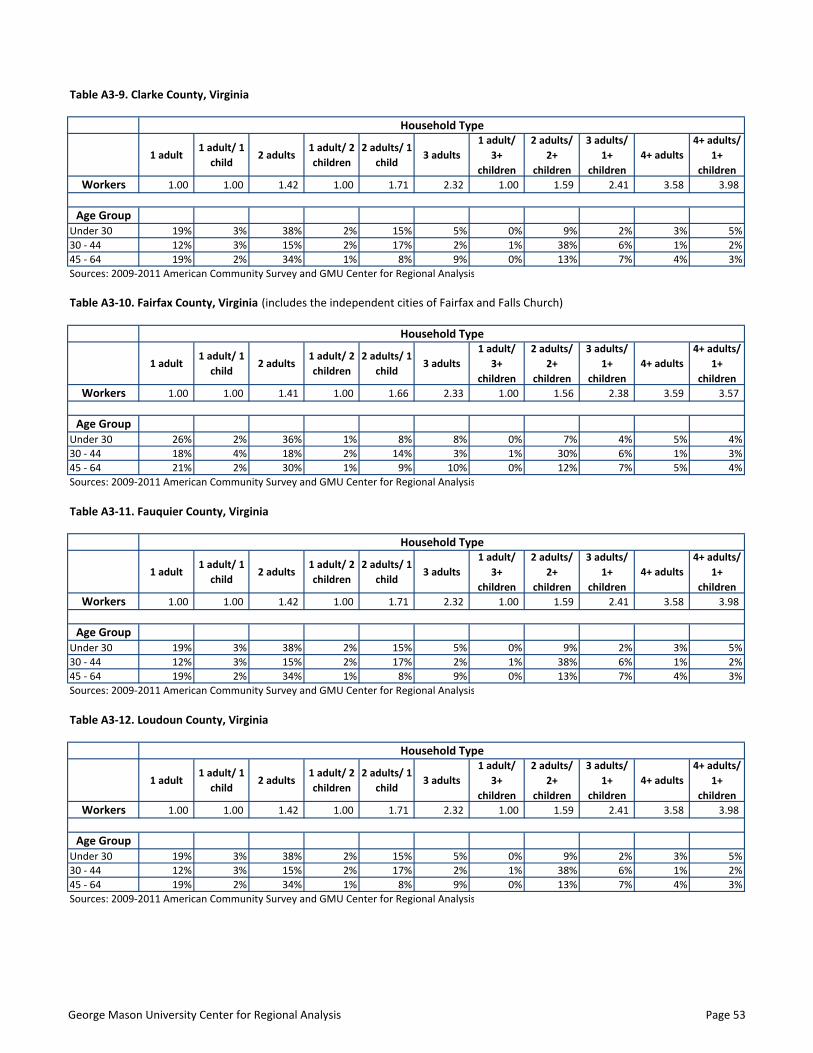
Table A3-9. Clarke County, Virginia
1 adult1 adult/ 1
child2 adults
1 adult/ 2
children
2 adults/ 1
child3 adults
1 adult/
3+
children
2 adults/
2+
children
3 adults/
1+
children
4+ adults
4+ adults/
1+
children
Workers 1.00 1.00 1.42 1.00 1.71 2.32 1.00 1.59 2.41 3.58 3.98
Age Group
Under 30 19% 3% 38% 2% 15% 5% 0% 9% 2% 3% 5%
30 - 44 12% 3% 15% 2% 17% 2% 1% 38% 6% 1% 2%
45 - 64 19% 2% 34% 1% 8% 9% 0% 13% 7% 4% 3%
Sources: 2009-2011 American Community Survey and GMU Center for Regional Analysis
Table A3-10. Fairfax County, Virginia (includes the independent cities of Fairfax and Falls Church)
1 adult1 adult/ 1
child2 adults
1 adult/ 2
children
2 adults/ 1
child3 adults
1 adult/
3+
children
2 adults/
2+
children
3 adults/
1+
children
4+ adults
4+ adults/
1+
children
Workers 1.00 1.00 1.41 1.00 1.66 2.33 1.00 1.56 2.38 3.59 3.57
Age Group
Under 30 26% 2% 36% 1% 8% 8% 0% 7% 4% 5% 4%
30 - 44 18% 4% 18% 2% 14% 3% 1% 30% 6% 1% 3%
45 - 64 21% 2% 30% 1% 9% 10% 0% 12% 7% 5% 4%
Sources: 2009-2011 American Community Survey and GMU Center for Regional Analysis
Table A3-11. Fauquier County, Virginia
1 adult1 adult/ 1
child2 adults
1 adult/ 2
children
2 adults/ 1
child3 adults
1 adult/
3+
children
2 adults/
2+
children
3 adults/
1+
children
4+ adults
4+ adults/
1+
children
Workers 1.00 1.00 1.42 1.00 1.71 2.32 1.00 1.59 2.41 3.58 3.98
Age Group
Under 30 19% 3% 38% 2% 15% 5% 0% 9% 2% 3% 5%
30 - 44 12% 3% 15% 2% 17% 2% 1% 38% 6% 1% 2%
45 - 64 19% 2% 34% 1% 8% 9% 0% 13% 7% 4% 3%
Sources: 2009-2011 American Community Survey and GMU Center for Regional Analysis
Table A3-12. Loudoun County, Virginia
1 adult1 adult/ 1
child2 adults
1 adult/ 2
children
2 adults/ 1
child3 adults
1 adult/
3+
children
2 adults/
2+
children
3 adults/
1+
children
4+ adults
4+ adults/
1+
children
Workers 1.00 1.00 1.42 1.00 1.71 2.32 1.00 1.59 2.41 3.58 3.98
Age Group
Under 30 19% 3% 38% 2% 15% 5% 0% 9% 2% 3% 5%
30 - 44 12% 3% 15% 2% 17% 2% 1% 38% 6% 1% 2%
45 - 64 19% 2% 34% 1% 8% 9% 0% 13% 7% 4% 3%
Sources: 2009-2011 American Community Survey and GMU Center for Regional Analysis
Household Type
Household Type
Household Type
Household Type
George Mason University Center for Regional Analysis Page 53
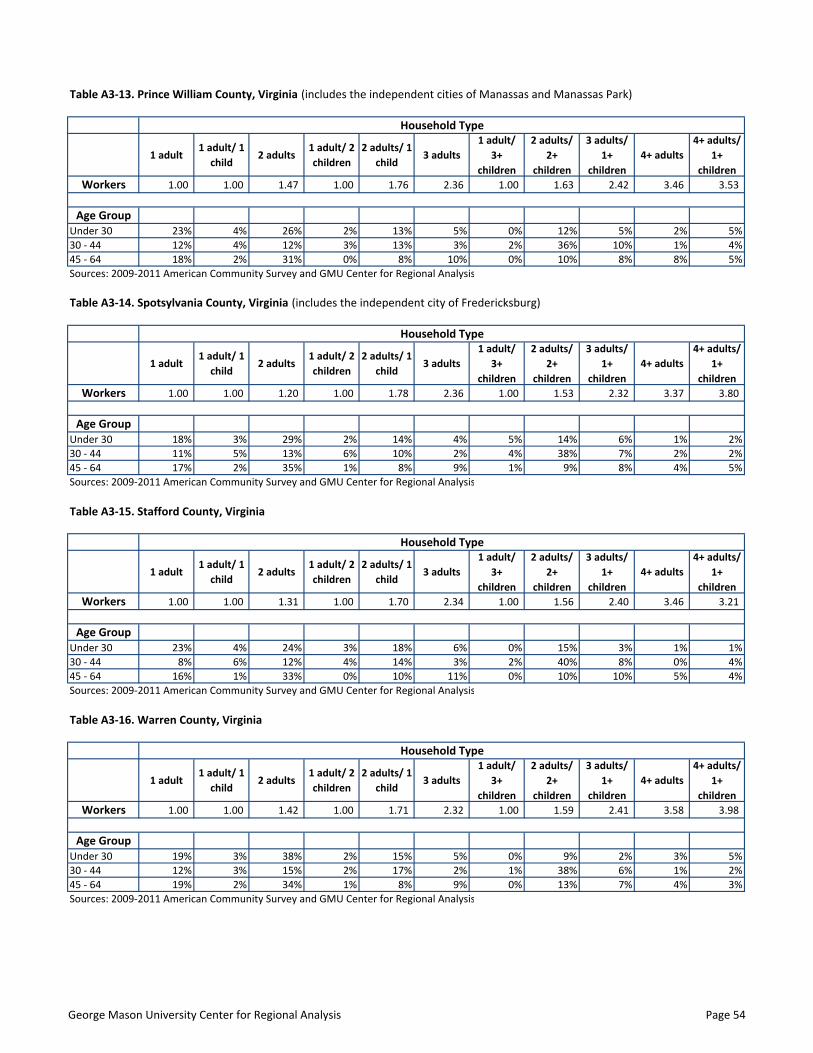
Table A3-13. Prince William County, Virginia (includes the independent cities of Manassas and Manassas Park)
1 adult1 adult/ 1
child2 adults
1 adult/ 2
children
2 adults/ 1
child3 adults
1 adult/
3+
children
2 adults/
2+
children
3 adults/
1+
children
4+ adults
4+ adults/
1+
children
Workers 1.00 1.00 1.47 1.00 1.76 2.36 1.00 1.63 2.42 3.46 3.53
Age Group
Under 30 23% 4% 26% 2% 13% 5% 0% 12% 5% 2% 5%
30 - 44 12% 4% 12% 3% 13% 3% 2% 36% 10% 1% 4%
45 - 64 18% 2% 31% 0% 8% 10% 0% 10% 8% 8% 5%
Sources: 2009-2011 American Community Survey and GMU Center for Regional Analysis
Table A3-14. Spotsylvania County, Virginia (includes the independent city of Fredericksburg)
1 adult1 adult/ 1
child2 adults
1 adult/ 2
children
2 adults/ 1
child3 adults
1 adult/
3+
children
2 adults/
2+
children
3 adults/
1+
children
4+ adults
4+ adults/
1+
children
Workers 1.00 1.00 1.20 1.00 1.78 2.36 1.00 1.53 2.32 3.37 3.80
Age Group
Under 30 18% 3% 29% 2% 14% 4% 5% 14% 6% 1% 2%
30 - 44 11% 5% 13% 6% 10% 2% 4% 38% 7% 2% 2%
45 - 64 17% 2% 35% 1% 8% 9% 1% 9% 8% 4% 5%
Sources: 2009-2011 American Community Survey and GMU Center for Regional Analysis
Table A3-15. Stafford County, Virginia
1 adult1 adult/ 1
child2 adults
1 adult/ 2
children
2 adults/ 1
child3 adults
1 adult/
3+
children
2 adults/
2+
children
3 adults/
1+
children
4+ adults
4+ adults/
1+
children
Workers 1.00 1.00 1.31 1.00 1.70 2.34 1.00 1.56 2.40 3.46 3.21
Age Group
Under 30 23% 4% 24% 3% 18% 6% 0% 15% 3% 1% 1%
30 - 44 8% 6% 12% 4% 14% 3% 2% 40% 8% 0% 4%
45 - 64 16% 1% 33% 0% 10% 11% 0% 10% 10% 5% 4%
Sources: 2009-2011 American Community Survey and GMU Center for Regional Analysis
Table A3-16. Warren County, Virginia
1 adult1 adult/ 1
child2 adults
1 adult/ 2
children
2 adults/ 1
child3 adults
1 adult/
3+
children
2 adults/
2+
children
3 adults/
1+
children
4+ adults
4+ adults/
1+
children
Workers 1.00 1.00 1.42 1.00 1.71 2.32 1.00 1.59 2.41 3.58 3.98
Age Group
Under 30 19% 3% 38% 2% 15% 5% 0% 9% 2% 3% 5%
30 - 44 12% 3% 15% 2% 17% 2% 1% 38% 6% 1% 2%
45 - 64 19% 2% 34% 1% 8% 9% 0% 13% 7% 4% 3%
Sources: 2009-2011 American Community Survey and GMU Center for Regional Analysis
Household Type
Household Type
Household Type
Household Type
George Mason University Center for Regional Analysis Page 54
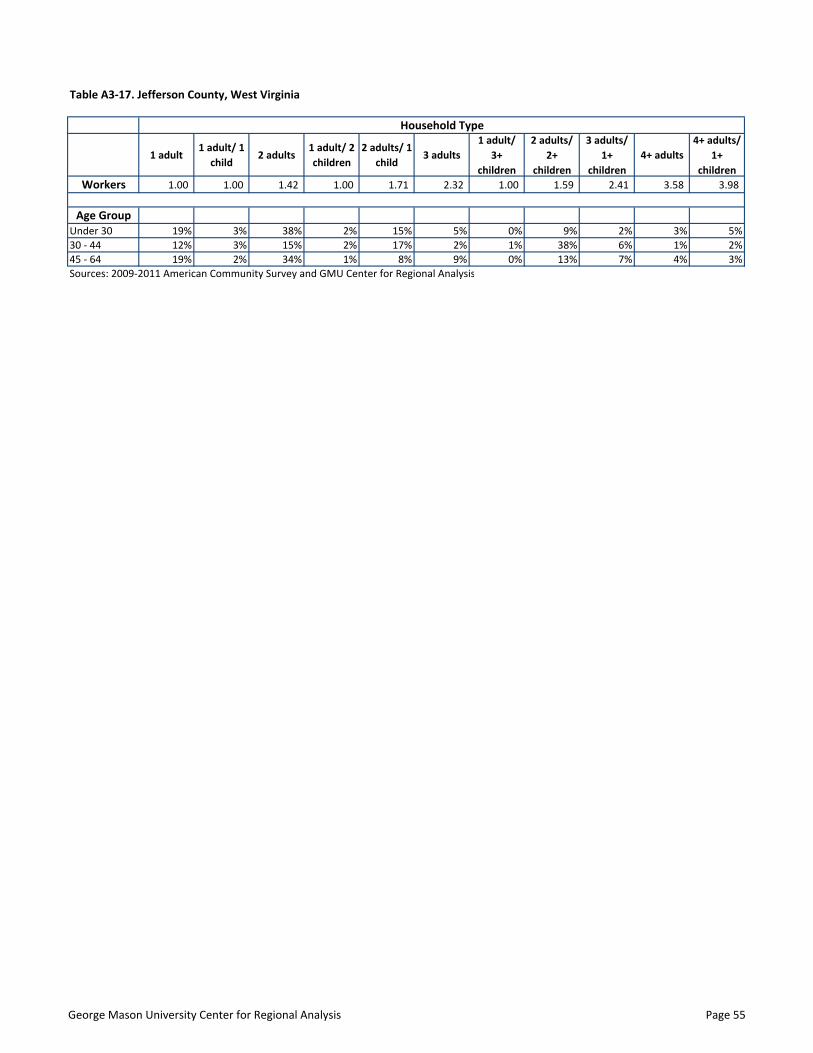
Table A3-17. Jefferson County, West Virginia
1 adult1 adult/ 1
child2 adults
1 adult/ 2
children
2 adults/ 1
child3 adults
1 adult/
3+
children
2 adults/
2+
children
3 adults/
1+
children
4+ adults
4+ adults/
1+
children
Workers 1.00 1.00 1.42 1.00 1.71 2.32 1.00 1.59 2.41 3.58 3.98
Age Group
Under 30 19% 3% 38% 2% 15% 5% 0% 9% 2% 3% 5%
30 - 44 12% 3% 15% 2% 17% 2% 1% 38% 6% 1% 2%
45 - 64 19% 2% 34% 1% 8% 9% 0% 13% 7% 4% 3%
Sources: 2009-2011 American Community Survey and GMU Center for Regional Analysis
Household Type
George Mason University Center for Regional Analysis Page 55
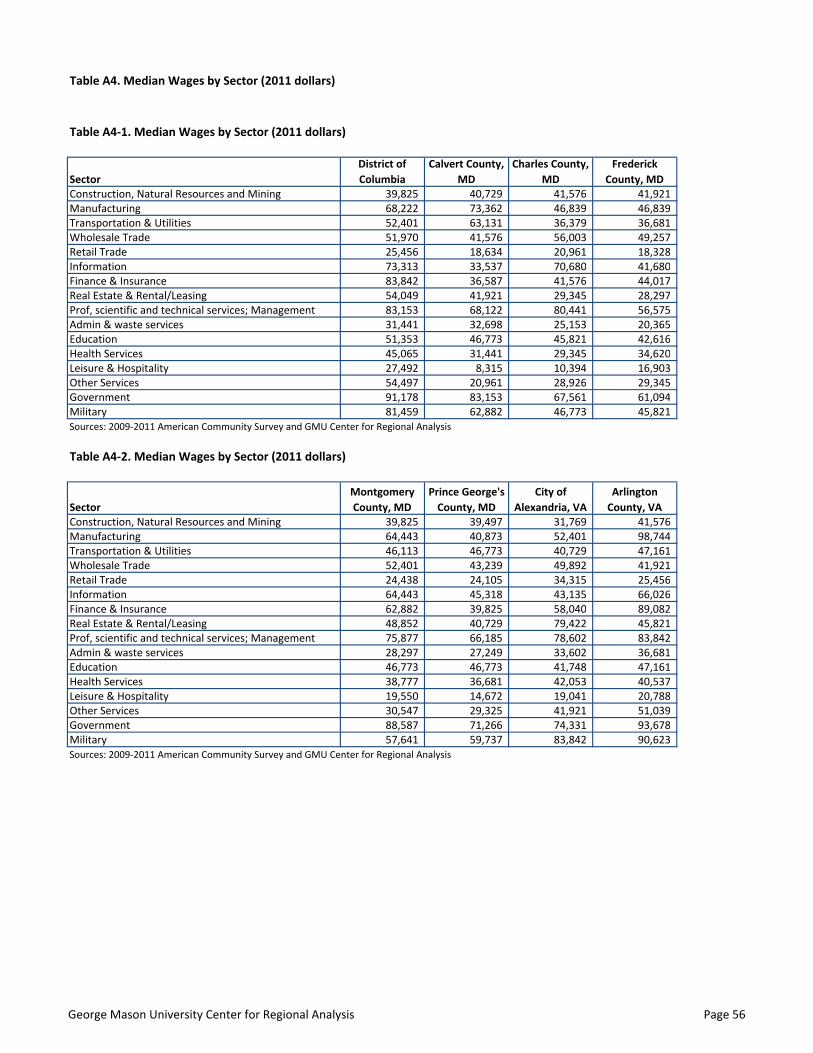
Table A4. Median Wages by Sector (2011 dollars)
Table A4-1. Median Wages by Sector (2011 dollars)
Sector
District of
Columbia
Calvert County,
MD
Charles County,
MD
Frederick
County, MD
Construction, Natural Resources and Mining 39,825 40,729 41,576 41,921
Manufacturing 68,222 73,362 46,839 46,839
Transportation & Utilities 52,401 63,131 36,379 36,681
Wholesale Trade 51,970 41,576 56,003 49,257
Retail Trade 25,456 18,634 20,961 18,328
Information 73,313 33,537 70,680 41,680
Finance & Insurance 83,842 36,587 41,576 44,017
Real Estate & Rental/Leasing 54,049 41,921 29,345 28,297
Prof, scientific and technical services; Management 83,153 68,122 80,441 56,575
Admin & waste services 31,441 32,698 25,153 20,365
Education 51,353 46,773 45,821 42,616
Health Services 45,065 31,441 29,345 34,620
Leisure & Hospitality 27,492 8,315 10,394 16,903
Other Services 54,497 20,961 28,926 29,345
Government 91,178 83,153 67,561 61,094
Military 81,459 62,882 46,773 45,821
Sources: 2009-2011 American Community Survey and GMU Center for Regional Analysis
Table A4-2. Median Wages by Sector (2011 dollars)
Sector
Montgomery
County, MD
Prince George's
County, MD
City of
Alexandria, VA
Arlington
County, VA
Construction, Natural Resources and Mining 39,825 39,497 31,769 41,576
Manufacturing 64,443 40,873 52,401 98,744
Transportation & Utilities 46,113 46,773 40,729 47,161
Wholesale Trade 52,401 43,239 49,892 41,921
Retail Trade 24,438 24,105 34,315 25,456
Information 64,443 45,318 43,135 66,026
Finance & Insurance 62,882 39,825 58,040 89,082
Real Estate & Rental/Leasing 48,852 40,729 79,422 45,821
Prof, scientific and technical services; Management 75,877 66,185 78,602 83,842
Admin & waste services 28,297 27,249 33,602 36,681
Education 46,773 46,773 41,748 47,161
Health Services 38,777 36,681 42,053 40,537
Leisure & Hospitality 19,550 14,672 19,041 20,788
Other Services 30,547 29,325 41,921 51,039
Government 88,587 71,266 74,331 93,678
Military 57,641 59,737 83,842 90,623
Sources: 2009-2011 American Community Survey and GMU Center for Regional Analysis
George Mason University Center for Regional Analysis Page 56
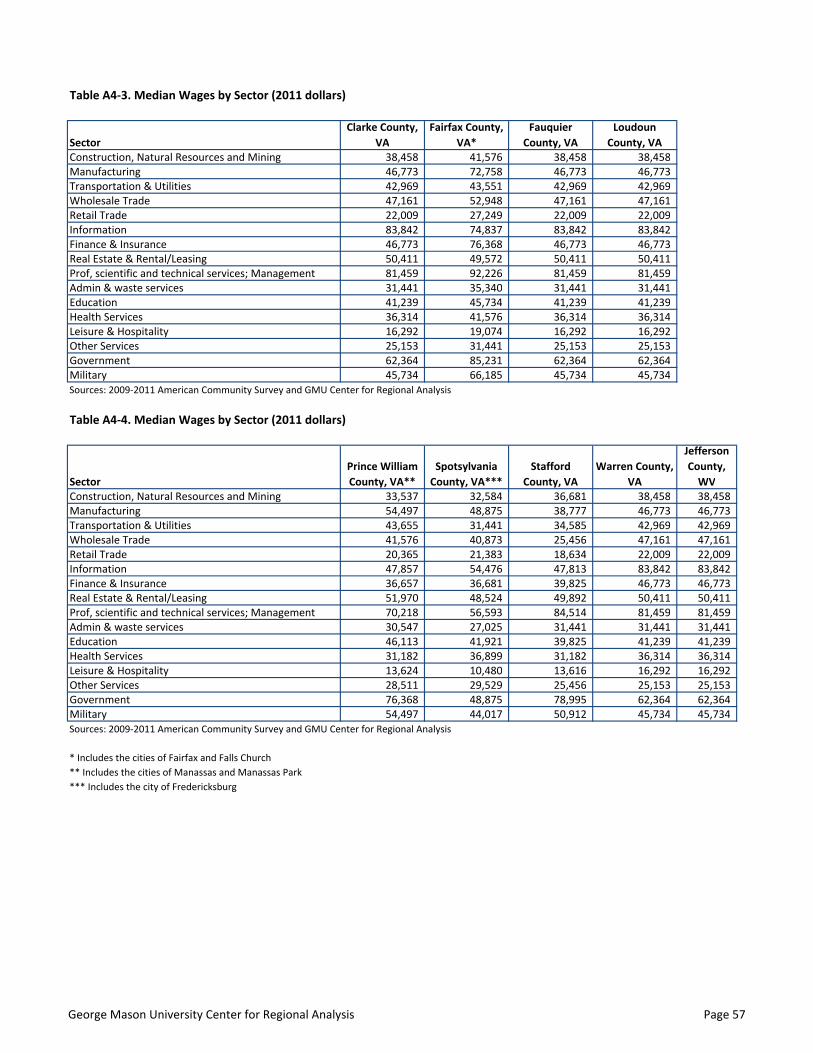
Table A4-3. Median Wages by Sector (2011 dollars)
Sector
Clarke County,
VA
Fairfax County,
VA*
Fauquier
County, VA
Loudoun
County, VA
Construction, Natural Resources and Mining 38,458 41,576 38,458 38,458
Manufacturing 46,773 72,758 46,773 46,773
Transportation & Utilities 42,969 43,551 42,969 42,969
Wholesale Trade 47,161 52,948 47,161 47,161
Retail Trade 22,009 27,249 22,009 22,009
Information 83,842 74,837 83,842 83,842
Finance & Insurance 46,773 76,368 46,773 46,773
Real Estate & Rental/Leasing 50,411 49,572 50,411 50,411
Prof, scientific and technical services; Management 81,459 92,226 81,459 81,459
Admin & waste services 31,441 35,340 31,441 31,441
Education 41,239 45,734 41,239 41,239
Health Services 36,314 41,576 36,314 36,314
Leisure & Hospitality 16,292 19,074 16,292 16,292
Other Services 25,153 31,441 25,153 25,153
Government 62,364 85,231 62,364 62,364
Military 45,734 66,185 45,734 45,734
Sources: 2009-2011 American Community Survey and GMU Center for Regional Analysis
Table A4-4. Median Wages by Sector (2011 dollars)
Sector
Prince William
County, VA**
Spotsylvania
County, VA***
Stafford
County, VA
Warren County,
VA
Jefferson
County,
WV
Construction, Natural Resources and Mining 33,537 32,584 36,681 38,458 38,458
Manufacturing 54,497 48,875 38,777 46,773 46,773
Transportation & Utilities 43,655 31,441 34,585 42,969 42,969
Wholesale Trade 41,576 40,873 25,456 47,161 47,161
Retail Trade 20,365 21,383 18,634 22,009 22,009
Information 47,857 54,476 47,813 83,842 83,842
Finance & Insurance 36,657 36,681 39,825 46,773 46,773
Real Estate & Rental/Leasing 51,970 48,524 49,892 50,411 50,411
Prof, scientific and technical services; Management 70,218 56,593 84,514 81,459 81,459
Admin & waste services 30,547 27,025 31,441 31,441 31,441
Education 46,113 41,921 39,825 41,239 41,239
Health Services 31,182 36,899 31,182 36,314 36,314
Leisure & Hospitality 13,624 10,480 13,616 16,292 16,292
Other Services 28,511 29,529 25,456 25,153 25,153
Government 76,368 48,875 78,995 62,364 62,364
Military 54,497 44,017 50,912 45,734 45,734
Sources: 2009-2011 American Community Survey and GMU Center for Regional Analysis
* Includes the cities of Fairfax and Falls Church
** Includes the cities of Manassas and Manassas Park
*** Includes the city of Fredericksburg
George Mason University Center for Regional Analysis Page 57
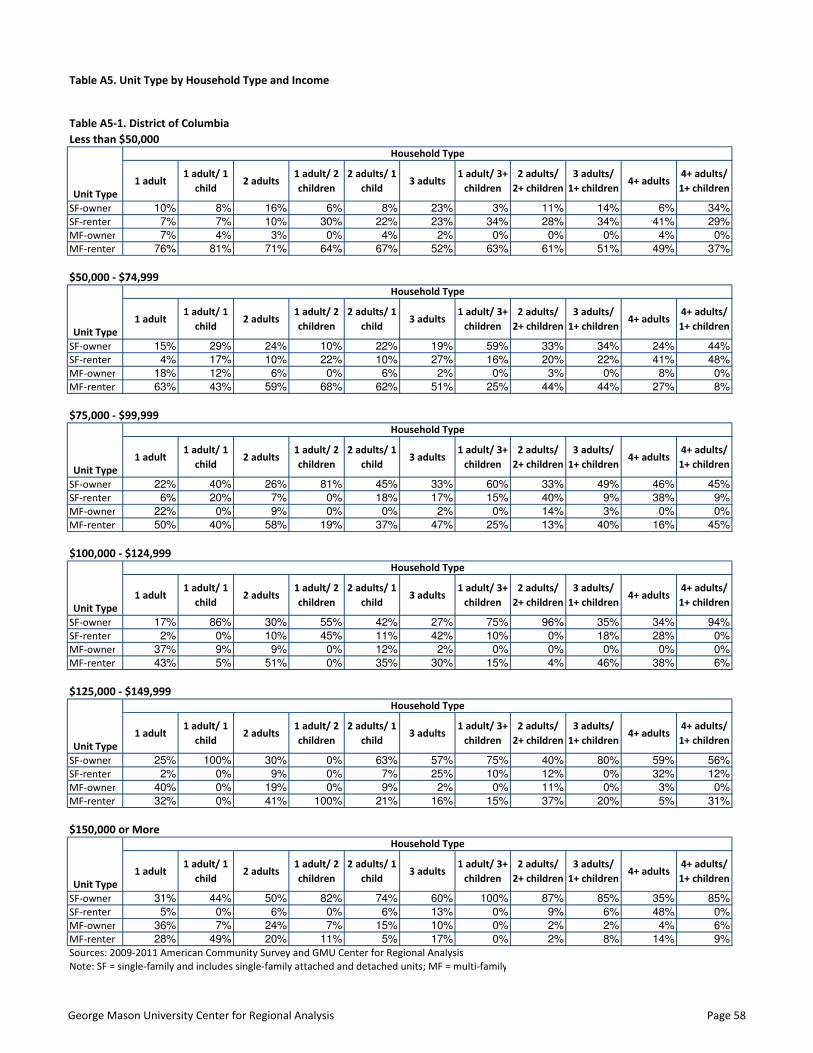
Table A5. Unit Type by Household Type and Income
Table A5-1. District of Columbia
Less than $50,000
1 adult1 adult/ 1
child2 adults
1 adult/ 2
children
2 adults/ 1
child3 adults
1 adult/ 3+
children
2 adults/
2+ children
3 adults/
1+ children4+ adults
4+ adults/
1+ children
SF-owner 10% 8% 16% 6% 8% 23% 3% 11% 14% 6% 34%
SF-renter 7% 7% 10% 30% 22% 23% 34% 28% 34% 41% 29%
MF-owner 7% 4% 3% 0% 4% 2% 0% 0% 0% 4% 0%
MF-renter 76% 81% 71% 64% 67% 52% 63% 61% 51% 49% 37%
$50,000 - $74,999
1 adult1 adult/ 1
child2 adults
1 adult/ 2
children
2 adults/ 1
child3 adults
1 adult/ 3+
children
2 adults/
2+ children
3 adults/
1+ children4+ adults
4+ adults/
1+ children
SF-owner 15% 29% 24% 10% 22% 19% 59% 33% 34% 24% 44%
SF-renter 4% 17% 10% 22% 10% 27% 16% 20% 22% 41% 48%
MF-owner 18% 12% 6% 0% 6% 2% 0% 3% 0% 8% 0%
MF-renter 63% 43% 59% 68% 62% 51% 25% 44% 44% 27% 8%
$75,000 - $99,999
1 adult1 adult/ 1
child2 adults
1 adult/ 2
children
2 adults/ 1
child3 adults
1 adult/ 3+
children
2 adults/
2+ children
3 adults/
1+ children4+ adults
4+ adults/
1+ children
SF-owner 22% 40% 26% 81% 45% 33% 60% 33% 49% 46% 45%
SF-renter 6% 20% 7% 0% 18% 17% 15% 40% 9% 38% 9%
MF-owner 22% 0% 9% 0% 0% 2% 0% 14% 3% 0% 0%
MF-renter 50% 40% 58% 19% 37% 47% 25% 13% 40% 16% 45%
$100,000 - $124,999
1 adult1 adult/ 1
child2 adults
1 adult/ 2
children
2 adults/ 1
child3 adults
1 adult/ 3+
children
2 adults/
2+ children
3 adults/
1+ children4+ adults
4+ adults/
1+ children
SF-owner 17% 86% 30% 55% 42% 27% 75% 96% 35% 34% 94%
SF-renter 2% 0% 10% 45% 11% 42% 10% 0% 18% 28% 0%
MF-owner 37% 9% 9% 0% 12% 2% 0% 0% 0% 0% 0%
MF-renter 43% 5% 51% 0% 35% 30% 15% 4% 46% 38% 6%
$125,000 - $149,999
1 adult1 adult/ 1
child2 adults
1 adult/ 2
children
2 adults/ 1
child3 adults
1 adult/ 3+
children
2 adults/
2+ children
3 adults/
1+ children4+ adults
4+ adults/
1+ children
SF-owner 25% 100% 30% 0% 63% 57% 75% 40% 80% 59% 56%
SF-renter 2% 0% 9% 0% 7% 25% 10% 12% 0% 32% 12%
MF-owner 40% 0% 19% 0% 9% 2% 0% 11% 0% 3% 0%
MF-renter 32% 0% 41% 100% 21% 16% 15% 37% 20% 5% 31%
$150,000 or More
1 adult1 adult/ 1
child2 adults
1 adult/ 2
children
2 adults/ 1
child3 adults
1 adult/ 3+
children
2 adults/
2+ children
3 adults/
1+ children4+ adults
4+ adults/
1+ children
SF-owner 31% 44% 50% 82% 74% 60% 100% 87% 85% 35% 85%
SF-renter 5% 0% 6% 0% 6% 13% 0% 9% 6% 48% 0%
MF-owner 36% 7% 24% 7% 15% 10% 0% 2% 2% 4% 6%
MF-renter 28% 49% 20% 11% 5% 17% 0% 2% 8% 14% 9%
Sources: 2009-2011 American Community Survey and GMU Center for Regional Analysis
Note: SF = single-family and includes single-family attached and detached units; MF = multi-family
Household Type
Unit Type
Unit Type
Household Type
Unit Type
Household Type
Unit Type
Household Type
Unit Type
Household Type
Unit Type
Household Type
George Mason University Center for Regional Analysis Page 58
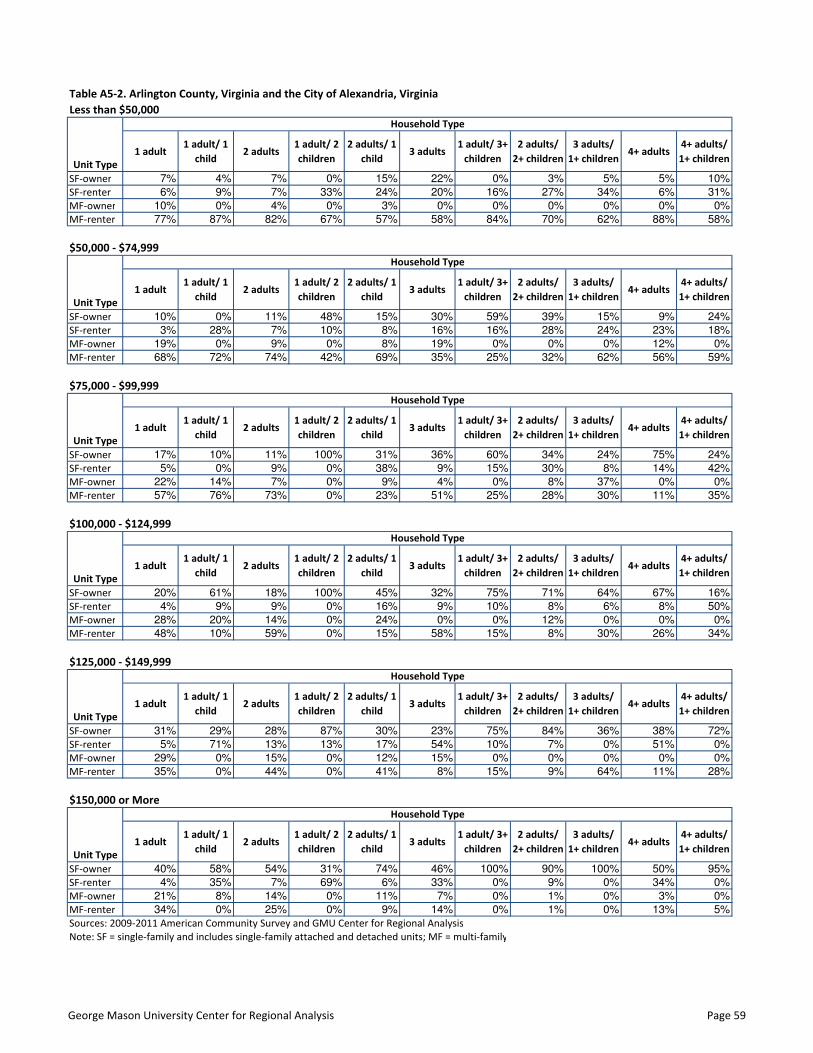
Table A5-2. Arlington County, Virginia and the City of Alexandria, Virginia
Less than $50,000
1 adult1 adult/ 1
child2 adults
1 adult/ 2
children
2 adults/ 1
child3 adults
1 adult/ 3+
children
2 adults/
2+ children
3 adults/
1+ children4+ adults
4+ adults/
1+ children
SF-owner 7% 4% 7% 0% 15% 22% 0% 3% 5% 5% 10%
SF-renter 6% 9% 7% 33% 24% 20% 16% 27% 34% 6% 31%
MF-owner 10% 0% 4% 0% 3% 0% 0% 0% 0% 0% 0%
MF-renter 77% 87% 82% 67% 57% 58% 84% 70% 62% 88% 58%
$50,000 - $74,999
1 adult1 adult/ 1
child2 adults
1 adult/ 2
children
2 adults/ 1
child3 adults
1 adult/ 3+
children
2 adults/
2+ children
3 adults/
1+ children4+ adults
4+ adults/
1+ children
SF-owner 10% 0% 11% 48% 15% 30% 59% 39% 15% 9% 24%
SF-renter 3% 28% 7% 10% 8% 16% 16% 28% 24% 23% 18%
MF-owner 19% 0% 9% 0% 8% 19% 0% 0% 0% 12% 0%
MF-renter 68% 72% 74% 42% 69% 35% 25% 32% 62% 56% 59%
$75,000 - $99,999
1 adult1 adult/ 1
child2 adults
1 adult/ 2
children
2 adults/ 1
child3 adults
1 adult/ 3+
children
2 adults/
2+ children
3 adults/
1+ children4+ adults
4+ adults/
1+ children
SF-owner 17% 10% 11% 100% 31% 36% 60% 34% 24% 75% 24%
SF-renter 5% 0% 9% 0% 38% 9% 15% 30% 8% 14% 42%
MF-owner 22% 14% 7% 0% 9% 4% 0% 8% 37% 0% 0%
MF-renter 57% 76% 73% 0% 23% 51% 25% 28% 30% 11% 35%
$100,000 - $124,999
1 adult1 adult/ 1
child2 adults
1 adult/ 2
children
2 adults/ 1
child3 adults
1 adult/ 3+
children
2 adults/
2+ children
3 adults/
1+ children4+ adults
4+ adults/
1+ children
SF-owner 20% 61% 18% 100% 45% 32% 75% 71% 64% 67% 16%
SF-renter 4% 9% 9% 0% 16% 9% 10% 8% 6% 8% 50%
MF-owner 28% 20% 14% 0% 24% 0% 0% 12% 0% 0% 0%
MF-renter 48% 10% 59% 0% 15% 58% 15% 8% 30% 26% 34%
$125,000 - $149,999
1 adult1 adult/ 1
child2 adults
1 adult/ 2
children
2 adults/ 1
child3 adults
1 adult/ 3+
children
2 adults/
2+ children
3 adults/
1+ children4+ adults
4+ adults/
1+ children
SF-owner 31% 29% 28% 87% 30% 23% 75% 84% 36% 38% 72%
SF-renter 5% 71% 13% 13% 17% 54% 10% 7% 0% 51% 0%
MF-owner 29% 0% 15% 0% 12% 15% 0% 0% 0% 0% 0%
MF-renter 35% 0% 44% 0% 41% 8% 15% 9% 64% 11% 28%
$150,000 or More
1 adult1 adult/ 1
child2 adults
1 adult/ 2
children
2 adults/ 1
child3 adults
1 adult/ 3+
children
2 adults/
2+ children
3 adults/
1+ children4+ adults
4+ adults/
1+ children
SF-owner 40% 58% 54% 31% 74% 46% 100% 90% 100% 50% 95%
SF-renter 4% 35% 7% 69% 6% 33% 0% 9% 0% 34% 0%
MF-owner 21% 8% 14% 0% 11% 7% 0% 1% 0% 3% 0%
MF-renter 34% 0% 25% 0% 9% 14% 0% 1% 0% 13% 5%
Sources: 2009-2011 American Community Survey and GMU Center for Regional Analysis
Note: SF = single-family and includes single-family attached and detached units; MF = multi-family
Unit Type
Household Type
Unit Type
Household Type
Unit Type
Household Type
Unit Type
Household Type
Unit Type
Household Type
Unit Type
Household Type
George Mason University Center for Regional Analysis Page 59
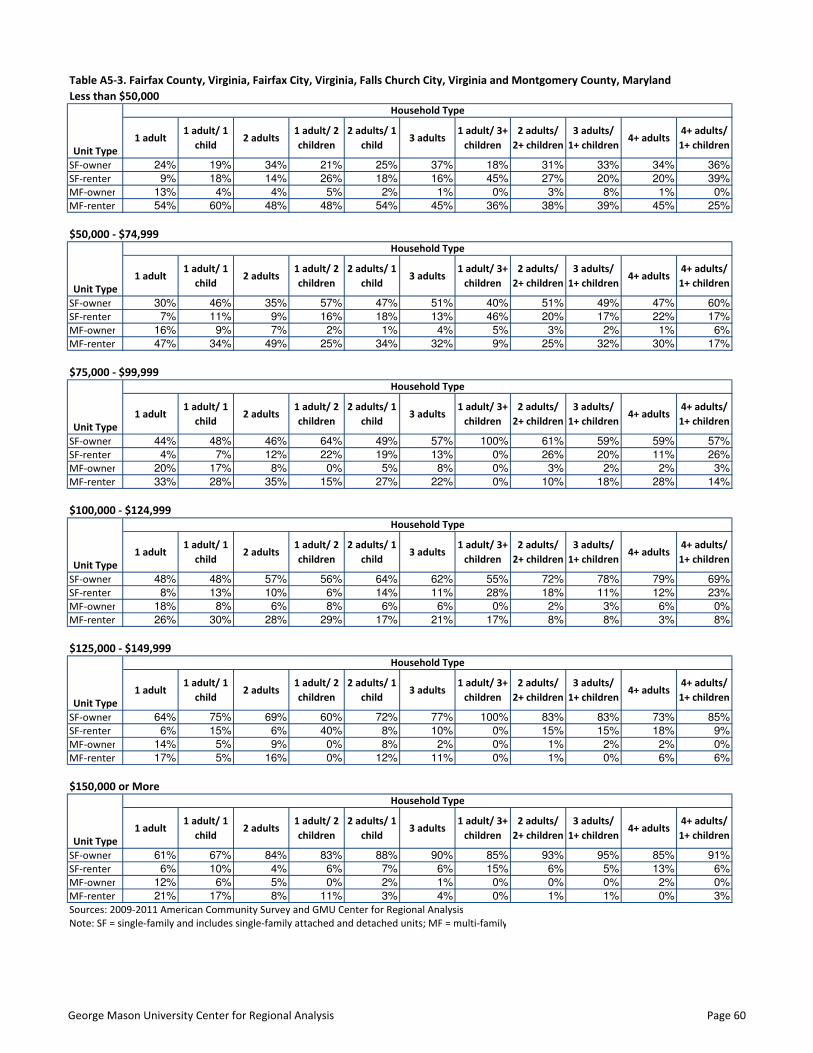
Table A5-3. Fairfax County, Virginia, Fairfax City, Virginia, Falls Church City, Virginia and Montgomery County, Maryland
Less than $50,000
1 adult1 adult/ 1
child2 adults
1 adult/ 2
children
2 adults/ 1
child3 adults
1 adult/ 3+
children
2 adults/
2+ children
3 adults/
1+ children4+ adults
4+ adults/
1+ children
SF-owner 24% 19% 34% 21% 25% 37% 18% 31% 33% 34% 36%
SF-renter 9% 18% 14% 26% 18% 16% 45% 27% 20% 20% 39%
MF-owner 13% 4% 4% 5% 2% 1% 0% 3% 8% 1% 0%
MF-renter 54% 60% 48% 48% 54% 45% 36% 38% 39% 45% 25%
$50,000 - $74,999
1 adult1 adult/ 1
child2 adults
1 adult/ 2
children
2 adults/ 1
child3 adults
1 adult/ 3+
children
2 adults/
2+ children
3 adults/
1+ children4+ adults
4+ adults/
1+ children
SF-owner 30% 46% 35% 57% 47% 51% 40% 51% 49% 47% 60%
SF-renter 7% 11% 9% 16% 18% 13% 46% 20% 17% 22% 17%
MF-owner 16% 9% 7% 2% 1% 4% 5% 3% 2% 1% 6%
MF-renter 47% 34% 49% 25% 34% 32% 9% 25% 32% 30% 17%
$75,000 - $99,999
1 adult1 adult/ 1
child2 adults
1 adult/ 2
children
2 adults/ 1
child3 adults
1 adult/ 3+
children
2 adults/
2+ children
3 adults/
1+ children4+ adults
4+ adults/
1+ children
SF-owner 44% 48% 46% 64% 49% 57% 100% 61% 59% 59% 57%
SF-renter 4% 7% 12% 22% 19% 13% 0% 26% 20% 11% 26%
MF-owner 20% 17% 8% 0% 5% 8% 0% 3% 2% 2% 3%
MF-renter 33% 28% 35% 15% 27% 22% 0% 10% 18% 28% 14%
$100,000 - $124,999
1 adult1 adult/ 1
child2 adults
1 adult/ 2
children
2 adults/ 1
child3 adults
1 adult/ 3+
children
2 adults/
2+ children
3 adults/
1+ children4+ adults
4+ adults/
1+ children
SF-owner 48% 48% 57% 56% 64% 62% 55% 72% 78% 79% 69%
SF-renter 8% 13% 10% 6% 14% 11% 28% 18% 11% 12% 23%
MF-owner 18% 8% 6% 8% 6% 6% 0% 2% 3% 6% 0%
MF-renter 26% 30% 28% 29% 17% 21% 17% 8% 8% 3% 8%
$125,000 - $149,999
1 adult1 adult/ 1
child2 adults
1 adult/ 2
children
2 adults/ 1
child3 adults
1 adult/ 3+
children
2 adults/
2+ children
3 adults/
1+ children4+ adults
4+ adults/
1+ children
SF-owner 64% 75% 69% 60% 72% 77% 100% 83% 83% 73% 85%
SF-renter 6% 15% 6% 40% 8% 10% 0% 15% 15% 18% 9%
MF-owner 14% 5% 9% 0% 8% 2% 0% 1% 2% 2% 0%
MF-renter 17% 5% 16% 0% 12% 11% 0% 1% 0% 6% 6%
$150,000 or More
1 adult1 adult/ 1
child2 adults
1 adult/ 2
children
2 adults/ 1
child3 adults
1 adult/ 3+
children
2 adults/
2+ children
3 adults/
1+ children4+ adults
4+ adults/
1+ children
SF-owner 61% 67% 84% 83% 88% 90% 85% 93% 95% 85% 91%
SF-renter 6% 10% 4% 6% 7% 6% 15% 6% 5% 13% 6%
MF-owner 12% 6% 5% 0% 2% 1% 0% 0% 0% 2% 0%
MF-renter 21% 17% 8% 11% 3% 4% 0% 1% 1% 0% 3%
Sources: 2009-2011 American Community Survey and GMU Center for Regional Analysis
Note: SF = single-family and includes single-family attached and detached units; MF = multi-family
Unit Type
Household Type
Unit Type
Household Type
Unit Type
Household Type
Unit Type
Household Type
Unit Type
Household Type
Unit Type
Household Type
George Mason University Center for Regional Analysis Page 60
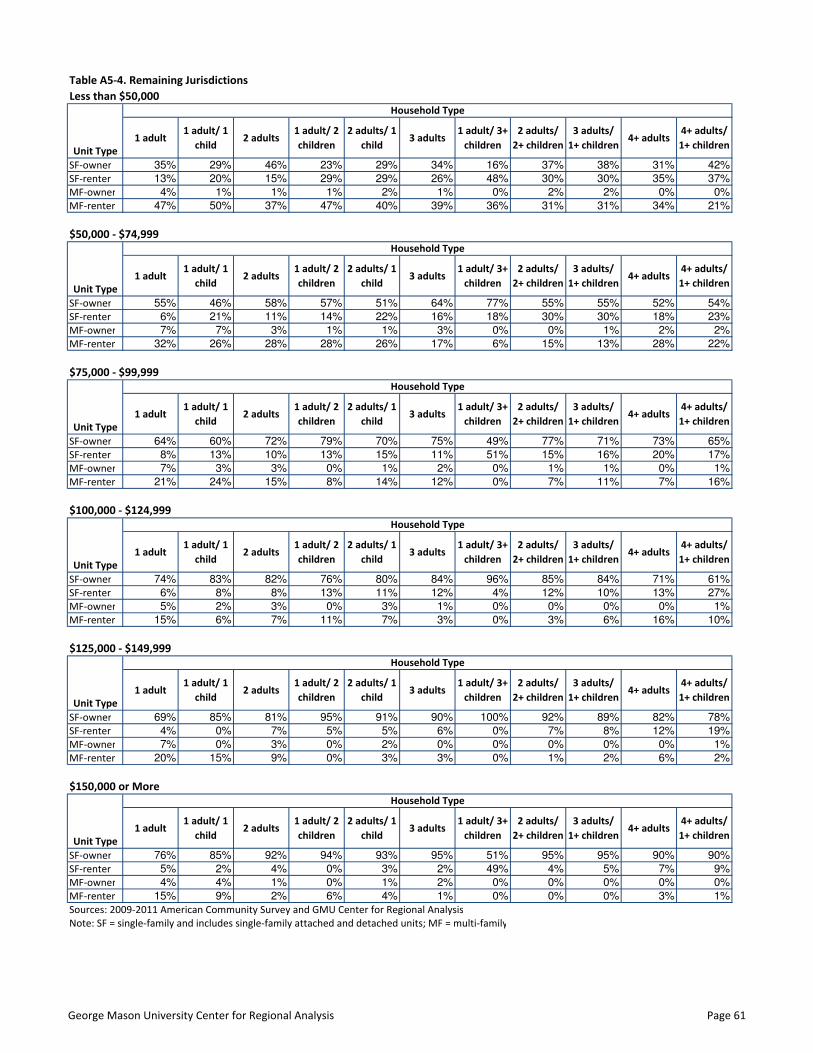
Table A5-4. Remaining Jurisdictions
Less than $50,000
1 adult1 adult/ 1
child2 adults
1 adult/ 2
children
2 adults/ 1
child3 adults
1 adult/ 3+
children
2 adults/
2+ children
3 adults/
1+ children4+ adults
4+ adults/
1+ children
SF-owner 35% 29% 46% 23% 29% 34% 16% 37% 38% 31% 42%
SF-renter 13% 20% 15% 29% 29% 26% 48% 30% 30% 35% 37%
MF-owner 4% 1% 1% 1% 2% 1% 0% 2% 2% 0% 0%
MF-renter 47% 50% 37% 47% 40% 39% 36% 31% 31% 34% 21%
$50,000 - $74,999
1 adult1 adult/ 1
child2 adults
1 adult/ 2
children
2 adults/ 1
child3 adults
1 adult/ 3+
children
2 adults/
2+ children
3 adults/
1+ children4+ adults
4+ adults/
1+ children
SF-owner 55% 46% 58% 57% 51% 64% 77% 55% 55% 52% 54%
SF-renter 6% 21% 11% 14% 22% 16% 18% 30% 30% 18% 23%
MF-owner 7% 7% 3% 1% 1% 3% 0% 0% 1% 2% 2%
MF-renter 32% 26% 28% 28% 26% 17% 6% 15% 13% 28% 22%
$75,000 - $99,999
1 adult1 adult/ 1
child2 adults
1 adult/ 2
children
2 adults/ 1
child3 adults
1 adult/ 3+
children
2 adults/
2+ children
3 adults/
1+ children4+ adults
4+ adults/
1+ children
SF-owner 64% 60% 72% 79% 70% 75% 49% 77% 71% 73% 65%
SF-renter 8% 13% 10% 13% 15% 11% 51% 15% 16% 20% 17%
MF-owner 7% 3% 3% 0% 1% 2% 0% 1% 1% 0% 1%
MF-renter 21% 24% 15% 8% 14% 12% 0% 7% 11% 7% 16%
$100,000 - $124,999
1 adult1 adult/ 1
child2 adults
1 adult/ 2
children
2 adults/ 1
child3 adults
1 adult/ 3+
children
2 adults/
2+ children
3 adults/
1+ children4+ adults
4+ adults/
1+ children
SF-owner 74% 83% 82% 76% 80% 84% 96% 85% 84% 71% 61%
SF-renter 6% 8% 8% 13% 11% 12% 4% 12% 10% 13% 27%
MF-owner 5% 2% 3% 0% 3% 1% 0% 0% 0% 0% 1%
MF-renter 15% 6% 7% 11% 7% 3% 0% 3% 6% 16% 10%
$125,000 - $149,999
1 adult1 adult/ 1
child2 adults
1 adult/ 2
children
2 adults/ 1
child3 adults
1 adult/ 3+
children
2 adults/
2+ children
3 adults/
1+ children4+ adults
4+ adults/
1+ children
SF-owner 69% 85% 81% 95% 91% 90% 100% 92% 89% 82% 78%
SF-renter 4% 0% 7% 5% 5% 6% 0% 7% 8% 12% 19%
MF-owner 7% 0% 3% 0% 2% 0% 0% 0% 0% 0% 1%
MF-renter 20% 15% 9% 0% 3% 3% 0% 1% 2% 6% 2%
$150,000 or More
1 adult1 adult/ 1
child2 adults
1 adult/ 2
children
2 adults/ 1
child3 adults
1 adult/ 3+
children
2 adults/
2+ children
3 adults/
1+ children4+ adults
4+ adults/
1+ children
SF-owner 76% 85% 92% 94% 93% 95% 51% 95% 95% 90% 90%
SF-renter 5% 2% 4% 0% 3% 2% 49% 4% 5% 7% 9%
MF-owner 4% 4% 1% 0% 1% 2% 0% 0% 0% 0% 0%
MF-renter 15% 9% 2% 6% 4% 1% 0% 0% 0% 3% 1%
Sources: 2009-2011 American Community Survey and GMU Center for Regional Analysis
Note: SF = single-family and includes single-family attached and detached units; MF = multi-family
Unit Type
Household Type
Unit Type
Household Type
Unit Type
Household Type
Unit Type
Household Type
Unit Type
Household Type
Unit Type
Household Type
George Mason University Center for Regional Analysis Page 61
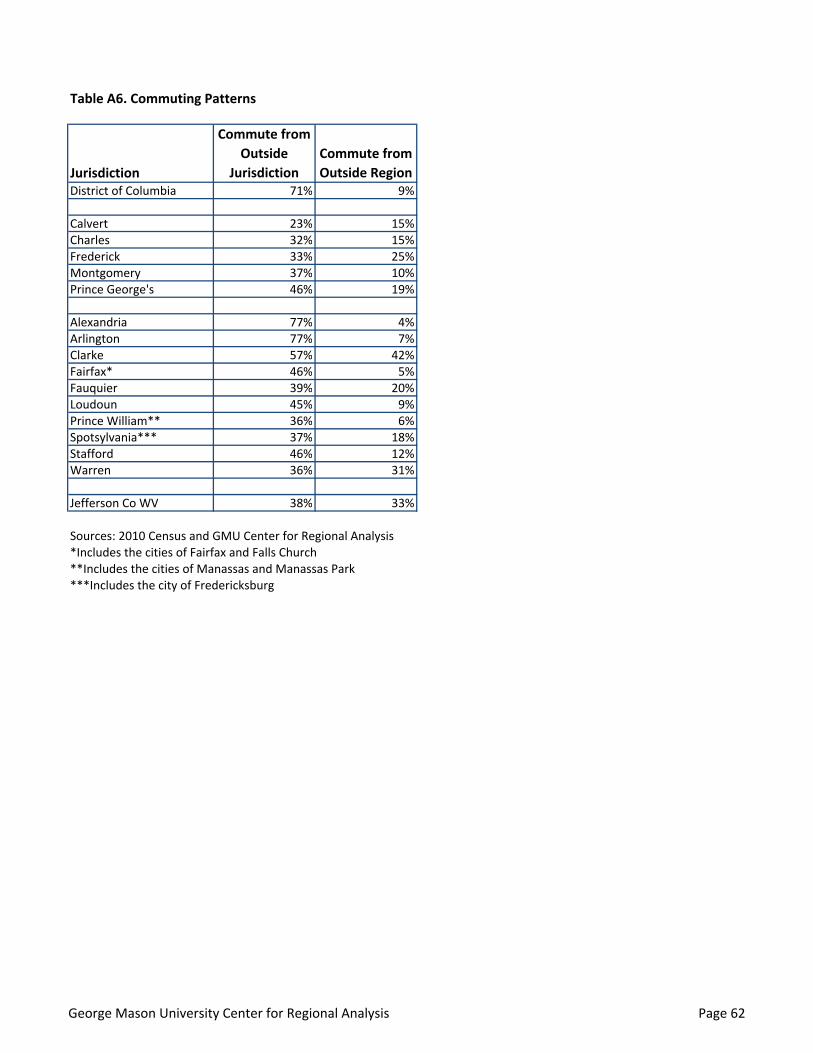
Table A6. Commuting Patterns
Jurisdiction
Commute from
Outside
Jurisdiction
Commute from
Outside Region
District of Columbia 71% 9%
Calvert 23% 15%
Charles 32% 15%
Frederick 33% 25%
Montgomery 37% 10%
Prince George's 46% 19%
Alexandria 77% 4%
Arlington 77% 7%
Clarke 57% 42%
Fairfax* 46% 5%
Fauquier 39% 20%
Loudoun 45% 9%
Prince William** 36% 6%
Spotsylvania*** 37% 18%
Stafford 46% 12%
Warren 36% 31%
Jefferson Co WV 38% 33%
Sources: 2010 Census and GMU Center for Regional Analysis
*Includes the cities of Fairfax and Falls Church
**Includes the cities of Manassas and Manassas Park
***Includes the city of Fredericksburg
George Mason University Center for Regional Analysis Page 62