Embed Size (px)
Citation preview
Table of
Contents
Key Statistics for November
Sales 2015 Residential Sales Stats Year-to-Year Total Sales by Map Area Median 2015 Median Sales Stats Year-to-Year Median Sales by Map Area Listings 2015 Active Listings by Map Area 2015 Total Active Listings vs. Total Sales Year-to-Year Active Listings by Map Area Inventory 2015 Months of Inventory by Map Area Year-to-Year Months of Inventory
Summary
About Hady Chahine Contact Information

Key Statistics for November
Back to Table of Contents
= trending positive = trending positive
= trending negative = trending negative
Month-to-Month Comparison Oct 2015 Nov 2015 Delta (qty) Delta (%) Increase Decrease
Total Sales 94 64 -30 -31.9%
Median Sales Price 611,750 645,000 33,250 5.4%
Median Days to Sell 40 36 -4 -10.0%
Listings 210 212 2 1.0%
Sales/Listing Ratio 44.8% 30.2% -14.6% -32.6%
Months of Inventory 2.0 3.0 1.0 50.0%
Monthly Comparison Year-to-Year Nov 2014 Nov 2015 Delta Delta Increase Decrease
Total Sales 75 64 -11 -14.7%
Median Sales Price 610,000 645,000 35,000 5.7%
Median Days to Sell 48 36 -12 -25.0%
Listings 201 212 11 5.5%
Months of Inventory 2.3 3.0 0.7 30.4%

Back to Table of Contents
Total Sales Month-to-Month by Map Area Sep Oct Nov
Central Torrance 15 16 8
South East Torrance - West 11 9 3
Hollywood Riviera 9 14 5
South Torrance 11 4 8
Southwood 4 5 5
West Torrance 11 4 4
N Torrance - West 18 10 12
N Torrance - East 7 15 2
Old Torrance 9 13 10
South East Torrance - East 3 4 7
Total Sales 98 94 64
-
10
20
30
40
50
60
70
80
90
100
Sep Oct Nov
2015 Total Sales Month-to-Month by Map Area
Central Torrance
South East Torrance - West
Hollywood Riviera
South Torrance
Southwood
West Torrance
N Torrance - West
N Torrance - East
Old Torrance
South East Torrance - East
Total Sales

Back to Table of Contents
Total Sales Year-to-Year by Map Area 2013 2014 2015
Central Torrance 12 13 8
South East Torrance - West 7 7 3
Hollywood Riviera 8 9 5
South Torrance - 2 8
Southwood 5 4 5
West Torrance 6 8 4
N Torrance - West 7 10 12
N Torrance - East 7 6 2
Old Torrance 9 8 10
South East Torrance - East 8 8 7
Total Sales 69 75 64
-
10
20
30
40
50
60
70
80
2013 2014 2015
Total Sales Year-to-Year by Map Area: November
Central Torrance
South East Torrance - West
Hollywood Riviera
South Torrance
Southwood
West Torrance
N Torrance - West
N Torrance - East
Old Torrance
South East Torrance - East
Total Sales
Back to Table of Contents
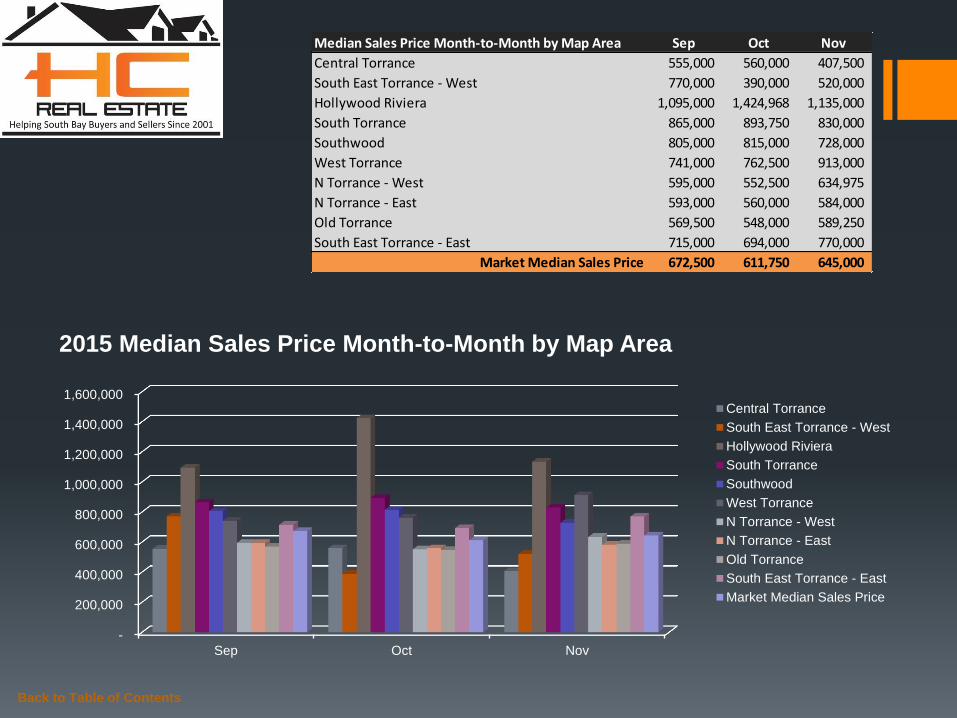
Median Sales Price Month-to-Month by Map Area Sep Oct Nov
Central Torrance 555,000 560,000 407,500
South East Torrance - West 770,000 390,000 520,000
Hollywood Riviera 1,095,000 1,424,968 1,135,000
South Torrance 865,000 893,750 830,000
Southwood 805,000 815,000 728,000
West Torrance 741,000 762,500 913,000
N Torrance - West 595,000 552,500 634,975
N Torrance - East 593,000 560,000 584,000
Old Torrance 569,500 548,000 589,250
South East Torrance - East 715,000 694,000 770,000
Market Median Sales Price 672,500 611,750 645,000
-
200,000
400,000
600,000
800,000
1,000,000
1,200,000
1,400,000
1,600,000
Sep Oct Nov
2015 Median Sales Price Month-to-Month by Map Area
Central Torrance
South East Torrance - West
Hollywood Riviera
South Torrance
Southwood
West Torrance
N Torrance - West
N Torrance - East
Old Torrance
South East Torrance - East
Market Median Sales Price

Back to Table of Contents
Median Sales Price Year-to-Year by Map Area 2013 2014 2015
Central Torrance 550,250 651,000 407,500
South East Torrance - West 367,500 475,000 520,000
Hollywood Riviera 910,000 1,080,000 1,135,000
South Torrance - 1,132,500 830,000
Southwood 760,000 641,500 728,000
West Torrance 708,000 694,250 913,000
N Torrance - West 540,000 573,500 634,975
N Torrance - East 490,000 534,375 584,000
Old Torrance 443,000 575,250 589,250
South East Torrance - East 665,000 609,500 770,000
Market Median Sales Price 565,000 610,000 645,000
-
200,000
400,000
600,000
800,000
1,000,000
1,200,000
2013 2014 2015
Median Sales Price Year-to-Year by Map Area: November
Central Torrance
South East Torrance - West
Hollywood Riviera
South Torrance
Southwood
West Torrance
N Torrance - West
N Torrance - East
Old Torrance
South East Torrance - East
Market Median Sales Price

Back to Table of Contents
Active Listings vs. Total Sales by Map Area Jan Feb Mar Apr May Jun Jul Aug Sep Oct Nov Dec
Central Torrance 27 28 29 34 31 27 38 36 29 29 21
South East Torrance - West 16 17 12 13 13 15 14 16 18 12 14
Hollywood Riviera 20 18 16 21 15 21 29 31 36 29 22
South Torrance 11 13 16 17 13 14 15 20 20 16 14
Southwood 6 6 8 7 8 8 11 9 8 5 9
West Torrance 12 13 9 8 11 13 14 15 16 16 18
N Torrance - West 17 20 20 22 20 24 32 29 43 39 39
N Torrance - East 10 7 10 17 15 13 13 17 18 16 23
Old Torrance 20 21 22 25 27 22 21 27 32 25 31
South East Torrance - East 17 21 16 13 16 12 15 14 21 23 21
Total Active Listings 156 164 158 177 169 169 202 214 241 210 212
-
5
10
15
20
25
30
35
40
45
Jan Feb Mar Apr May Jun Jul Aug Sep Oct Nov Dec
2015 Active Listings by Map Area
Central Torrance
South East Torrance - West
Hollywood Riviera
South Torrance
Southwood
West Torrance
N Torrance - West
N Torrance - East
Old Torrance
South East Torrance - East

Back to Table of Contents
Active Listings vs. Total Sales by Map Area Jan Feb Mar Apr May Jun Jul Aug Sep Oct Nov Dec
Central Torrance 27 28 29 34 31 27 38 36 29 29 21
South East Torrance - West 16 17 12 13 13 15 14 16 18 12 14
Hollywood Riviera 20 18 16 21 15 21 29 31 36 29 22
South Torrance 11 13 16 17 13 14 15 20 20 16 14
Southwood 6 6 8 7 8 8 11 9 8 5 9
West Torrance 12 13 9 8 11 13 14 15 16 16 18
N Torrance - West 17 20 20 22 20 24 32 29 43 39 39
N Torrance - East 10 7 10 17 15 13 13 17 18 16 23
Old Torrance 20 21 22 25 27 22 21 27 32 25 31
South East Torrance - East 17 21 16 13 16 12 15 14 21 23 21
Total Active Listings 156 164 158 177 169 169 202 214 241 210 212
Total Sales 44 67 79 105 107 106 107 100 98 94 64
Sales/Listings Ratio 28.2% 40.9% 50.0% 59.3% 63.3% 62.7% 53.0% 46.7% 40.7% 44.8% 30.2%
-
50
100
150
200
250
Jan Feb Mar Apr May Jun Jul Aug Sep Oct Nov Dec
2015 Total Active Listings vs. Total Sales
Total Active Listings Total Sales

Back to Table of Contents
Active Listings Year-to-Year by Map Area 2013 2014 2015
Central Torrance 27 28 21
South East Torrance - West 12 23 14
Hollywood Riviera 21 19 22
South Torrance 17 19 14
Southwood 5 8 9
West Torrance 17 13 18
N Torrance - West 27 25 39
N Torrance - East 11 13 23
Old Torrance 34 34 31
South East Torrance - East 9 19 21
Total Active Listings 180 201 212
-
50
100
150
200
250
2013 2014 2015
Active Listings Year-to-Year by Map Area: November
Central Torrance
South East Torrance - West
Hollywood Riviera
South Torrance
Southwood
West Torrance
N Torrance - West
N Torrance - East
Old Torrance
South East Torrance - East
Total Active Listings

Back to Table of Contents
Months of Inventory by Map Area Jan Feb Mar Apr May Jun Jul Aug Sep Oct Nov Dec
Central Torrance 5.4 1.9 2.4 1.7 1.9 1.0 3.0 2.0 2.0 2.0 3.0
South East Torrance - West 2.7 8.5 1.3 1.2 1.9 2.0 2.0 3.0 2.0 1.0 5.0
Hollywood Riviera 5.0 2.3 1.2 2.6 1.2 2.0 2.0 4.0 4.0 2.0 4.0
South Torrance 2.8 2.6 16.0 2.1 1.6 2.0 2.0 2.0 2.0 4.0 2.0
Southwood 3.0 1.0 2.7 0.9 1.3 2.0 2.0 2.0 2.0 1.0 2.0
West Torrance 2.4 4.3 3.0 0.7 1.0 2.0 1.0 1.0 1.0 4.0 5.0
N Torrance - West 2.8 2.2 1.8 1.6 1.2 2.0 1.0 3.0 2.0 4.0 3.0
N Torrance - East 2.0 1.4 1.3 1.7 1.7 1.0 1.0 2.0 3.0 1.0 12.0
Old Torrance 5.0 1.8 1.8 2.8 2.1 1.0 2.0 3.0 4.0 2.0 3.0
South East Torrance - East 5.7 10.5 2.3 2.2 2.3 2.0 3.0 1.0 7.0 6.0 3.0
-
2.0
4.0
6.0
8.0
10.0
12.0
14.0
16.0
Jan Feb Mar Apr May Jun Jul Aug Sep Oct Nov Dec
2015 Months of Inventory by Map Area
Central Torrance
South East Torrance - West
Hollywood Riviera
South Torrance
Southwood
West Torrance
N Torrance - West
N Torrance - East
Old Torrance
South East Torrance - East

Back to Table of Contents
Months of Inventory Year-to-Year Jan Feb Mar Apr May Jun Jul Aug Sep Oct Nov Dec
2013 2.6 2.7 1.5 1.6 1.8 2.0 1.9 2.2 2.0 2.3 2.0 1.0
2014 2.0 2.0 2.0 2.2 2.1 3.0 2.1 2.1 2.7 2.2 2.3 1.8
2015 3.6 2.5 2.0 1.7 1.6 2.0 2.0 2.0 2.0 2.0 3.0
-
0.5
1.0
1.5
2.0
2.5
3.0
3.5
4.0
Jan Feb Mar Apr May Jun Jul Aug Sep Oct Nov Dec
Months of Inventory Year-to-Year
2013
2014
2015

Summary Apparently the holiday season distracted real estate investors as total sales for the Torrance market fell almost 32% during November. Thankfully the market median sales price improved 5.4% or $33.25K while the median days to sell and net listing data points improved marginally. Year-over-year stats are almost identical to the monthly analysis in terms of movement, though scale or magnitude of measure differs.
In the news… According to C.A.R., “statewide sales were below the 400,000 mark for the first time in eight months” while the statewide median home valuation holds strong in the $475K range. http://www.car.org/newsstand/newsreleases/2015releases/november2015sales?view=Standard
For questions concerning buying or selling, please give me a call today. No commitment necessary, merely interested in helping in any way I can.
Back to Table of Contents
Month-to-Month Comparison Oct 2015 Nov 2015 Delta (qty) Delta (%) Increase Decrease
Total Sales 94 64 -30 -31.9%
Median Sales Price 611,750 645,000 33,250 5.4%
Median Days to Sell 40 36 -4 -10.0%
Listings 210 212 2 1.0%
Sales/Listing Ratio 44.8% 30.2% -14.6% -32.6%
Months of Inventory 2.0 3.0 1.0 50.0%
Monthly Comparison Year-to-Year Nov 2014 Nov 2015 Delta Delta Increase Decrease
Total Sales 75 64 -11 -14.7%
Median Sales Price 610,000 645,000 35,000 5.7%
Median Days to Sell 48 36 -12 -25.0%
Listings 201 212 11 5.5%
Months of Inventory 2.3 3.0 0.7 30.4%
Back to Table of Contents
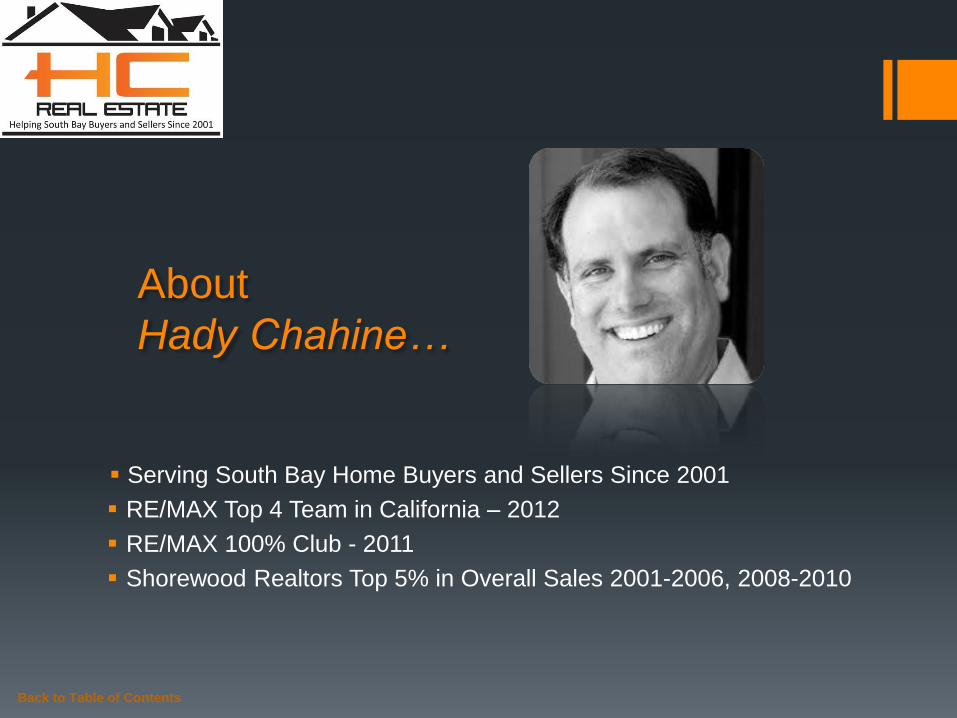
Serving South Bay Home Buyers and Sellers Since 2001
RE/MAX Top 4 Team in California – 2012
RE/MAX 100% Club - 2011
Shorewood Realtors Top 5% in Overall Sales 2001-2006, 2008-2010
About
Hady Chahine…

The information being provided by CARETS (CLAW, CRISNet MLS, DAMLS, CRMLS, i-Tech MLS, and/or VCRDS) is for the visitor’s personal, non-commercial use and may not be used for
any purpose other than to identify prospective properties visitor may be interested in purchasing. Any information relating to a property referenced on this web site comes from the Internet
Data Exchange (IDX) program of CARETS. This web site may reference real estate listing(s) held by a brokerage firm other than the broker and/or agent who owns this web site. The accuracy
of all information, regardless of source, including but not limited to square footages and lot sizes, is deemed reliable but not guaranteed and should be personally verified through personal
inspection by and/or with the appropriate professionals.
Back to Table of Contents
Listings MLS BLOG Website
Hady Chahine
• 310-404-5361