Embed Size (px)
Citation preview
Table of
Contents
Key Statistics for August
Sales 2017 Residential Sales Stats Year-to-Year Total Sales by Map Area Median 2017 Median Sales Stats Year-to-Year Median Sales by Map Area Listings 2017 Active Listings by Map Area 2017 Total Active Listings vs. Total Sales Year-to-Year Active Listings by Map Area Inventory 2017 Months of Inventory by Map Area Year-to-Year Months of Inventory
Summary
About Hady Chahine Contact Information
Key Statistics for August
Back to Table of Contents
= trending positive = trending positive
= trending negative = trending negative
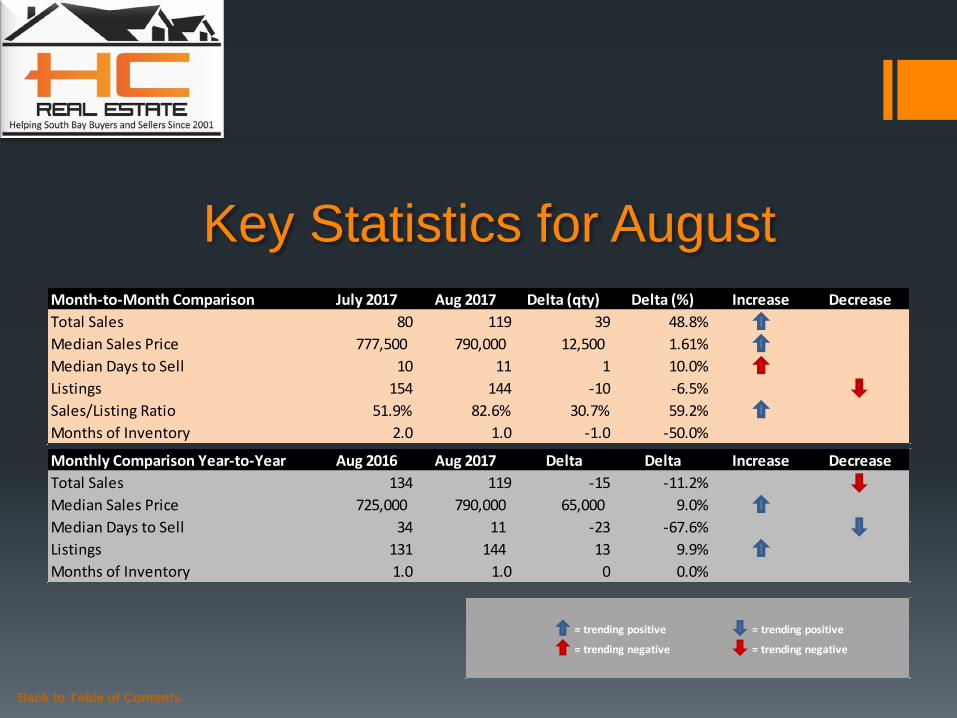
Month-to-Month Comparison July 2017 Aug 2017 Delta (qty) Delta (%) Increase Decrease
Total Sales 80 119 39 48.8%
Median Sales Price 777,500 790,000 12,500 1.61%
Median Days to Sell 10 11 1 10.0%
Listings 154 144 -10 -6.5%
Sales/Listing Ratio 51.9% 82.6% 30.7% 59.2%
Months of Inventory 2.0 1.0 -1.0 -50.0%
Monthly Comparison Year-to-Year Aug 2016 Aug 2017 Delta Delta Increase Decrease
Total Sales 134 119 -15 -11.2%
Median Sales Price 725,000 790,000 65,000 9.0%
Median Days to Sell 34 11 -23 -67.6%
Listings 131 144 13 9.9%
Months of Inventory 1.0 1.0 0 0.0%
Back to Table of Contents
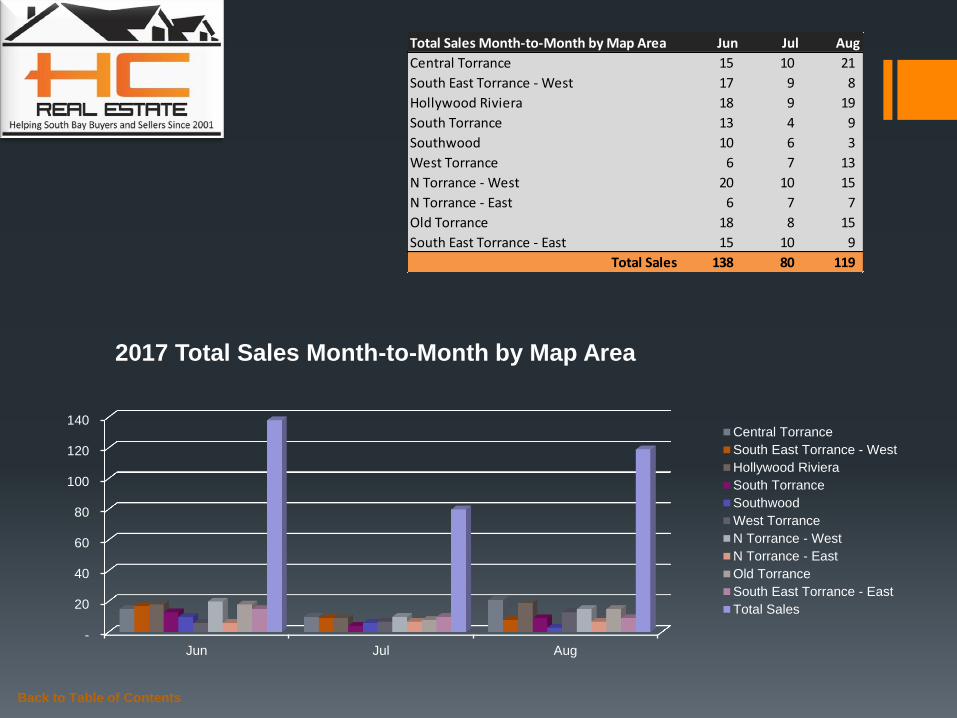
Total Sales Month-to-Month by Map Area Jun Jul Aug
Central Torrance 15 10 21
South East Torrance - West 17 9 8
Hollywood Riviera 18 9 19
South Torrance 13 4 9
Southwood 10 6 3
West Torrance 6 7 13
N Torrance - West 20 10 15
N Torrance - East 6 7 7
Old Torrance 18 8 15
South East Torrance - East 15 10 9
Total Sales 138 80 119
-
20
40
60
80
100
120
140
Jun Jul Aug
2017 Total Sales Month-to-Month by Map Area
Central Torrance
South East Torrance - West
Hollywood Riviera
South Torrance
Southwood
West Torrance
N Torrance - West
N Torrance - East
Old Torrance
South East Torrance - East
Total Sales

Back to Table of Contents
Total Sales Year-to-Year by Map Area 2015 2016 2017
Central Torrance 19 15 21
South East Torrance - West 6 11 8
Hollywood Riviera 8 14 19
South Torrance 10 16 9
Southwood 4 6 3
West Torrance 15 16 13
N Torrance - West 8 17 15
N Torrance - East 9 13 7
Old Torrance 10 15 15
South East Torrance - East 11 11 9
Total Sales 100 134 119
-
20
40
60
80
100
120
140
2015 2016 2017
Total Sales Year-to-Year by Map Area: August
Central Torrance
South East Torrance - West
Hollywood Riviera
South Torrance
Southwood
West Torrance
N Torrance - West
N Torrance - East
Old Torrance
South East Torrance - East
Total Sales
Back to Table of Contents
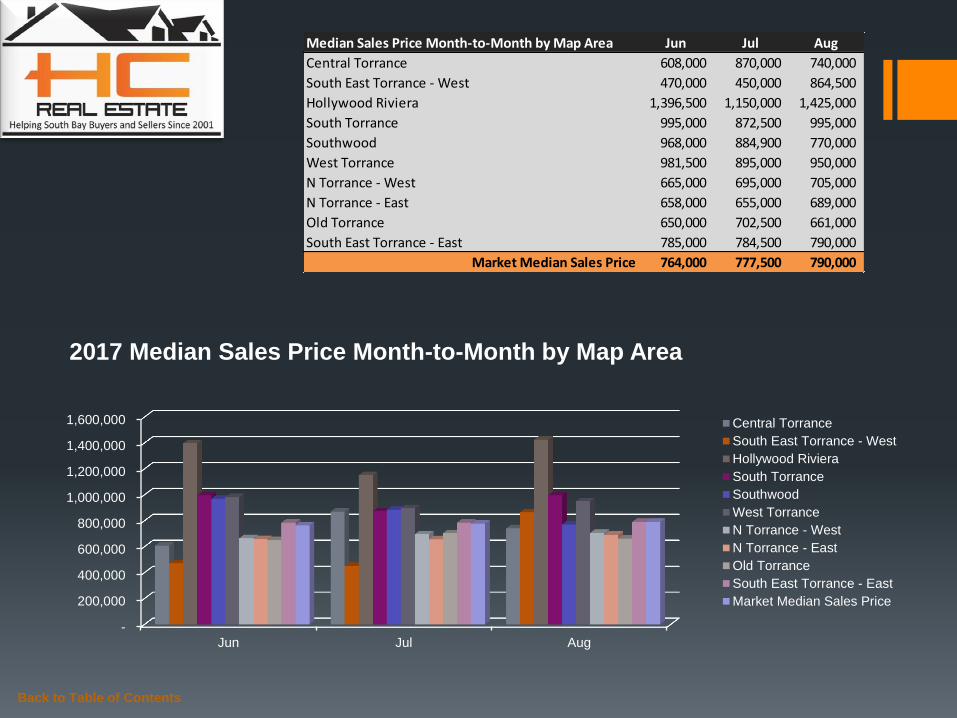
Median Sales Price Month-to-Month by Map Area Jun Jul Aug
Central Torrance 608,000 870,000 740,000
South East Torrance - West 470,000 450,000 864,500
Hollywood Riviera 1,396,500 1,150,000 1,425,000
South Torrance 995,000 872,500 995,000
Southwood 968,000 884,900 770,000
West Torrance 981,500 895,000 950,000
N Torrance - West 665,000 695,000 705,000
N Torrance - East 658,000 655,000 689,000
Old Torrance 650,000 702,500 661,000
South East Torrance - East 785,000 784,500 790,000
Market Median Sales Price 764,000 777,500 790,000
-
200,000
400,000
600,000
800,000
1,000,000
1,200,000
1,400,000
1,600,000
Jun Jul Aug
2017 Median Sales Price Month-to-Month by Map Area
Central Torrance
South East Torrance - West
Hollywood Riviera
South Torrance
Southwood
West Torrance
N Torrance - West
N Torrance - East
Old Torrance
South East Torrance - East
Market Median Sales Price

Back to Table of Contents
Median Sales Price Year-to-Year by Map Area 2015 2016 2017
Central Torrance 565,000 600,000 740,000
South East Torrance - West 839,500 625,000 864,500
Hollywood Riviera 1,192,944 1,203,500 1,425,000
South Torrance 835,000 868,500 995,000
Southwood 735,000 817,500 770,000
West Torrance 730,000 827,500 950,000
N Torrance - West 577,500 618,000 705,000
N Torrance - East 605,000 645,000 689,000
Old Torrance 585,000 635,000 661,000
South East Torrance - East 699,000 705,000 790,000
Market Median Sales Price 672,000 725,000 790,000
-
200,000
400,000
600,000
800,000
1,000,000
1,200,000
1,400,000
1,600,000
2015 2016 2017
Median Sales Price Year-to-Year by Map Area: August
Central Torrance
South East Torrance - West
Hollywood Riviera
South Torrance
Southwood
West Torrance
N Torrance - West
N Torrance - East
Old Torrance
South East Torrance - East
Market Median Sales Price
Back to Table of Contents
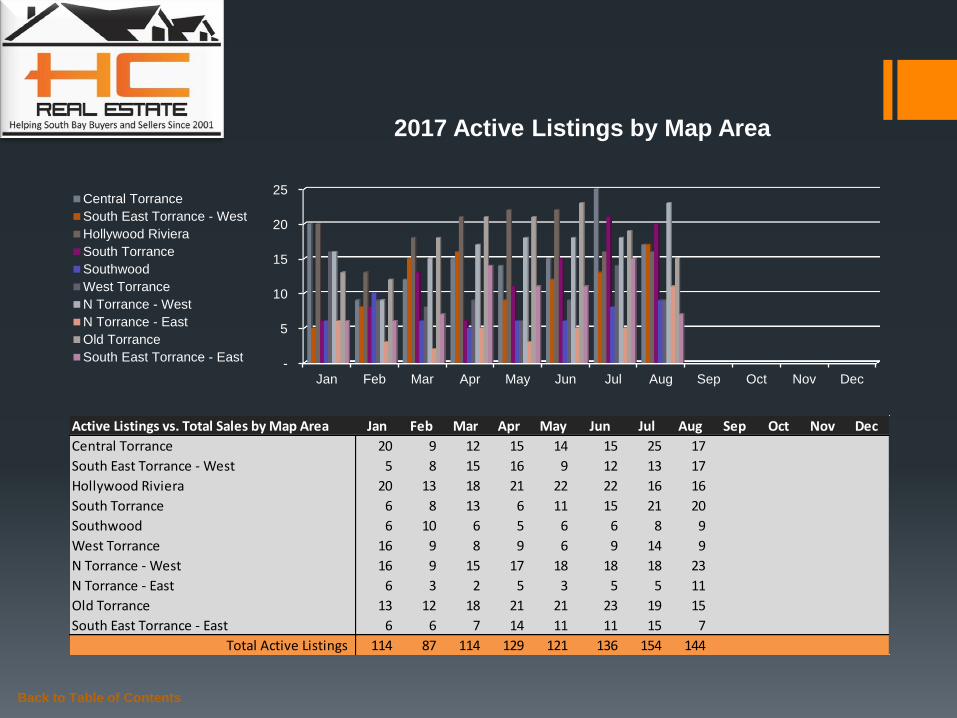
Active Listings vs. Total Sales by Map Area Jan Feb Mar Apr May Jun Jul Aug Sep Oct Nov Dec
Central Torrance 20 9 12 15 14 15 25 17
South East Torrance - West 5 8 15 16 9 12 13 17
Hollywood Riviera 20 13 18 21 22 22 16 16
South Torrance 6 8 13 6 11 15 21 20
Southwood 6 10 6 5 6 6 8 9
West Torrance 16 9 8 9 6 9 14 9
N Torrance - West 16 9 15 17 18 18 18 23
N Torrance - East 6 3 2 5 3 5 5 11
Old Torrance 13 12 18 21 21 23 19 15
South East Torrance - East 6 6 7 14 11 11 15 7
Total Active Listings 114 87 114 129 121 136 154 144
-
5
10
15
20
25
Jan Feb Mar Apr May Jun Jul Aug Sep Oct Nov Dec
2017 Active Listings by Map Area
Central Torrance
South East Torrance - West
Hollywood Riviera
South Torrance
Southwood
West Torrance
N Torrance - West
N Torrance - East
Old Torrance
South East Torrance - East
Back to Table of Contents
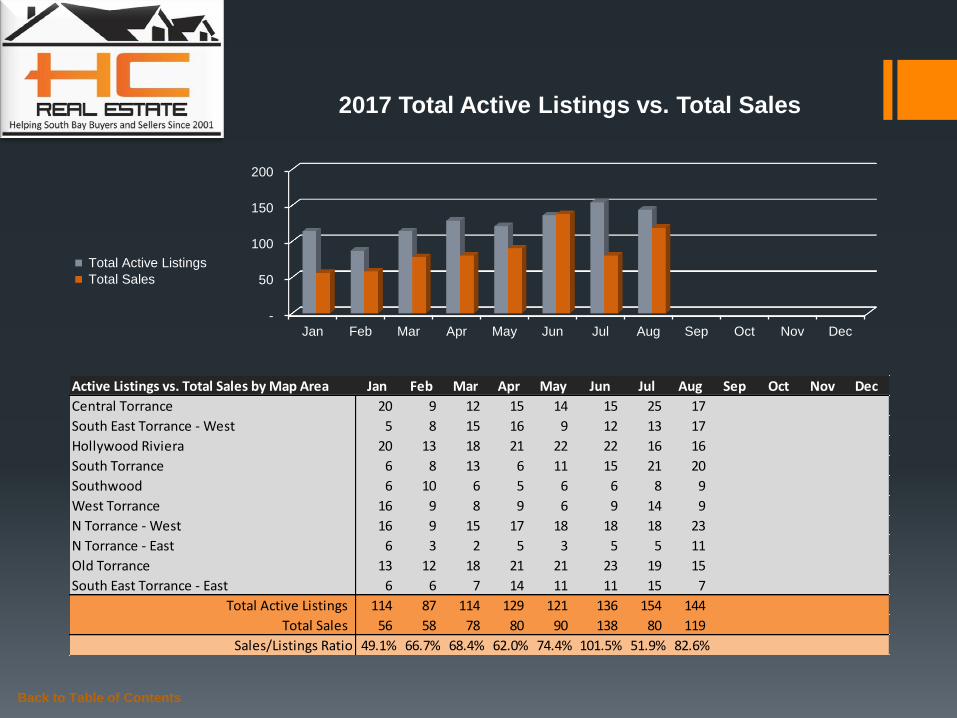
Active Listings vs. Total Sales by Map Area Jan Feb Mar Apr May Jun Jul Aug Sep Oct Nov Dec
Central Torrance 20 9 12 15 14 15 25 17
South East Torrance - West 5 8 15 16 9 12 13 17
Hollywood Riviera 20 13 18 21 22 22 16 16
South Torrance 6 8 13 6 11 15 21 20
Southwood 6 10 6 5 6 6 8 9
West Torrance 16 9 8 9 6 9 14 9
N Torrance - West 16 9 15 17 18 18 18 23
N Torrance - East 6 3 2 5 3 5 5 11
Old Torrance 13 12 18 21 21 23 19 15
South East Torrance - East 6 6 7 14 11 11 15 7
Total Active Listings 114 87 114 129 121 136 154 144
Total Sales 56 58 78 80 90 138 80 119
Sales/Listings Ratio 49.1% 66.7% 68.4% 62.0% 74.4% 101.5% 51.9% 82.6%
-
50
100
150
200
Jan Feb Mar Apr May Jun Jul Aug Sep Oct Nov Dec
2017 Total Active Listings vs. Total Sales
Total Active Listings
Total Sales
Back to Table of Contents
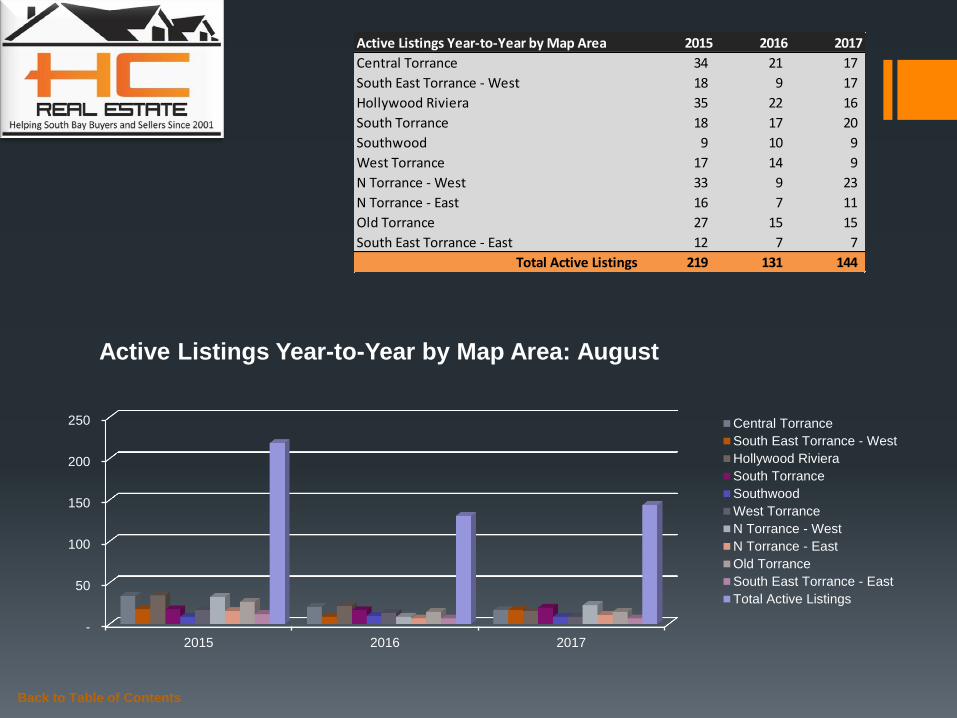
Active Listings Year-to-Year by Map Area 2015 2016 2017
Central Torrance 34 21 17
South East Torrance - West 18 9 17
Hollywood Riviera 35 22 16
South Torrance 18 17 20
Southwood 9 10 9
West Torrance 17 14 9
N Torrance - West 33 9 23
N Torrance - East 16 7 11
Old Torrance 27 15 15
South East Torrance - East 12 7 7
Total Active Listings 219 131 144
-
50
100
150
200
250
2015 2016 2017
Active Listings Year-to-Year by Map Area: August
Central Torrance
South East Torrance - West
Hollywood Riviera
South Torrance
Southwood
West Torrance
N Torrance - West
N Torrance - East
Old Torrance
South East Torrance - East
Total Active Listings
Back to Table of Contents
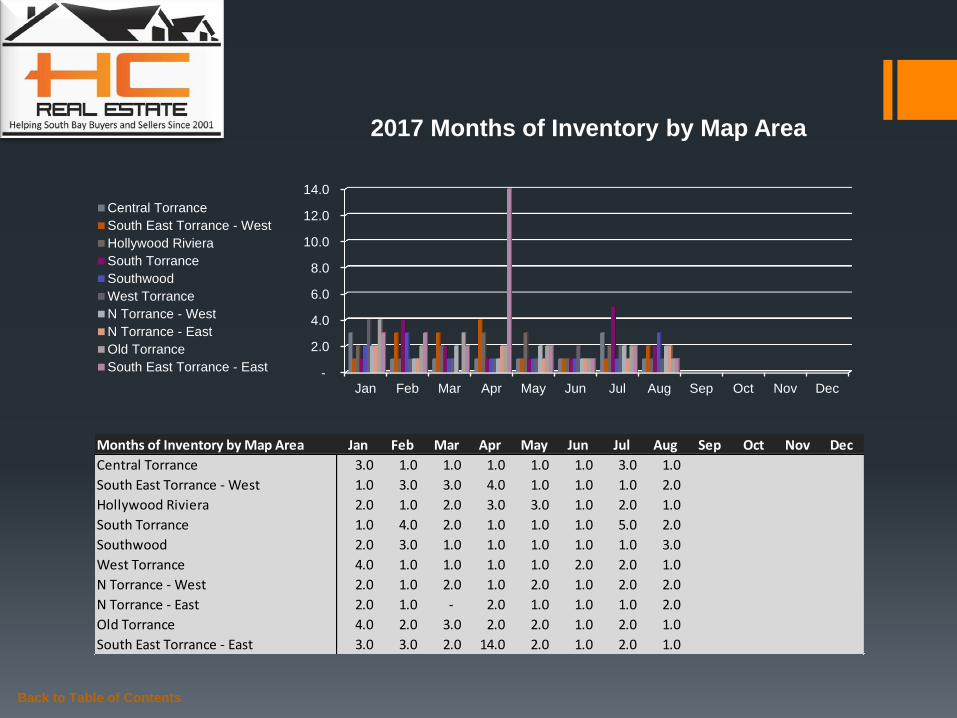
Months of Inventory by Map Area Jan Feb Mar Apr May Jun Jul Aug Sep Oct Nov Dec
Central Torrance 3.0 1.0 1.0 1.0 1.0 1.0 3.0 1.0
South East Torrance - West 1.0 3.0 3.0 4.0 1.0 1.0 1.0 2.0
Hollywood Riviera 2.0 1.0 2.0 3.0 3.0 1.0 2.0 1.0
South Torrance 1.0 4.0 2.0 1.0 1.0 1.0 5.0 2.0
Southwood 2.0 3.0 1.0 1.0 1.0 1.0 1.0 3.0
West Torrance 4.0 1.0 1.0 1.0 1.0 2.0 2.0 1.0
N Torrance - West 2.0 1.0 2.0 1.0 2.0 1.0 2.0 2.0
N Torrance - East 2.0 1.0 - 2.0 1.0 1.0 1.0 2.0
Old Torrance 4.0 2.0 3.0 2.0 2.0 1.0 2.0 1.0
South East Torrance - East 3.0 3.0 2.0 14.0 2.0 1.0 2.0 1.0
-
2.0
4.0
6.0
8.0
10.0
12.0
14.0
Jan Feb Mar Apr May Jun Jul Aug Sep Oct Nov Dec
2017 Months of Inventory by Map Area
Central Torrance
South East Torrance - West
Hollywood Riviera
South Torrance
Southwood
West Torrance
N Torrance - West
N Torrance - East
Old Torrance
South East Torrance - East
Back to Table of Contents
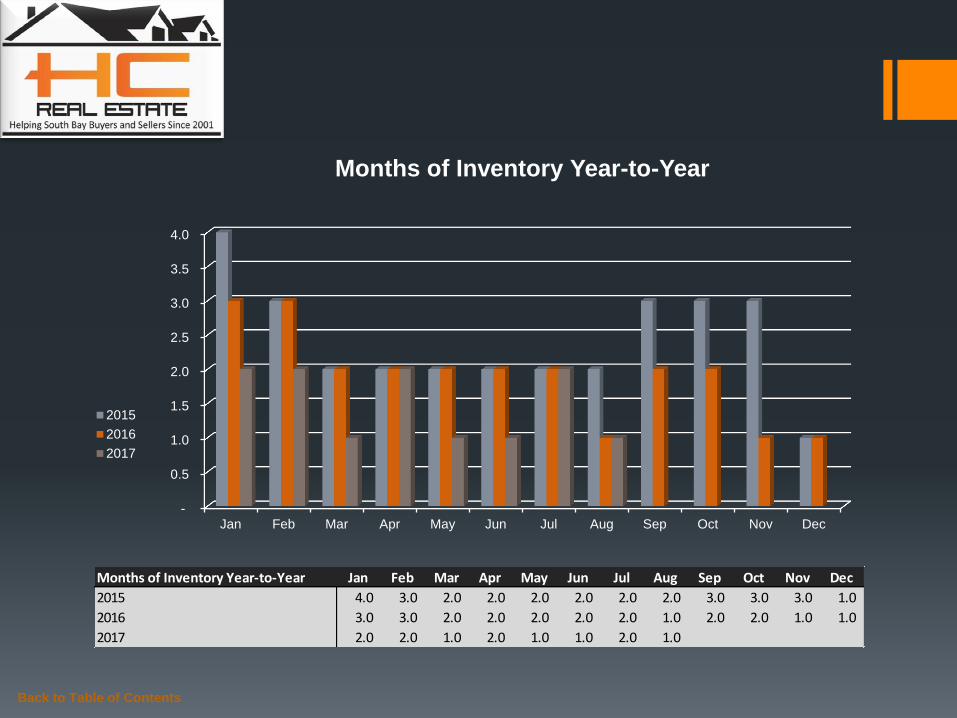
Months of Inventory Year-to-Year Jan Feb Mar Apr May Jun Jul Aug Sep Oct Nov Dec
2015 4.0 3.0 2.0 2.0 2.0 2.0 2.0 2.0 3.0 3.0 3.0 1.0
2016 3.0 3.0 2.0 2.0 2.0 2.0 2.0 1.0 2.0 2.0 1.0 1.0
2017 2.0 2.0 1.0 2.0 1.0 1.0 2.0 1.0
-
0.5
1.0
1.5
2.0
2.5
3.0
3.5
4.0
Jan Feb Mar Apr May Jun Jul Aug Sep Oct Nov Dec
Months of Inventory Year-to-Year
2015
2016
2017
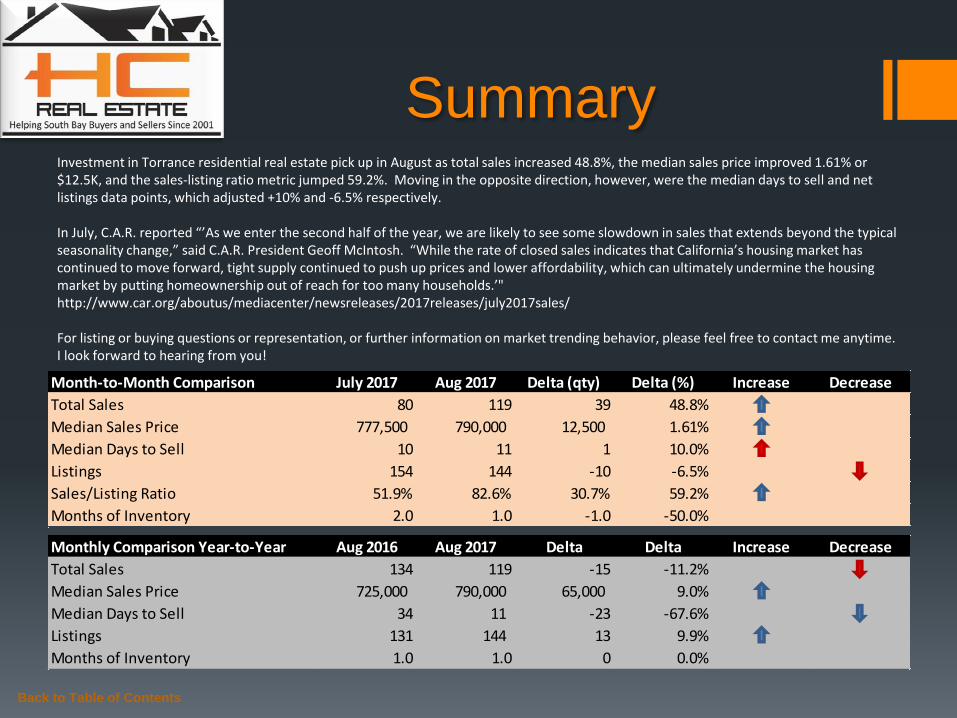
Summary Investment in Torrance residential real estate pick up in August as total sales increased 48.8%, the median sales price improved 1.61% or $12.5K, and the sales-listing ratio metric jumped 59.2%. Moving in the opposite direction, however, were the median days to sell and net listings data points, which adjusted +10% and -6.5% respectively. In July, C.A.R. reported “’As we enter the second half of the year, we are likely to see some slowdown in sales that extends beyond the typical seasonality change,” said C.A.R. President Geoff McIntosh. “While the rate of closed sales indicates that California’s housing market has continued to move forward, tight supply continued to push up prices and lower affordability, which can ultimately undermine the housing market by putting homeownership out of reach for too many households.’" http://www.car.org/aboutus/mediacenter/newsreleases/2017releases/july2017sales/ For listing or buying questions or representation, or further information on market trending behavior, please feel free to contact me anytime. I look forward to hearing from you!
Back to Table of Contents
Monthly Comparison Year-to-Year Aug 2016 Aug 2017 Delta Delta Increase Decrease
Total Sales 134 119 -15 -11.2%
Median Sales Price 725,000 790,000 65,000 9.0%
Median Days to Sell 34 11 -23 -67.6%
Listings 131 144 13 9.9%
Months of Inventory 1.0 1.0 0 0.0%
Month-to-Month Comparison July 2017 Aug 2017 Delta (qty) Delta (%) Increase Decrease
Total Sales 80 119 39 48.8%
Median Sales Price 777,500 790,000 12,500 1.61%
Median Days to Sell 10 11 1 10.0%
Listings 154 144 -10 -6.5%
Sales/Listing Ratio 51.9% 82.6% 30.7% 59.2%
Months of Inventory 2.0 1.0 -1.0 -50.0%
Back to Table of Contents
Serving South Bay Home Buyers and Sellers Since 2001
RE/MAX Top 4 Team in California – 2012
RE/MAX 100% Club - 2011
Shorewood Realtors Top 5% in Overall Sales 2001-2006, 2008-2010

The information being provided by CARETS (CLAW, CRISNet MLS, DAMLS, CRMLS, i-Tech MLS, and/or VCRDS) is for the visitor’s personal, non-commercial use and may not be used for
any purpose other than to identify prospective properties visitor may be interested in purchasing. Any information relating to a property referenced on this web site comes from the Internet
Data Exchange (IDX) program of CARETS. This web site may reference real estate listing(s) held by a brokerage firm other than the broker and/or agent who owns this web site. The accuracy
of all information, regardless of source, including but not limited to square footages and lot sizes, is deemed reliable but not guaranteed and should be personally verified through personal
inspection by and/or with the appropriate professionals.
Back to Table of Contents
Listings MLS BLOG Website
Hady Chahine
• 310-404-5361