Embed Size (px)
Citation preview
FEBRUARY 2015 | HCMC CENTRAL BUSINESS DISTRICT
CBD MARKET REPORTHO CHI MINH CITY
www.colliers.com/vietnam
TABLE OF CONTENTSHCMC CBD MARKET REPORT | JANUARY 2015
Market Highlights
OFFICE MARKET
• Market Performance
• Outlook
• Table
• Map
RETAIL MARKET
• Market Performance
• Outlook
• Map
• Table
HOTEL MARKET
• Table
• Map
• Market Performance
• Outlook
SERVICED APARTMENT
• Market Performance
• Outlook
• Table
• Map
Page
2-4
2
2
3
4
5-7
5
5
6
7
7-9
7
8
9
9
10-12
10
10
11
12
. . . . . . . . . . . . . . . . . . . . . . . . . . . . . . . . . . . . . . . . . . . . . . . . . . . . . . . . . . . . . . . .
. . . . . . . . . . . . . . . . . . . . . . . . . . . . . . . . . . . . . . . . . . . . . . . . . . . . . . . . . . . . . . .
. . . . . . . . . . . . . . . . . . . . . . . . . . . . . . . . . . . . . . . . . . . . . . . . . . . . . . . . . . . . . . .
. . . . . . . . . . . . . . . . . . . . . . . . . . . . . . . . . . . . . . . . . . . . . . . . . . . . . . . . . . . . . . .
. . . . . . . . . . . . . . . . . . . . . . . . . . . . . . . . . . . . . . . . . . . . . . . . . . . . . . . . . . . . . . .
. . . . . . . . . . . . . . . . . . . . . . . . . . . . . . . . . . . . . . . . . . . . . . . . . . . . . . . . . . . . . . .
. . . . . . . . . . . . . . . . . . . . . . . . . . . . . . . . . . . . . . . . . . . . . . . . . . . . . . . . . . . . . . .
. . . . . . . . . . . . . . . . . . . . . . . . . . . . . . . . . . . . . . . . . . . . . . . . . . . . . . . . . . . . . . .
. . . . . . . . . . . . . . . . . . . . . . . . . . . . . . . . . . . . . . . . . . . . . . . . . . . . . . . . . . . . . . .
. . . . . . . . . . . . . . . . . . . . . . . . . . . . . . . . . . . . . . . . . . . . . . . . . . . . . . . . . . . . . . .
. . . . . . . . . . . . . . . . . . . . . . . . . . . . . . . . . . . . . . . . . . . . . . . . . . . . . . . . . . . . . . .
. . . . . . . . . . . . . . . . . . . . . . . . . . . . . . . . . . . . . . . . . . . . . . . . . . . . . . . . . . . . . . .
. . . . . . . . . . . . . . . . . . . . . . . . . . . . . . . . . . . . . . . . . . . . . . . . . . . . . . . . . . . . . . .
. . . . . . . . . . . . . . . . . . . . . . . . . . . . . . . . . . . . . . . . . . . . . . . . . . . . . . . . . . . . . . .
. . . . . . . . . . . . . . . . . . . . . . . . . . . . . . . . . . . . . . . . . . . . . . . . . . . . . . . . . . . . . . .
. . . . . . . . . . . . . . . . . . . . . . . . . . . . . . . . . . . . . . . . . . . . . . . . . . . . . . . . . . . . . . .
. . . . . . . . . . . . . . . . . . . . . . . . . . . . . . . . . . . . . . . . . . . . . . . . . . . . . . . . . . . . . . .
. . . . . . . . . . . . . . . . . . . . . . . . . . . . . . . . . . . . . . . . . . . . . . . . . . . . . . . . . . . . . . .
. . . . . . . . . . . . . . . . . . . . . . . . . . . . . . . . . . . . . . . . . . . . . . . . . . . . . . . . . . . . . . .
. . . . . . . . . . . . . . . . . . . . . . . . . . . . . . . . . . . . . . . . . . . . . . . . . . . . . . . . . . . . . . .

As you focus on your customer, we focus on you.You’re an expert in knowing what your customers want—often before they do. We bring the same approach to your business.
Colliers International is built on an enterprising culture of collaboration and innovation. We provide creative, strategic solutions to all our clients.
Whether you need sales and leasing brokerage, property marketing, research and demographics, or asset and property management, we have retail professionals across Vietnam who can meet the real estate needs of retail tenants, landlords and developers.
Today’s real estate challenges require more than geographic reach and local knowledge: they require integrated expertise in market segmentation, valuation, disposition, assembly, debt and equity strategies and much more.
Our integrated platform and our experienced bring you closer to your customers.
HCMC CBD MARKET REPORT
FEBRUARY 2015 | COMMERCIAL OFFICE MARKET
P.2 | Colliers International
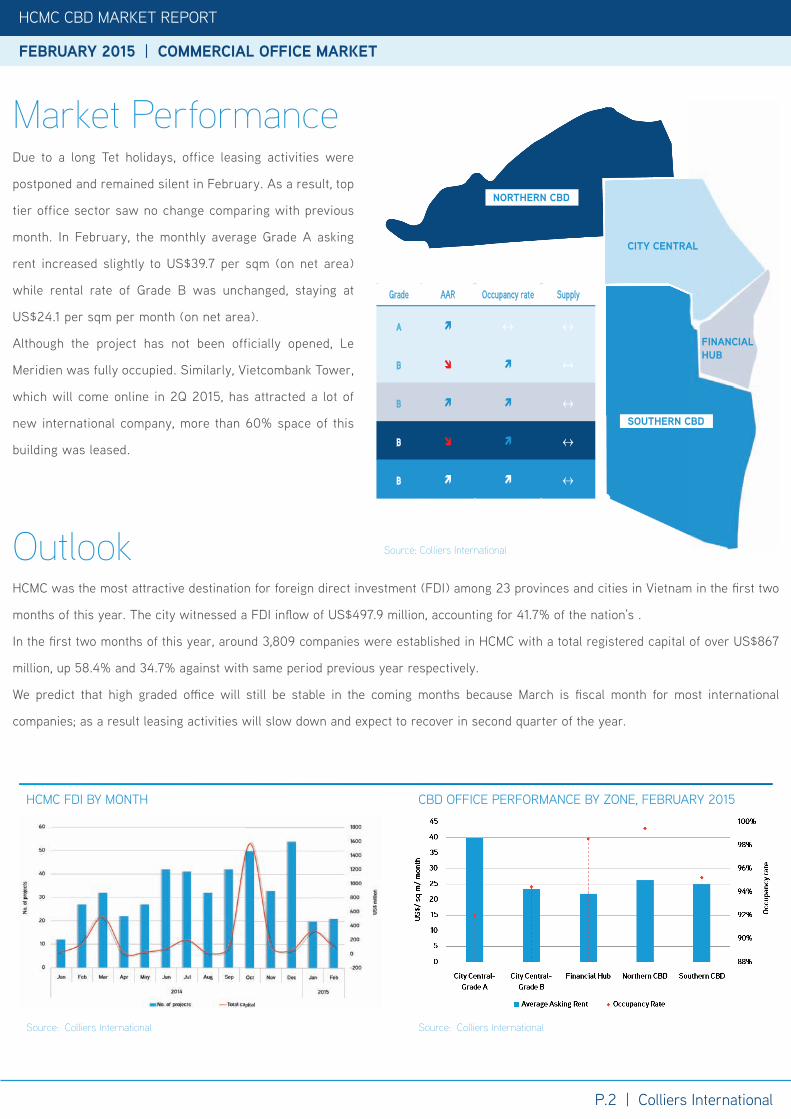
HCMC was the most attractive destination for foreign direct investment (FDI) among 23 provinces and cities in Vietnam in the fi rst two
months of this year. The city witnessed a FDI infl ow of US$497.9 million, accounting for 41.7% of the nation’s .
In the fi rst two months of this year, around 3,809 companies were established in HCMC with a total registered capital of over US$867
million, up 58.4% and 34.7% against with same period previous year respectively.
We predict that high graded offi ce will still be stable in the coming months because March is fi scal month for most international
companies; as a result leasing activities will slow down and expect to recover in second quarter of the year.
Outlook
HCMC FDI BY MONTH
Source: Colliers International
CBD OFFICE PERFORMANCE BY ZONE, FEBRUARY 2015
Source: Colliers International
Source: Colliers International
Grade AAR Occupancy rate Supply
A ↔ ↔
B ↔
B ↔
B ↔
B ↔
CITY CENTRAL
FINANCIALHUB
NORTHERN CBD
SOUTHERN CBD
Market PerformanceDue to a long Tet holidays, office leasing activities were
postponed and remained silent in February. As a result, top
tier office sector saw no change comparing with previous
month. In February, the monthly average Grade A asking
rent increased slightly to US$39.7 per sqm (on net area)
while rental rate of Grade B was unchanged, staying at
US$24.1 per sqm per month (on net area).
Although the project has not been officially opened, Le
Meridien was fully occupied. Similarly, Vietcombank Tower,
which will come online in 2Q 2015, has attracted a lot of
new international company, more than 60% space of this
building was leased.
HCMC CBD MARKET REPORT
FEBRUARY 2015 | COMMERCIAL OFFICE MARKET
P.3 | Colliers International
HCMC CBD MARKET REPORT
FEBRUARY 2015 | COMMERCIAL OFFICE MARKET
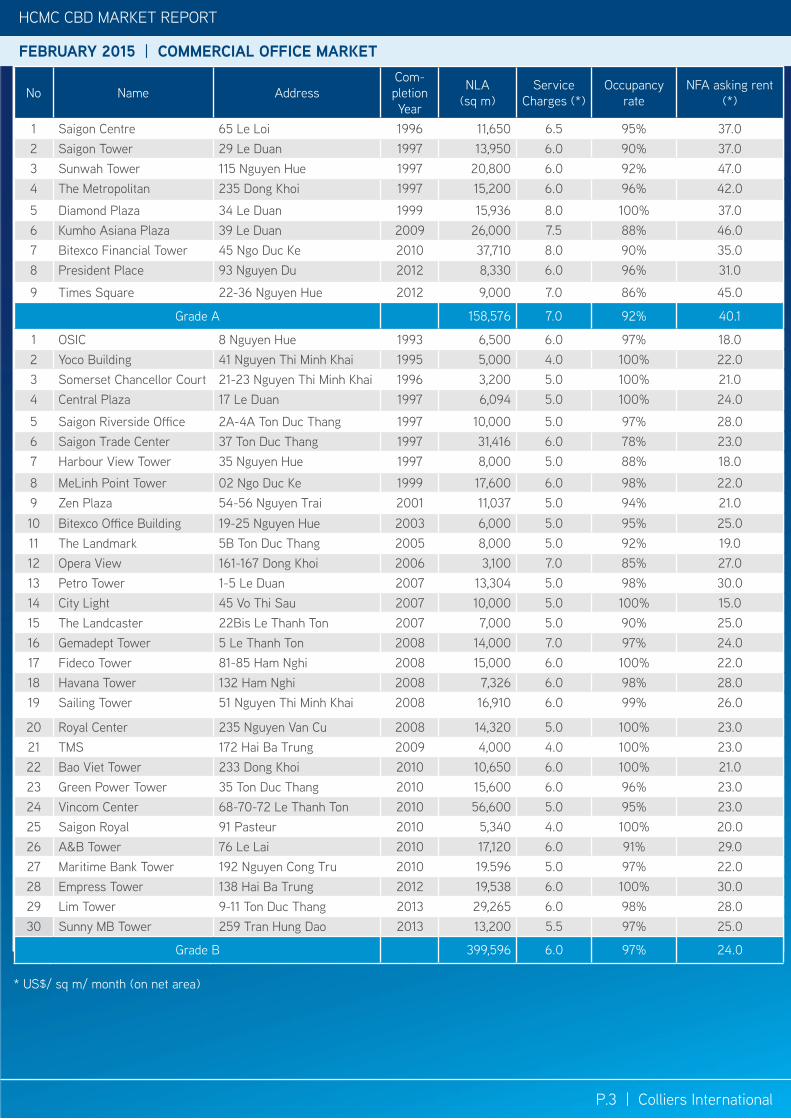
* US$/ sq m/ month (on net area)
No Name AddressCom-pletion Year
NLA (sq m)
Service Charges (*)
Occupancy rate
NFA asking rent (*)
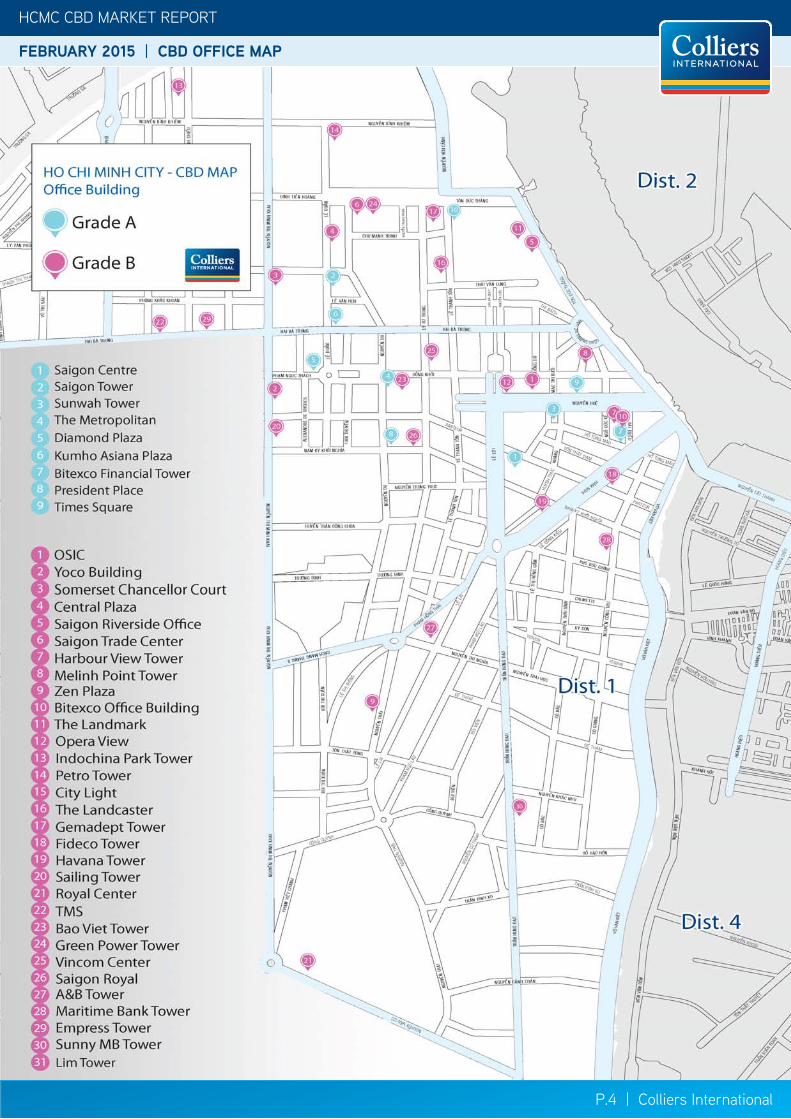
1 Saigon Centre 65 Le Loi 1996 11,650 6.5 95% 37.02 Saigon Tower 29 Le Duan 1997 13,950 6.0 90% 37.03 Sunwah Tower 115 Nguyen Hue 1997 20,800 6.0 92% 47.04 The Metropolitan 235 Dong Khoi 1997 15,200 6.0 96% 42.0
5 Diamond Plaza 34 Le Duan 1999 15,936 8.0 100% 37.06 Kumho Asiana Plaza 39 Le Duan 2009 26,000 7.5 88% 46.07 Bitexco Financial Tower 45 Ngo Duc Ke 2010 37,710 8.0 90% 35.08 President Place 93 Nguyen Du 2012 8,330 6.0 96% 31.0
9 Times Square 22-36 Nguyen Hue 2012 9,000 7.0 86% 45.0
Grade A 158,576 7.0 92% 40.1
1 OSIC 8 Nguyen Hue 1993 6,500 6.0 97% 18.02 Yoco Building 41 Nguyen Thi Minh Khai 1995 5,000 4.0 100% 22.03 Somerset Chancellor Court 21-23 Nguyen Thi Minh Khai 1996 3,200 5.0 100% 21.04 Central Plaza 17 Le Duan 1997 6,094 5.0 100% 24.0
5 Saigon Riverside Office 2A-4A Ton Duc Thang 1997 10,000 5.0 97% 28.06 Saigon Trade Center 37 Ton Duc Thang 1997 31,416 6.0 78% 23.07 Harbour View Tower 35 Nguyen Hue 1997 8,000 5.0 88% 18.0
8 MeLinh Point Tower 02 Ngo Duc Ke 1999 17,600 6.0 98% 22.09 Zen Plaza 54-56 Nguyen Trai 2001 11,037 5.0 94% 21.010 Bitexco Office Building 19-25 Nguyen Hue 2003 6,000 5.0 95% 25.011 The Landmark 5B Ton Duc Thang 2005 8,000 5.0 92% 19.012 Opera View 161-167 Dong Khoi 2006 3,100 7.0 85% 27.013 Petro Tower 1-5 Le Duan 2007 13,304 5.0 98% 30.014 City Light 45 Vo Thi Sau 2007 10,000 5.0 100% 15.015 The Landcaster 22Bis Le Thanh Ton 2007 7,000 5.0 90% 25.016 Gemadept Tower 5 Le Thanh Ton 2008 14,000 7.0 97% 24.017 Fideco Tower 81-85 Ham Nghi 2008 15,000 6.0 100% 22.018 Havana Tower 132 Ham Nghi 2008 7,326 6.0 98% 28.019 Sailing Tower 51 Nguyen Thi Minh Khai 2008 16,910 6.0 99% 26.0
20 Royal Center 235 Nguyen Van Cu 2008 14,320 5.0 100% 23.021 TMS 172 Hai Ba Trung 2009 4,000 4.0 100% 23.022 Bao Viet Tower 233 Dong Khoi 2010 10,650 6.0 100% 21.023 Green Power Tower 35 Ton Duc Thang 2010 15,600 6.0 96% 23.024 Vincom Center 68-70-72 Le Thanh Ton 2010 56,600 5.0 95% 23.025 Saigon Royal 91 Pasteur 2010 5,340 4.0 100% 20.026 A&B Tower 76 Le Lai 2010 17,120 6.0 91% 29.027 Maritime Bank Tower 192 Nguyen Cong Tru 2010 19.596 5.0 97% 22.028 Empress Tower 138 Hai Ba Trung 2012 19,538 6.0 100% 30.029 Lim Tower 9-11 Ton Duc Thang 2013 29,265 6.0 98% 28.030 Sunny MB Tower 259 Tran Hung Dao 2013 13,200 5.5 97% 25.0
Grade B 399,596 6.0 97% 24.0
P.4 | Colliers International
HCMC CBD MARKET REPORT
FEBRUARY 2015 | CBD OFFICE MAP
* US$/ sq m/ month (on net area)
HCMC CBD MARKET REPORT
FEBRUARY 2015 | RETAIL MARKET
HCMC CBD MARKET REPORT
FEBRUARY 2015 | CBD OFFICE MAP
HCMC CBD MARKET REPORT
FEBRUARY 2015 | RETAIL MARKET
P.5 | Colliers International
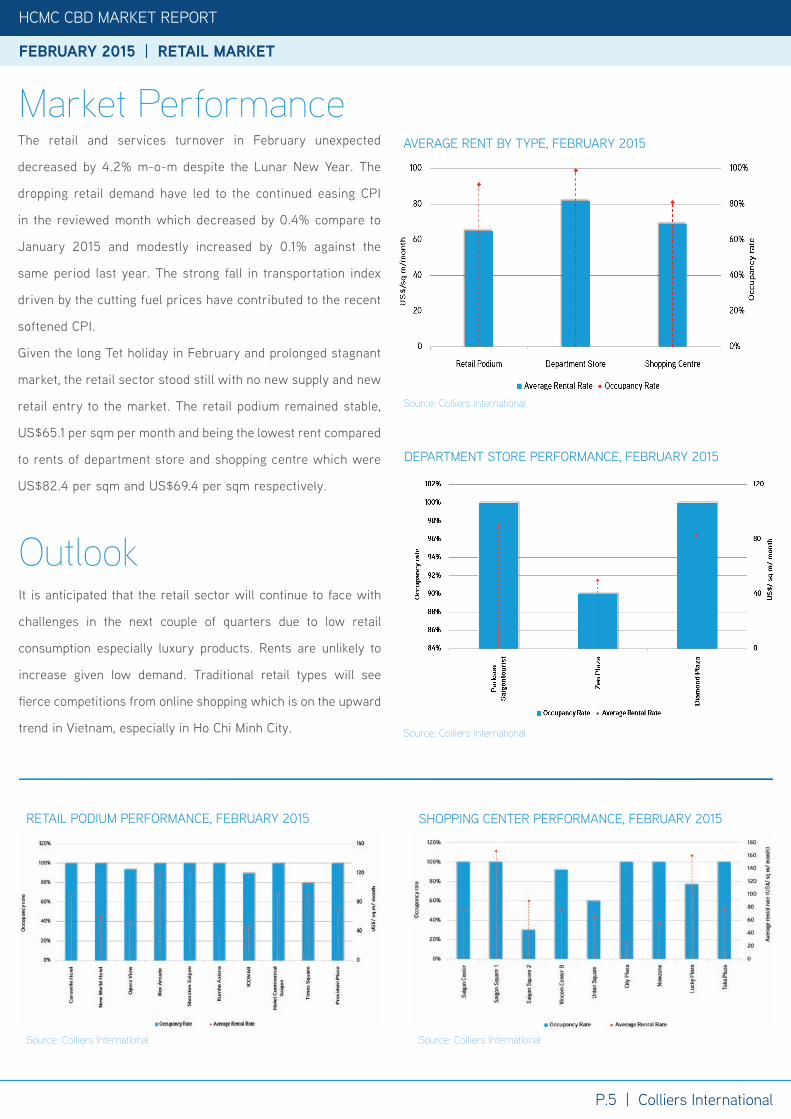
Market Performance
Outlook
SHOPPING CENTER PERFORMANCE, FEBRUARY 2015
Source: Colliers International
RETAIL PODIUM PERFORMANCE, FEBRUARY 2015
Source: Colliers International
Source: Colliers International
The retail and services turnover in February unexpected
decreased by 4.2% m-o-m despite the Lunar New Year. The
dropping retail demand have led to the continued easing CPI
in the reviewed month which decreased by 0.4% compare to
January 2015 and modestly increased by 0.1% against the
same period last year. The strong fall in transportation index
driven by the cutting fuel prices have contributed to the recent
softened CPI.
Given the long Tet holiday in February and prolonged stagnant
market, the retail sector stood still with no new supply and new
retail entry to the market. The retail podium remained stable,
US$65.1 per sqm per month and being the lowest rent compared
to rents of department store and shopping centre which were
US$82.4 per sqm and US$69.4 per sqm respectively.
AVERAGE RENT BY TYPE, FEBRUARY 2015
Source: Colliers International
It is anticipated that the retail sector will continue to face with
challenges in the next couple of quarters due to low retail
consumption especially luxury products. Rents are unlikely to
increase given low demand. Traditional retail types will see
fi erce competitions from online shopping which is on the upward
trend in Vietnam, especially in Ho Chi Minh City.
DEPARTMENT STORE PERFORMANCE, FEBRUARY 2015
P.6 | Colliers International
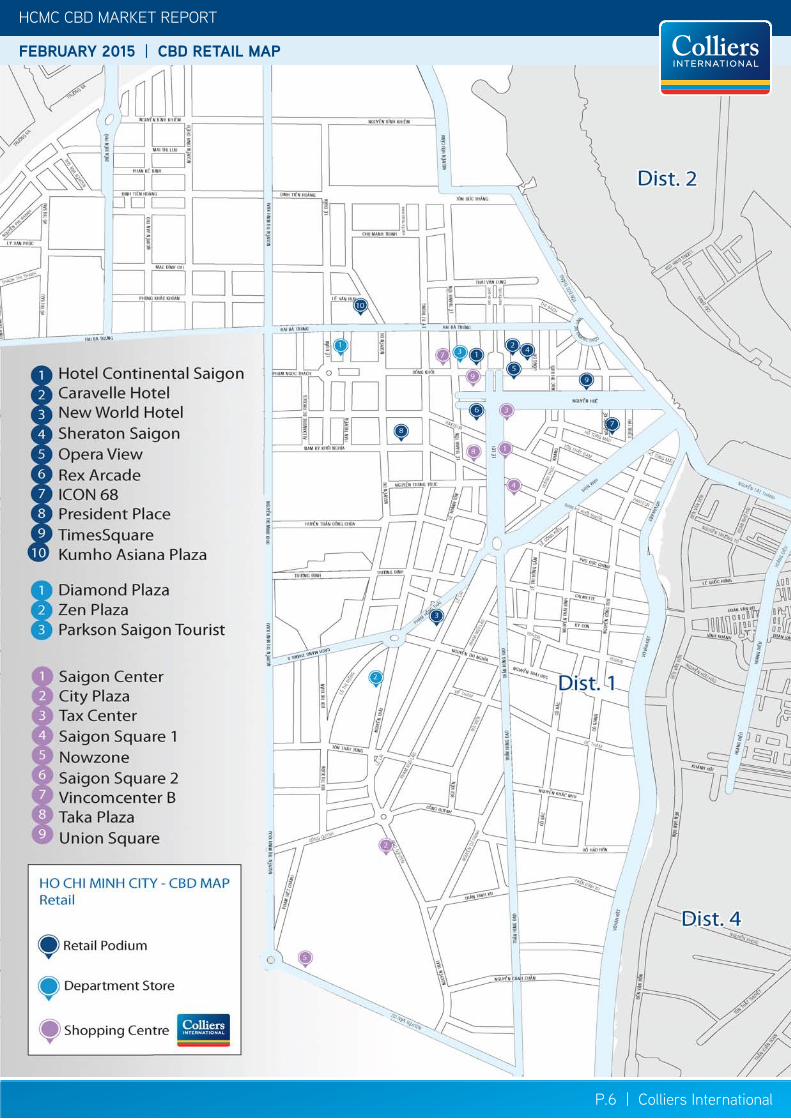
HCMC CBD MARKET REPORT
FEBRUARY 2015 | CBD RETAIL MAP
* US$/ sq m/ month (on net area)
FEBRUARY 2015 | RETAIL MARKET
FEBRUARY 2015 | HOTEL MARKET
HCMC CBD MARKET REPORT
FEBRUARY 2015 | CBD RETAIL MAP
KUMHO MONTHLY MARKET REPORTFEBRUARY 2015 | RETAIL MARKET HCMC CBD MARKET REPORT
P.7 | Colliers International
FEBRUARY 2015 | HOTEL MARKET HCMC CBD MARKET REPORT
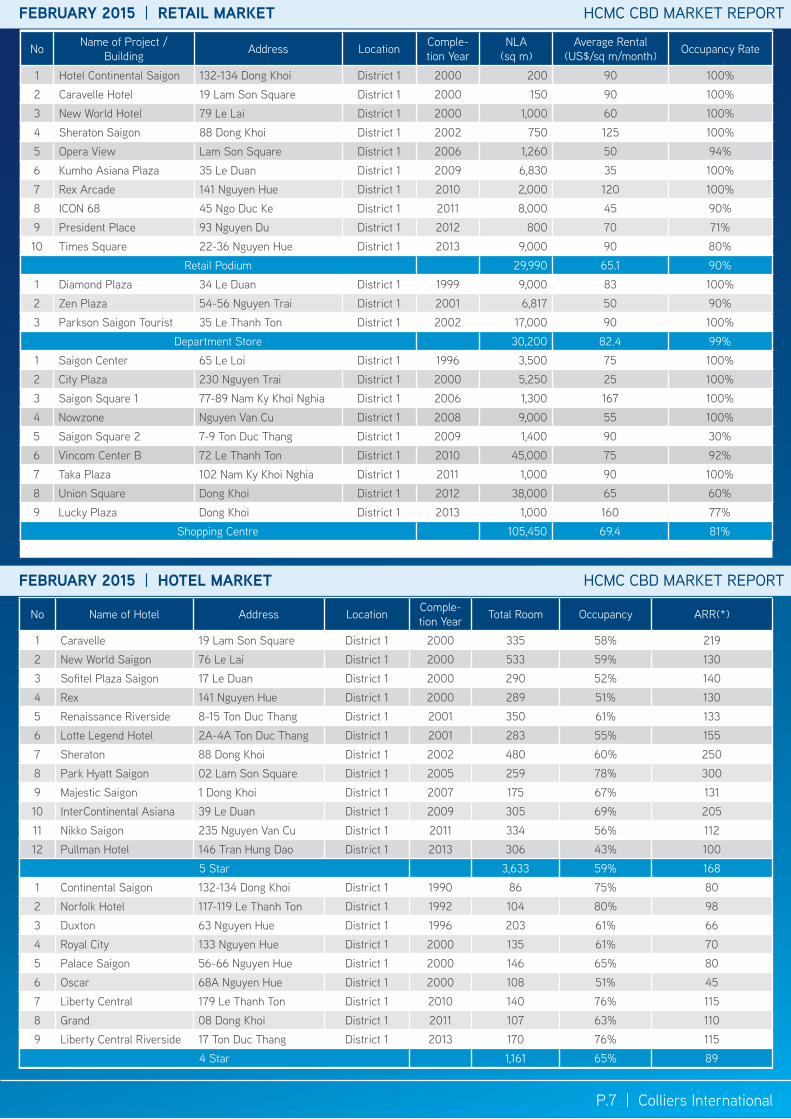
No Name of Project /Building Address Location Comple-
tion YearNLA
(sq m)Average Rental
(US$/sq m/month) Occupancy Rate
1 Hotel Continental Saigon 132-134 Dong Khoi District 1 2000 200 90 100%2 Caravelle Hotel 19 Lam Son Square District 1 2000 150 90 100%3 New World Hotel 79 Le Lai District 1 2000 1,000 60 100%4 Sheraton Saigon 88 Dong Khoi District 1 2002 750 125 100%5 Opera View Lam Son Square District 1 2006 1,260 50 94%6 Kumho Asiana Plaza 35 Le Duan District 1 2009 6,830 35 100%7 Rex Arcade 141 Nguyen Hue District 1 2010 2,000 120 100%8 ICON 68 45 Ngo Duc Ke District 1 2011 8,000 45 90%9 President Place 93 Nguyen Du District 1 2012 800 70 71%10 Times Square 22-36 Nguyen Hue District 1 2013 9,000 90 80%
Retail Podium 29,990 65.1 90%1 Diamond Plaza 34 Le Duan District 1 1999 9,000 83 100%2 Zen Plaza 54-56 Nguyen Trai District 1 2001 6,817 50 90%3 Parkson Saigon Tourist 35 Le Thanh Ton District 1 2002 17,000 90 100%
Department Store 30,200 82.4 99%1 Saigon Center 65 Le Loi District 1 1996 3,500 75 100%2 City Plaza 230 Nguyen Trai District 1 2000 5,250 25 100%3 Saigon Square 1 77-89 Nam Ky Khoi Nghia District 1 2006 1,300 167 100%4 Nowzone Nguyen Van Cu District 1 2008 9,000 55 100%5 Saigon Square 2 7-9 Ton Duc Thang District 1 2009 1,400 90 30%6 Vincom Center B 72 Le Thanh Ton District 1 2010 45,000 75 92%7 Taka Plaza 102 Nam Ky Khoi Nghia District 1 2011 1,000 90 100%8 Union Square Dong Khoi District 1 2012 38,000 65 60%9 Lucky Plaza Dong Khoi District 1 2013 1,000 160 77%
Shopping Centre 105,450 69.4 81%
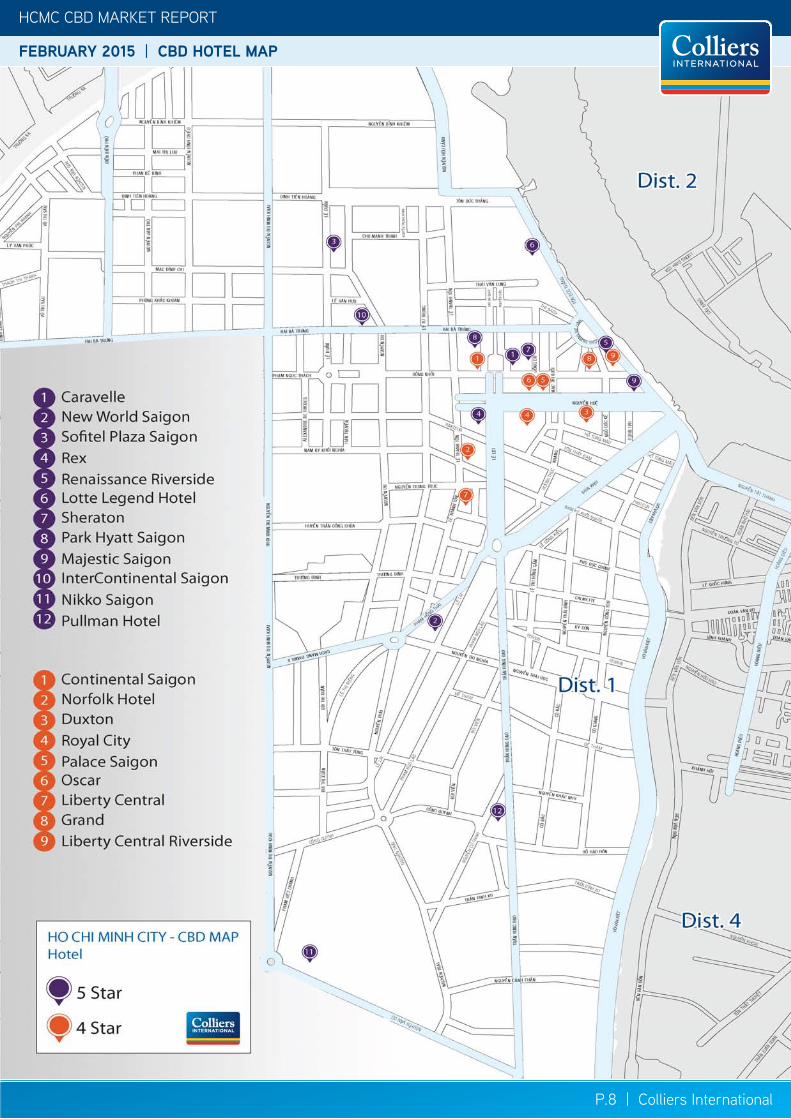
No Name of Hotel Address Location Comple-tion Year Total Room Occupancy ARR(*)
1 Caravelle 19 Lam Son Square District 1 2000 335 58% 2192 New World Saigon 76 Le Lai District 1 2000 533 59% 1303 Sofitel Plaza Saigon 17 Le Duan District 1 2000 290 52% 1404 Rex 141 Nguyen Hue District 1 2000 289 51% 1305 Renaissance Riverside 8-15 Ton Duc Thang District 1 2001 350 61% 1336 Lotte Legend Hotel 2A-4A Ton Duc Thang District 1 2001 283 55% 1557 Sheraton 88 Dong Khoi District 1 2002 480 60% 2508 Park Hyatt Saigon 02 Lam Son Square District 1 2005 259 78% 3009 Majestic Saigon 1 Dong Khoi District 1 2007 175 67% 13110 InterContinental Asiana 39 Le Duan District 1 2009 305 69% 20511 Nikko Saigon 235 Nguyen Van Cu District 1 2011 334 56% 11212 Pullman Hotel 146 Tran Hung Dao District 1 2013 306 43% 100
5 Star 3,633 59% 1681 Continental Saigon 132-134 Dong Khoi District 1 1990 86 75% 802 Norfolk Hotel 117-119 Le Thanh Ton District 1 1992 104 80% 983 Duxton 63 Nguyen Hue District 1 1996 203 61% 664 Royal City 133 Nguyen Hue District 1 2000 135 61% 705 Palace Saigon 56-66 Nguyen Hue District 1 2000 146 65% 806 Oscar 68A Nguyen Hue District 1 2000 108 51% 457 Liberty Central 179 Le Thanh Ton District 1 2010 140 76% 1158 Grand 08 Dong Khoi District 1 2011 107 63% 1109 Liberty Central Riverside 17 Ton Duc Thang District 1 2013 170 76% 115
4 Star 1,161 65% 89
P.8 | Colliers International
HCMC CBD MARKET REPORT
FEBRUARY 2015 | CBD HOTEL MAP
* US$/ sq m/ month (on net area)
HCMC CBD MARKET REPORT
FEBRUARY 2015 | CBD HOTEL MAP
P.9 | Colliers International
HCMC CBD MARKET REPORT
FEBRUARY 2015 | HOTEL MARKET
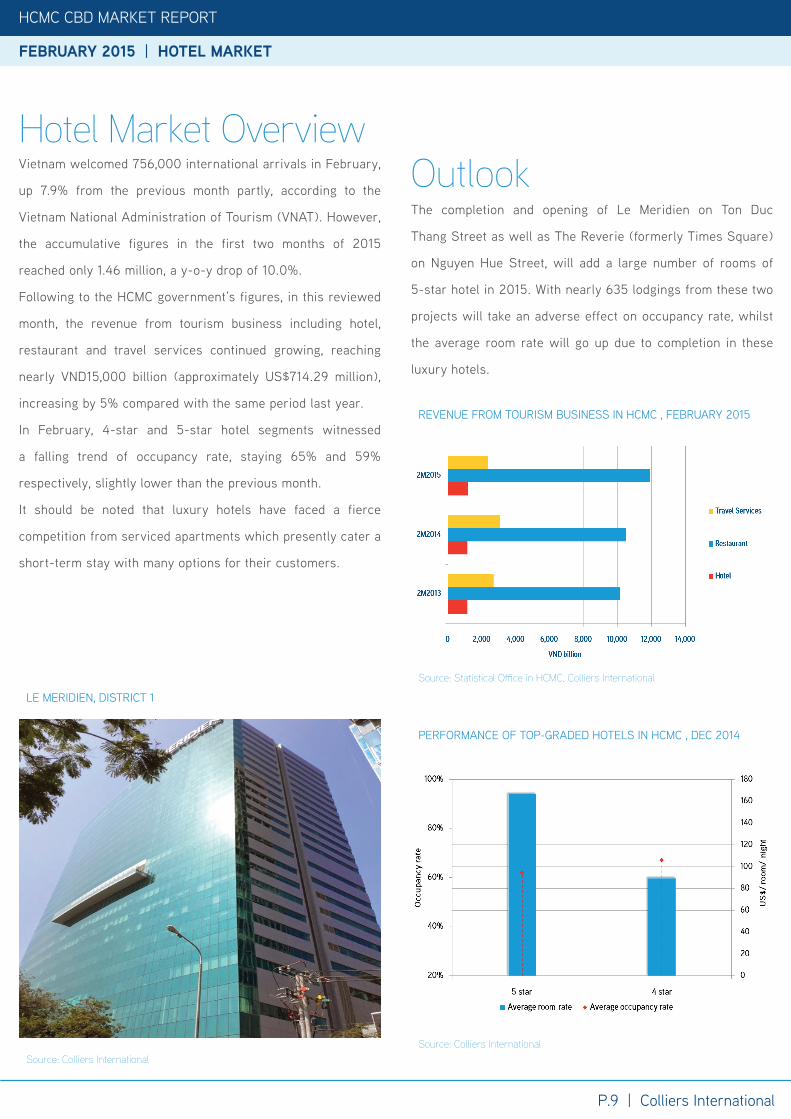
Vietnam welcomed 756,000 international arrivals in February,
up 7.9% from the previous month partly, according to the
Vietnam National Administration of Tourism (VNAT). However,
the accumulative figures in the first two months of 2015
reached only 1.46 million, a y-o-y drop of 10.0%.
Following to the HCMC government’s figures, in this reviewed
month, the revenue from tourism business including hotel,
restaurant and travel services continued growing, reaching
nearly VND15,000 billion (approximately US$714.29 million),
increasing by 5% compared with the same period last year.
In February, 4-star and 5-star hotel segments witnessed
a falling trend of occupancy rate, staying 65% and 59%
respectively, slightly lower than the previous month.
It should be noted that luxury hotels have faced a fierce
competition from serviced apartments which presently cater a
short-term stay with many options for their customers.
Hotel Market Overview
The completion and opening of Le Meridien on Ton Duc
Thang Street as well as The Reverie (formerly Times Square)
on Nguyen Hue Street, will add a large number of rooms of
5-star hotel in 2015. With nearly 635 lodgings from these two
projects will take an adverse effect on occupancy rate, whilst
the average room rate will go up due to completion in these
luxury hotels.
REVENUE FROM TOURISM BUSINESS IN HCMC , FEBRUARY 2015
Source: Statistical Offi ce in HCMC, Colliers International
Outlook
PERFORMANCE OF TOP-GRADED HOTELS IN HCMC , DEC 2014
Source: Colliers International
LE MERIDIEN, DISTRICT 1
Source: Colliers International
P.10 | Colliers International
HCMC CBD MARKET REPORT
FEBRUARY 2015 | HOTEL MARKET
HCMC CBD MARKET REPORT
FEBRUARY 2015 | SERVICED APARTMENT MARKET
FEBRUARY 2015 | SERVICED APARTMENT MARKET
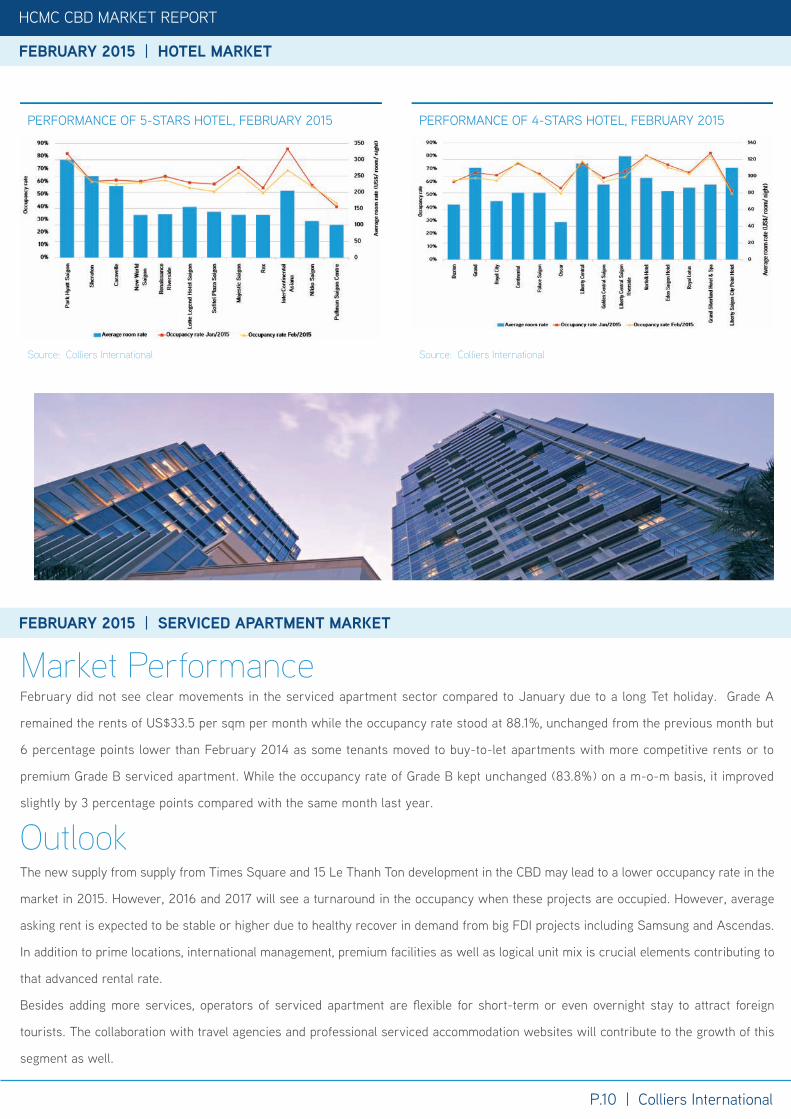
PERFORMANCE OF 5-STARS HOTEL, FEBRUARY 2015
Source: Colliers International
PERFORMANCE OF 4-STARS HOTEL, FEBRUARY 2015
Source: Colliers International
The new supply from supply from Times Square and 15 Le Thanh Ton development in the CBD may lead to a lower occupancy rate in the
market in 2015. However, 2016 and 2017 will see a turnaround in the occupancy when these projects are occupied. However, average
asking rent is expected to be stable or higher due to healthy recover in demand from big FDI projects including Samsung and Ascendas.
In addition to prime locations, international management, premium facilities as well as logical unit mix is crucial elements contributing to
that advanced rental rate.
Besides adding more services, operators of serviced apartment are fl exible for short-term or even overnight stay to attract foreign
tourists. The collaboration with travel agencies and professional serviced accommodation websites will contribute to the growth of this
segment as well.
Outlook
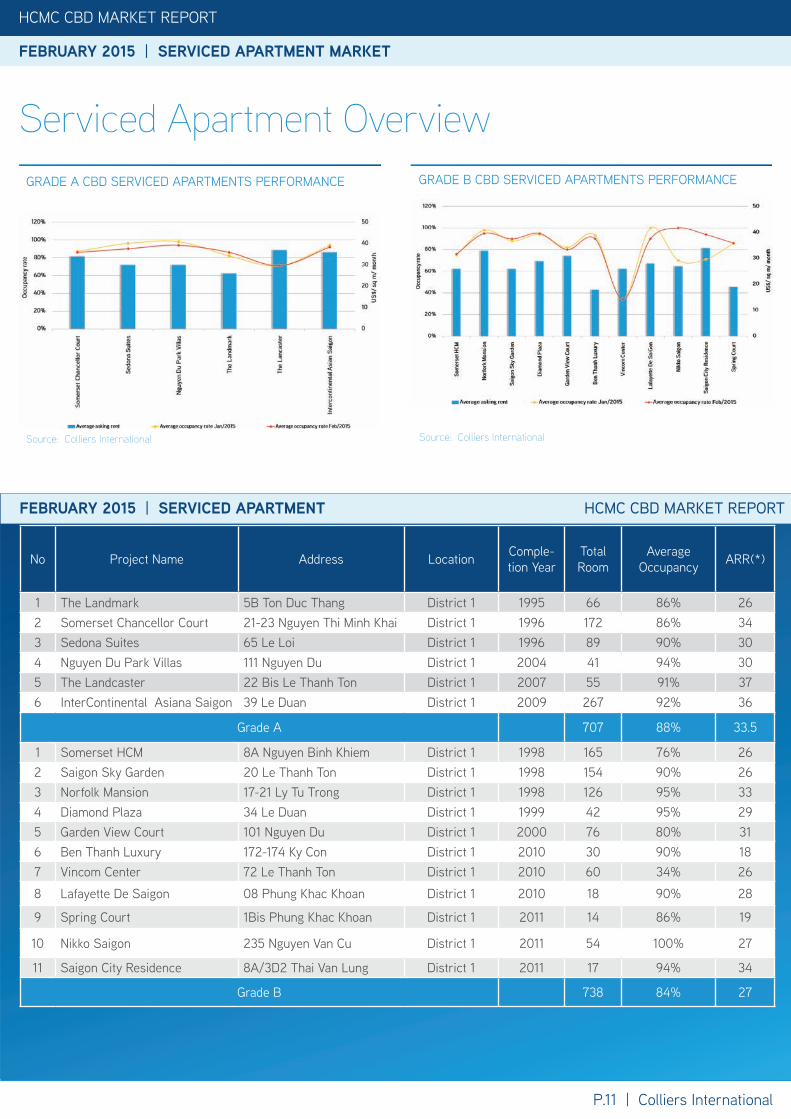
February did not see clear movements in the serviced apartment sector compared to January due to a long Tet holiday. Grade A
remained the rents of US$33.5 per sqm per month while the occupancy rate stood at 88.1%, unchanged from the previous month but
6 percentage points lower than February 2014 as some tenants moved to buy-to-let apartments with more competitive rents or to
premium Grade B serviced apartment. While the occupancy rate of Grade B kept unchanged (83.8%) on a m-o-m basis, it improved
slightly by 3 percentage points compared with the same month last year.
Market Performance
HCMC CBD MARKET REPORT
FEBRUARY 2015 | HOTEL MARKET
P.11 | Colliers International
HCMC CBD MARKET REPORT
* US$/sq m/month** Not including VAT*** Buildings are sorted by Year of Completion
FEBRUARY 2015 | SERVICED APARTMENT MARKET
FEBRUARY 2015 | SERVICED APARTMENT HCMC CBD MARKET REPORT
FEBRUARY 2015 | SERVICED APARTMENT MARKET
Serviced Apartment OverviewGRADE A CBD SERVICED APARTMENTS PERFORMANCE
Source: Colliers International
GRADE B CBD SERVICED APARTMENTS PERFORMANCE
Source: Colliers International
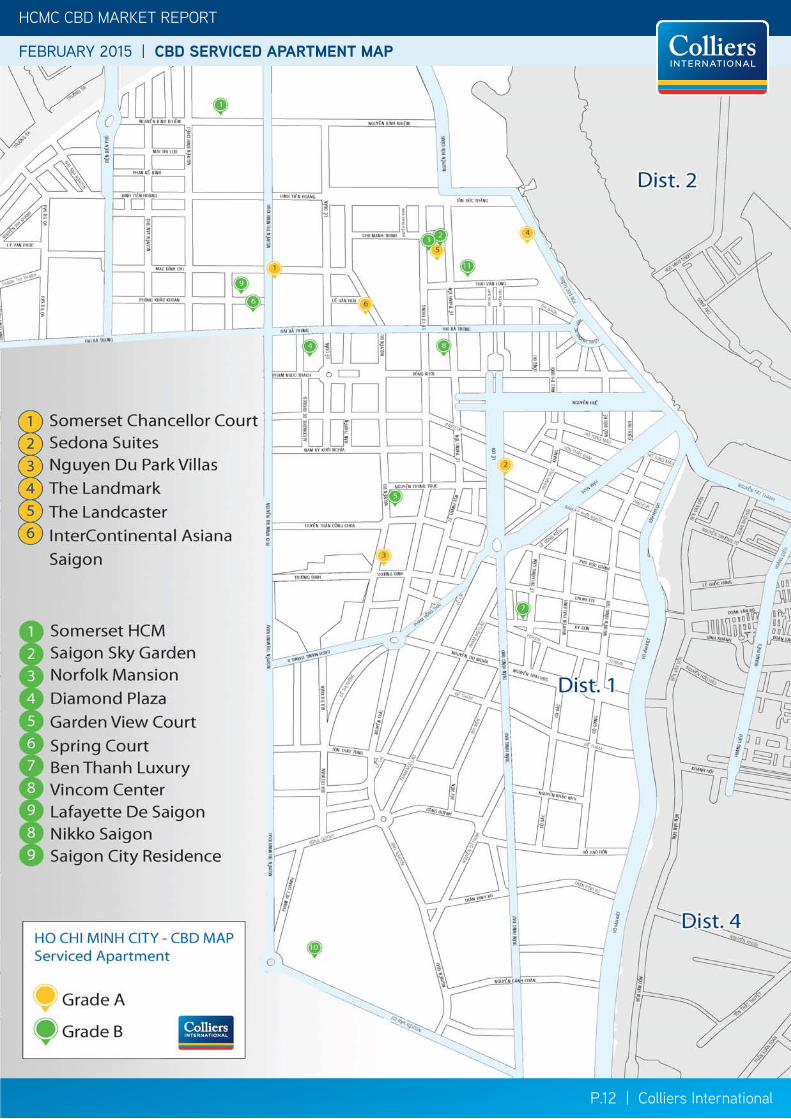
No Project Name Address Location Comple-tion Year
Total Room
Average Occupancy ARR(*)
1 The Landmark 5B Ton Duc Thang District 1 1995 66 86% 262 Somerset Chancellor Court 21-23 Nguyen Thi Minh Khai District 1 1996 172 86% 343 Sedona Suites 65 Le Loi District 1 1996 89 90% 304 Nguyen Du Park Villas 111 Nguyen Du District 1 2004 41 94% 305 The Landcaster 22 Bis Le Thanh Ton District 1 2007 55 91% 376 InterContinental Asiana Saigon 39 Le Duan District 1 2009 267 92% 36
Grade A 707 88% 33.5
1 Somerset HCM 8A Nguyen Binh Khiem District 1 1998 165 76% 262 Saigon Sky Garden 20 Le Thanh Ton District 1 1998 154 90% 263 Norfolk Mansion 17-21 Ly Tu Trong District 1 1998 126 95% 334 Diamond Plaza 34 Le Duan District 1 1999 42 95% 295 Garden View Court 101 Nguyen Du District 1 2000 76 80% 316 Ben Thanh Luxury 172-174 Ky Con District 1 2010 30 90% 187 Vincom Center 72 Le Thanh Ton District 1 2010 60 34% 26
8 Lafayette De Saigon 08 Phung Khac Khoan District 1 2010 18 90% 28
9 Spring Court 1Bis Phung Khac Khoan District 1 2011 14 86% 19
10 Nikko Saigon 235 Nguyen Van Cu District 1 2011 54 100% 27
11 Saigon City Residence 8A/3D2 Thai Van Lung District 1 2011 17 94% 34
Grade B 738 84% 27
HCMC CBD MARKET REPORT
FEBRUARY 2015 | CBD SERVICED APARTMENT MAP
P.12 | Colliers International
HCMC CBD MARKET REPORT
FEBRUARY 2015 | CBD SERVICED APARTMENT MAP
P.12 | Colliers International
HCMC CBD MARKET REPORT | FEBRUARY 2015
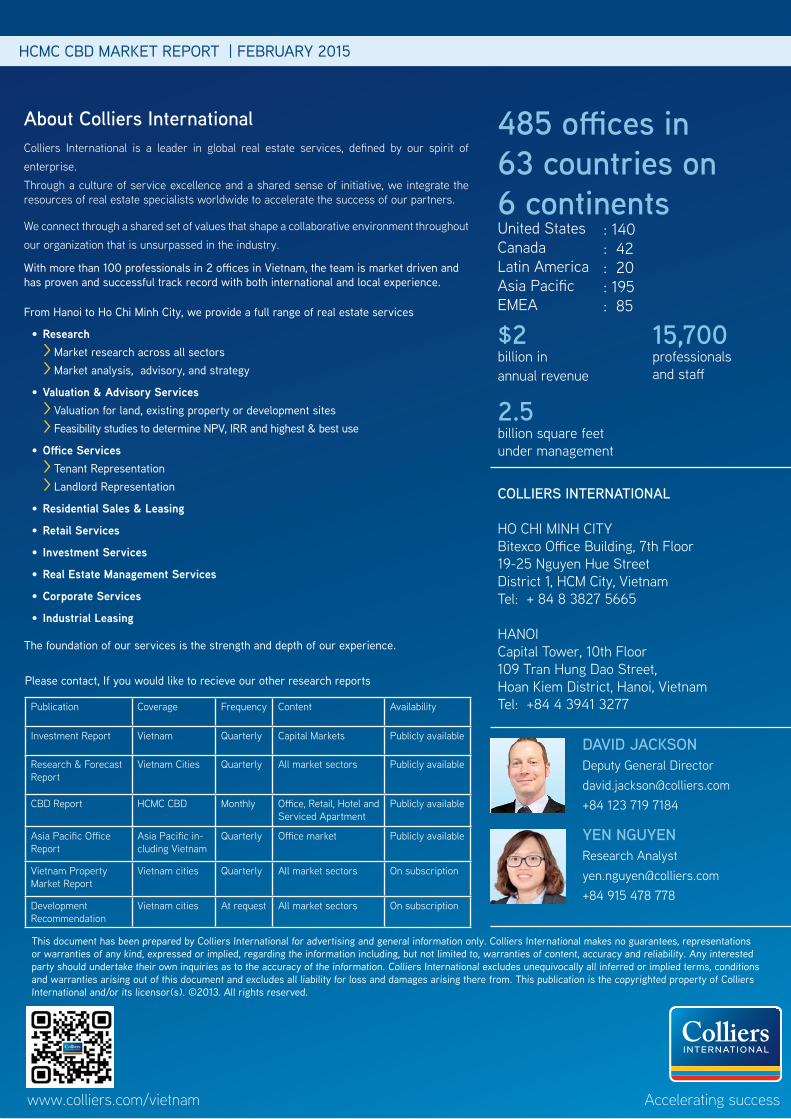
With more than 100 professionals in 2 offices in Vietnam, the team is market driven and has proven and successful track record with both international and local experience.
From Hanoi to Ho Chi Minh City, we provide a full range of real estate services
•Research > Market research across all sectors > Market analysis, advisory, and strategy
•Valuation & Advisory Services > Valuation for land, existing property or development sites > Feasibility studies to determine NPV, IRR and highest & best use
•Office Services > Tenant Representation > Landlord Representation
•Residential Sales & Leasing
•Retail Services
• Investment Services
•Real Estate Management Services
•Corporate Services
• Industrial Leasing
The foundation of our services is the strength and depth of our experience.
COLLIERS INTERNATIONAL
HO CHI MINH CITYBitexco Office Building, 7th Floor19-25 Nguyen Hue StreetDistrict 1, HCM City, VietnamTel: + 84 8 3827 5665
HANOICapital Tower, 10th Floor109 Tran Hung Dao Street, Hoan Kiem District, Hanoi, VietnamTel: +84 4 3941 3277
485 offices in63 countries on6 continentsUnited StatesCanadaLatin AmericaAsia PacificEMEA
Accelerating success
: 140: 42: 20: 195: 85
DAVID JACKSONDeputy General [email protected]+84 123 719 7184
YEN NGUYENResearch [email protected]+84 915 478 778
About Colliers InternationalColliers International is a leader in global real estate services, defined by our spirit of enterprise.Through a culture of service excellence and a shared sense of initiative, we integrate the resources of real estate specialists worldwide to accelerate the success of our partners.
We connect through a shared set of values that shape a collaborative environment throughout our organization that is unsurpassed in the industry.
Publication Coverage Frequency Content Availability
Investment Report Vietnam Quarterly Capital Markets Publicly available
Research & Forecast Report
Vietnam Cities Quarterly All market sectors Publicly available
CBD Report HCMC CBD Monthly Office, Retail, Hotel and Serviced Apartment
Publicly available
Asia Pacific Office Report
Asia Pacific in-cluding Vietnam
Quarterly Office market Publicly available
Vietnam Property Market Report
Vietnam cities Quarterly All market sectors On subscription
Development Recommendation
Vietnam cities At request All market sectors On subscription
$2billion in annual revenue
2.5billion square feet under management
15,700professionalsand staff
www.colliers.com/vietnam
Please contact, If you would like to recieve our other research reports
This document has been prepared by Colliers International for advertising and general information only. Colliers International makes no guarantees, representations or warranties of any kind, expressed or implied, regarding the information including, but not limited to, warranties of content, accuracy and reliability. Any interested party should undertake their own inquiries as to the accuracy of the information. Colliers International excludes unequivocally all inferred or implied terms, conditions and warranties arising out of this document and excludes all liability for loss and damages arising there from. This publication is the copyrighted property of Colliers International and/or its licensor(s). ©2013. All rights reserved.