Embed Size (px)
Citation preview
FEBRUARY 2014 | HCMC CENTRAL BUSINESS DISTRICT
CBD MARKET REpoRTHO CHI MINH CITY
www.colliers.com/vietnam
TABLE oF CoNTENTSHCMC CBD MARKET REpoRT | FEBRUARY 2014
Market Highlights
oFFICE MARKET
• Market overview
• Market performance
• outlook
• Table
RETAIL MARKET
• Market overview
• Market performance
• outlook
• Table
HoTEL MARKET
• Market overview
• Market performance
• outlook
• Table
SERVICED ApARTMENT
• Market performance
• outlook
• Table
CoNTACTS
page
2-4
2
3
3
4
4-6
4
4
5
6
6-8
7
7
8
8
8-10
8
9
9
10
. . . . . . . . . . . . . . . . . . . . . . . . . . . . . . . . . . . . . . . . . . . . . . . . . . . . . . . . . . . . . . . .
. . . . . . . . . . . . . . . . . . . . . . . . . . . . . . . . . . . . . . . . . . . . . . . . . . . . . . . . . . . . . . .
. . . . . . . . . . . . . . . . . . . . . . . . . . . . . . . . . . . . . . . . . . . . . . . . . . . . . . . . . . . . . . .
. . . . . . . . . . . . . . . . . . . . . . . . . . . . . . . . . . . . . . . . . . . . . . . . . . . . . . . . . . . . . . .
. . . . . . . . . . . . . . . . . . . . . . . . . . . . . . . . . . . . . . . . . . . . . . . . . . . . . . . . . . . . . . .
. . . . . . . . . . . . . . . . . . . . . . . . . . . . . . . . . . . . . . . . . . . . . . . . . . . . . . . . . . . . . . .
. . . . . . . . . . . . . . . . . . . . . . . . . . . . . . . . . . . . . . . . . . . . . . . . . . . . . . . . . . . . . . .
. . . . . . . . . . . . . . . . . . . . . . . . . . . . . . . . . . . . . . . . . . . . . . . . . . . . . . . . . . . . . . .
. . . . . . . . . . . . . . . . . . . . . . . . . . . . . . . . . . . . . . . . . . . . . . . . . . . . . . . . . . . . . . .
. . . . . . . . . . . . . . . . . . . . . . . . . . . . . . . . . . . . . . . . . . . . . . . . . . . . . . . . . . . . . . .
. . . . . . . . . . . . . . . . . . . . . . . . . . . . . . . . . . . . . . . . . . . . . . . . . . . . . . . . . . . . . . .
. . . . . . . . . . . . . . . . . . . . . . . . . . . . . . . . . . . . . . . . . . . . . . . . . . . . . . . . . . . . . . .
. . . . . . . . . . . . . . . . . . . . . . . . . . . . . . . . . . . . . . . . . . . . . . . . . . . . . . . . . . . . . . .
. . . . . . . . . . . . . . . . . . . . . . . . . . . . . . . . . . . . . . . . . . . . . . . . . . . . . . . . . . . . . . .
. . . . . . . . . . . . . . . . . . . . . . . . . . . . . . . . . . . . . . . . . . . . . . . . . . . . . . . . . . . . . . .
. . . . . . . . . . . . . . . . . . . . . . . . . . . . . . . . . . . . . . . . . . . . . . . . . . . . . . . . . . . . . . .
. . . . . . . . . . . . . . . . . . . . . . . . . . . . . . . . . . . . . . . . . . . . . . . . . . . . . . . . . . . . . . .
. . . . . . . . . . . . . . . . . . . . . . . . . . . . . . . . . . . . . . . . . . . . . . . . . . . . . . . . . . . . . . .
. . . . . . . . . . . . . . . . . . . . . . . . . . . . . . . . . . . . . . . . . . . . . . . . . . . . . . . . . . . . . . .
. . . . . . . . . . . . . . . . . . . . . . . . . . . . . . . . . . . . . . . . . . . . . . . . . . . . . . . . . . . . . . .
HCMC CBD MARKET REpoRT
FEBRUARY 2014 | COMMERCIAL OFFICE MARKET
HCMC CBD MARKET REpoRT
FEBRUARY 2014 | COMMERCIAL OFFICE MARKET
p.2 | Colliers International
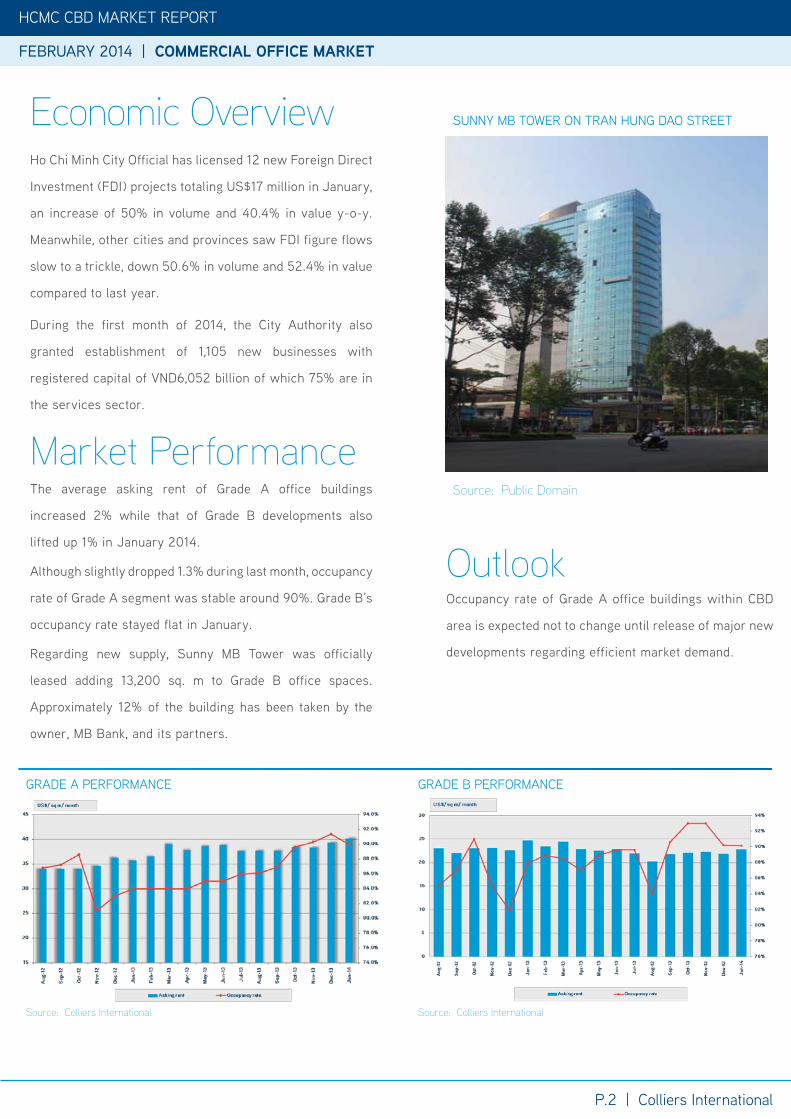
The average asking rent of Grade A office buildings
increased 2% while that of Grade B developments also
lifted up 1% in January 2014.
Although slightly dropped 1.3% during last month, occupancy
rate of Grade A segment was stable around 90%. Grade B’s
occupancy rate stayed flat in January.
Regarding new supply, Sunny MB Tower was officially
leased adding 13,200 sq. m to Grade B office spaces.
Approximately 12% of the building has been taken by the
owner, MB Bank, and its partners.
Outlookoccupancy rate of Grade A office buildings within CBD
area is expected not to change until release of major new
developments regarding efficient market demand.
Market Performance
GRADE A pERFoRMANCE
Source: Colliers International
GRADE B pERFoRMANCE
Source: Colliers International
SUNNY MB ToWER oN TRAN HUNG DAo STREET
Source: Public Domain
Economic OverviewHo Chi Minh City official has licensed 12 new Foreign Direct
Investment (FDI) projects totaling US$17 million in January,
an increase of 50% in volume and 40.4% in value y-o-y.
Meanwhile, other cities and provinces saw FDI figure flows
slow to a trickle, down 50.6% in volume and 52.4% in value
compared to last year.
During the first month of 2014, the City Authority also
granted establishment of 1,105 new businesses with
registered capital of VND6,052 billion of which 75% are in
the services sector.
p.3 | Colliers International
HCMC CBD MARKET REpoRT
FEBRUARY 2014 | COMMERCIAL OFFICE MARKET
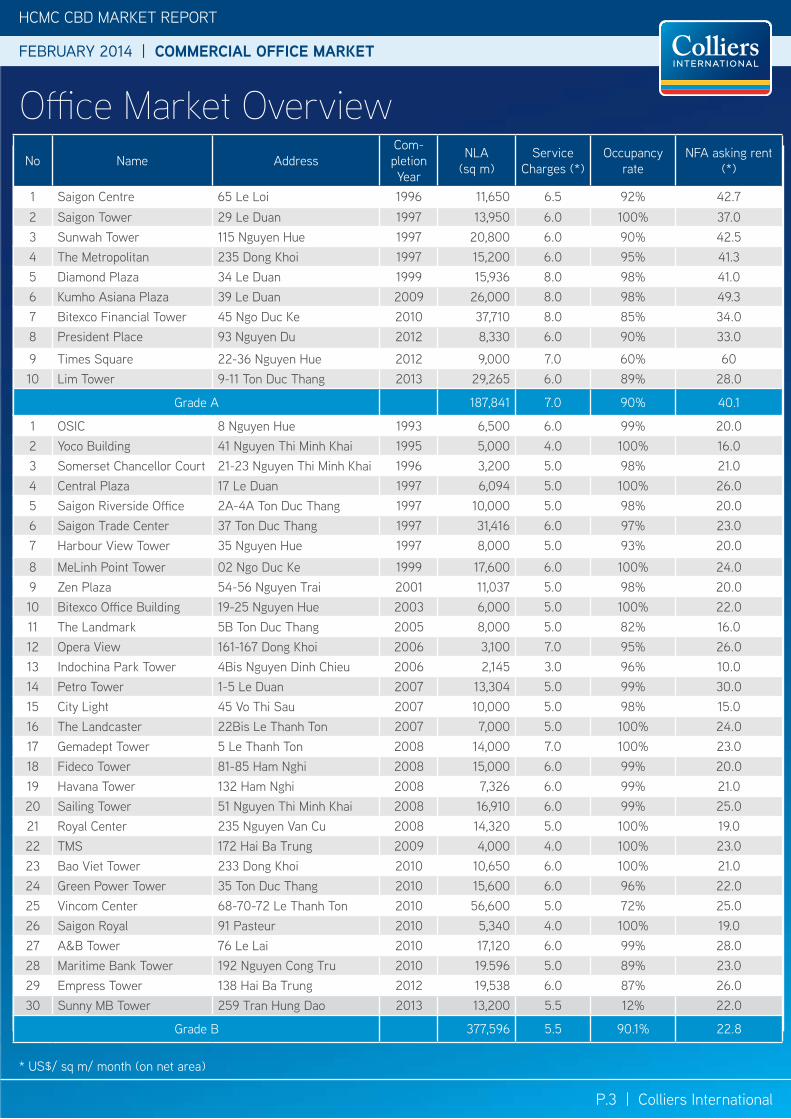
No Name AddressCom-pletion Year
NLA (sq m)
Service Charges (*)
occupancy rate
NFA asking rent (*)
1 Saigon Centre 65 Le Loi 1996 11,650 6.5 92% 42.72 Saigon Tower 29 Le Duan 1997 13,950 6.0 100% 37.03 Sunwah Tower 115 Nguyen Hue 1997 20,800 6.0 90% 42.54 The Metropolitan 235 Dong Khoi 1997 15,200 6.0 95% 41.35 Diamond plaza 34 Le Duan 1999 15,936 8.0 98% 41.06 Kumho Asiana plaza 39 Le Duan 2009 26,000 8.0 98% 49.37 Bitexco Financial Tower 45 Ngo Duc Ke 2010 37,710 8.0 85% 34.08 president place 93 Nguyen Du 2012 8,330 6.0 90% 33.0
9 Times Square 22-36 Nguyen Hue 2012 9,000 7.0 60% 6010 Lim Tower 9-11 Ton Duc Thang 2013 29,265 6.0 89% 28.0
Grade A 187,841 7.0 90% 40.1
1 oSIC 8 Nguyen Hue 1993 6,500 6.0 99% 20.02 Yoco Building 41 Nguyen Thi Minh Khai 1995 5,000 4.0 100% 16.03 Somerset Chancellor Court 21-23 Nguyen Thi Minh Khai 1996 3,200 5.0 98% 21.04 Central plaza 17 Le Duan 1997 6,094 5.0 100% 26.05 Saigon Riverside office 2A-4A Ton Duc Thang 1997 10,000 5.0 98% 20.06 Saigon Trade Center 37 Ton Duc Thang 1997 31,416 6.0 97% 23.07 Harbour View Tower 35 Nguyen Hue 1997 8,000 5.0 93% 20.0
8 MeLinh point Tower 02 Ngo Duc Ke 1999 17,600 6.0 100% 24.09 Zen plaza 54-56 Nguyen Trai 2001 11,037 5.0 98% 20.010 Bitexco office Building 19-25 Nguyen Hue 2003 6,000 5.0 100% 22.011 The Landmark 5B Ton Duc Thang 2005 8,000 5.0 82% 16.012 opera View 161-167 Dong Khoi 2006 3,100 7.0 95% 26.013 Indochina park Tower 4Bis Nguyen Dinh Chieu 2006 2,145 3.0 96% 10.014 petro Tower 1-5 Le Duan 2007 13,304 5.0 99% 30.015 City Light 45 Vo Thi Sau 2007 10,000 5.0 98% 15.016 The Landcaster 22Bis Le Thanh Ton 2007 7,000 5.0 100% 24.017 Gemadept Tower 5 Le Thanh Ton 2008 14,000 7.0 100% 23.018 Fideco Tower 81-85 Ham Nghi 2008 15,000 6.0 99% 20.019 Havana Tower 132 Ham Nghi 2008 7,326 6.0 99% 21.020 Sailing Tower 51 Nguyen Thi Minh Khai 2008 16,910 6.0 99% 25.021 Royal Center 235 Nguyen Van Cu 2008 14,320 5.0 100% 19.022 TMS 172 Hai Ba Trung 2009 4,000 4.0 100% 23.023 Bao Viet Tower 233 Dong Khoi 2010 10,650 6.0 100% 21.024 Green power Tower 35 Ton Duc Thang 2010 15,600 6.0 96% 22.025 Vincom Center 68-70-72 Le Thanh Ton 2010 56,600 5.0 72% 25.026 Saigon Royal 91 pasteur 2010 5,340 4.0 100% 19.027 A&B Tower 76 Le Lai 2010 17,120 6.0 99% 28.028 Maritime Bank Tower 192 Nguyen Cong Tru 2010 19.596 5.0 89% 23.029 Empress Tower 138 Hai Ba Trung 2012 19,538 6.0 87% 26.030 Sunny MB Tower 259 Tran Hung Dao 2013 13,200 5.5 12% 22.0
Grade B 377,596 5.5 90.1% 22.8
* US$/ sq m/ month (on net area)
Office Market Overview
HCMC CBD MARKET REpoRT
FEBRUARY 2014 | RETAIL MARKET
HCMC CBD MARKET REpoRT
FEBRUARY 2014 | COMMERCIAL OFFICE MARKET
HCMC CBD MARKET REpoRT
FEBRUARY 2014 | RETAIL MARKET
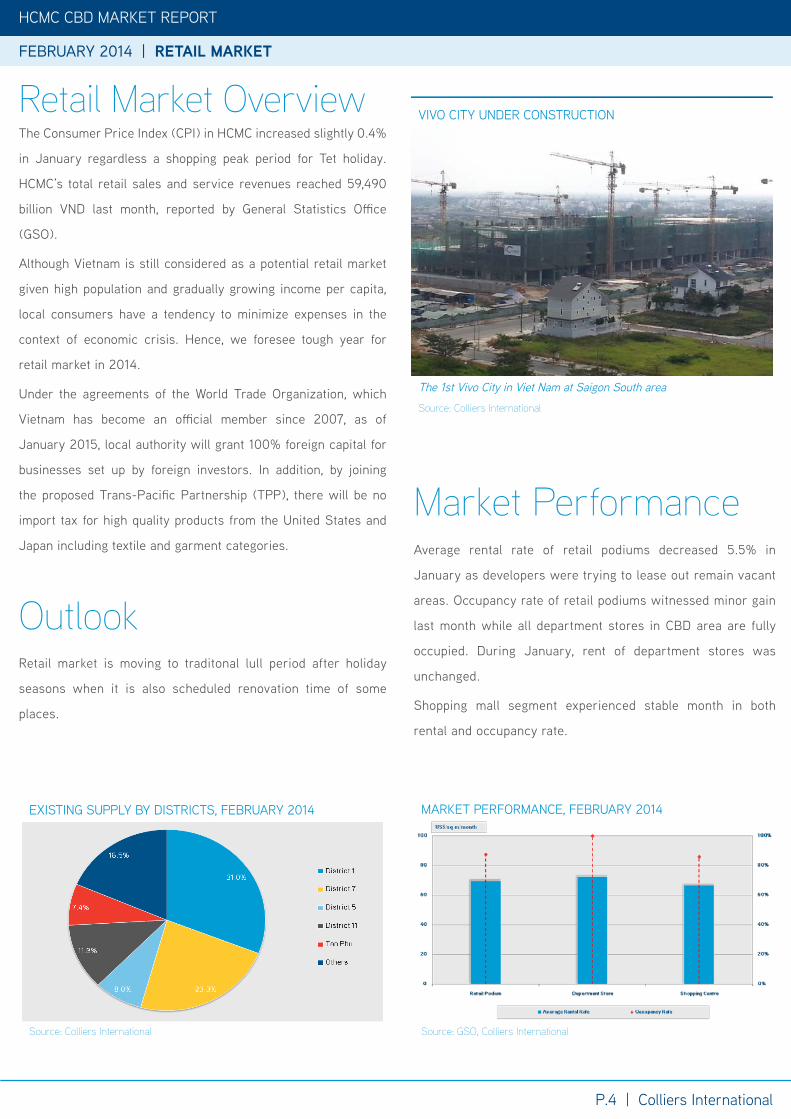
The Consumer price Index (CpI) in HCMC increased slightly 0.4%
in January regardless a shopping peak period for Tet holiday.
HCMC’s total retail sales and service revenues reached 59,490
billion VND last month, reported by General Statistics office
(GSo).
Although Vietnam is still considered as a potential retail market
given high population and gradually growing income per capita,
local consumers have a tendency to minimize expenses in the
context of economic crisis. Hence, we foresee tough year for
retail market in 2014.
Under the agreements of the World Trade organization, which
Vietnam has become an official member since 2007, as of
January 2015, local authority will grant 100% foreign capital for
businesses set up by foreign investors. In addition, by joining
the proposed Trans-pacific partnership (Tpp), there will be no
import tax for high quality products from the United States and
Japan including textile and garment categories.
p.4 | Colliers International
Retail Market Overview
Average rental rate of retail podiums decreased 5.5% in
January as developers were trying to lease out remain vacant
areas. occupancy rate of retail podiums witnessed minor gain
last month while all department stores in CBD area are fully
occupied. During January, rent of department stores was
unchanged.
Shopping mall segment experienced stable month in both
rental and occupancy rate.
Market Performance
Outlook
MARKET pERFoRMANCE, FEBRUARY 2014
VIVo CITY UNDER CoNSTRUCTIoN
The 1st Vivo City in Viet Nam at Saigon South area
Source: Colliers International
Retail market is moving to traditonal lull period after holiday
seasons when it is also scheduled renovation time of some
places.
Source: Colliers International
EXISTING SUppLY BY DISTRICTS, FEBRUARY 2014
Source: GSO, Colliers International
KUMHo MoNTHLY MARKET REpoRTFEBRUARY 2014 | RETAIL MARKET HCMC CBD MARKET REPORT
p.6 | Colliers International
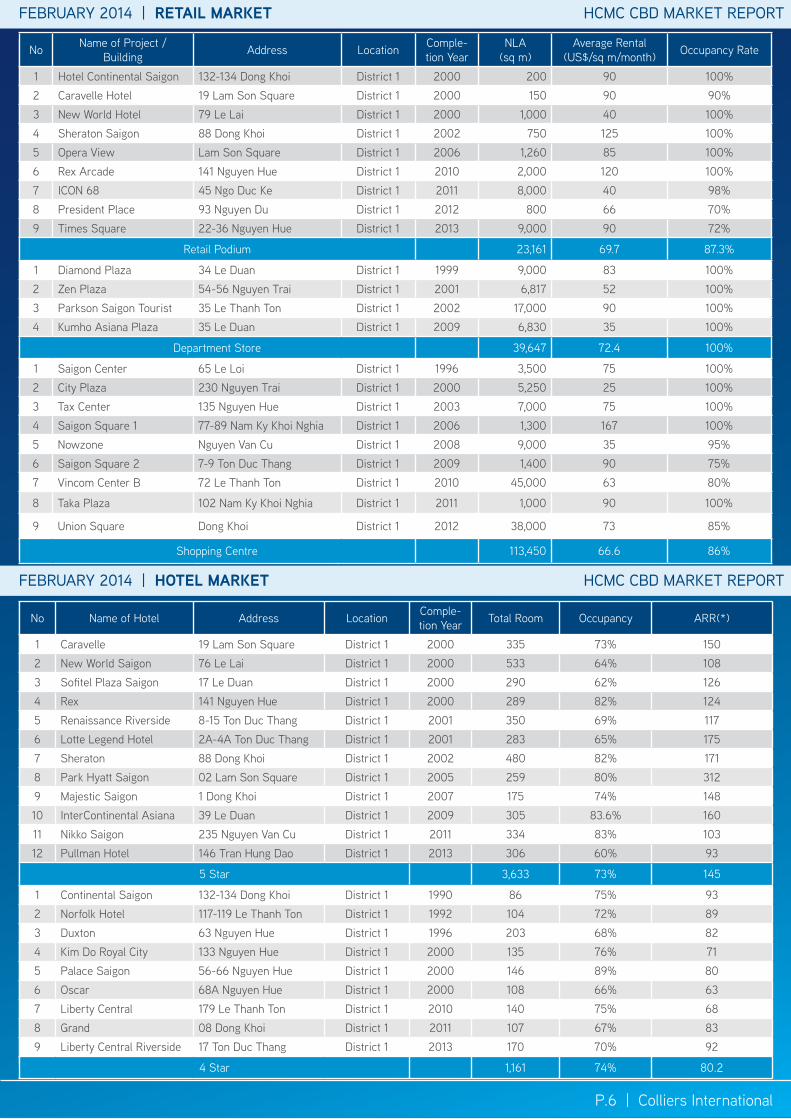
No Name of project /Building Address Location Comple-
tion YearNLA
(sq m)Average Rental
(US$/sq m/month) occupancy Rate
1 Hotel Continental Saigon 132-134 Dong Khoi District 1 2000 200 90 100%2 Caravelle Hotel 19 Lam Son Square District 1 2000 150 90 90%3 New World Hotel 79 Le Lai District 1 2000 1,000 40 100%4 Sheraton Saigon 88 Dong Khoi District 1 2002 750 125 100%5 opera View Lam Son Square District 1 2006 1,260 85 100%6 Rex Arcade 141 Nguyen Hue District 1 2010 2,000 120 100%7 ICoN 68 45 Ngo Duc Ke District 1 2011 8,000 40 98%8 president place 93 Nguyen Du District 1 2012 800 66 70%9 Times Square 22-36 Nguyen Hue District 1 2013 9,000 90 72%
Retail podium 23,161 69.7 87.3%
1 Diamond plaza 34 Le Duan District 1 1999 9,000 83 100%2 Zen plaza 54-56 Nguyen Trai District 1 2001 6,817 52 100%3 parkson Saigon Tourist 35 Le Thanh Ton District 1 2002 17,000 90 100%4 Kumho Asiana plaza 35 Le Duan District 1 2009 6,830 35 100%
Department Store 39,647 72.4 100%
1 Saigon Center 65 Le Loi District 1 1996 3,500 75 100%2 City plaza 230 Nguyen Trai District 1 2000 5,250 25 100%3 Tax Center 135 Nguyen Hue District 1 2003 7,000 75 100%4 Saigon Square 1 77-89 Nam Ky Khoi Nghia District 1 2006 1,300 167 100%5 Nowzone Nguyen Van Cu District 1 2008 9,000 35 95%6 Saigon Square 2 7-9 Ton Duc Thang District 1 2009 1,400 90 75%7 Vincom Center B 72 Le Thanh Ton District 1 2010 45,000 63 80%
8 Taka plaza 102 Nam Ky Khoi Nghia District 1 2011 1,000 90 100%
9 Union Square Dong Khoi District 1 2012 38,000 73 85%
Shopping Centre 113,450 66.6 86%
No Name of Hotel Address Location Comple-tion Year Total Room occupancy ARR(*)
1 Caravelle 19 Lam Son Square District 1 2000 335 73% 1502 New World Saigon 76 Le Lai District 1 2000 533 64% 1083 Sofitel plaza Saigon 17 Le Duan District 1 2000 290 62% 1264 Rex 141 Nguyen Hue District 1 2000 289 82% 1245 Renaissance Riverside 8-15 Ton Duc Thang District 1 2001 350 69% 1176 Lotte Legend Hotel 2A-4A Ton Duc Thang District 1 2001 283 65% 1757 Sheraton 88 Dong Khoi District 1 2002 480 82% 1718 park Hyatt Saigon 02 Lam Son Square District 1 2005 259 80% 3129 Majestic Saigon 1 Dong Khoi District 1 2007 175 74% 14810 InterContinental Asiana 39 Le Duan District 1 2009 305 83.6% 16011 Nikko Saigon 235 Nguyen Van Cu District 1 2011 334 83% 10312 pullman Hotel 146 Tran Hung Dao District 1 2013 306 60% 93
5 Star 3,633 73% 145
1 Continental Saigon 132-134 Dong Khoi District 1 1990 86 75% 932 Norfolk Hotel 117-119 Le Thanh Ton District 1 1992 104 72% 893 Duxton 63 Nguyen Hue District 1 1996 203 68% 824 Kim Do Royal City 133 Nguyen Hue District 1 2000 135 76% 715 palace Saigon 56-66 Nguyen Hue District 1 2000 146 89% 806 oscar 68A Nguyen Hue District 1 2000 108 66% 637 Liberty Central 179 Le Thanh Ton District 1 2010 140 75% 688 Grand 08 Dong Khoi District 1 2011 107 67% 839 Liberty Central Riverside 17 Ton Duc Thang District 1 2013 170 70% 92
4 Star 1,161 74% 80.2
FEBRUARY 2014 | HOTEL MARKET HCMC CBD MARKET REPORT
KUMHo MoNTHLY MARKET REpoRT HCMC CBD MARKET REPORT
HCMC CBD MARKET REPORT
p.7 | Colliers International
HCMC CBD MARKET REpoRT
FEBRUARY 2014 | HOTEL MARKET
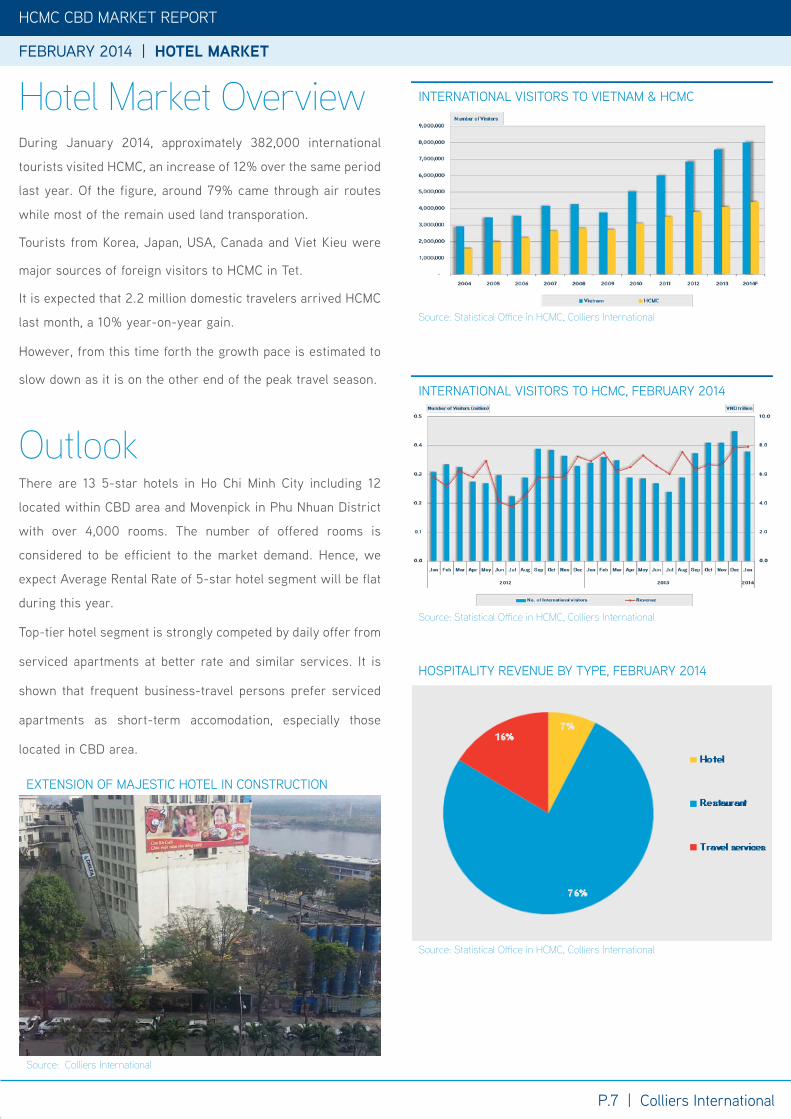
During January 2014, approximately 382,000 international
tourists visited HCMC, an increase of 12% over the same period
last year. of the figure, around 79% came through air routes
while most of the remain used land transporation.
Tourists from Korea, Japan, USA, Canada and Viet Kieu were
major sources of foreign visitors to HCMC in Tet.
It is expected that 2.2 million domestic travelers arrived HCMC
last month, a 10% year-on-year gain.
However, from this time forth the growth pace is estimated to
slow down as it is on the other end of the peak travel season.
Hotel Market Overview
OutlookThere are 13 5-star hotels in Ho Chi Minh City including 12
located within CBD area and Movenpick in phu Nhuan District
with over 4,000 rooms. The number of offered rooms is
considered to be efficient to the market demand. Hence, we
expect Average Rental Rate of 5-star hotel segment will be flat
during this year.
Top-tier hotel segment is strongly competed by daily offer from
serviced apartments at better rate and similar services. It is
shown that frequent business-travel persons prefer serviced
apartments as short-term accomodation, especially those
located in CBD area.
INTERNATIoNAL VISIToRS To VIETNAM & HCMC
Source: Statistical Office in HCMC, Colliers International
INTERNATIoNAL VISIToRS To HCMC, FEBRUARY 2014
Source: Statistical Office in HCMC, Colliers International
HoSpITALITY REVENUE BY TYpE, FEBRUARY 2014
Source: Statistical Office in HCMC, Colliers International
EXTENSIoN oF MAJESTIC HoTEL IN CoNSTRUCTIoN
Source: Colliers International
p.8 | Colliers International
HCMC CBD MARKET REpoRT
FEBRUARY 2014 | HOTEL MARKET
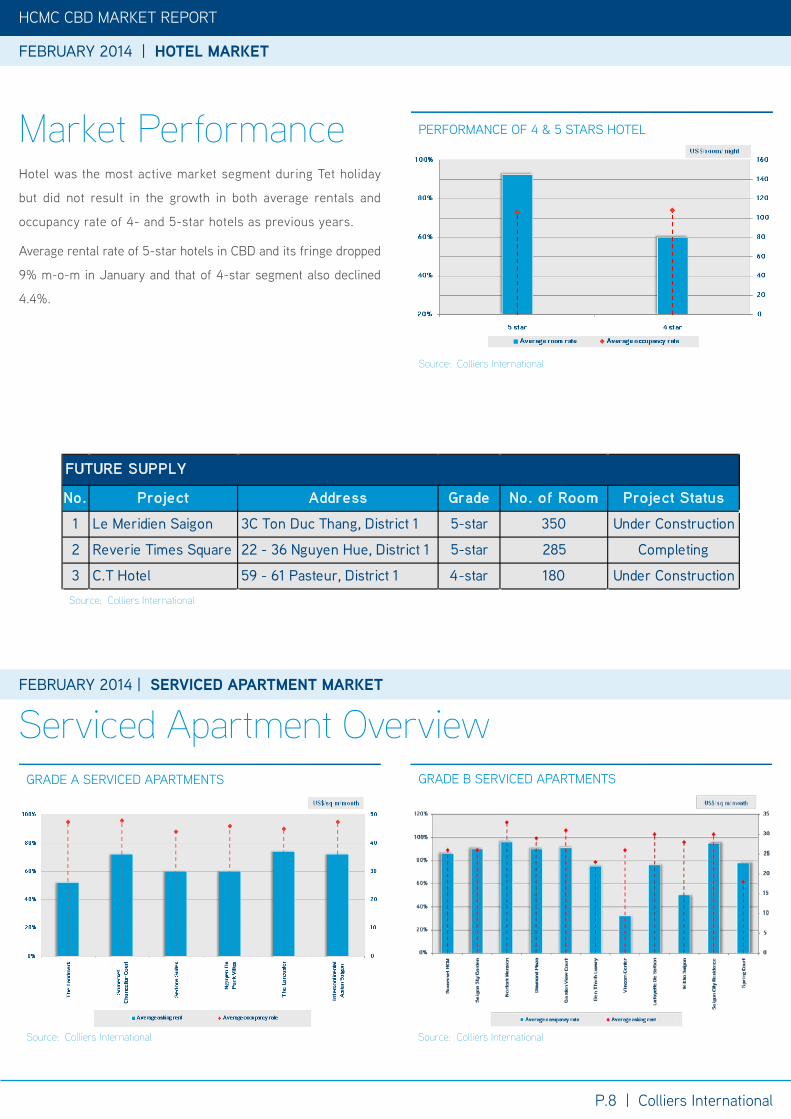
Hotel was the most active market segment during Tet holiday
but did not result in the growth in both average rentals and
occupancy rate of 4- and 5-star hotels as previous years.
Average rental rate of 5-star hotels in CBD and its fringe dropped
9% m-o-m in January and that of 4-star segment also declined
4.4%.
Market Performance pERFoRMANCE oF 4 & 5 STARS HoTEL
Source: Colliers International
FEBRUARY 2014 | SERVICED APARTMENT MARKET
Serviced Apartment OverviewGRADE A SERVICED ApARTMENTS
Source: Colliers International
GRADE B SERVICED ApARTMENTS
Source: Colliers International
HCMC CBD MARKET REpoRT
FEBRUARY 2014 | SERVICED APARTMENT MARKET
No. Project Address Grade No. of Room Project Status
1 Le Meridien Saigon 3C Ton Duc Thang, District 1 5-star 350 Under Construction
2 Reverie Times Square 22 - 36 Nguyen Hue, District 1 5-star 285 Completing
3 C.T Hotel 59 - 61 Pasteur, District 1 4-star 180 Under Construction
FUTURE SUPPLY
Source: Colliers International
HCMC CBD MARKET REpoRT
FEBRUARY 2014 | HOTEL MARKET
FEBRUARY 2014 | SERVICED APARTMENT MARKET
p.9 | Colliers International
HCMC CBD MARKET REpoRT
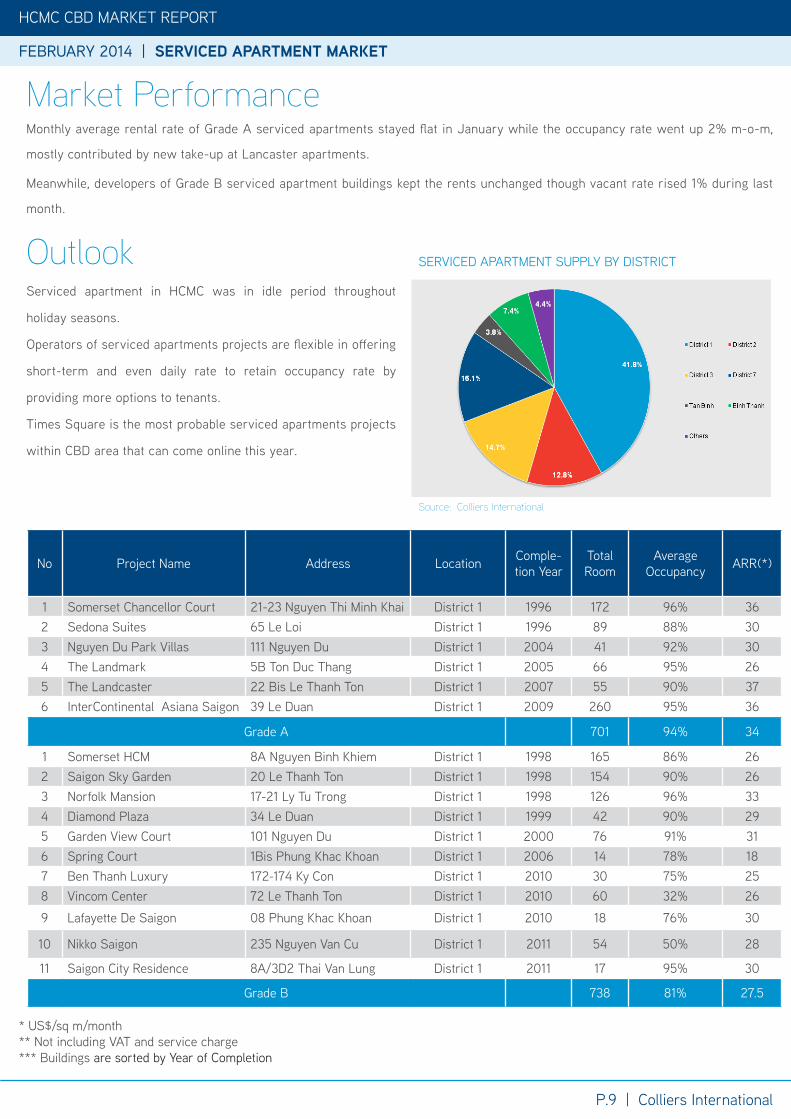
No project Name Address Location Comple-tion Year
Total Room
Average occupancy ARR(*)
1 Somerset Chancellor Court 21-23 Nguyen Thi Minh Khai District 1 1996 172 96% 362 Sedona Suites 65 Le Loi District 1 1996 89 88% 303 Nguyen Du park Villas 111 Nguyen Du District 1 2004 41 92% 304 The Landmark 5B Ton Duc Thang District 1 2005 66 95% 265 The Landcaster 22 Bis Le Thanh Ton District 1 2007 55 90% 376 InterContinental Asiana Saigon 39 Le Duan District 1 2009 260 95% 36
Grade A 701 94% 34
1 Somerset HCM 8A Nguyen Binh Khiem District 1 1998 165 86% 262 Saigon Sky Garden 20 Le Thanh Ton District 1 1998 154 90% 263 Norfolk Mansion 17-21 Ly Tu Trong District 1 1998 126 96% 334 Diamond plaza 34 Le Duan District 1 1999 42 90% 295 Garden View Court 101 Nguyen Du District 1 2000 76 91% 316 Spring Court 1Bis phung Khac Khoan District 1 2006 14 78% 187 Ben Thanh Luxury 172-174 Ky Con District 1 2010 30 75% 258 Vincom Center 72 Le Thanh Ton District 1 2010 60 32% 26
9 Lafayette De Saigon 08 phung Khac Khoan District 1 2010 18 76% 30
10 Nikko Saigon 235 Nguyen Van Cu District 1 2011 54 50% 28
11 Saigon City Residence 8A/3D2 Thai Van Lung District 1 2011 17 95% 30
Grade B 738 81% 27.5
* US$/sq m/month** Not including VAT and service charge*** Buildings are sorted by Year of Completion
FEBRUARY 2014 | SERVICED APARTMENT MARKET
Serviced apartment in HCMC was in idle period throughout
holiday seasons.
operators of serviced apartments projects are flexible in offering
short-term and even daily rate to retain occupancy rate by
providing more options to tenants.
Times Square is the most probable serviced apartments projects
within CBD area that can come online this year.
Outlook
Monthly average rental rate of Grade A serviced apartments stayed flat in January while the occupancy rate went up 2% m-o-m,
mostly contributed by new take-up at Lancaster apartments.
Meanwhile, developers of Grade B serviced apartment buildings kept the rents unchanged though vacant rate rised 1% during last
month.
Market Performance
SERVICED ApARTMENT SUppLY BY DISTRICT
Source: Colliers International
HCMC CBD MARKET REPORT | FEBRUARY 2014
With more than 100 professionals in 2 offices in Vietnam, the team is market driven and has proven and successful track record with both international and local experience.
From Hanoi to Ho Chi Minh City, we provide a full range of real estate services
•Research > Market research across all sectors > Market analysis, advisory, and strategy
•Valuation & Advisory Services > Valuation for land, existing property or development sites > Feasibility studies to determine NPV, IRR and highest & best use
•Office Services > Tenant Representation > Landlord Representation
•Residential Sales & Leasing
•Retail Services
• Investment Services
•Real Estate Management Services
•Corporate Services
• Industrial Leasing
The foundation of our services is the strength and depth of our experience.
COLLIERS INTERNATIONAL
Ho CHI MINH CITYBitexco office Building, 7th Floor19-25 Nguyen Hue StreetDistrict 1, HCM City, VietnamTel: + 84 8 3827 5665
HANoICapital Tower, 10th Floor109 Tran Hung Dao Street, Hoan Kiem District, Hanoi, VietnamTel: +84 4 3941 3277
482 offices in62 countries on6 continentsUnited StatesCanadaLatin AmericaAsia pacificEMEA
Accelerating success
: 140: 42: 20: 195: 85
QUANG NGUYENResearch [email protected]+84 938 056 603
YEN NGUYENResearch [email protected]+84 915 478 778
About Colliers InternationalColliers International is a leader in global real estate services, defined by our spirit of enterprise.Through a culture of service excellence and a shared sense of initiative, we integrate the resources of real estate specialists worldwide to accelerate the success of our partners.
We connect through a shared set of values that shape a collaborative environment throughout our organization that is unsurpassed in the industry.
publication Coverage Frequency Content Availability
Research & Forecast Report
Vietnam Cities Quarterly All market sectors publicly available
CBD Report HCMC CBD Monthly office, Retail, Hotel and Serviced Apartment
publicly available
Asia pacific office Report
Asia pacific in-cluding Vietnam
Quarterly office market publicly available
Vietnam property Market Report
Vietnam cities Quarterly All market sectors on subscription
Development Recommendation
Vietnam cities At request All market sectors on subscription
$2billion in annual revenue
2.5billion square feet under management
13,500professionalsand staff
www.colliers.com/vietnam
Please contact, If you would like to recieve our other research reports
This document has been prepared by Colliers International for advertising and general information only. Colliers International makes no guarantees, representations or warranties of any kind, expressed or implied, regarding the information including, but not limited to, warranties of content, accuracy and reliability. Any interested party should undertake their own inquiries as to the accuracy of the information. Colliers International excludes unequivocally all inferred or implied terms, conditions and warranties arising out of this document and excludes all liability for loss and damages arising there from. This publication is the copyrighted property of Colliers International and/or its licensor(s). ©2013. All rights reserved.