Embed Size (px)
Citation preview
JANUARY 2015 | HCMC CENTRAL BUSINESS DISTRICT
CBD MARKET REPORTHO CHI MINH CITY
www.colliers.com/vietnam
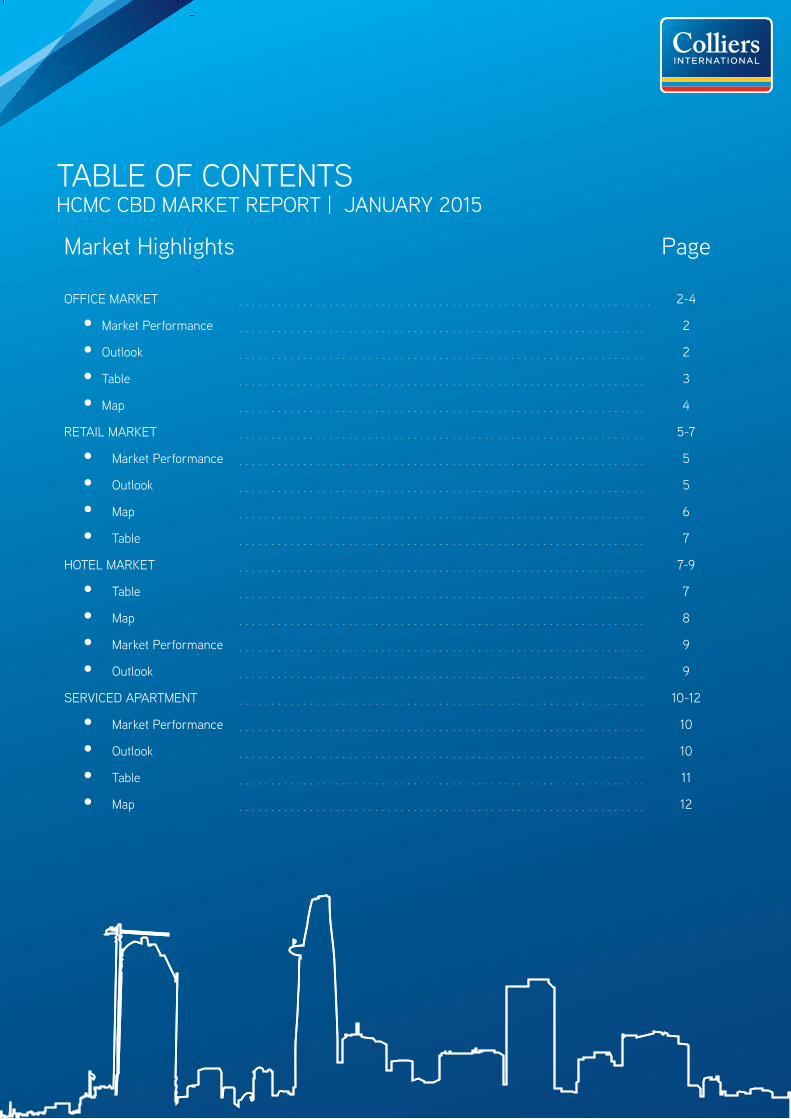
TABLE OF CONTENTSHCMC CBD MARKET REPORT | JANUARY 2015
Market Highlights
OFFICE MARKET
• Market Performance
• Outlook
• Table
• Map
RETAIL MARKET
• Market Performance
• Outlook
• Map
• Table
HOTEL MARKET
• Table
• Map
• Market Performance
• Outlook
SERVICED APARTMENT
• Market Performance
• Outlook
• Table
• Map
Page
2-4
2
2
3
4
5-7
5
5
6
7
7-9
7
8
9
9
10-12
10
10
11
12
. . . . . . . . . . . . . . . . . . . . . . . . . . . . . . . . . . . . . . . . . . . . . . . . . . . . . . . . . . . . . . . .
. . . . . . . . . . . . . . . . . . . . . . . . . . . . . . . . . . . . . . . . . . . . . . . . . . . . . . . . . . . . . . .
. . . . . . . . . . . . . . . . . . . . . . . . . . . . . . . . . . . . . . . . . . . . . . . . . . . . . . . . . . . . . . .
. . . . . . . . . . . . . . . . . . . . . . . . . . . . . . . . . . . . . . . . . . . . . . . . . . . . . . . . . . . . . . .
. . . . . . . . . . . . . . . . . . . . . . . . . . . . . . . . . . . . . . . . . . . . . . . . . . . . . . . . . . . . . . .
. . . . . . . . . . . . . . . . . . . . . . . . . . . . . . . . . . . . . . . . . . . . . . . . . . . . . . . . . . . . . . .
. . . . . . . . . . . . . . . . . . . . . . . . . . . . . . . . . . . . . . . . . . . . . . . . . . . . . . . . . . . . . . .
. . . . . . . . . . . . . . . . . . . . . . . . . . . . . . . . . . . . . . . . . . . . . . . . . . . . . . . . . . . . . . .
. . . . . . . . . . . . . . . . . . . . . . . . . . . . . . . . . . . . . . . . . . . . . . . . . . . . . . . . . . . . . . .
. . . . . . . . . . . . . . . . . . . . . . . . . . . . . . . . . . . . . . . . . . . . . . . . . . . . . . . . . . . . . . .
. . . . . . . . . . . . . . . . . . . . . . . . . . . . . . . . . . . . . . . . . . . . . . . . . . . . . . . . . . . . . . .
. . . . . . . . . . . . . . . . . . . . . . . . . . . . . . . . . . . . . . . . . . . . . . . . . . . . . . . . . . . . . . .
. . . . . . . . . . . . . . . . . . . . . . . . . . . . . . . . . . . . . . . . . . . . . . . . . . . . . . . . . . . . . . .
. . . . . . . . . . . . . . . . . . . . . . . . . . . . . . . . . . . . . . . . . . . . . . . . . . . . . . . . . . . . . . .
. . . . . . . . . . . . . . . . . . . . . . . . . . . . . . . . . . . . . . . . . . . . . . . . . . . . . . . . . . . . . . .
. . . . . . . . . . . . . . . . . . . . . . . . . . . . . . . . . . . . . . . . . . . . . . . . . . . . . . . . . . . . . . .
. . . . . . . . . . . . . . . . . . . . . . . . . . . . . . . . . . . . . . . . . . . . . . . . . . . . . . . . . . . . . . .
. . . . . . . . . . . . . . . . . . . . . . . . . . . . . . . . . . . . . . . . . . . . . . . . . . . . . . . . . . . . . . .
. . . . . . . . . . . . . . . . . . . . . . . . . . . . . . . . . . . . . . . . . . . . . . . . . . . . . . . . . . . . . . .
. . . . . . . . . . . . . . . . . . . . . . . . . . . . . . . . . . . . . . . . . . . . . . . . . . . . . . . . . . . . . . .

As you focus on your customer, we focus on you.You’re an expert in knowing what your customers want—often before they do. We bring the same approach to your business.
Colliers International is built on an enterprising culture of collaboration and innovation. We provide creative, strategic solutions to all our clients.
Whether you need sales and leasing brokerage, property marketing, research and demographics, or asset and property management, we have retail professionals across Vietnam who can meet the real estate needs of retail tenants, landlords and developers.
Today’s real estate challenges require more than geographic reach and local knowledge: they require integrated expertise in market segmentation, valuation, disposition, assembly, debt and equity strategies and much more.
Our integrated platform and our experienced bring you closer to your customers.
HCMC CBD MARKET REPORT
JANUARY 2015 | COMMERCIAL OFFICE MARKET
P.2 | Colliers International
Vietnam’s more integration in the world with more open policies will attract more international fi rms to the country. In addition, the
recent growing FDI inflows into HCMC along with the expansion of multinational companies and factories will continue to support
the recovery of the office market.
The market performance of Grade A is anticipated to remain stable despite the upcoming supply from Vietcombank Tower and Le
Meridian. The occupancy rate of Grade B will increase slightly while the rents are expected to be stable in the financial hub.
Outlook
HCMC FDI BY MONTH
Source: Colliers International
CBD OFFICE PERFORMANCE BY ZONE, JANUARY 2015
Source: Colliers International
Source: Colliers International
Grade AAR Occupancy rate Supply
A ↔ ↔
B ↔
B ↔
B ↔
B ↔
CITY CENTRAL
FINANCIALHUB
NORTHERN CBD
SOUTHERN CBD
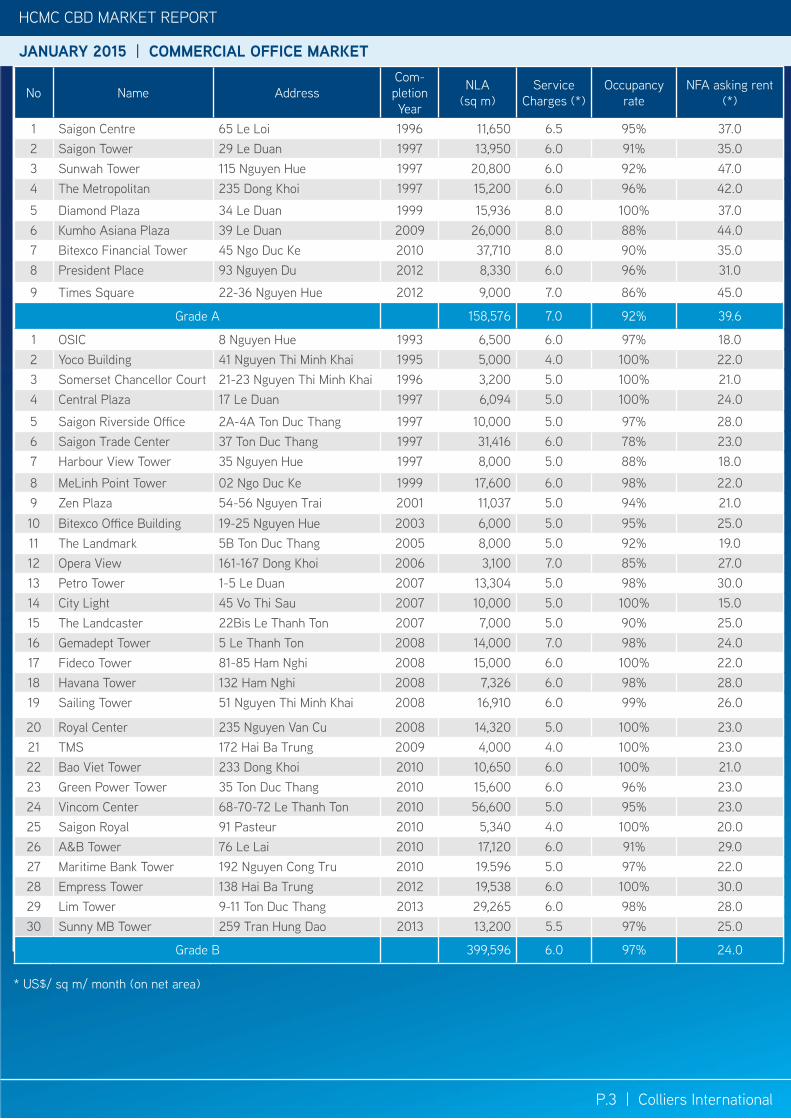
Market PerformanceThere was no new supply in both Grade A and Grade B in
the city central.
While rents of Grade B offices in the central city recorded
a m-o-m growth of 2.2% to US$23.3/sqm/month, rents of
Grade A slightly declined by 1.9% m-o-m to US$39.94/sqm/
month in January. This was mainly due to the movement
of tenants from some Grade A offices to Grade B ones with
better rents. This also explained for the occupancy drop of
0.4 percentage points compared to December in the Grade
A. However, the occupancy of Grade A remained high
(92.1%) thanks to limited supply and high quality buildings
which can keep its current tenants.
The finanical hub (including Ham Nghi, Nguyen Cong and a
part of Nam Ky Khoi Nghia streets) recorded the occupancy
rate of 98.5% and rents of US$22.0/sqm/month.
HCMC CBD MARKET REPORT
JANUARY 2015 | COMMERCIAL OFFICE MARKET
P.3 | Colliers International
HCMC CBD MARKET REPORT
JANUARY 2015 | COMMERCIAL OFFICE MARKET
* US$/ sq m/ month (on net area)
No Name AddressCom-pletion Year
NLA (sq m)
Service Charges (*)
Occupancy rate
NFA asking rent (*)
1 Saigon Centre 65 Le Loi 1996 11,650 6.5 95% 37.02 Saigon Tower 29 Le Duan 1997 13,950 6.0 91% 35.03 Sunwah Tower 115 Nguyen Hue 1997 20,800 6.0 92% 47.04 The Metropolitan 235 Dong Khoi 1997 15,200 6.0 96% 42.0
5 Diamond Plaza 34 Le Duan 1999 15,936 8.0 100% 37.06 Kumho Asiana Plaza 39 Le Duan 2009 26,000 8.0 88% 44.07 Bitexco Financial Tower 45 Ngo Duc Ke 2010 37,710 8.0 90% 35.08 President Place 93 Nguyen Du 2012 8,330 6.0 96% 31.0
9 Times Square 22-36 Nguyen Hue 2012 9,000 7.0 86% 45.0
Grade A 158,576 7.0 92% 39.6
1 OSIC 8 Nguyen Hue 1993 6,500 6.0 97% 18.02 Yoco Building 41 Nguyen Thi Minh Khai 1995 5,000 4.0 100% 22.03 Somerset Chancellor Court 21-23 Nguyen Thi Minh Khai 1996 3,200 5.0 100% 21.04 Central Plaza 17 Le Duan 1997 6,094 5.0 100% 24.0
5 Saigon Riverside Office 2A-4A Ton Duc Thang 1997 10,000 5.0 97% 28.06 Saigon Trade Center 37 Ton Duc Thang 1997 31,416 6.0 78% 23.07 Harbour View Tower 35 Nguyen Hue 1997 8,000 5.0 88% 18.0
8 MeLinh Point Tower 02 Ngo Duc Ke 1999 17,600 6.0 98% 22.09 Zen Plaza 54-56 Nguyen Trai 2001 11,037 5.0 94% 21.010 Bitexco Office Building 19-25 Nguyen Hue 2003 6,000 5.0 95% 25.011 The Landmark 5B Ton Duc Thang 2005 8,000 5.0 92% 19.012 Opera View 161-167 Dong Khoi 2006 3,100 7.0 85% 27.013 Petro Tower 1-5 Le Duan 2007 13,304 5.0 98% 30.014 City Light 45 Vo Thi Sau 2007 10,000 5.0 100% 15.015 The Landcaster 22Bis Le Thanh Ton 2007 7,000 5.0 90% 25.016 Gemadept Tower 5 Le Thanh Ton 2008 14,000 7.0 98% 24.017 Fideco Tower 81-85 Ham Nghi 2008 15,000 6.0 100% 22.018 Havana Tower 132 Ham Nghi 2008 7,326 6.0 98% 28.019 Sailing Tower 51 Nguyen Thi Minh Khai 2008 16,910 6.0 99% 26.0
20 Royal Center 235 Nguyen Van Cu 2008 14,320 5.0 100% 23.021 TMS 172 Hai Ba Trung 2009 4,000 4.0 100% 23.022 Bao Viet Tower 233 Dong Khoi 2010 10,650 6.0 100% 21.023 Green Power Tower 35 Ton Duc Thang 2010 15,600 6.0 96% 23.024 Vincom Center 68-70-72 Le Thanh Ton 2010 56,600 5.0 95% 23.025 Saigon Royal 91 Pasteur 2010 5,340 4.0 100% 20.026 A&B Tower 76 Le Lai 2010 17,120 6.0 91% 29.027 Maritime Bank Tower 192 Nguyen Cong Tru 2010 19.596 5.0 97% 22.028 Empress Tower 138 Hai Ba Trung 2012 19,538 6.0 100% 30.029 Lim Tower 9-11 Ton Duc Thang 2013 29,265 6.0 98% 28.030 Sunny MB Tower 259 Tran Hung Dao 2013 13,200 5.5 97% 25.0
Grade B 399,596 6.0 97% 24.0
P.4 | Colliers International
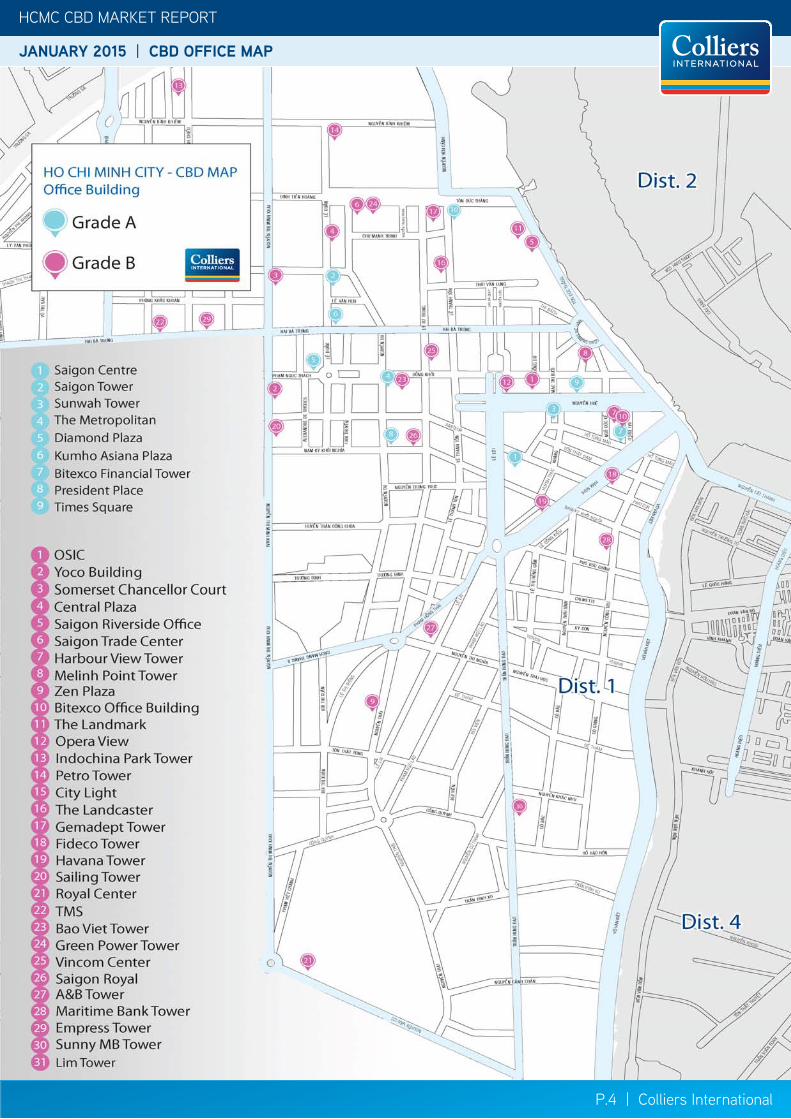
HCMC CBD MARKET REPORT
JANUARY 2015 | CBD OFFICE MAP
* US$/ sq m/ month (on net area)
HCMC CBD MARKET REPORT
JANUARY 2015 | RETAIL MARKET

HCMC CBD MARKET REPORT
JANUARY 2015 | CBD OFFICE MAP
HCMC CBD MARKET REPORT
JANUARY 2015 | RETAIL MARKET
P.5 | Colliers International
Market Performance
Outlook
SHOPPING CENTER MARKET PERFORMANCE, JANUARY 2015
Source: Colliers International
RETAIL PODIUM MARKET PERFORMANCE, JANUARY 2015
Source: Colliers International
Source: Colliers International
Due to the continued decline in fuel prices, HCMC’s Consumer
Price Index (CPI) in January dropped by 0.5% m-o-m and
marginally increased by 0.8% y-o-y. The easing CPI partly
showed the softened demand on the market. Despite the
upcoming Lunar New Year which is in the middle of February,
retail consumption showed a modest rise of 5.2% m-o-m .
Given the stagnant market, there was no new supply in the city
centre in January.
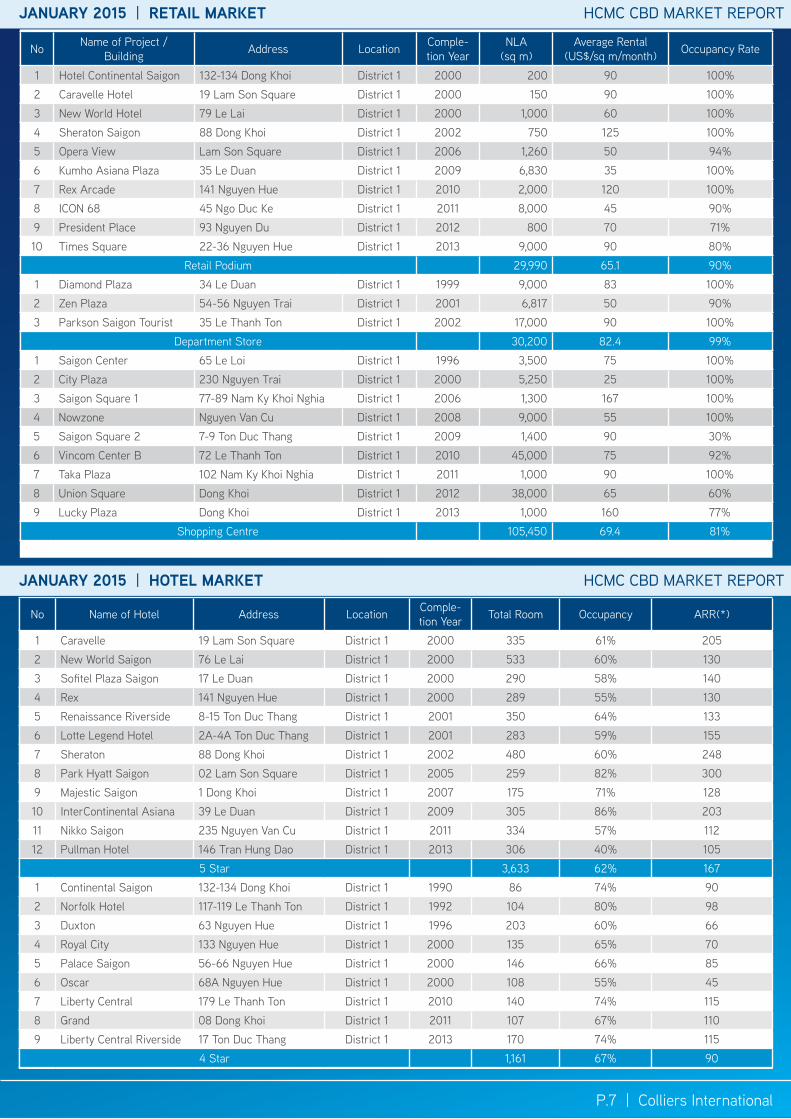
The rental rates well remained stability across all types, retail
podium (US$65.13/sqm/month), department store (US$82.35/
sqm/month) and shopping centre (US$69.39/sqm/month). The
occupancy rate of shopping centre witnessed a drop of 8.0
percentage points to 81.0% m-o-m.
CPI AND RETAIL-SERVICE REVENUE BY MONTH
Source: GSO, Colliers International
Average rents of retail podiums and department stores are
anticipated to remain stable given its stable occupancy rate
and limited supply in the next few months. Meanwhile, leasing
terms and rents at shopping centres in the CBD will be stable or
slightly decrease, depending on retail brands.
The vacancy rate in general will remain stable until the end of
the fi rst quarter of 2015.
AVERAGE RENT BY TYPE, JANUARY 2015
P.6 | Colliers International
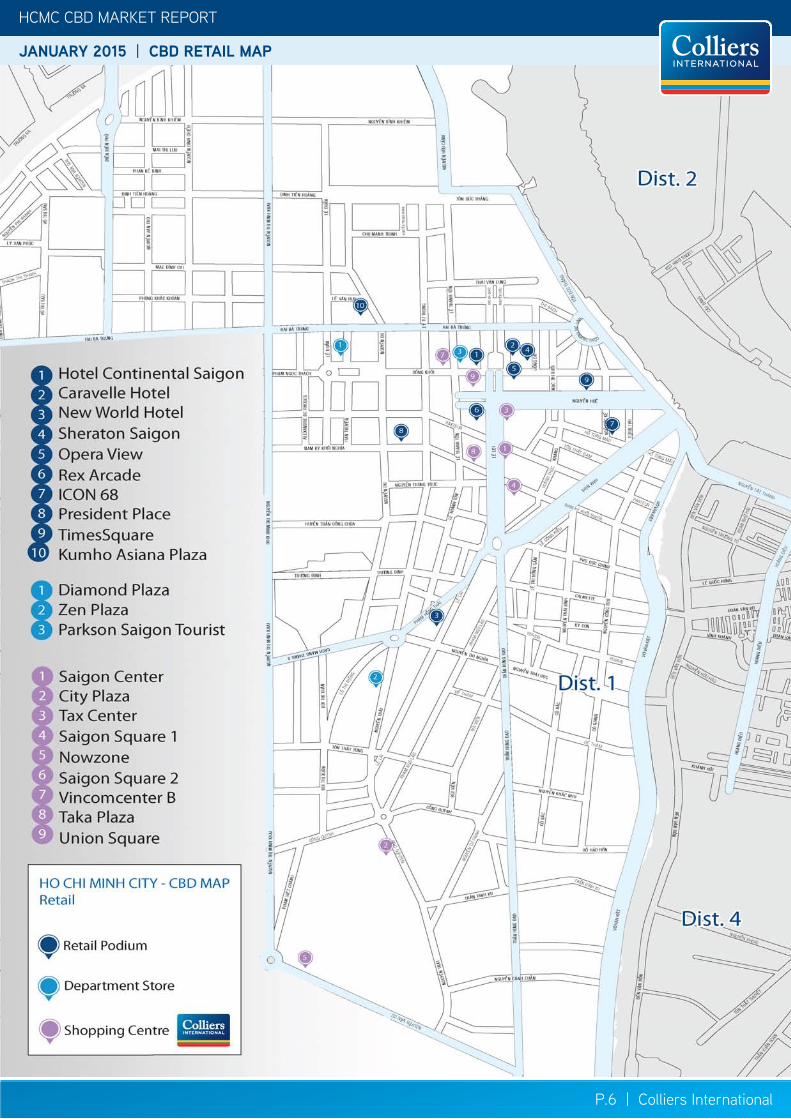
HCMC CBD MARKET REPORT
JANUARY 2015 | CBD RETAIL MAP
* US$/ sq m/ month (on net area)
JANUARY 2015 | RETAIL MARKET
JANUARY 2015 | HOTEL MARKET
HCMC CBD MARKET REPORT
JANUARY 2015 | CBD RETAIL MAP
KUMHO MONTHLY MARKET REPORTJANUARY 2015 | RETAIL MARKET HCMC CBD MARKET REPORT
P.7 | Colliers International
JANUARY 2015 | HOTEL MARKET HCMC CBD MARKET REPORT
No Name of Project /Building Address Location Comple-
tion YearNLA
(sq m)Average Rental
(US$/sq m/month) Occupancy Rate
1 Hotel Continental Saigon 132-134 Dong Khoi District 1 2000 200 90 100%2 Caravelle Hotel 19 Lam Son Square District 1 2000 150 90 100%3 New World Hotel 79 Le Lai District 1 2000 1,000 60 100%4 Sheraton Saigon 88 Dong Khoi District 1 2002 750 125 100%5 Opera View Lam Son Square District 1 2006 1,260 50 94%6 Kumho Asiana Plaza 35 Le Duan District 1 2009 6,830 35 100%7 Rex Arcade 141 Nguyen Hue District 1 2010 2,000 120 100%8 ICON 68 45 Ngo Duc Ke District 1 2011 8,000 45 90%9 President Place 93 Nguyen Du District 1 2012 800 70 71%10 Times Square 22-36 Nguyen Hue District 1 2013 9,000 90 80%
Retail Podium 29,990 65.1 90%1 Diamond Plaza 34 Le Duan District 1 1999 9,000 83 100%2 Zen Plaza 54-56 Nguyen Trai District 1 2001 6,817 50 90%3 Parkson Saigon Tourist 35 Le Thanh Ton District 1 2002 17,000 90 100%
Department Store 30,200 82.4 99%1 Saigon Center 65 Le Loi District 1 1996 3,500 75 100%2 City Plaza 230 Nguyen Trai District 1 2000 5,250 25 100%3 Saigon Square 1 77-89 Nam Ky Khoi Nghia District 1 2006 1,300 167 100%4 Nowzone Nguyen Van Cu District 1 2008 9,000 55 100%5 Saigon Square 2 7-9 Ton Duc Thang District 1 2009 1,400 90 30%6 Vincom Center B 72 Le Thanh Ton District 1 2010 45,000 75 92%7 Taka Plaza 102 Nam Ky Khoi Nghia District 1 2011 1,000 90 100%8 Union Square Dong Khoi District 1 2012 38,000 65 60%9 Lucky Plaza Dong Khoi District 1 2013 1,000 160 77%
Shopping Centre 105,450 69.4 81%
No Name of Hotel Address Location Comple-tion Year Total Room Occupancy ARR(*)
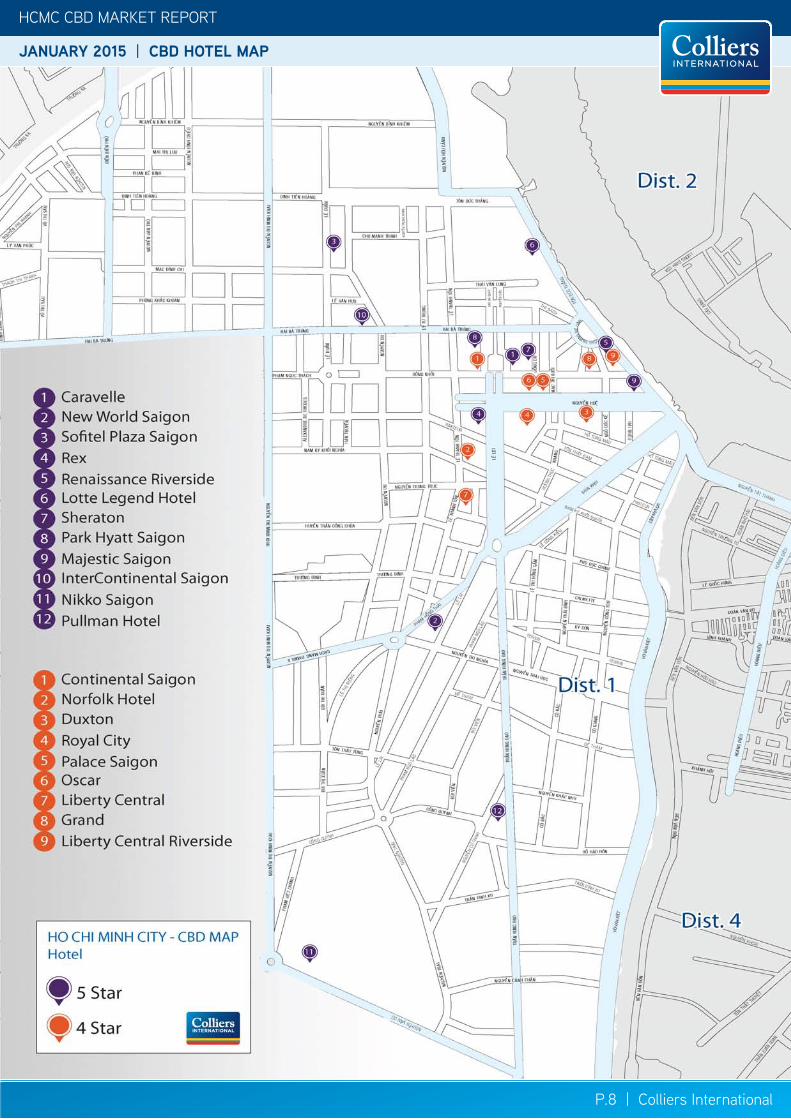
1 Caravelle 19 Lam Son Square District 1 2000 335 61% 2052 New World Saigon 76 Le Lai District 1 2000 533 60% 1303 Sofitel Plaza Saigon 17 Le Duan District 1 2000 290 58% 1404 Rex 141 Nguyen Hue District 1 2000 289 55% 1305 Renaissance Riverside 8-15 Ton Duc Thang District 1 2001 350 64% 1336 Lotte Legend Hotel 2A-4A Ton Duc Thang District 1 2001 283 59% 1557 Sheraton 88 Dong Khoi District 1 2002 480 60% 2488 Park Hyatt Saigon 02 Lam Son Square District 1 2005 259 82% 3009 Majestic Saigon 1 Dong Khoi District 1 2007 175 71% 12810 InterContinental Asiana 39 Le Duan District 1 2009 305 86% 20311 Nikko Saigon 235 Nguyen Van Cu District 1 2011 334 57% 11212 Pullman Hotel 146 Tran Hung Dao District 1 2013 306 40% 105
5 Star 3,633 62% 1671 Continental Saigon 132-134 Dong Khoi District 1 1990 86 74% 902 Norfolk Hotel 117-119 Le Thanh Ton District 1 1992 104 80% 983 Duxton 63 Nguyen Hue District 1 1996 203 60% 664 Royal City 133 Nguyen Hue District 1 2000 135 65% 705 Palace Saigon 56-66 Nguyen Hue District 1 2000 146 66% 856 Oscar 68A Nguyen Hue District 1 2000 108 55% 457 Liberty Central 179 Le Thanh Ton District 1 2010 140 74% 1158 Grand 08 Dong Khoi District 1 2011 107 67% 1109 Liberty Central Riverside 17 Ton Duc Thang District 1 2013 170 74% 115
4 Star 1,161 67% 90
P.8 | Colliers International
HCMC CBD MARKET REPORT
JANUARY 2015 | CBD HOTEL MAP
* US$/ sq m/ month (on net area)
HCMC CBD MARKET REPORT
JANUARY 2015 | CBD HOTEL MAP
P.9 | Colliers International
HCMC CBD MARKET REPORT
JANUARY 2015 | HOTEL MARKET
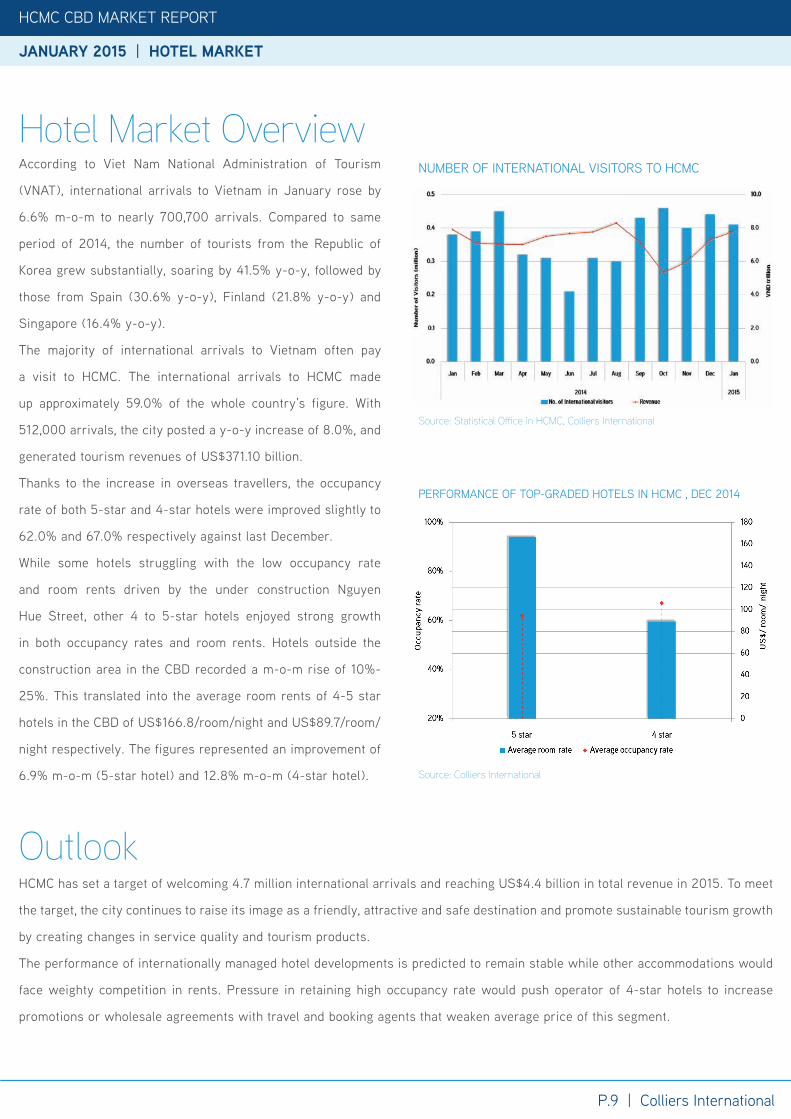
According to Viet Nam National Administration of Tourism
(VNAT), international arrivals to Vietnam in January rose by
6.6% m-o-m to nearly 700,700 arrivals. Compared to same
period of 2014, the number of tourists from the Republic of
Korea grew substantially, soaring by 41.5% y-o-y, followed by
those from Spain (30.6% y-o-y), Finland (21.8% y-o-y) and
Singapore (16.4% y-o-y).
The majority of international arrivals to Vietnam often pay
a visit to HCMC. The international arrivals to HCMC made
up approximately 59.0% of the whole country’s figure. With
512,000 arrivals, the city posted a y-o-y increase of 8.0%, and
generated tourism revenues of US$371.10 billion.
Thanks to the increase in overseas travellers, the occupancy
rate of both 5-star and 4-star hotels were improved slightly to
62.0% and 67.0% respectively against last December.
While some hotels struggling with the low occupancy rate
and room rents driven by the under construction Nguyen
Hue Street, other 4 to 5-star hotels enjoyed strong growth
in both occupancy rates and room rents. Hotels outside the
construction area in the CBD recorded a m-o-m rise of 10%-
25%. This translated into the average room rents of 4-5 star
hotels in the CBD of US$166.8/room/night and US$89.7/room/
night respectively. The figures represented an improvement of
6.9% m-o-m (5-star hotel) and 12.8% m-o-m (4-star hotel).
Hotel Market Overview
HCMC has set a target of welcoming 4.7 million international arrivals and reaching US$4.4 billion in total revenue in 2015. To meet
the target, the city continues to raise its image as a friendly, attractive and safe destination and promote sustainable tourism growth
by creating changes in service quality and tourism products.
The performance of internationally managed hotel developments is predicted to remain stable while other accommodations would
face weighty competition in rents. Pressure in retaining high occupancy rate would push operator of 4-star hotels to increase
promotions or wholesale agreements with travel and booking agents that weaken average price of this segment.
NUMBER OF INTERNATIONAL VISITORS TO HCMC
Source: Statistical Offi ce in HCMC, Colliers International
Outlook
PERFORMANCE OF TOP-GRADED HOTELS IN HCMC , DEC 2014
Source: Colliers International
P.10 | Colliers International
HCMC CBD MARKET REPORT
JANUARY 2015 | HOTEL MARKET
HCMC CBD MARKET REPORT
JANUARY 2015 | SERVICED APARTMENT MARKET
JANUARY 2015 | SERVICED APARTMENT MARKET
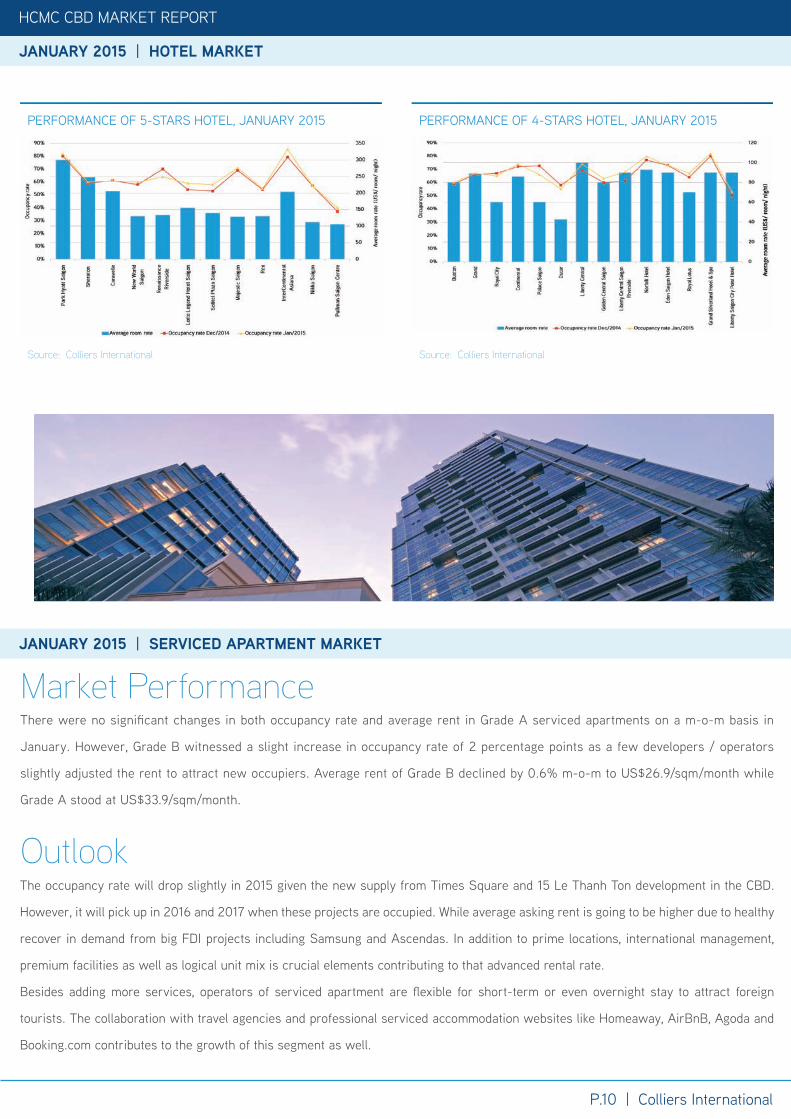
PERFORMANCE OF 5-STARS HOTEL, JANUARY 2015
Source: Colliers International
PERFORMANCE OF 4-STARS HOTEL, JANUARY 2015
Source: Colliers International
The occupancy rate will drop slightly in 2015 given the new supply from Times Square and 15 Le Thanh Ton development in the CBD.
However, it will pick up in 2016 and 2017 when these projects are occupied. While average asking rent is going to be higher due to healthy
recover in demand from big FDI projects including Samsung and Ascendas. In addition to prime locations, international management,
premium facilities as well as logical unit mix is crucial elements contributing to that advanced rental rate.
Besides adding more services, operators of serviced apartment are fl exible for short-term or even overnight stay to attract foreign
tourists. The collaboration with travel agencies and professional serviced accommodation websites like Homeaway, AirBnB, Agoda and
Booking.com contributes to the growth of this segment as well.
Outlook
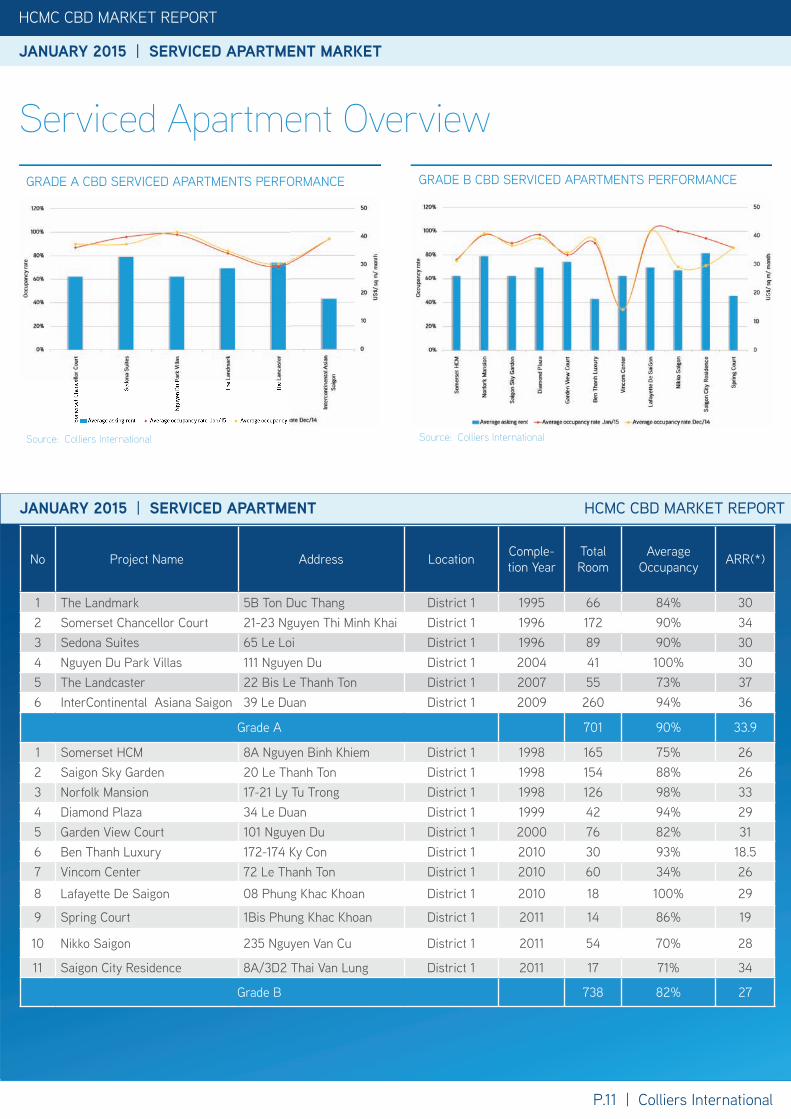
There were no signifi cant changes in both occupancy rate and average rent in Grade A serviced apartments on a m-o-m basis in
January. However, Grade B witnessed a slight increase in occupancy rate of 2 percentage points as a few developers / operators
slightly adjusted the rent to attract new occupiers. Average rent of Grade B declined by 0.6% m-o-m to US$26.9/sqm/month while
Grade A stood at US$33.9/sqm/month.
Market Performance
HCMC CBD MARKET REPORT
JANUARY 2015 | HOTEL MARKET
P.11 | Colliers International
HCMC CBD MARKET REPORT
* US$/sq m/month** Not including VAT*** Buildings are sorted by Year of Completion
JANUARY 2015 | SERVICED APARTMENT MARKET
JANUARY 2015 | SERVICED APARTMENT HCMC CBD MARKET REPORT
JANUARY 2015 | SERVICED APARTMENT MARKET
Serviced Apartment OverviewGRADE A CBD SERVICED APARTMENTS PERFORMANCE
Source: Colliers International
GRADE B CBD SERVICED APARTMENTS PERFORMANCE
Source: Colliers International
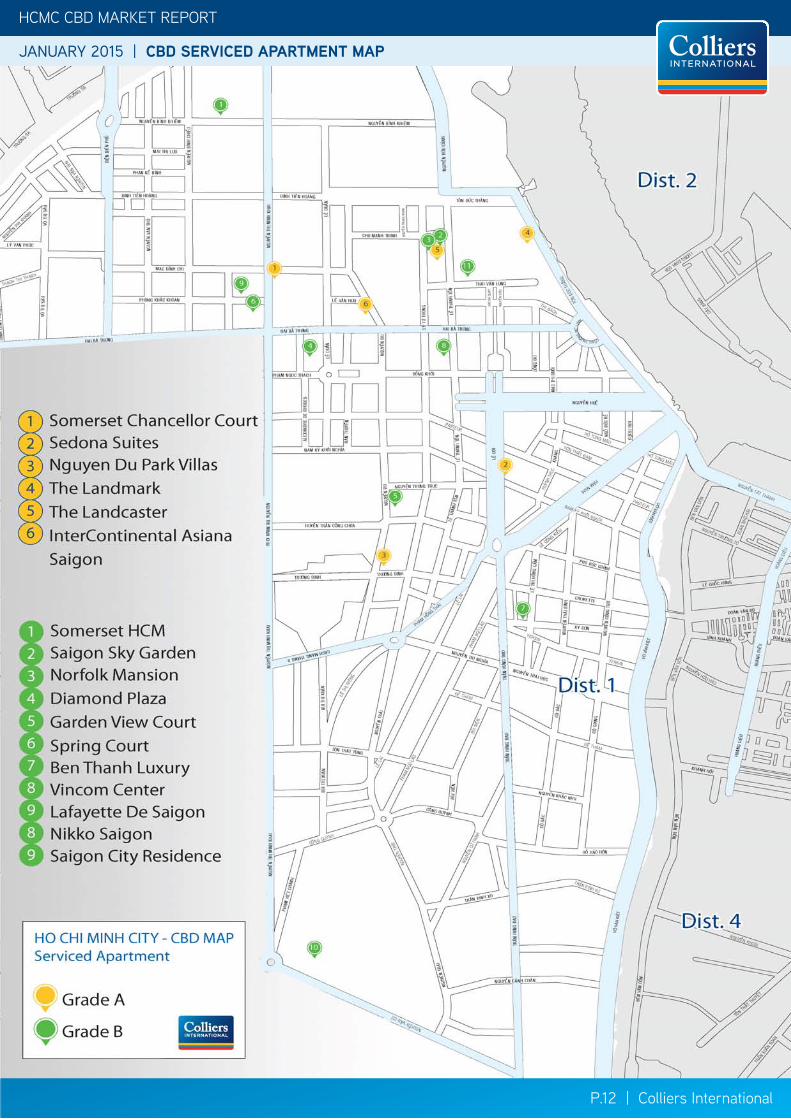
No Project Name Address Location Comple-tion Year
Total Room
Average Occupancy ARR(*)
1 The Landmark 5B Ton Duc Thang District 1 1995 66 84% 302 Somerset Chancellor Court 21-23 Nguyen Thi Minh Khai District 1 1996 172 90% 343 Sedona Suites 65 Le Loi District 1 1996 89 90% 304 Nguyen Du Park Villas 111 Nguyen Du District 1 2004 41 100% 305 The Landcaster 22 Bis Le Thanh Ton District 1 2007 55 73% 376 InterContinental Asiana Saigon 39 Le Duan District 1 2009 260 94% 36
Grade A 701 90% 33.9
1 Somerset HCM 8A Nguyen Binh Khiem District 1 1998 165 75% 262 Saigon Sky Garden 20 Le Thanh Ton District 1 1998 154 88% 263 Norfolk Mansion 17-21 Ly Tu Trong District 1 1998 126 98% 334 Diamond Plaza 34 Le Duan District 1 1999 42 94% 295 Garden View Court 101 Nguyen Du District 1 2000 76 82% 316 Ben Thanh Luxury 172-174 Ky Con District 1 2010 30 93% 18.57 Vincom Center 72 Le Thanh Ton District 1 2010 60 34% 26
8 Lafayette De Saigon 08 Phung Khac Khoan District 1 2010 18 100% 29
9 Spring Court 1Bis Phung Khac Khoan District 1 2011 14 86% 19
10 Nikko Saigon 235 Nguyen Van Cu District 1 2011 54 70% 28
11 Saigon City Residence 8A/3D2 Thai Van Lung District 1 2011 17 71% 34
Grade B 738 82% 27
HCMC CBD MARKET REPORT
JANUARY 2015 | CBD SERVICED APARTMENT MAP
P.12 | Colliers International

HCMC CBD MARKET REPORT
JANUARY 2015 | CBD SERVICED APARTMENT MAP
P.12 | Colliers International
HCMC CBD MARKET REPORT | JANUARY 2015
With more than 100 professionals in 2 offices in Vietnam, the team is market driven and has proven and successful track record with both international and local experience.
From Hanoi to Ho Chi Minh City, we provide a full range of real estate services
•Research > Market research across all sectors > Market analysis, advisory, and strategy
•Valuation & Advisory Services > Valuation for land, existing property or development sites > Feasibility studies to determine NPV, IRR and highest & best use
•Office Services > Tenant Representation > Landlord Representation
•Residential Sales & Leasing
•Retail Services
• Investment Services
•Real Estate Management Services
•Corporate Services
• Industrial Leasing
The foundation of our services is the strength and depth of our experience.
COLLIERS INTERNATIONAL
HO CHI MINH CITYBitexco Office Building, 7th Floor19-25 Nguyen Hue StreetDistrict 1, HCM City, VietnamTel: + 84 8 3827 5665
HANOICapital Tower, 10th Floor109 Tran Hung Dao Street, Hoan Kiem District, Hanoi, VietnamTel: +84 4 3941 3277
485 offices in63 countries on6 continentsUnited StatesCanadaLatin AmericaAsia PacificEMEA
Accelerating success
: 140: 42: 20: 195: 85
DAVID JACKSONDeputy General [email protected]+84 123 719 7184
YEN NGUYENResearch [email protected]+84 915 478 778
About Colliers InternationalColliers International is a leader in global real estate services, defined by our spirit of enterprise.Through a culture of service excellence and a shared sense of initiative, we integrate the resources of real estate specialists worldwide to accelerate the success of our partners.
We connect through a shared set of values that shape a collaborative environment throughout our organization that is unsurpassed in the industry.
Publication Coverage Frequency Content Availability
Investment Report Vietnam Quarterly Capital Markets Publicly available
Research & Forecast Report
Vietnam Cities Quarterly All market sectors Publicly available
CBD Report HCMC CBD Monthly Office, Retail, Hotel and Serviced Apartment
Publicly available
Asia Pacific Office Report
Asia Pacific in-cluding Vietnam
Quarterly Office market Publicly available
Vietnam Property Market Report
Vietnam cities Quarterly All market sectors On subscription
Development Recommendation
Vietnam cities At request All market sectors On subscription
$2billion in annual revenue
2.5billion square feet under management
15,700professionalsand staff
www.colliers.com/vietnam
Please contact, If you would like to recieve our other research reports
This document has been prepared by Colliers International for advertising and general information only. Colliers International makes no guarantees, representations or warranties of any kind, expressed or implied, regarding the information including, but not limited to, warranties of content, accuracy and reliability. Any interested party should undertake their own inquiries as to the accuracy of the information. Colliers International excludes unequivocally all inferred or implied terms, conditions and warranties arising out of this document and excludes all liability for loss and damages arising there from. This publication is the copyrighted property of Colliers International and/or its licensor(s). ©2013. All rights reserved.


![[HCMC STC Jan 2015] Making IT Count – Agile Test Metrics](https://img.pdfslide.us/doc/110x75/55a929c91a28abb3768b4877/hcmc-stc-jan-2015-making-it-count-agile-test-metrics.jpg)


![[HCMC STC Jan 2015] Choosing The Best Of The Plan-Driven And Agile Development Methods](https://img.pdfslide.us/doc/110x75/55a92a521a28abae768b48d6/hcmc-stc-jan-2015-choosing-the-best-of-the-plan-driven-and-agile-development-methods.jpg)


![[HCMC STC Jan 2015] Performing Target Test in UMTS Network](https://img.pdfslide.us/doc/110x75/55a92a551a28abae768b48da/hcmc-stc-jan-2015-performing-target-test-in-umts-network.jpg)

![[HCMC STC Jan 2015] Creating a Better Testing Future](https://img.pdfslide.us/doc/110x75/55a929cc1a28abb3768b487a/hcmc-stc-jan-2015-creating-a-better-testing-future.jpg)


![[HCMC STC Jan 2015] Proving Our Worth Quantifying The Value Of Testing](https://img.pdfslide.us/doc/110x75/55a929291a28abca768b47be/hcmc-stc-jan-2015-proving-our-worth-quantifying-the-value-of-testing.jpg)
![[HCMC STC Jan 2015] Workshop Of Context-Driven Testing In Agile](https://img.pdfslide.us/doc/110x75/55a896191a28abd8238b4687/hcmc-stc-jan-2015-workshop-of-context-driven-testing-in-agile.jpg)