Embed Size (px)
Citation preview

Accelerating successwww.colliers.com/vietnam
HANOI QUARTERLY KNOWLEDGE REPORT Q4 2016

TABLE OF CONTENTS
ECONOMIC OVERVIEW...............................................................................................................
VIETNAM ....................................................................................................................................
HO CHI MINH CITY ......................................................................................................................
HA NOI ........................................................................................................................................
HA NOI MARKET OVERVIEW ................................................................................................ OFFICE ........................................................................................................................................
RETAIL ........................................................................................................................................
CONDOMINIUM ............................................................................................................................
VILLA & TOWNHOUSE .................................................................................................................
SERVICED APARTMENT ..............................................................................................................
INDUSTRIAL ................................................................................................................................
Cover Page: Hanoi Skyline
4-5
4
5
5
6-17
6
8
10
12
14
16
Page

LIST OF FIGURES Figure 1: Vietnam Exports - Imports in 2016.......................................................................................
Figure 2: International Arrivals to Vietnam in 2016 ............................................................................
Figure 3: FDI Capital of HCMC and Hanoi ..........................................................................................
Figure 4: GDP Growth Rate of HCMC and Hanoi ................................................................................
HA NOI MARKET OVERVIEW Figure 5: Office, Average Asking Rent.................................................................................................
Figure 6: Office, Occupancy Rate .......................................................................................................
Figure 7: Retail, Market Performance .................................................................................................
Figure 8: Retail, Total Supply .............................................................................................................
Figure 9: Condominium, Primary Sale Price ......................................................................................
Figure 10: Condominium, New Launches by Year ...............................................................................
Figure 11: Condominium, Sold Units by Segment and Year ..................................................................
Figure 12: Villa and Townhouse, Supply by Quarter ............................................................................
Figure 13: Villa and Townhouse, Supply by District .............................................................................
Figure 14: Villa and Townhouse, Q-o-Q changes in Secondary Price ..................................................
Figure 15: Serviced Apartment, Average Asking Rent by Grade ..........................................................
Figure 16: Serviced Apartment, Current Grade A&B supply ................................................................
Figure 17: Industrial, Market Performance by Distrtict ........................................................................
Figure 18: Industrial, Supply by District ..............................................................................................
LIST OF TABLES Table 1: Macroeconomic Indicators of HCMC and Hanoi ......................................................................
Table 2: Office, Future Supply.............................................................................................................
Table 3: Significant CBD Office Projects ...........................................................................................
Table 4: Retail, Future Supply ...........................................................................................................
Table 5: Significant Retail Projects ...................................................................................................
Table 6: Condominium, New Projects Launched in Q4 2016 ..............................................................
Table 7: Villa and Townhouse, New Projects Launched in Q4 2016 ....................................................
Table 8: Serviced Apartment, Future Supply .....................................................................................
Table 9: Significant Serviced Apartment Projects .............................................................................
Table 10: Industrial, Future Supply ....................................................................................................
Table 11: Hanoi Industrial Market Overview ........................................................................................
4
4
5
5
6
6
8
8
10
10
10
12
12
12
14
14
16
16
5
6
7
8
9
11
13
14
15
16
17
Page

GDPVietnam’s GDP was estimated to grow by 6.2% in 2016, driven mostly by industrial expansion and growth in construction and services. This year recorded a decrease in the country’s economic growth rate compared to the growth of 6.68% in 2015. The service sector grew by 7.57% y-o-y while the industrial and construction increased by 6.98% y-o-y. The whole year witnessed a big slowdown in agriculture-forestry-fishing with a modest growth rate of 1.36% y-o-y mainly due to natural disasters. Although 2016’s GDP was below the 6.7% target set by the National Assembly, the country remained one of the strongest performers in the region. We expect next year’s GDP to remain on a positive trajectory with our full year forecast standing at 6.5% on the back of increasing global integration and local production recovery.
CPIThe last month of 2016 saw a slight increase of 0.73% m-o-m in CPI index, despite purchasing needs at the year end. For the whole year, average CPI rose by 2.7% y-o-y. Six out of eleven major goods and service groups saw price rises with the highest growth recorded in medicine and healthcare services, at 5.3%. Main reasons for the CPI hike in 2016 were determined to be the government’s upward price adjustment of healthcare services and natural disasters’ effects on crops.With the target CPI of 4% set by National Assembly, price adjustment methods should be implemented for key commodity groups such as healthcare services, electricity and water, as well as a close supervision process should be kept on the world oil price to prevent the domestic price from shooting up.
FDIAs of the end of 2016, the country attracted 2,556 new foreign investment projects with total investment of both newly registered and supplementary capital reaching USD24.37 billion, representing an increase of 7.1% y-o-y in capital. Of the total, there are 1,225 already-operating projects raising their capital by more than USD5.7 billion. Investment in real estate accounted for 10.1%, which is equivalent to USD1.52 billion. South Korea was the largest foreign investor with USD5.5 billion, accounting for 36.6% of total capital, followed by Singapore and China with USD1.59 billion and USD1.26 billion, respectively.
RETAIL SALES Vietnam’s retail sales of goods and services reached USD156 billion, up 10.2% y-o-y. If the price factor was excluded, the growth rate would be 7.8% y-o-y, lower than the increase of 8.5% y-o-y in 2015. By sector, retail sales of goods achieved USD118.4 billion, accounting for 75.9% of total sales, up 10.2% y-o-y. Retail sales of accommodation and catering services reached USD18.3 billion, accounting for 11.3% of total sales, representing an increase of 10.7% y-o-y. Retail sales of tourism services, comprising 1% of total sales, reached USD 1.5 billion, up 12% y-o-y. Retail sales of other services, accounting for 11.4% of total sales, were estimated at USD17.8 billion, equivalent to 9.3% increase y-o-y.
INTERNATIONAL ARRIVALS In 2016, Vietnam welcomed 10.01 million international visitors, equivalent to a significant increase of 26% y-o-y. Thanks to visa exemption policy for citizens from five European countries and various tourism marketing strategies, this is the first time the country attracted such a high number of international tourists, a twofold increase compared to the number of 2010. Asian visitors took the lead with more than 7.2 million arrivals, mainly from traditional markets such as China, South Korea and Japan, comprising 72.5% of total visitors, followed by European visitors with 1.6 million arrivals and American tourists with 0.7 million arrivals, respectively.
TRADE BALANCEIn 2016, Vietnam earned roughly USD175.9 billion from exports, reporting an increase of 8.6% y-o-y. Import turnovers reached USD173.3 billion, up 4.6% against the previous year. As a result, the whole country registered a USD2.6 billion trade surplus. Of the total, the domestic economic sector reported a trade deficit of USD21.02 billion with USD50 billion in exports and USD71.1 billion in imports. On the contrary, the FDI sector enjoyed a trade surplus of USD23.7 with export revenues of USD125.9 and import revenues of USD102.1. While the United States took the lead in export revenues with USD38.1 billion, China remained the country’s largest import market with USD49.8 billion. By product, phones and phone parts, electronic goods, textile and garments, computers, machinery and equipment are the major foreign currency earners.
Q4 2016 | ECONOMIC OVERVIEW
©2017 Colliers International Research
VIETNAM QUARTERLY KNOWLEDGE REPORT
Page 4
2017 forecast
Figure 1: Exports - Imports in Vietnam in 2016
Source: General Statistics Office | Colliers International Research
Figure 2: International arrivals to Vietnam in 2016
Source: General Statistics Office | Colliers International Research
VIETNAM
-50
0
50
100
150
200
20052006200720082009 2010 2011 2012 2013 2014 2015 2016
USD
billio
n
Exports Imports Trade Balance
2,000
3,000
4,000
5,000
6,000
7,000
8,000
9,000
10,000
11,000
200520062007200820092010 2011 2012 2013 2014 2015 2016
thou
sand
arr
ival
s
International tourist arrivals Average

Q4 2016 | ECONOMIC OVERVIEW
VIETNAM QUARTERLY KNOWLEDGE REPORT
2017 forecast
Q4 2016 | ECONOMIC OVERVIEW
©2017 Colliers International Research
VIETNAM QUARTERLY KNOWLEDGE REPORT
Page 5
Figure 4: GDP Growth Rate of HCMC and Hanoi
Source: General Statistics Office | Colliers International Research
Source: General Statistics Office | Colliers International Research
Table 1: Marcoeconomic Indicators of HCMC and Hanoi
HCMC Hanoi
2016 2017 2016 2017
GDP (billion) 45.3 21.2
FDI (million) 1443.8 2800
Retail sales (billion) 30.1 22.3
Export (billion) 31.8 24.8
Import (billion) 37.9 14.2
HO CHI MINH CITY
In 2016, GRDP of Ho Chi Minh City achieved USD45.29 billion with the growth rate of 8.05% y-o-y. In particular, the service sector was the dominant contributor with USD24.8 billion, comprising 54.8% of the city’s economy, followed by the industrial & construction sector and the agriculture-forestry-fishery sector, accounting for 0.84% and 28.76% respectively. Of the whole year, total newly registered and supplementary FDI achieved USD1.44 billion in which there were 177 supplementary projects, worth of USD529.2 million. Investment in real estate took the lead with 24 projects and USD357.4 million, accounting for 39.1% of total inflows. Cayman Islands was recorded as the biggest foreign investor in the city, with USD270.5 million in registered capital, accounting for 29.6%, followed by Japan (USD190.2 million) and Singapore (USD110.9 million).Retail sales achieved USD30.1 billion, up 9.1% y-o-y. Highest growth rates were seen in products which help to improve the quality of life and traveling demand such as motor vehicles, household appliances, building materials and gasoline.The city’s export values reached USD31.8 billion, up 5.2% y-o-y. Garments, agricultural products and computers & electronic devices contributed the most to export values. The United States was the largest export market with nearly USD5.4 billion, up 5% y-o-y. Import values increased by 12.4% y-o-y, worth of USD37.85 billion, resulting in the city’s trade deficit of USD6 billion. The top segments of import values were milk and dairy products, fuel, garment material, plastics and iron & steel.
HANOI
In 2016, Hanoi’s GRDP achieved USD21.18 billion with the growth rate of 8.2%. The industrial-construction sector and the service sector had the highest growth rates, up 9% and 8.3% y-o-y respectively, while the agriculture-forestry-fishery sector saw a modest growth rate of 2.21% y-o-y. Of the whole year, the capital city’s CPI increased 2.66% y-o-y. Out of 11 sectors in the CPI basket, food and transportation witnessed a slight fall in price. As of the end of 2016, FDI inflows of both newly registered and supplementary capital reached USD2.8 billion, up 46.4% in number of projects and 164% in capital compared to the same period last year. Disbursed capital was USD1.2 billion.Retail sales of the capital city were up 8.8% compared to last year, reaching USD22.3 billion.In 2016, the city achieved USD10.61 billion in export revenues and USD24.83 billion in import revenues, causing a trade deficit of USD14.22 billion in the whole year. The capital city welcomed 2.8 million international visitors in 2016, equivalent to an increment of 19.9% y-o-y.
Figure 3: FDI Capital of HCMC and Hanoi
Source: General Statistics Office | Colliers International Research
6%
8%
10%
12%
14%
2005 2006 2007 2008 2009 2010 2011 2012 2013 2014 2015 2016
HCMC Hanoi
0
500
1,000
1,500
2,000
2,500
3,000
3,500
4,000
2012 2013 2014 2015 2016
US
D m
illio
nHCMC Hanoi

Accelerating success
Q4 2016 | HA NOI | OFFICE
VIETNAM QUARTERLY KNOWLEDGE REPORT
©2017 Colliers International Research Page 6
PERFORMANCEThe last quarter of 2016 witnessed a fall in rents across all grades due to continued oversupply, staying at USD22.5/sqm/month, down 1.7% q-o-q. Average net asking rent of Grade A declined 3% q-o-q to USD27.2/sqm/month while Grade B’s rent remained relatively static at USD17.9/sqm/month. Average occupancy rate continued to show a downward trend because of an oversupply, standing at 78.7%, which was a decline of 4.5 ppts q-o-q. Grade A’s occupancy rate was down 3 ppts to 80% while Grade B experienced a significant decrease of 6 ppts q-o-q, staying at 78%. The diminishing trend in both rents and occupancy rates is expected to continue in 2017 since a huge gap exists between supply and demand in Hanoi’s office marke.
SUPPLYThe last quarter of 2016 recorded no new supply entering the market. The capital city currently has approximately 410,000 sqm NLA of Grade A and 770,000sqm NLA of Grade B office buildings. On a yearly basis, the city saw a surge in supply in both Grade A and Grade B buildings with growth rates of nearly 14% y-o-y and 5% y-o-y, respectively. Despite an existing oversupply, it is predicted that a large amount of additional supply would be coming in the future as many office projects which were due for completion in 2016 rescheduled their construction progress for 2017.
DEMANDRecently, the Federal Reserve decided to raise its key interest rate by a quarter point, which is forecasted to widely affect the global economy. Theoretically, once US rates rise, global investors are more likely to move their money out of emerging markets like Vietnam and back to less risky countries like US. Nevertheless, in the short and medium run, this small change will not be enough to dramatically affect capital flows, suggesting that the impact on property market and demand for office space as well will be limited. Economic recovery, coupled with improvements in business environment in previous years are expected to fuel the demand for establishing a new office or expanding current premises of foreign and domestic enterprises, proving a supportive landscape for the office market in Hanoi in the upcoming period.
OUTLOOKBy 2017, the capital city’s office market will welcome 8 new projects which are currently under construction, providing approximately 331,122 sqm of new space. Given the huge pipeline, the office market in Hanoi will remain as the tenant-oriented market, indicating that rental rates will maintain their downward trend in the coming years. As rents and vacancy rates are continuing to come down, we will see tight competition between landlords in CBD and non-CBD areas. In order to attract more tenants, property owners need to apply appropriate marketing and pricing strategy as well as to maintain their properties with good management services.
Figure 5: Office, Average Asking Rent
Source: Colliers International Research
Figure 6: Office, Occupancy Rate
Source: Colliers International Research
Table 2: Office, Future Supply
Source: Colliers International Research
Project name Grade NLA (sqm)
Expected completion
Horison Tower B 8,000 Q1 2017
Discovery Complex B 93,320 Q2 2017
Comatce Tower B 43,100 Q2 2017
Eurowindow Building B 16,592 Q3 2017
Vinacomin Tower B 103,100 Q4 2017
DSD Building B 6,860 Q4 2017
Handi Resco Tower B 24,190 Q4 2017
FLC Twin Tower B 35,960 Q4 2017
0
5
10
15
20
25
30
35
40
Q1 Q2 Q3 Q4 Q1 Q2 Q3 Q4 Q1 Q2 Q3 Q4 Q1 Q2 Q3 Q4 Q1 Q2 Q3 Q4
2012 2013 2014 2015 2016
US
$/sq
m/m
onth
Grade A Grade B
50%
55%
60%
65%
70%
75%
80%
85%
90%
95%
100%
Q1 Q2 Q3 Q4 Q1 Q2 Q3 Q4 Q1 Q2 Q3 Q4 Q1 Q2 Q3 Q4 Q1 Q2 Q3 Q4
2012 2013 2014 2015 2016
Grade A Grade B

Q4 2016 | HA NOI | OFFICE
©2017 Colliers International Research
VIETNAM QUARTERLY KNOWLEDGE REPORT
Page 7
(*) US$/sqm/month (NLA)
Table 3: Significant CBD Office Projects
No Name Address Completion Year
NLA (sqm)
Service Charges
(*)
Occupancy rate
Average asking rent
(**)1 Central Building 31 Hai Ba Trung 1995 3,653 9.0 100% 33.0
2 International Centre 17 Ngo Quyen 1995 6,500 - 90% 24.03 Hanoi Tower 49 Hai Ba Trung 1997 9,000 - 100% 27.04 63 Ly Thai To Building 63 Ly Thai To 1998 6,753 included 100% 47.05 Sun Red River Building 23 Phan Chu Trinh 1999 13,459 7.0 97% 28.06 Vietcombank Tower 198 Tran Quang Khai 2000 19,563 included 100% 29.0
7 Opera Business Centre 60 Ly Thai To 2007 3,787 included 98% 22.08 Pacific Palace 83B Ly Thuong Kiet 2007 16,600 7.4 85% 36.8
9 Asia Tower 2 Nha Tho 2007 3,100 7.7 87% 38.010 Sun City Building 13 Hai Ba Trung 2007 6,400 - 100% 45.0
11 BIDV Tower 194 Tran Quang Khai 2010 10,120 7.0 96% 29.3
12 Sentinel Place Hang Da 2010 8,000 8.5 98% 35.0
13 Corner Stone 16 Phan Chu Trinh 2013 26,500 7.0 96% 31.0
14 Hong Ha Center 25 Ly Thuong Kiet 2013 11,000 5.0 93% 20.0
Grade A 144,435 7.0 96% 31.1
1 Tungshing Square 2 Ngo Quyen 1996 8,306 5.7 90% 28.72 Melia Hotel 44B Ly Thuong Kiet 1997 8,500 - 90% 38.0
3 Prime Centre 53 Quang Trung 1998 7,600 - 100% 27.0
4 VIB Hai Ba Trung 59 Quang Trung 2006 3,000 - 68% 16.05 Capital Tower 109 Tran Hung Dao 2010 21,089 7.0 99% 35.06 Hanoi Tourist Building 18 Ly Thuong Kiet 2010 7,600 - 100% 24.0
7 Capital Building 72 Tran Hung Dao 2013 5,800 - 100% 25.08 Coalimex Building 33 Trang Thi 2013 5,071 5.0 79% 18.09 VID Building 115 Tran Hung Dao 2013 4,930 - 89% 23.010 Artex Port 31-33 Ngo Quyen 2014 4,725 - 100% 23
Grade B 76,621 6.0 94% 28.6

Accelerating success
Q4 2016 | HA NOI | RETAIL
VIETNAM QUARTERLY KNOWLEDGE REPORT
©2017 Colliers International Research Page 8
Table 3: Significant Office ProjectsPERFORMANCEAverage net asking rents in 2016 dropped 5% y-o-y, staying at USD38/sqm/month. While rents of the CBD recorded a nominal rise by 2% y-o-y, reaching USD81/sqm/month, those of non-CBD declined 6% y-o-y, staying at USD30/sqm/month. Due to weak purchasing power and considerable new supply, retail centers in Hanoi are suffering from increasing vacancy space. Average occupancy rates in 2016 decreased 2%, staying at 87% across all segments.
SUPPLYIn Q4 2016, three new retail centers, Vincom Center Pham Ngoc Thach, Vincom Plaza Bac Tu Liem and Trang An Complex entered the market, providing an additional 64,500sqm GFA. With a prominent retail mix of shopping, entertainment and F&B services, Vingroup has expanded its network across the capital city through its 6th and 7th shopping mall. Trang An Complex includes 10,500sqm GFA of retail space which has been fully occupied. After eight years of operation, Parkson Viet Tower was closed in December 2016, withdrawing 11,000sqm GFA. With the closure of two department stores within a two-year period, Parkson officially decided to leave Hanoi.
DEMANDAccording to a recent survey in Vietnam by Nielsen, as of Q3 2016, Consumer Confidence Index in Viet Nam remained strong at 107 points, unchanged from the previous quarter and stayed among the top 10 most optimistic globally. Compared to neighboring countries, Vietnam’s consumer confidence level ranked fourth out of six South East Asia countries, lagging behind the Philippines, Indonesia and Thailand, while other regional peers experienced below 100 points over the same period. The continued strong consumer confidence index may have positive impacts on retail sales and in turn spur demand for retail space in Hanoi.
OUTLOOKThere are a number of developments which were under construction, or being proposed, which include quality retail facilities that will provide more shopping centres over the coming years. A steady supply of new developments is expected to enter the market from 2017 onwards, and overall the long-term outlook is positive on the back of improved economic growth and benefits from the liberalization of retail sector under conditions of Vietnam’s WTO membership and the recent participation in the Trans-Pacific Partnership.
Figure 7: Retail, Market Performance
Table 4: Retail, Future Supply
Source: Colliers International Research
Source: Colliers International Research
Figure 8: Retail, Total Supply
Source: Colliers International Research
Project Name District GFA (sqm) Expected completion
Horizon Tower Tu Liem 6,719 Q1 2017
Discovery Complex Cau Giay 38,144 Q2 2017
Ecolife Capital Nam Tu Liem 20,000 Q3 2017
Artemis Thanh Xuan 27,000 Q3 2017
Loc Ninh Singashine Chuong My 14,800 Q4 2017
FLC Twin Towers Cau Giay 25,000 Q4 2017
Handi Resco Thanh Xuan 4,769 Q4 2017
Eco Green City Hoang Mai 7,000 Q4 2017
0
100,000
200,000
300,000
400,000
500,000
600,000
700,000
800,000
2010 2011 2012 2013 2014 2015 2016
sqm
CBD Non-CBD
0
10
20
30
40
50
60
70
75%
80%
85%
90%
95%
100%
2010 2011 2012 2013 2014 2015 2016
US$/
sqm
/mon
th
Rental rate Occupancy

VIETNAM QUARTERLY KNOWLEDGE REPORT
Accelerating success
Q4 2016 | HA NOI | RETAIL
VIETNAM QUARTERLY KNOWLEDGE REPORT
©2017 Colliers International Research Page 9
Table 5: Significant Retail Projects
No Name of Project /Building Address Location Completion
YearNLA
(sq m) ARR (*) Occupancy Rate
1 Central Building 31 Hai Ba Trung Hoan Kiem 1995 550 90-100 100%2 Hanoi Tower 49 Hai Ba Trung Hoan Kiem 1997 2,515 50-60 73%3 63 Ly Thai To Building 63 Ly Thai To Hoan Kiem 1998 650 150 100%4 ICC Building 71 Nguyen Chi Thanh Dong Da 2006 2,900 19 87%5 Pacific Place 83b Ly Thuong Kiet Hoan Kiem 2007 2,300 72 100%6 Opera Business Center 6b Trang Tien Hoan Kiem 2007 370 90-150 100%
7 Asia Tower 6 Pho Nha Tho Hoan Kiem 2008 300 95 41%
8 Sentinel Place 41A Ly Thai To Hoan Kiem 2010 700 45 100%9 Sky City Tower 88 Lang Ha Dong Da 2010 5,400 20-80 100%10 The Lancaster Hanoi 20 Nui Truc Ba Dinh 2013 3,123 26-33 74%11 Madarin Garden Residential 1 Hoang Minh Giam Cau Giay 2013 11,000 25-30 97%
Retail Podium 29,808 92%
1 Vincom Center Ba Trieu - Tower A&B 191 Ba Trieu Hai Ba Trung 2004 17,700 90-100 99%2 Vincom Center Ba Trieu - Tower C 191 Ba Trieu Hai Ba Trung 2004 10,974 80 100%3 Ruby Plaza 44 Le Ngoc Han Hai Ba Trung 2007 2,400 18 99%4 Syrena 51B Xuan Dieu Tay Ho 2008 4,153 30 100%5 Trang Tien Plaza 24 Hai Ba Trung Hoan Kiem 2008 12,000 10 85%6 Savico MegaMall 7-9 Nguyen Van Linh Long Bien 2011 43,500 20-25 99%7 Vincom Center Long Bien KDT Vincom Long Bien 2012 29,000 20 70%8 Indochina Plaza Hanoi 241 Xuan Thuy Cau Giay 2012 17,000 27 97%9 Vincom Mega Mall - Royal City 72A Nguyen Trai Thanh Xuan 2013 181,317 70 99%10 Vincom Mega Mall - Time City 458 Minh Khai Hai Ba Trung 2014 83,950 50 100%11 Aeon Mall Long Bien 2 Co Linh Long Bien 2015 72,000 45 100%12 Vincom Nguyen Chi Thanh 54A Nguyen Chi Thanh Dong Da 2015 65,328 70-80 99%
Shopping Centre 539,322 97%
1 The Garden (Bitexco) Me Tri Tu Liem 2007 24,063 28-35 90%2 Ho Guom Plaza Ha Dong Ha Dong 2013 23,380 16 94%3 Lotte Department Store 54 Lieu Giai Ba Dinh 2014 21,480 43 97%
Department Store 68,923 94%
(*) ARR (Average Rental Rate): All rents are stated in net rents per sqm, inclusive service charge but exculding VAT

Accelerating success
Q4 2016 | HA NOI | CONDOMINIUM
VIETNAM QUARTERLY KNOWLEDGE REPORT
©2017 Colliers International Research Page 10
PERFORMANCEThe year 2016 recorded 20,900 successful transactions across all segments, down 1.9% compared to the previous year. Mid to high-end segments dominated sales with 9,700 and 6,800 sold units, accounting for 46% and 32% of market share respectively. Price growth on the primary market was at 3-5% y-o-y on average. Prices in high-end segments registered the strongest growth at 9% y-o-y while those in mid-end and affordable segments were static at 2% and 1% growth on yearly basis.
SUPPLYThe total number of newly launched units in 2016 reached approximately 30,000 which were lower 10% than those of 2015. By segment, mid-end and high-end segment recorded the highest number of new launches with more than 80% of total new supply. The luxury segment was revived with two new projects in the Westlake while the affordable segment significantly decreased in its stock. Large land bank and upgrading infrastructure enabled the West and South West to provide largest supply among other areas of the city.
DEMANDHanoi currently has a population of approximately 7.5 million, comprising 12.2% of the whole nation’s population of 91.7 million people. The population growth rate is proportionally high compared to the country average of 1.07% between 2010 and 2015. The number of residents in the city is forecasted to continue to rise at a constant rate to an estimated figure of 7.9 million at the end of 2020. Steady population growth is the main driver of the condominium market in the city.
OUTLOOKVingroup, a leading property developer, recently unveiled Vin City, a brand-new project aimed at providing affordable apartments in seven major cities and provinces throughout the country. To meet the demand of middle and low income buyers, more developers in Hanoi have begun to tap into this potential market segment. It is expected that the shortage of affordable housing will be resolved in coming years.
Figure 9: Condominium, Primary Sale Price
Source: Colliers International Research
Figure 10: Condominium, New Launches by Year
Source: Colliers International Research
Source: Colliers International Research
Figure 11: Condominium, Sold Units by Segment and Year
$-
$1,000
$2,000
$3,000
$4,000
$5,000
$6,000
$7,000
$8,000
2010 2011 2012 2013 2014 2015 2016
Luxury High-end Mid-end AffordableUS$/sqm
0
5000
10000
15000
20000
25000
30000
35000
40000
2010 2011 2012 2013 2014 2015 2016 2017F 2018F 2019F
units
0
5,000
10,000
15,000
20,000
25,000
2010 2011 2012 2013 2014 2015 2016
units
Luxury High-end Mid-end Affordable

Q4 2016 | HA NOI | CONDOMINIUM
VIETNAM QUARTERLY KNOWLEDGE REPORT
Q4 2016 | HA NOI | CONDOMINIUM
VIETNAM QUARTERLY KNOWLEDGE REPORT
©2017 Colliers International Research Page 11
Table 3: Significant Office ProjectsTable 3: Significant Office Projects
* Excluding all kinds of tax, promotions and management feeThe information is updated as at the end of Q4 2016
Table 6: Condominium, New projects launched in Q4 2016
No Name of Project/Building Developer Location Completion Year
Number of units
Asking Price (US$/sqm)
1 Tu Hiep Plaza Vinh Hanh Corp Thanh Tri 2016 648 7002 Anland Complex Nam Cuong Corp Ha Dong 2017 533 1,1003 Roman Plaza Hai Phat Corp Ha Dong 2017 804 1,0004 The Legend Nguyen Tuan Dai Viet Tri Tue Thanh Xuan 2017 400 1,5205 Sunshine Garden Sunshine Group Hai Ba Trung 2017 1,278 1,1506 Sunshine Boulevard Sunshine Group Thanh Xuan 2017 500 1,4007 Sunshine Center Sunshine Group Nam Tu Liem 2017 398 1,300
8 Sunshine Riverside Sunshine Group Tay Ho 2017 168 1,600
9 Ha Noi Paragon VT Corp Cau Giay 2017 495 1,400
10 Sunshine Palace Sunshine Group Hoang Mai 2017 396 1,200
11 D’.Capitale - C1, C6 Tan Hoang Minh Cau Giay 2018 1,800 1,850
12 D’.Eldorado 1 Tan Hoang Minh Tay Ho 2018 340 1,700
13 D’.Eldorado 2 - Phu Thanh complex Tan Hoang Minh Tay Ho 2018 136 1,600
14 Rivera Park Long Giang Land Thanh Xuan 2018 666 1,250
15 The Golden Palm HDIS Nam Tu Liem 2018 400 1,500
16 An Bình City - block A2 Geleximco Thanh Xuan 2018 276 1,000
17 Legend Park VIG Nam Tu Liem 2018 318 1,800
New launches in Q4 2016 9,556

Accelerating success
Q4 2016 | HA NOI | VILLA & TOWNHOUSE
VIETNAM QUARTERLY KNOWLEDGE REPORT
©2017 Colliers International Research Page 12
PERFORMANCEThanks to improved year-end sentiment, the last quarter of 2016 witnessed the highest transaction volumes in two years with more than 750 successful deals, up 129% compared to the previous quarter. By type of property, townhouses dominated sales activities with 64% of total transactions. Tu Liem and Ha Dong took the lead with nearly 50% of sales owning to their large land availability. Market secondary price saw a decrease of 2% q-o-q and 3% y-o-y, averaging at USD3,238.6 for completed properties. Cau Giay District had the highest average price, up 4.2% q-o-q. Meanwhile, most of other districts recorded a decline in price on the secondary market.
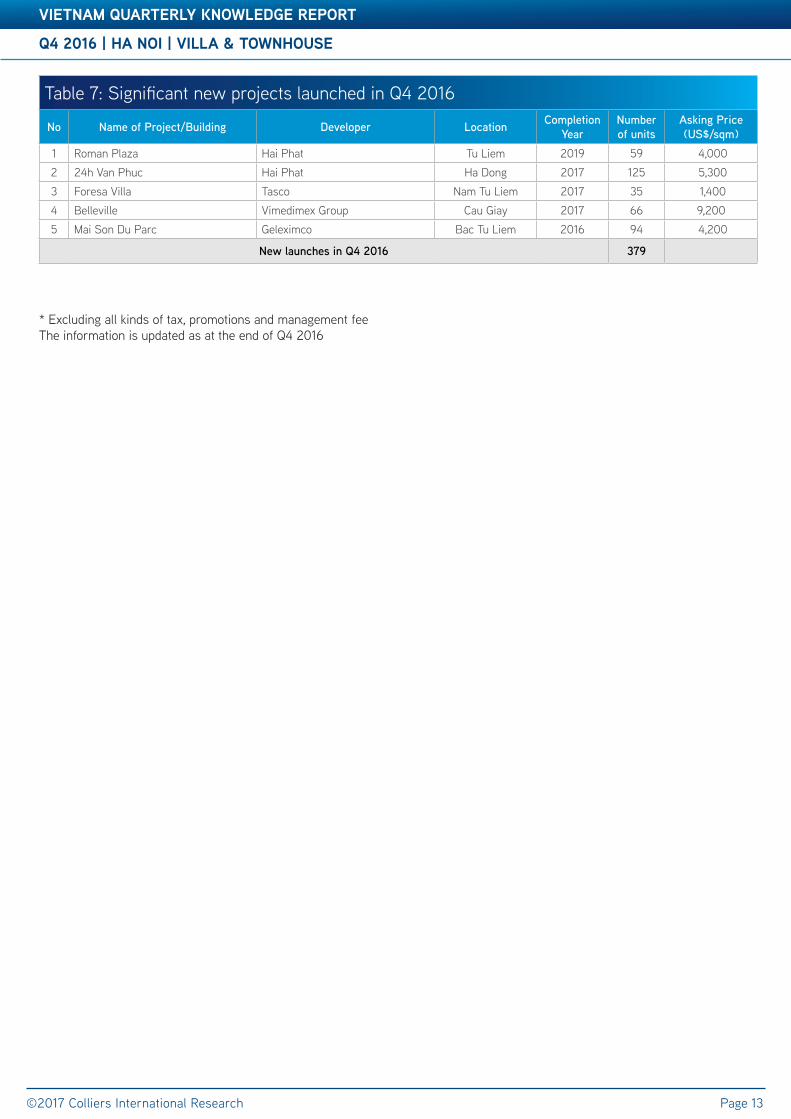
SUPPLYThe supply pipeline in the last quarter of 2016 saw approximately 370 dwellings from 5 projects coming to the market. Ha Dong, Nam Tu Liem and Bac Tu Liem Districts were the dominant contributors, cumulatively accounting for more than 80% of the market share. Townhouse was the most popular product with 275 units, accounting for nearly 75% of total newly launched supply. Some of notable launches in Q4 2016 were Belleville, Foresa Villa, Mai Son Du Parc and 24h Van Phuc.
DEMANDWhile pricing is the most determinant element for buyers in affordable segment, the villa and townhouse segment targets affluent customers who initially focus their spending on improving living conditions. With the growing middle and affluent class in Vietnam, the demand for landed properties is expected to be on the rise.In addition, landed property is considered as an investment vehicle, which ensures the highest profitability possible and protects investors’ assets against currency devaluation. The preferred choice of landed housing among Vietnamese people is also supporting the segment.
OUTLOOKGiven the current construction status, the market will see 8 projects coming online, providing some 2680 units in the next coming years, with the number of townhouses expected to dominate the market share. The villa and townhouse performance in the Hanoi City market is predicted to remain strong in the short term owning to the positive sentiment in both demand and supply. Thanks to better land availability, landed property projects tend to be developed in suburban districts. The success of these projects is closely linked to infrastructure development.
Figure 12: Villa and Townhouse, Supply by quarter
Source: Colliers International Research
Figure 13: Villa and Townhouse, Supply by District
Source: Colliers International Research
Source: Colliers International Research
Figure 14: Villa and Townhouse, Q-o-Q changes in secondary price
0
20
40
60
80
100
120
140
160
26,000
27,000
28,000
29,000
30,000
31,000
32,000
33,000
34,000
35,000
36,000
Q3 Q4 Q1 Q2 Q3 Q4 Q1 Q2 Q3 Q4
2014 2015 2016
No.
of
proj
ects
units
Units No. of Projects
-10
-8
-6
-4
-2
0
2
4
0
1000
2000
3000
4000
5000
6000
Q1 Q2 Q3 Q4 Q1 Q2 Q3 Q4 Q1 Q2 Q3 Q4 Q1 Q2 Q3 Q4 Q1 Q2 Q3 Q4
2012 2013 2014 2015 2016
%
US
D/s
qm
Market Average Price Q4 2015 Q-o-Q changes
Ha Dong 31%
Nam Tu Liem26%
Bac Tu Liem25%
Cau Giay18%
Q4 2016 | HA NOI | VILLA & TOWNHOUSE
VIETNAM QUARTERLY KNOWLEDGE REPORT
Accelerating success
Q4 2016 | HA NOI | VILLA & TOWNHOUSE
VIETNAM QUARTERLY KNOWLEDGE REPORT
©2017 Colliers International Research Page 13
Table 3: Significant Office ProjectsTable 3: Significant Office ProjectsTable 3: Significant Office Projects
* Excluding all kinds of tax, promotions and management feeThe information is updated as at the end of Q4 2016
Table 7: Significant new projects launched in Q4 2016
No Name of Project/Building Developer Location Completion Year
Number of units
Asking Price (US$/sqm)
1 Roman Plaza Hai Phat Tu Liem 2019 59 4,000 2 24h Van Phuc Hai Phat Ha Dong 2017 125 5,300 3 Foresa Villa Tasco Nam Tu Liem 2017 35 1,400 4 Belleville Vimedimex Group Cau Giay 2017 66 9,200 5 Mai Son Du Parc Geleximco Bac Tu Liem 2016 94 4,200
New launches in Q4 2016 379

Accelerating success
Q4 2016 | HA NOI | SERVICED APARTMENT
VIETNAM QUARTERLY KNOWLEDGE REPORT
©2017 Colliers International Research Page 14
Table 3: Significant Office ProjectsPERFORMANCEThe market in the capital city saw a slight increase of 1ppt q-o-q in the average occupancy rate, staying at 85%, but also witnessed a slight decrease of 2% q-o-q in average rental rates, staying at USD26.1/sqm/month. On a yearly basis, the city’s average occupancy rate remained unchanged, whilst the decline of average rental price was about 3.3%, equivalent to a drop of USD0.9/sqm/month. By segment, Grade A’s rent stayed unchanged q-o-q, at USD32/sqm/month and its occupancy rate dipped slightly by 1ppt, at 84%. Grade B dropped 5% q-o-q in rents but climbed 3.5ppts in occupancy rates, staying at 84% and USD20.2/sqm/month respectively.
SUPPLYThe market, with no new supply last quarter, has 41 buildings providing 2,200 serviced apartments from studios to four-bedroom units and penthouses. By type of apartments, two-bedroom units continued to dominate the market share with more than 50% of total supply. The asking rent of this type of apartments usually falls into a range of USD1,600-USD2,000 per unit. In terms of location, Ba Dinh District was the largest source of supply in Hanoi serviced apartment, accounting for 28% of all units in the market, followed by Tay Ho District with 24% of total supply.
DEMANDServiced apartments can be seen as hybrid properties filling the gap between leased residences and hotel rooms as they offer flexibility, modern conveniences and value-added services to tenants. According to the General Statistics Office, the annual growth rate of international visitors to Vietnam is about 20% per year. The fact that serviced apartments are now more preferred by travelers as opposed to hotels due to their additional space and amenities will push upward pressure on demand for this sector.
OUTLOOKIn the near to medium term, the market will see further supply expansion as developers rush to meet the high demand. There will be 571 units coming on stream in the next two years from one project located in Tay Ho District and the other two located in Cau Giay District. The facts that buy-to-let trend is becoming more popular and some hotels are converting part of them into serviced apartments will create more pressure on serviced apartment market, resulting in a more competitive playing field going forward.
Table 8: Serviced Apartment, Future Supply
Source: Colliers International Research
Figure 15: Serviced Apartment, Average Asking Rent by Grade
Source: Colliers International Research
Figure 16: Serviced Apartment, Current Grade A&B supply
Source: Colliers International Research
Project Name District Expected units
Expected completion
Trang An Complex Cau Giay 42 Q1 2017
Somerset West Point Tay Ho 247 Q1 2017
Somerset West Central Hanoi Cau Giay 252 2018
0
5
10
15
20
25
30
35
40
Q1 Q2 Q3 Q4 Q1 Q2 Q3 Q4 Q1 Q2 Q3 Q4 Q1 Q2 Q3 Q4 Q1 Q2 Q3 Q4
2012 2013 2014 2015 2016
USD
/sq
m/m
onth
Grade A Grade B
-
500
1,000
1,500
2,000
2,500
3,000
3,500
4,000
4,500
2000 2005 2010 2011 2012 2013 2014 2015 2016
units
Grade A Grade B

Q4 2016 | HA NOI | SERVICED APARTMENT
VIETNAM QUARTERLY KNOWLEDGE REPORT
Accelerating success
Q4 2016 | HA NOI | SERVICED APARTMENT
VIETNAM QUARTERLY KNOWLEDGE REPORT
©2017 Colliers International Research Page 15
Table 3: Significant Office ProjectsTable 9: Significant Serviced Apartment Projects
No. Project Name Address Location Total Units
Average Occupancy
ARR(*) (**)
1 Hanoi Daewoo 360 Kim Ma Ba Dinh 194 85% 28.02 Hanoi Somerset Grand 49 Hai Ba Trung Hoan Kiem 185 70% 30.0
3 Sedona Suites 96 To Ngoc Van Tay Ho 181 90% 34.3
4 Somerset West Lake 254D Thuy Khue Tay Ho 90 82% 33.05 Sofitel Plaza 1 Thanh Nien Ba Dinh 56 100% 38.06 Sun Red River 23 Phan Chu Trinh Hoan Kiem 46 96% 27.07 Hanoi Lake View 28 Thanh Nien Tay Ho 26 100% 25.08 Pacific Place 83B Ly Thuong Kiet Hoan Kiem 35 55% 23.09 Intercontinental Ha Noi 13 Nghi Tam Tay Ho 25 88% 35.010 Somerset Hoa Binh 106 Hoang Quoc Viet Cau Giay 206 87% 31.011 Fraser Suites Hanoi 51 Xuan Dieu Tay Ho 184 95% 40.512 Crown Plaza 36 Le Duc Tho Tu Liem 136 95% 35.013 Calidas E6, Pham Hung Tu Liem 378 99% 38.014 Lotte Center Dao Tan, Cong Vi Ba Dinh 258 87% 44.015 Hanoi Club 76 Yen Phu Tay Ho 54 96% 29.0
Grade A 2,054 89% 34.9
1 Oriental Palace 33 Tay Ho Tay Ho 59 88% 30.02 Pan Horizon 157 Xuan Thuy Cau Giay 86 80% 30.03 Rose Garden 170 Ngoc Khanh Ba Dinh 96 91% 24.04 Jana Garden Terrace 6 Kim Dong Hoang Mai 72 83% 20.05 V-Tower 649 Kim Ma Ba Dinh 36 100% 28.06 DMC Lake View 535 Kim Ma Ba Dinh 66 82% 16.07 Atlanta 49 Hang Chuoi Hai Ba Trung 50 92% 24.08 Elegant Suites Hahoi 19B Ha Hoi Hoan Kiem 39 92% 23.0
9 Hoa Binh Green No. 14, Ally 376 Buoi Ba Dinh 40 92% 22.0
10 Times City 485 Minh Khai Hai Ba Trung 150 85% 19.011 Royal City 72 Nguyen Trai Thanh Xuan 100 70% 17.0
12 My Way 4, Alley 86, Duy Tan Cau Giay 39 93% 25.0
13 Rainbow 7 Trieu Viet Vuong Hai Ba Trung 26 88% 14.014 Dolphin 28 Tran Binh Tu Liem 70 93% 15.015 Lancaster Hanoi 20 Nui Truc Ba Dinh 31 90% 24.016 Elegant Suites Westlake 10C Dang Thai Mai Tay Ho 131 94% 27.017 May Fair 34B Tran Phu Ba Dinh 48 95% 17.0
18 Hanoi Lakes Residences 11-13 Nam Trang Ba Dinh 10 100% 9.0
19 Skyline Tower 4 Dang Dung Ba Dinh 79 80% 30.0
20 Candle Hotel 287-301 Doi Can Ba Dinh 69 74% 27.0
21 Park View 9 Nguyen Binh Khiem Hai Ba Trung 6 100% 14.0
22 Flower Village Hanoi 14 Thuy Khue Tay Ho 131 90% 23.0
23 Palace de Thien Thai 2 Tho Nhuom Hoan Kiem 16 98% 23.0
24 The City Residences 37 Phan Dinh Phung Ba Dinh 15 67% 15.0
25 Swan Lake 3/61/31 Xuan Dieu Tay Ho 6 99% 16.0
26 Lakeside Garden 56 Xuan Dieu Tay Ho 8 62% 14.0
Grade B 1,479 87% 22.6
(*) US/sqm/month (**) ARR (Average Rental Rate): All rents are stated in gross rents per sqm, not including VAT and serviced charge

Q4 2016 | HA NOI | INDUSTRIAL
VIETNAM QUARTERLY KNOWLEDGE REPORT
©2017 Colliers International Research Page 16
PERFORMANCERental rates in Hanoi are generally lower compared to Ho Chi Minh City. Average asking rent in Q4 2016 surged 20% on a yearly basis but remained stable on a quarterly basis, recorded at USD99.5/sqm/term. Remaining lease term is from 30-45 years. Nam Thang Long industrial park offered the highest asking rent at USD155/sqm/term. In spite of such a high rental rate, the 261ha industrial park was fully occupied. Rents of ready-built factory in Hanoi is USD1.5-2.5/sqm/month,approximately 40% lower than those of Ho Chi Minh City. The average occupancy rate increased by 15ppts on both quarterly and yearly basis, reaching 77.3%. There are five out of 11 IPs fully occupied, namely Nam Thang Long, Phu Nghia 1, Sai Dong B, Thach That-Quoc Oai and Thang Long. Tu Liem and Long Bien are two districts in which IPs were 100% leased out.
SUPPLYThe total stock was unchanged compared to the previous quarter as there was no new supply in Q4 2016. Currently there are 11 operating IPs in Ha Noi, covering total land area of over 2,700 ha. Chuong My, Thach That, Dong Anh districts are main suppliers to the market, comprising of approximately 54% of the market share.
DEMANDJapan, China and Hong Kong are three leading investors at Hanoi’s IPs, focusing on supporting industries, mechanical technology and electronics. The recent US interest rate hike is expected to bring some negative effects on foreign investment to emerging markets like Vietnam. However, with such a small change, this impact on capital inflows will be insignificant in the short run. Foreign manufacturing firms will continue to expand their operation and set up their factories in the country on the back of relative low labor costs and young dynamic workforce. Hence, demand for industrial properties in the coming years will continue to be strong.
OUTLOOKThe future IP supply in Ha Noi is relatively higher than in HCM City. By 2020, it is estimated to have 14 new IPs, with about 6,100 ha of total land area, equivalent to a 250% increase against the current number. Recently, Ha Noi’s government has agreed to switch functions and implement the relocation plan for many IPs in order to deal with the environmental pollution. As only 60% of industrial parks have wastewater treatment systems, most of wastewater is discharged directly into the environment. Thus, heavy metal concentrations in soil in some villages have exceeded the allowed standards. It is crucial that the establishment of industrial parks should pay attention to environmental issues sustainable development.
VIETNAM QUARTERLY KNOWLEDGE REPORT
Figure 17: Industrial, Market Performance by District
Source: Colliers International Research
Figure 18: Industrial, Supply by District
Source: Colliers International Research
Table 10: Industrial, Future Supply
Source: Colliers International Research
Industrial Park Name District GFA (ha)
Quang Minh II Industrial Park Me Linh 266
Phuc Tho Industrial Park Phuc Tho 74
Phu Xuyen Industrial Park Phu Xuyen 488
Thanh My - Xuan Son Industrial Park Son Tay 108
Soc Son Industrial Park Soc Son 340
Soc Son II Industrial Park Soc Son 204
Soc Son III Industrial Park Soc Son 180
Soc Son IV Industrial Park Soc Son 216
Thanh Oai II Industrial Park Thanh Oai 480
Habeco Industrial Park Thuong Tin 300
Ha Noi Hi-BioTech Park Tu Liem 200
Chuong My15%
Thach That25%
Dong Anh28%
Others32%
0%
10%
20%
30%
40%
50%
60%
70%
80%
90%
100%
0
20
40
60
80
100
120
140
160
180
200
Tu Liem Soc Son ChuongMy
Me Linh Long Bien ThachThat
Dong Anh PhuXuyen
US
D/s
qm/t
erm
Average asking rent Occupancy rate

Q4 2016 | HA NOI | INDUSTRIAL Q4 2016 | HA NOI | INDUSTRIAL
VIETNAM QUARTERLY KNOWLEDGE REPORT
©2017 Colliers International Research Page 17
Table 3: Significant Office ProjectsTable 11: Hanoi Industrial Market Overview
No. Name of Industrial Park Location Distance to CBD (km)
Total Area(ha)
Asking Rent (US$/sqm) Occupancy LUR Term
1 Nam Thang Long Tu Liem 15 261 155 100% 20482 Noi Bai Soc Son 31 116 135 90% 20583 Phu Nghia 1 Chuong My 24 170 95 100% 20584 Phu Nghia 2 Chuong My 24 238 95 65% 20585 Quang Minh Me Linh 24 344 130 95% 20526 Sai Dong B (Phase I&II) Long Bien 11 97 95 100% 20467 Thach That Thach That 24 150 100 100% 20568 Thang Long Dong anh 16 302 95 100% 20479 Hanssip (phase 1) Phu Xuyen 44 72 120 25% 206010 Hoa Lac Hi-Tech Thach That 39 549 50 20% 204811 Dong Anh Dong Anh 19 470 100 95% 2057
Total 2,770 99.5 77.3%

COLLIERS INTERNATIONAL | VIETNAM
HO CHI MINH CITY18HBT Building, 4th floor16-18 Hai Ba Trung Street,Ben Nghe Ward, District 1HCMC, VietnamTel: + 84 8 3827 5665
HANOIRoom A52, 5th Floor68 Nguyen Du Street, Hai Ba Trung District, Hanoi, VietnamTel: +84 4 3942 2769
502 offices in67 countries on6 continents
Accelerating success
DAVID JACKSONGeneral Director
+84 8 3827 5665
About Colliers InternationalColliers International is a leader in global real estate services, defined by our spirit of enterprise.
Through a culture of service excellence and a shared sense of initiative, we integrate the resources of real estate specialists worldwide to accelerate the success of our partners.We connect through a shared set of values that shape a collaborative environment throughout our organization that is unsurpassed in the industry.
With more than 100 professionals in 2 offices in Vietnam, the team is market driven and has proven and successful track record with both international and local experience.
From Hanoi to Ho Chi Minh City, we provide a full range of real estate services
The foundation of our services is the strength and depth of our experience.
Publication Coverage Frequency Content Availability
Knowledge Report/Market Insights
Vietnam Cities Quarterly All market sectors Publicly available
Asia Pacific Office Report
Asia Pacificincluding Vietnam
Quarterly Office market Publicly available
Vietnam Property Market Report
Vietnam cities Quarterly All market sectors On subscription
Development Recommendation
Vietnam cities At request All market sectors On subscription
$2.30billion in annual revenue
158million square meter under management
16,300professionalsand staff
This document has been prepared by Colliers International for advertising and general information only. Colliers International makes no guarantees, representations or warranties of any kind, expressed or implied, regarding the information including, but not limited to, warranties of content, accuracy and reliability. Any interested party should undertake their own inquiries as to the accuracy of the information. Colliers International excludes unequivocally all inferred or implied terms, conditions and warranties arising out of this document and excludes all liability for loss and damages arising there from. This publication is the copyrighted property of Colliers International and/or its licensor(s). ©2017. All rights reserved.
For further information, please contact us:
VIETNAM | RESEARCH & FORECAST REPORT
©2017 Colliers International Research www.colliers.com/vietnam
HA VOResearch Manager
+84 8 3827 5665