Embed Size (px)
Citation preview
Accelerating successwww.colliers.com/vietnam
hAnOI quArterly KnOWleDGe repOrt q4 2015
tAble Of COntents
eCOnOMIC OVerVIeW...............................................................................................................
VIETNAM ....................................................................................................................................
HO CHI MINH CITY ......................................................................................................................
HA NOI ........................................................................................................................................
hA nOI MArKet OVerVIeW ................................................................................................ OFFICE ........................................................................................................................................
RETAIL ........................................................................................................................................
CONDOMINIUM ............................................................................................................................
VILLA & TOWNHOUSE .................................................................................................................
SERVICED APARTMENT ..............................................................................................................
INDUSTRIAL ................................................................................................................................
Cover page: Hanoi Skyline - View of Hoan Kiem Lake
4-5
4
5
5
6-17
6
8
10
12
14
16
page
lIst Of fIGures
Figure 1: Vietnam GDP ...........................................................................................................................
Figure 2: Interest Rate and Exchange Rate of Vietnam ............................................................................
Figure 3: FDI Capital of HCMC and Hanoi ...............................................................................................
Figure 4: GDP Growth Rate of HCMC and Hanoi .....................................................................................
hAnOI MArKet OVerVIeW
Figure 5: Office, Average Asking Rent......................................................................................................
Figure 6: Office, Occupancy Rate ............................................................................................................
Figure 7: Office, Current Stock ...............................................................................................................
Figure 8: Retail, Market Performance .....................................................................................................
Figure 9: Retail, Occupancy Rate ............................................................................................................
Figure 10: Retail, Total Supply.............. ...................................................................................................
Figure 11: Condominium, Changes in Secondary price by Quarter ............................................................
Figure 12: Condominium, Sale by Quarter and Segment ..........................................................................
Figure 13: Condominium, Launched Supply by Year .................................................................................
Figure 14: Villa and Townhouse, Secondary Price by District ...................................................................
Figure 15: Villa and Townhouse, Q-o-Q changes in Secondary Price ........................................................
Figure 16: Villa and Townhouse, Supply by Quarter .................................................................................
Figure 17: Serviced Apartment, Average Asking Rent by Grade ...............................................................
Figure 18: Serviced Apartment, Occupanvy Rate by Grade ......................................................................
Figure 19: Serviced Apartment, Supply by Segment ................................................................................
Figure 20: Industrial, Supply by District ..................................................................................................
Figure 21: Industrial, Market Performance ..............................................................................................
lIst Of tAbles Table 1: Macroeconomic Indicators of HCMC and Hanoi ..........................................................................
Table 2: Significant Office Projects ........................................................................................................
Table 3: Significant Retail Projects ........................................................................................................
Table 4: Condominium, New Launched in Q4 2015 ................................................................................
Table 5: Villa and Townhouse, New Launched in Q4 2015 ......................................................................
Table 6: Significant Serviced Apartment Projects ..................................................................................
Table 7: Industrial, Future Supply ..........................................................................................................
Table 8: Hanoi Industrial Market Overview .............................................................................................
4
4
5
5
6
6
6
8
8
8
10
10
10
12
12
12
14
14
14
16
16
5
7
9
11
13
15
16
17
page
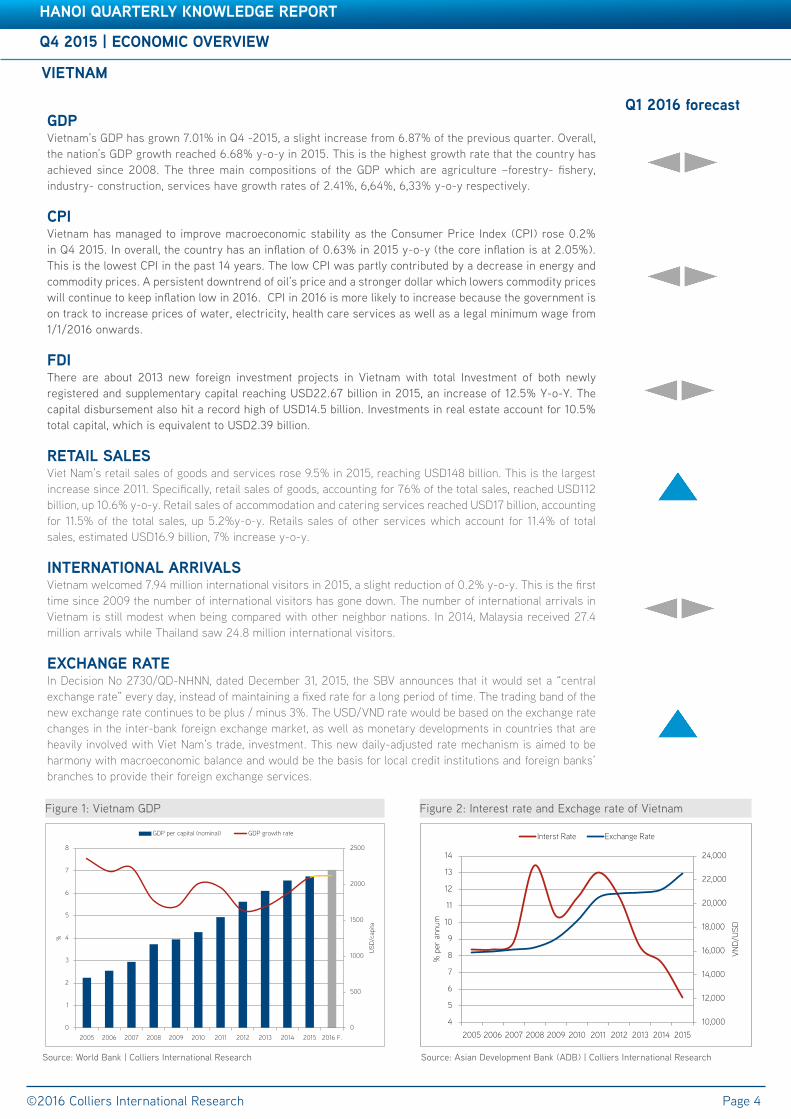
GDpVietnam’s GDP has grown 7.01% in Q4 -2015, a slight increase from 6.87% of the previous quarter. Overall, the nation’s GDP growth reached 6.68% y-o-y in 2015. This is the highest growth rate that the country has achieved since 2008. The three main compositions of the GDP which are agriculture –forestry- fishery, industry- construction, services have growth rates of 2.41%, 6,64%, 6,33% y-o-y respectively.
CpIVietnam has managed to improve macroeconomic stability as the Consumer Price Index (CPI) rose 0.2% in Q4 2015. In overall, the country has an inflation of 0.63% in 2015 y-o-y (the core inflation is at 2.05%). This is the lowest CPI in the past 14 years. The low CPI was partly contributed by a decrease in energy and commodity prices. A persistent downtrend of oil’s price and a stronger dollar which lowers commodity prices will continue to keep inflation low in 2016. CPI in 2016 is more likely to increase because the government is on track to increase prices of water, electricity, health care services as well as a legal minimum wage from 1/1/2016 onwards.
fDIThere are about 2013 new foreign investment projects in Vietnam with total Investment of both newly registered and supplementary capital reaching USD22.67 billion in 2015, an increase of 12.5% Y-o-Y. The capital disbursement also hit a record high of USD14.5 billion. Investments in real estate account for 10.5% total capital, which is equivalent to USD2.39 billion.
retAIl sAles Viet Nam’s retail sales of goods and services rose 9.5% in 2015, reaching USD148 billion. This is the largest increase since 2011. Specifically, retail sales of goods, accounting for 76% of the total sales, reached USD112 billion, up 10.6% y-o-y. Retail sales of accommodation and catering services reached USD17 billion, accounting for 11.5% of the total sales, up 5.2%y-o-y. Retails sales of other services which account for 11.4% of total sales, estimated USD16.9 billion, 7% increase y-o-y.
InternAtIOnAl ArrIVAls Vietnam welcomed 7.94 million international visitors in 2015, a slight reduction of 0.2% y-o-y. This is the first time since 2009 the number of international visitors has gone down. The number of international arrivals in Vietnam is still modest when being compared with other neighbor nations. In 2014, Malaysia received 27.4 million arrivals while Thailand saw 24.8 million international visitors.
eXChAnGe rAteIn Decision No 2730/QD-NHNN, dated December 31, 2015, the SBV announces that it would set a “central exchange rate” every day, instead of maintaining a fixed rate for a long period of time. The trading band of the new exchange rate continues to be plus / minus 3%. The USD/VND rate would be based on the exchange rate changes in the inter-bank foreign exchange market, as well as monetary developments in countries that are heavily involved with Viet Nam’s trade, investment. This new daily-adjusted rate mechanism is aimed to be harmony with macroeconomic balance and would be the basis for local credit institutions and foreign banks’ branches to provide their foreign exchange services.
q4 2015 | eCOnOMIC OVerVIeW
©2016 Colliers International Research
hAnOI quArterly KnOWleDGe repOrt
Page 4
q1 2016 forecast
Figure 1: Vietnam GDP
Source: World Bank | Colliers International Research
Figure 2: Interest rate and Exchage rate of Vietnam
Source: Asian Development Bank (ADB) | Colliers International Research
VIetnAM
0
500
1000
1500
2000
2500
0
1
2
3
4
5
6
7
8
2005 2006 2007 2008 2009 2010 2011 2012 2013 2014 2015 2016 F.
USD
/cap
ita
%
GDP per capital (nominal) GDP growth rate
10,000
12,000
14,000
16,000
18,000
20,000
22,000
24,000
4
5
6
7
8
9
10
11
12
13
14
2005 2006 2007 2008 2009 2010 2011 2012 2013 2014 2015
VND
/USD
% p
er a
nnum
Interst Rate Exchange Rate
q4 2015 | eCOnOMIC OVerVIeW
hAnOI quArterly KnOWleDGe repOrt
q4 2015 | eCOnOMIC OVerVIeW
©2016 Colliers International Research
hAnOI quArterly KnOWleDGe repOrt
Page 5
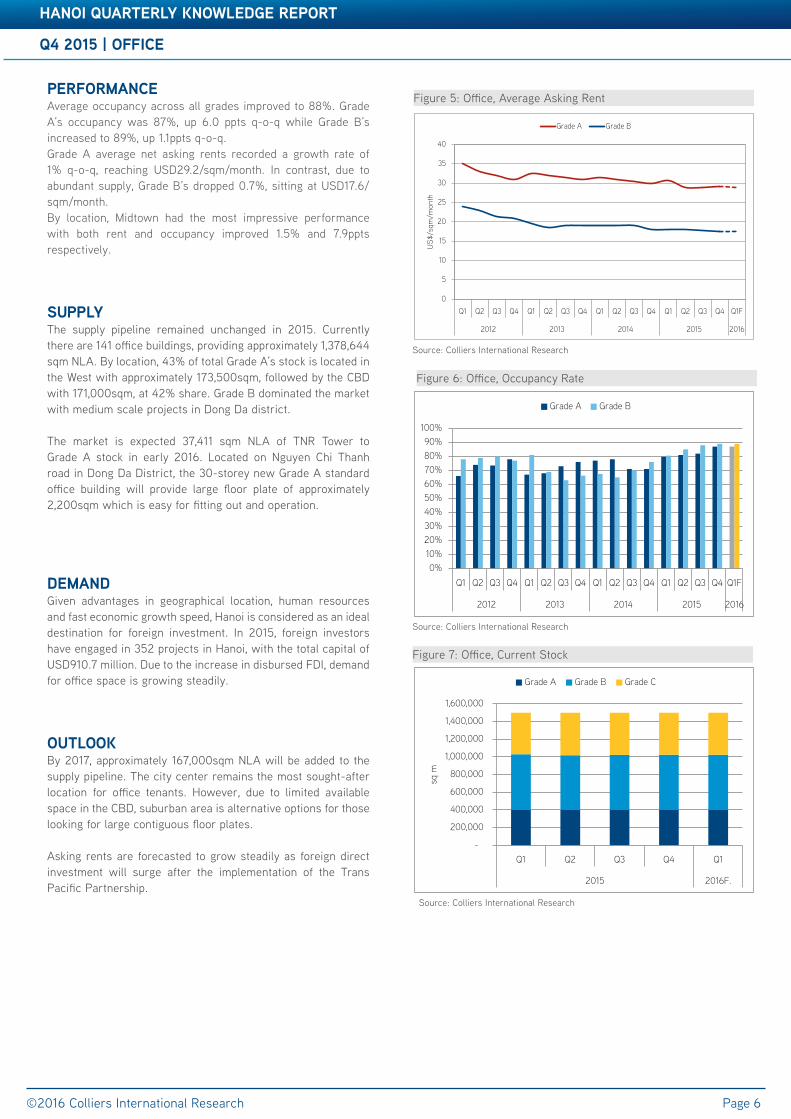
Figure 4: GDP Growth Rate of HCMC and Hanoi
Source: General Statistics Office I Colliers International Research
Source: General Statistics Office I Colliers International Research
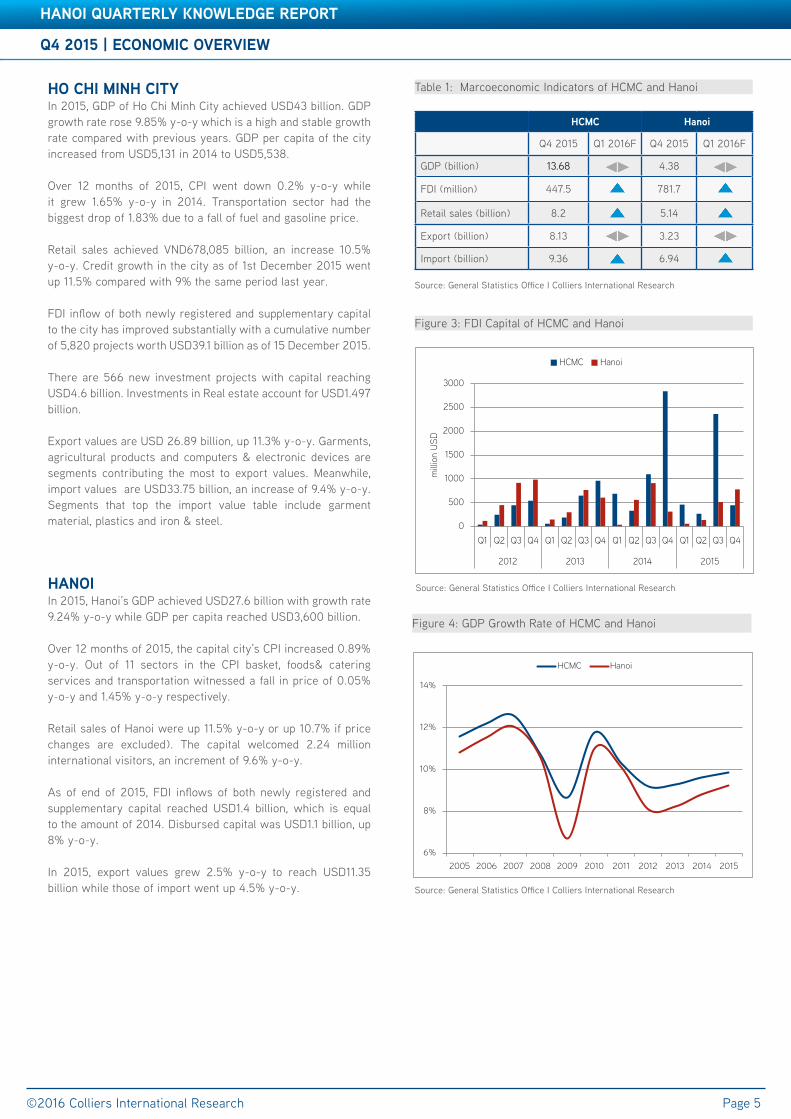
Table 1: Marcoeconomic Indicators of HCMC and Hanoi
hCMC hanoi
Q4 2015 Q1 2016F Q4 2015 Q1 2016F
GDP (billion) 13.68 4.38
FDI (million) 447.5 781.7
Retail sales (billion) 8.2 5.14
Export (billion) 8.13 3.23
Import (billion) 9.36 6.94
hO ChI MInh CItyIn 2015, GDP of Ho Chi Minh City achieved USD43 billion. GDP growth rate rose 9.85% y-o-y which is a high and stable growth rate compared with previous years. GDP per capita of the city increased from USD5,131 in 2014 to USD5,538.
Over 12 months of 2015, CPI went down 0.2% y-o-y while it grew 1.65% y-o-y in 2014. Transportation sector had the biggest drop of 1.83% due to a fall of fuel and gasoline price.
Retail sales achieved VND678,085 billion, an increase 10.5% y-o-y. Credit growth in the city as of 1st December 2015 went up 11.5% compared with 9% the same period last year.
FDI inflow of both newly registered and supplementary capital to the city has improved substantially with a cumulative number of 5,820 projects worth USD39.1 billion as of 15 December 2015.
There are 566 new investment projects with capital reaching USD4.6 billion. Investments in Real estate account for USD1.497 billion.
Export values are USD 26.89 billion, up 11.3% y-o-y. Garments, agricultural products and computers & electronic devices are segments contributing the most to export values. Meanwhile, import values are USD33.75 billion, an increase of 9.4% y-o-y. Segments that top the import value table include garment material, plastics and iron & steel.
hAnOIIn 2015, Hanoi’s GDP achieved USD27.6 billion with growth rate 9.24% y-o-y while GDP per capita reached USD3,600 billion.
Over 12 months of 2015, the capital city’s CPI increased 0.89% y-o-y. Out of 11 sectors in the CPI basket, foods& catering services and transportation witnessed a fall in price of 0.05% y-o-y and 1.45% y-o-y respectively.
Retail sales of Hanoi were up 11.5% y-o-y or up 10.7% if price changes are excluded). The capital welcomed 2.24 million international visitors, an increment of 9.6% y-o-y.
As of end of 2015, FDI inflows of both newly registered and supplementary capital reached USD1.4 billion, which is equal to the amount of 2014. Disbursed capital was USD1.1 billion, up 8% y-o-y.
In 2015, export values grew 2.5% y-o-y to reach USD11.35 billion while those of import went up 4.5% y-o-y.
Figure 3: FDI Capital of HCMC and Hanoi
Source: General Statistics Office I Colliers International Research
6%
8%
10%
12%
14%
2005 2006 2007 2008 2009 2010 2011 2012 2013 2014 2015
HCMC Hanoi
0
500
1000
1500
2000
2500
3000
Q1 Q2 Q3 Q4 Q1 Q2 Q3 Q4 Q1 Q2 Q3 Q4 Q1 Q2 Q3 Q4
2012 2013 2014 2015
mill
ion
USD
HCMC Hanoi
Accelerating success
q4 2015 | OffICe
hAnOI quArterly KnOWleDGe repOrt
©2016 Colliers International Research Page 6
perfOrMAnCeAverage occupancy across all grades improved to 88%. Grade A’s occupancy was 87%, up 6.0 ppts q-o-q while Grade B’s increased to 89%, up 1.1ppts q-o-q. Grade A average net asking rents recorded a growth rate of 1% q-o-q, reaching USD29.2/sqm/month. In contrast, due to abundant supply, Grade B’s dropped 0.7%, sitting at USD17.6/sqm/month. By location, Midtown had the most impressive performance with both rent and occupancy improved 1.5% and 7.9ppts respectively.
supplyThe supply pipeline remained unchanged in 2015. Currently there are 141 office buildings, providing approximately 1,378,644 sqm NLA. By location, 43% of total Grade A’s stock is located in the West with approximately 173,500sqm, followed by the CBD with 171,000sqm, at 42% share. Grade B dominated the market with medium scale projects in Dong Da district.
The market is expected 37,411 sqm NLA of TNR Tower to Grade A stock in early 2016. Located on Nguyen Chi Thanh road in Dong Da District, the 30-storey new Grade A standard office building will provide large floor plate of approximately 2,200sqm which is easy for fitting out and operation.
DeMAnDGiven advantages in geographical location, human resources and fast economic growth speed, Hanoi is considered as an ideal destination for foreign investment. In 2015, foreign investors have engaged in 352 projects in Hanoi, with the total capital of USD910.7 million. Due to the increase in disbursed FDI, demand for office space is growing steadily.
OutlOOKBy 2017, approximately 167,000sqm NLA will be added to the supply pipeline. The city center remains the most sought-after location for office tenants. However, due to limited available space in the CBD, suburban area is alternative options for those looking for large contiguous floor plates.
Asking rents are forecasted to grow steadily as foreign direct investment will surge after the implementation of the Trans Pacific Partnership.
Figure 5: Office, Average Asking Rent
Source: Colliers International Research
0
5
10
15
20
25
30
35
40
Q1 Q2 Q3 Q4 Q1 Q2 Q3 Q4 Q1 Q2 Q3 Q4 Q1 Q2 Q3 Q4 Q1F
2012 2013 2014 2015 2016
US
$/sq
m/m
onth
Grade A Grade B
Figure 6: Office, Occupancy Rate
0%10%20%30%40%50%60%70%80%90%
100%
Q1 Q2 Q3 Q4 Q1 Q2 Q3 Q4 Q1 Q2 Q3 Q4 Q1 Q2 Q3 Q4 Q1F
2012 2013 2014 2015 2016
Grade A Grade B
Source: Colliers International Research
Figure 7: Office, Current Stock
-
200,000
400,000
600,000
800,000
1,000,000
1,200,000
1,400,000
1,600,000
Q1 Q2 Q3 Q4 Q1
2015 2016F.
sq m
Grade A Grade B Grade C
Source: Colliers International Research
q4 2015 | OffICe
©2016 Colliers International Research
hAnOI quArterly KnOWleDGe repOrt
Page 7
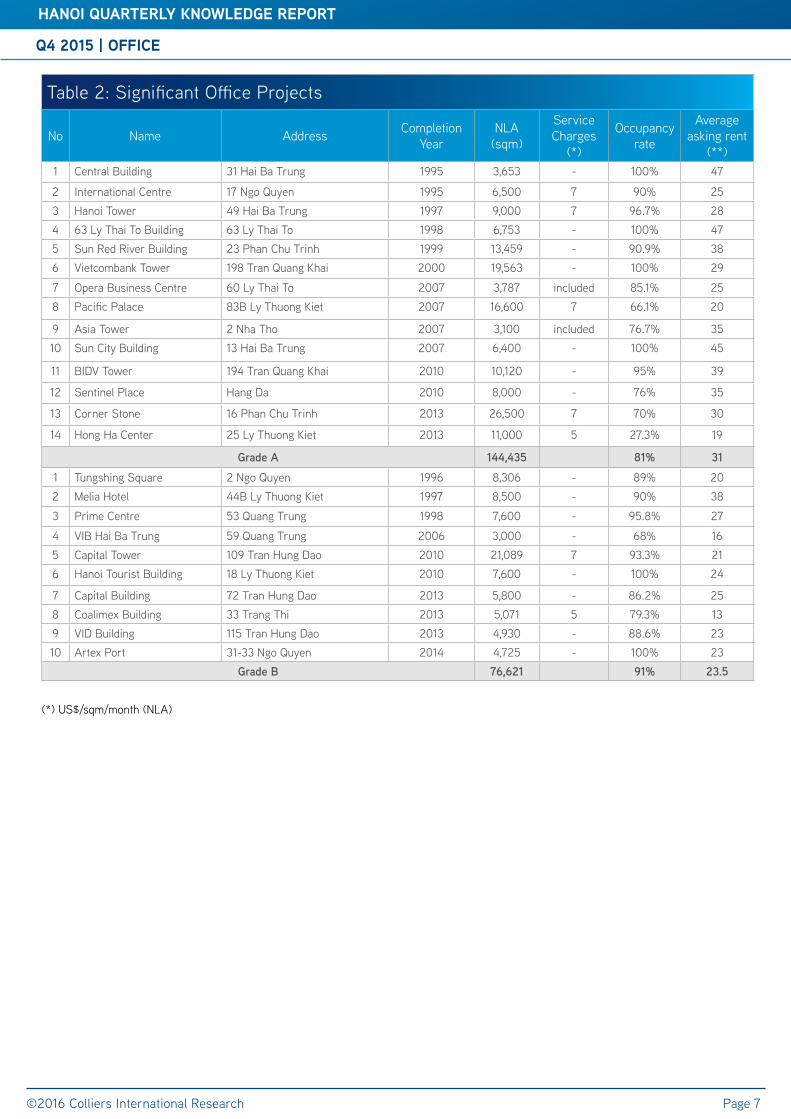
(*) US$/sqm/month (NLA)
Table 2: Significant Office Projects
No Name Address Completion Year
NLA (sqm)
Service Charges
(*)
Occupancy rate
Average asking rent
(**)1 Central Building 31 Hai Ba Trung 1995 3,653 - 100% 47
2 International Centre 17 Ngo Quyen 1995 6,500 7 90% 253 Hanoi Tower 49 Hai Ba Trung 1997 9,000 7 96.7% 284 63 Ly Thai To Building 63 Ly Thai To 1998 6,753 - 100% 475 Sun Red River Building 23 Phan Chu Trinh 1999 13,459 - 90.9% 386 Vietcombank Tower 198 Tran Quang Khai 2000 19,563 - 100% 29
7 Opera Business Centre 60 Ly Thai To 2007 3,787 included 85.1% 258 Pacific Palace 83B Ly Thuong Kiet 2007 16,600 7 66.1% 20
9 Asia Tower 2 Nha Tho 2007 3,100 included 76.7% 3510 Sun City Building 13 Hai Ba Trung 2007 6,400 - 100% 45
11 BIDV Tower 194 Tran Quang Khai 2010 10,120 - 95% 39
12 Sentinel Place Hang Da 2010 8,000 - 76% 35
13 Corner Stone 16 Phan Chu Trinh 2013 26,500 7 70% 30
14 Hong Ha Center 25 Ly Thuong Kiet 2013 11,000 5 27.3% 19
Grade A 144,435 81% 31
1 Tungshing Square 2 Ngo Quyen 1996 8,306 - 89% 202 Melia Hotel 44B Ly Thuong Kiet 1997 8,500 - 90% 38
3 Prime Centre 53 Quang Trung 1998 7,600 - 95.8% 27
4 VIB Hai Ba Trung 59 Quang Trung 2006 3,000 - 68% 165 Capital Tower 109 Tran Hung Dao 2010 21,089 7 93.3% 216 Hanoi Tourist Building 18 Ly Thuong Kiet 2010 7,600 - 100% 24
7 Capital Building 72 Tran Hung Dao 2013 5,800 - 86.2% 258 Coalimex Building 33 Trang Thi 2013 5,071 5 79.3% 139 VID Building 115 Tran Hung Dao 2013 4,930 - 88.6% 2310 Artex Port 31-33 Ngo Quyen 2014 4,725 - 100% 23
Grade B 76,621 91% 23.5
Accelerating success
q4 2015 | retAIl
hAnOI quArterly KnOWleDGe repOrt
©2016 Colliers International Research Page 8
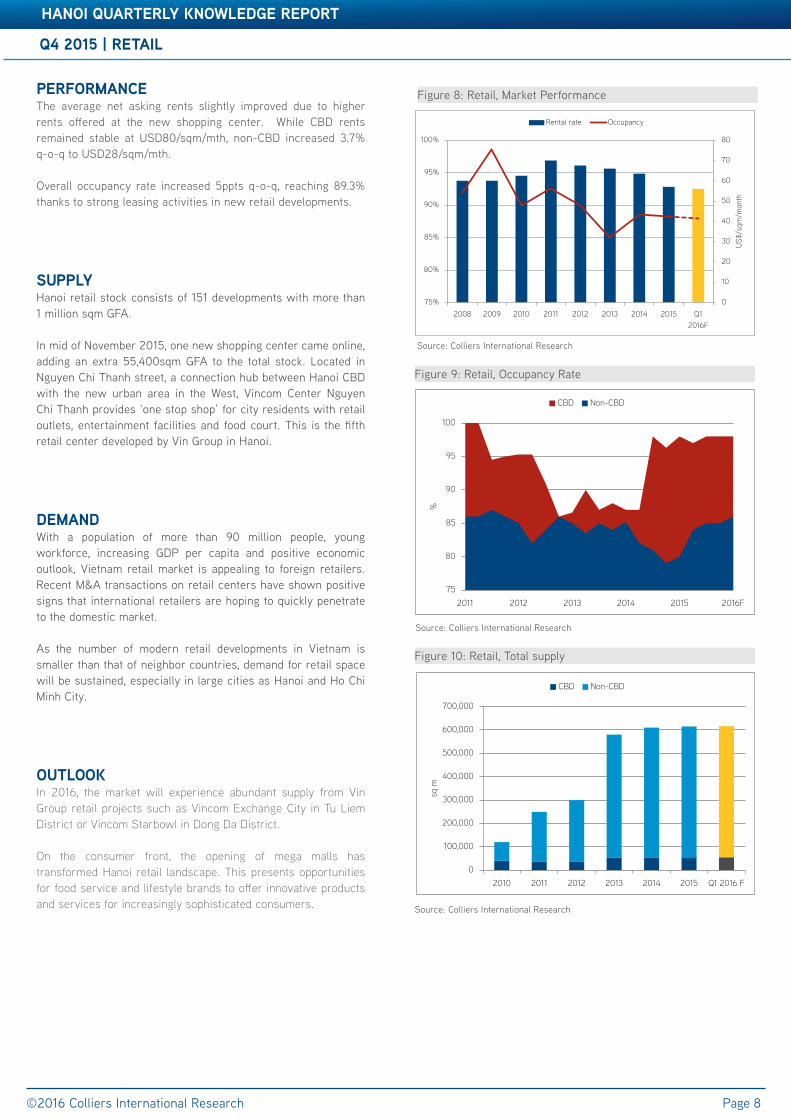
Table 3: Significant Office ProjectsperfOrMAnCeThe average net asking rents slightly improved due to higher rents offered at the new shopping center. While CBD rents remained stable at USD80/sqm/mth, non-CBD increased 3.7% q-o-q to USD28/sqm/mth.
Overall occupancy rate increased 5ppts q-o-q, reaching 89.3% thanks to strong leasing activities in new retail developments.
supplyHanoi retail stock consists of 151 developments with more than 1 million sqm GFA.
In mid of November 2015, one new shopping center came online, adding an extra 55,400sqm GFA to the total stock. Located in Nguyen Chi Thanh street, a connection hub between Hanoi CBD with the new urban area in the West, Vincom Center Nguyen Chi Thanh provides ‘one stop shop’ for city residents with retail outlets, entertainment facilities and food court. This is the fifth retail center developed by Vin Group in Hanoi.
DeMAnDWith a population of more than 90 million people, young workforce, increasing GDP per capita and positive economic outlook, Vietnam retail market is appealing to foreign retailers. Recent M&A transactions on retail centers have shown positive signs that international retailers are hoping to quickly penetrate to the domestic market.
As the number of modern retail developments in Vietnam is smaller than that of neighbor countries, demand for retail space will be sustained, especially in large cities as Hanoi and Ho Chi Minh City.
OutlOOKIn 2016, the market will experience abundant supply from Vin Group retail projects such as Vincom Exchange City in Tu Liem District or Vincom Starbowl in Dong Da District.
On the consumer front, the opening of mega malls has transformed Hanoi retail landscape. This presents opportunities for food service and lifestyle brands to offer innovative products and services for increasingly sophisticated consumers.
Figure 8: Retail, Market Performance
0
10
20
30
40
50
60
70
80
75%
80%
85%
90%
95%
100%
2008 2009 2010 2011 2012 2013 2014 2015 Q12016F
US$
/sqm
/mon
th
Rental rate Occupancy
Figure 10: Retail, Total supply
Source: Colliers International Research
Source: Colliers International Research
Figure 9: Retail, Occupancy Rate
75
80
85
90
95
100
2011 2012 2013 2014 2015 2016F
%
CBD Non-CBD
Source: Colliers International Research
0
100,000
200,000
300,000
400,000
500,000
600,000
700,000
2010 2011 2012 2013 2014 2015 Q1 2016 F
sq m
CBD Non-CBD
hAnOI quArterly KnOWleDGe repOrt
Accelerating success
q4 2015 | retAIl
hAnOI quArterly KnOWleDGe repOrt
©2016 Colliers International Research Page 9
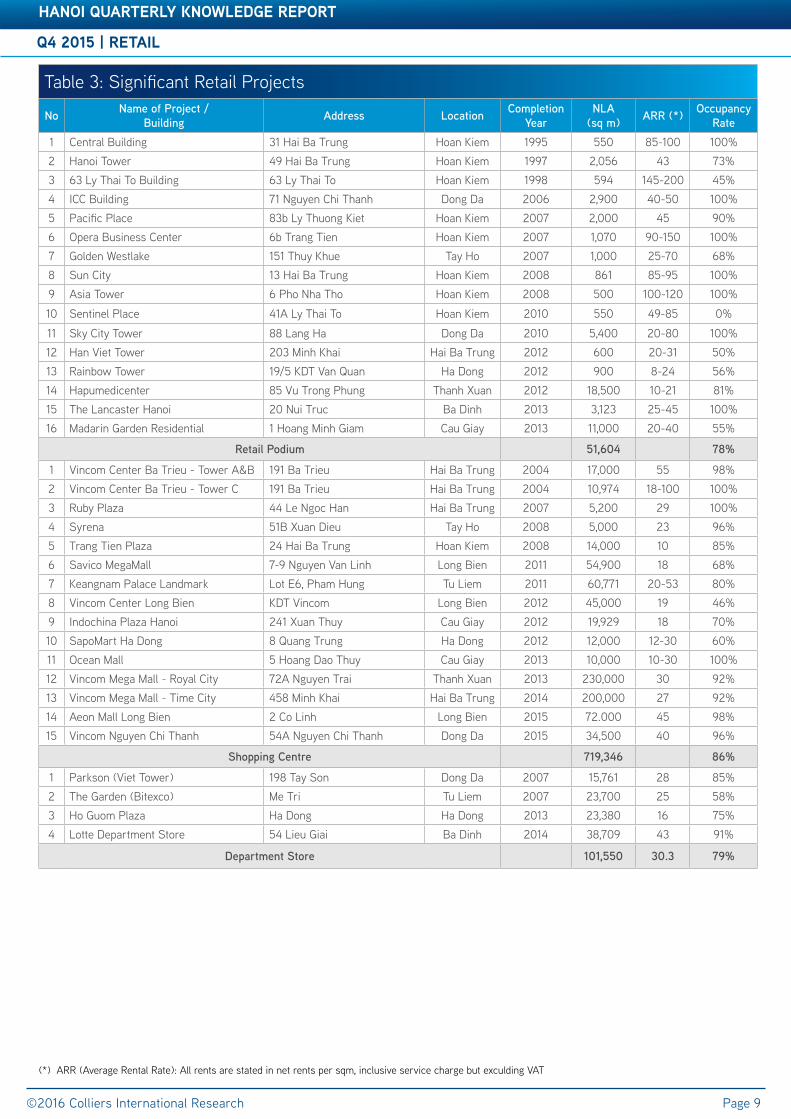
Table 3: Significant Retail Projects
No Name of Project /Building Address Location Completion
YearNLA
(sq m) ARR (*) Occupancy Rate
1 Central Building 31 Hai Ba Trung Hoan Kiem 1995 550 85-100 100%2 Hanoi Tower 49 Hai Ba Trung Hoan Kiem 1997 2,056 43 73%3 63 Ly Thai To Building 63 Ly Thai To Hoan Kiem 1998 594 145-200 45%4 ICC Building 71 Nguyen Chi Thanh Dong Da 2006 2,900 40-50 100%5 Pacific Place 83b Ly Thuong Kiet Hoan Kiem 2007 2,000 45 90%6 Opera Business Center 6b Trang Tien Hoan Kiem 2007 1,070 90-150 100%7 Golden Westlake 151 Thuy Khue Tay Ho 2007 1,000 25-70 68%8 Sun City 13 Hai Ba Trung Hoan Kiem 2008 861 85-95 100%9 Asia Tower 6 Pho Nha Tho Hoan Kiem 2008 500 100-120 100%
10 Sentinel Place 41A Ly Thai To Hoan Kiem 2010 550 49-85 0%
11 Sky City Tower 88 Lang Ha Dong Da 2010 5,400 20-80 100%12 Han Viet Tower 203 Minh Khai Hai Ba Trung 2012 600 20-31 50%13 Rainbow Tower 19/5 KDT Van Quan Ha Dong 2012 900 8-24 56%14 Hapumedicenter 85 Vu Trong Phung Thanh Xuan 2012 18,500 10-21 81%15 The Lancaster Hanoi 20 Nui Truc Ba Dinh 2013 3,123 25-45 100%16 Madarin Garden Residential 1 Hoang Minh Giam Cau Giay 2013 11,000 20-40 55%
Retail Podium 51,604 78%
1 Vincom Center Ba Trieu - Tower A&B 191 Ba Trieu Hai Ba Trung 2004 17,000 55 98%2 Vincom Center Ba Trieu - Tower C 191 Ba Trieu Hai Ba Trung 2004 10,974 18-100 100%3 Ruby Plaza 44 Le Ngoc Han Hai Ba Trung 2007 5,200 29 100%4 Syrena 51B Xuan Dieu Tay Ho 2008 5,000 23 96%5 Trang Tien Plaza 24 Hai Ba Trung Hoan Kiem 2008 14,000 10 85%6 Savico MegaMall 7-9 Nguyen Van Linh Long Bien 2011 54,900 18 68%7 Keangnam Palace Landmark Lot E6, Pham Hung Tu Liem 2011 60,771 20-53 80%8 Vincom Center Long Bien KDT Vincom Long Bien 2012 45,000 19 46%9 Indochina Plaza Hanoi 241 Xuan Thuy Cau Giay 2012 19,929 18 70%10 SapoMart Ha Dong 8 Quang Trung Ha Dong 2012 12,000 12-30 60%11 Ocean Mall 5 Hoang Dao Thuy Cau Giay 2013 10,000 10-30 100%12 Vincom Mega Mall - Royal City 72A Nguyen Trai Thanh Xuan 2013 230,000 30 92%13 Vincom Mega Mall - Time City 458 Minh Khai Hai Ba Trung 2014 200,000 27 92%14 Aeon Mall Long Bien 2 Co Linh Long Bien 2015 72.000 45 98%15 Vincom Nguyen Chi Thanh 54A Nguyen Chi Thanh Dong Da 2015 34,500 40 96%
Shopping Centre 719,346 86%
1 Parkson (Viet Tower) 198 Tay Son Dong Da 2007 15,761 28 85%2 The Garden (Bitexco) Me Tri Tu Liem 2007 23,700 25 58%3 Ho Guom Plaza Ha Dong Ha Dong 2013 23,380 16 75%4 Lotte Department Store 54 Lieu Giai Ba Dinh 2014 38,709 43 91%
Department Store 101,550 30.3 79%
(*) ARR (Average Rental Rate): All rents are stated in net rents per sqm, inclusive service charge but exculding VAT
q4 2015 | COnDOMInIuM
hAnOI quArterly KnOWleDGe repOrt
©2016 Colliers International Research Page 10
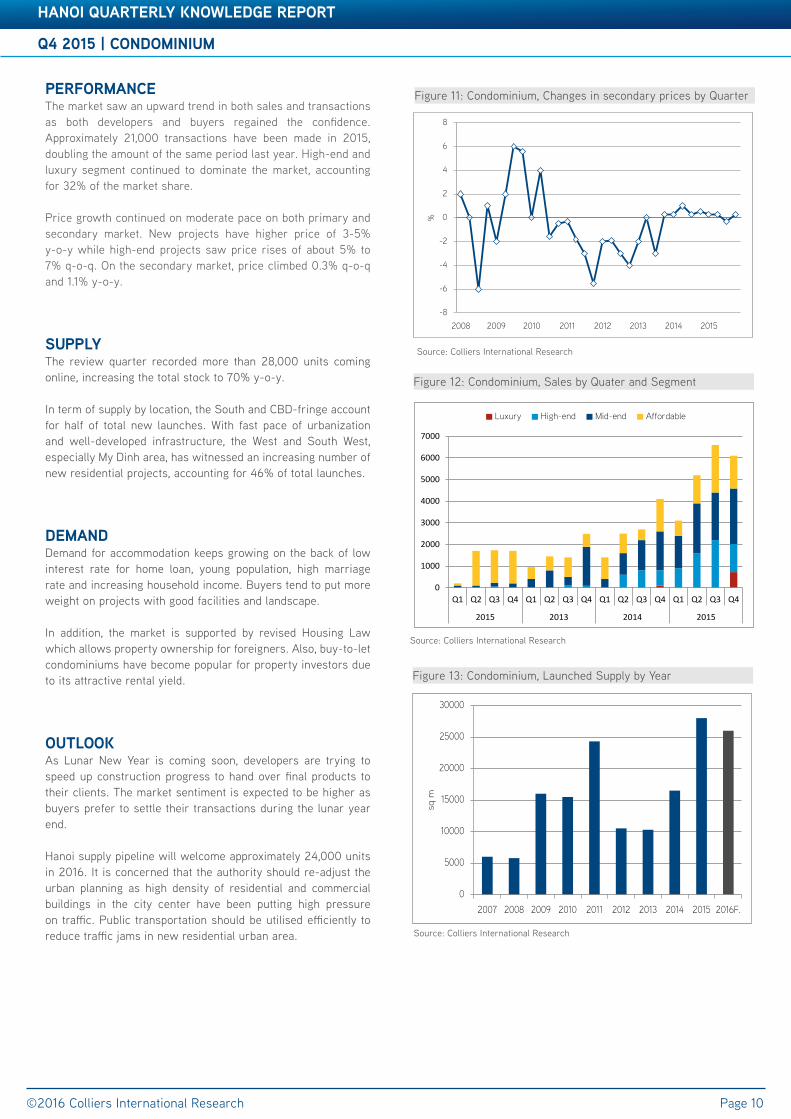
perfOrMAnCeThe market saw an upward trend in both sales and transactions as both developers and buyers regained the confidence. Approximately 21,000 transactions have been made in 2015, doubling the amount of the same period last year. High-end and luxury segment continued to dominate the market, accounting for 32% of the market share.
Price growth continued on moderate pace on both primary and secondary market. New projects have higher price of 3-5% y-o-y while high-end projects saw price rises of about 5% to 7% q-o-q. On the secondary market, price climbed 0.3% q-o-q and 1.1% y-o-y.
supplyThe review quarter recorded more than 28,000 units coming online, increasing the total stock to 70% y-o-y.
In term of supply by location, the South and CBD-fringe account for half of total new launches. With fast pace of urbanization and well-developed infrastructure, the West and South West, especially My Dinh area, has witnessed an increasing number of new residential projects, accounting for 46% of total launches.
DeMAnDDemand for accommodation keeps growing on the back of low interest rate for home loan, young population, high marriage rate and increasing household income. Buyers tend to put more weight on projects with good facilities and landscape.
In addition, the market is supported by revised Housing Law which allows property ownership for foreigners. Also, buy-to-let condominiums have become popular for property investors due to its attractive rental yield.
OutlOOKAs Lunar New Year is coming soon, developers are trying to speed up construction progress to hand over final products to their clients. The market sentiment is expected to be higher as buyers prefer to settle their transactions during the lunar year end.
Hanoi supply pipeline will welcome approximately 24,000 units in 2016. It is concerned that the authority should re-adjust the urban planning as high density of residential and commercial buildings in the city center have been putting high pressure on traffic. Public transportation should be utilised efficiently to reduce traffic jams in new residential urban area.
Figure 13: Condominium, Launched Supply by Year
Source: Colliers International Research
Figure 12: Condominium, Sales by Quater and Segment
Source: Colliers International Research
Source: Colliers International Research
Figure 11: Condominium, Changes in secondary prices by Quarter
0
1000
2000
3000
4000
5000
6000
7000
Q1 Q2 Q3 Q4 Q1 Q2 Q3 Q4 Q1 Q2 Q3 Q4 Q1 Q2 Q3 Q4
2015 2013 2014 2015
Luxury High-end Mid-end Affordable
-8
-6
-4
-2
0
2
4
6
8
2008 2009 2010 2011 2012 2013 2014 2015
%
0
5000
10000
15000
20000
25000
30000
2007 2008 2009 2010 2011 2012 2013 2014 2015 2016F.
sq m
q4 2015 | COnDOMInIuM
hAnOI quArterly KnOWleDGe repOrt
q4 2015 | COnDOMInIuM
hAnOI quArterly KnOWleDGe repOrt
©2016 Colliers International Research Page 11
Table 3: Significant Office ProjectsTable 3: Significant Office Projects
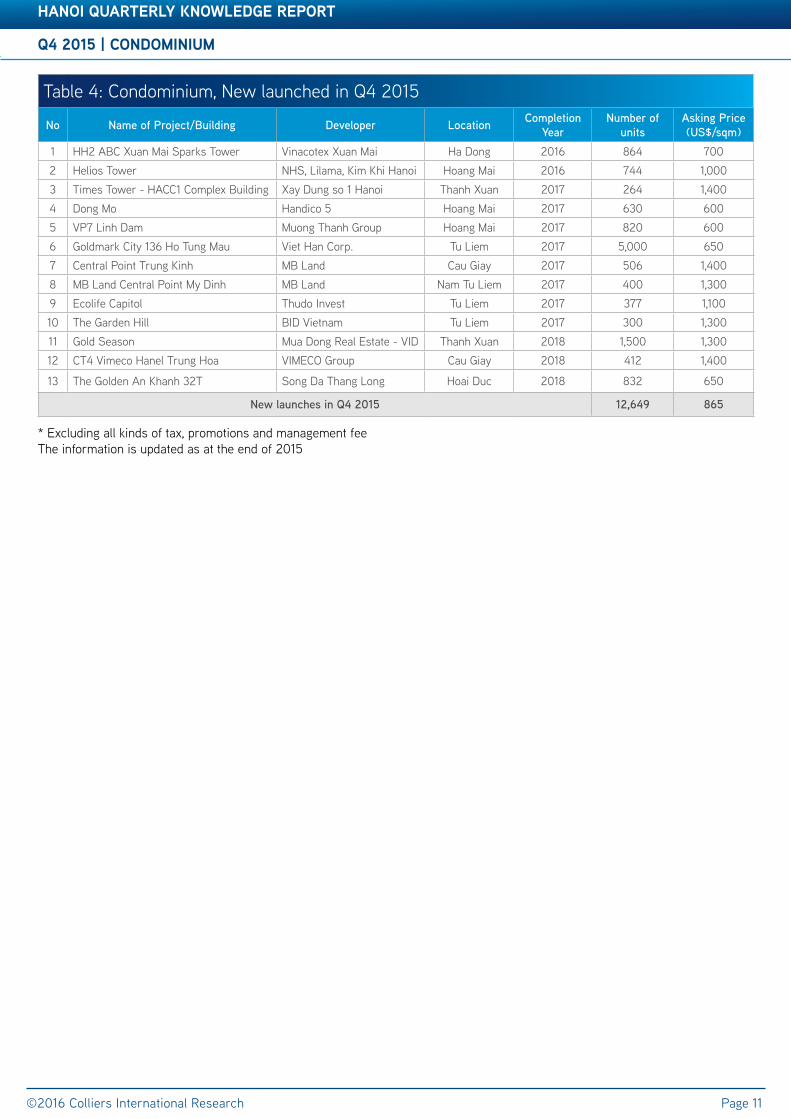
* Excluding all kinds of tax, promotions and management feeThe information is updated as at the end of 2015
Table 4: Condominium, New launched in Q4 2015
No Name of Project/Building Developer Location Completion Year
Number of units
Asking Price (US$/sqm)
1 HH2 ABC Xuan Mai Sparks Tower Vinacotex Xuan Mai Ha Dong 2016 864 7002 Helios Tower NHS, Lilama, Kim Khi Hanoi Hoang Mai 2016 744 1,0003 Times Tower - HACC1 Complex Building Xay Dung so 1 Hanoi Thanh Xuan 2017 264 1,4004 Dong Mo Handico 5 Hoang Mai 2017 630 6005 VP7 Linh Dam Muong Thanh Group Hoang Mai 2017 820 6006 Goldmark City 136 Ho Tung Mau Viet Han Corp. Tu Liem 2017 5,000 6507 Central Point Trung Kinh MB Land Cau Giay 2017 506 1,4008 MB Land Central Point My Dinh MB Land Nam Tu Liem 2017 400 1,3009 Ecolife Capitol Thudo Invest Tu Liem 2017 377 1,10010 The Garden Hill BID Vietnam Tu Liem 2017 300 1,30011 Gold Season Mua Dong Real Estate - VID Thanh Xuan 2018 1,500 1,30012 CT4 Vimeco Hanel Trung Hoa VIMECO Group Cau Giay 2018 412 1,400
13 The Golden An Khanh 32T Song Da Thang Long Hoai Duc 2018 832 650
New launches in Q4 2015 12,649 865
Accelerating success
q4 2015 | VIllA & tOWnhOuse
hAnOI quArterly KnOWleDGe repOrt
©2016 Colliers International Research Page 12
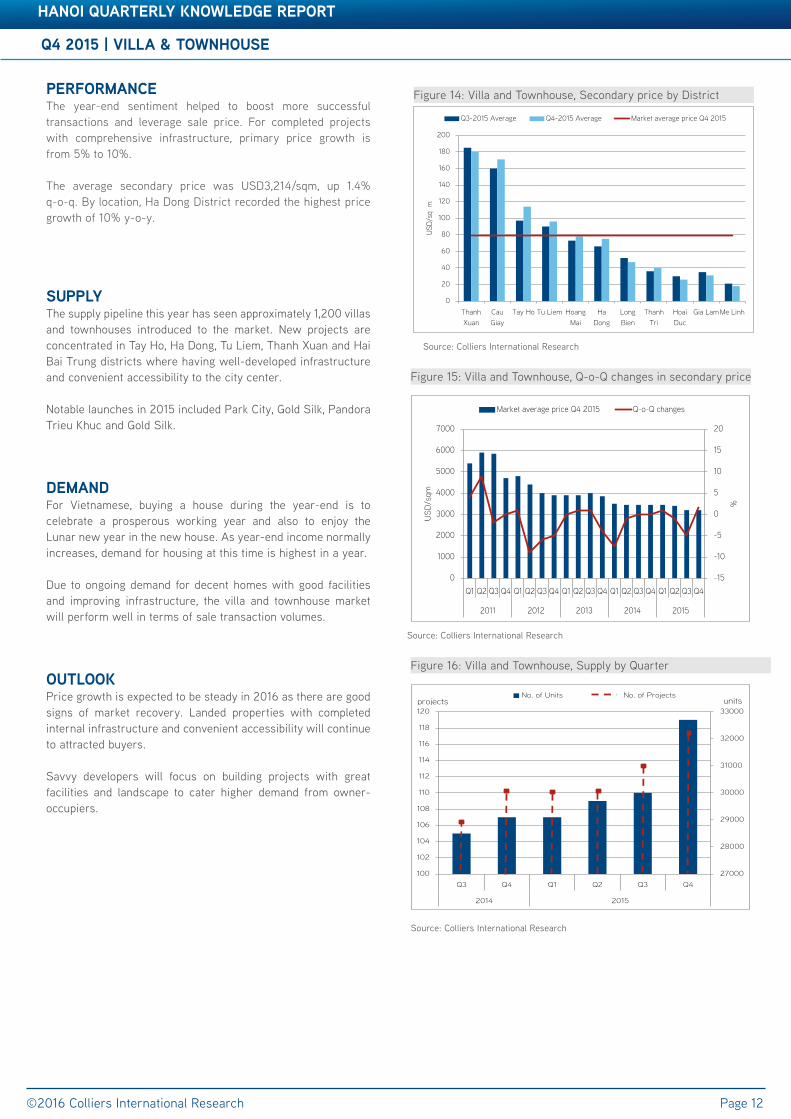
perfOrMAnCeThe year-end sentiment helped to boost more successful transactions and leverage sale price. For completed projects with comprehensive infrastructure, primary price growth is from 5% to 10%.
The average secondary price was USD3,214/sqm, up 1.4% q-o-q. By location, Ha Dong District recorded the highest price growth of 10% y-o-y.
supplyThe supply pipeline this year has seen approximately 1,200 villas and townhouses introduced to the market. New projects are concentrated in Tay Ho, Ha Dong, Tu Liem, Thanh Xuan and Hai Bai Trung districts where having well-developed infrastructure and convenient accessibility to the city center.
Notable launches in 2015 included Park City, Gold Silk, Pandora Trieu Khuc and Gold Silk.
DeMAnDFor Vietnamese, buying a house during the year-end is to celebrate a prosperous working year and also to enjoy the Lunar new year in the new house. As year-end income normally increases, demand for housing at this time is highest in a year.
Due to ongoing demand for decent homes with good facilities and improving infrastructure, the villa and townhouse market will perform well in terms of sale transaction volumes.
OutlOOKPrice growth is expected to be steady in 2016 as there are good signs of market recovery. Landed properties with completed internal infrastructure and convenient accessibility will continue to attracted buyers.
Savvy developers will focus on building projects with great facilities and landscape to cater higher demand from owner-occupiers.
Figure 16: Villa and Townhouse, Supply by Quarter
Source: Colliers International Research
Figure 15: Villa and Townhouse, Q-o-Q changes in secondary price
Source: Colliers International Research
Source: Colliers International Research
Figure 14: Villa and Townhouse, Secondary price by District
-15
-10
-5
0
5
10
15
20
0
1000
2000
3000
4000
5000
6000
7000
Q1 Q2 Q3 Q4 Q1 Q2 Q3 Q4 Q1 Q2 Q3 Q4 Q1 Q2 Q3 Q4 Q1 Q2 Q3 Q4
2011 2012 2013 2014 2015
%
US
D/s
qm
Market average price Q4 2015 Q-o-Q changes
27000
28000
29000
30000
31000
32000
33000
100
102
104
106
108
110
112
114
116
118
120
Q3 Q4 Q1 Q2 Q3 Q4
2014 2015
No. of Units No. of Projectsprojects units
0
20
40
60
80
100
120
140
160
180
200
ThanhXuan
CauGiay
Tay Ho Tu Liem HoangMai
HaDong
LongBien
ThanhTri
HoaiDuc
Gia LamMe Linh
USD/
sq m
Q3-2015 Average Q4-2015 Average Market average price Q4 2015
q4 2015 | VIllA & tOWnhOuse
hAnOI quArterly KnOWleDGe repOrt
Accelerating success
q4 2015 | VIllA & tOWnhOuse
hAnOI quArterly KnOWleDGe repOrt
©2016 Colliers International Research Page 13
Table 3: Significant Office ProjectsTable 3: Significant Office ProjectsTable 3: Significant Office Projects
* Excluding all kinds of tax, promotions and management feeThe information is updated as at the end of 2015
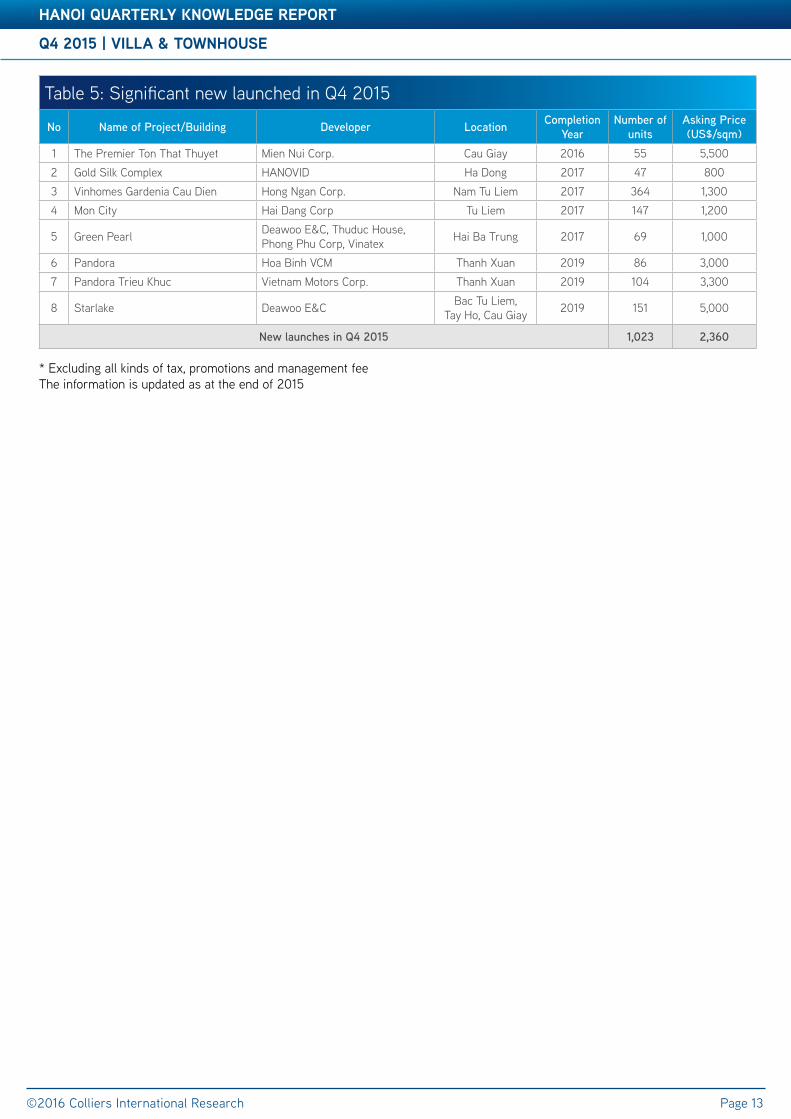
Table 5: Significant new launched in Q4 2015
No Name of Project/Building Developer Location Completion Year
Number of units
Asking Price (US$/sqm)
1 The Premier Ton That Thuyet Mien Nui Corp. Cau Giay 2016 55 5,5002 Gold Silk Complex HANOVID Ha Dong 2017 47 8003 Vinhomes Gardenia Cau Dien Hong Ngan Corp. Nam Tu Liem 2017 364 1,3004 Mon City Hai Dang Corp Tu Liem 2017 147 1,200
5 Green Pearl Deawoo E&C, Thuduc House, Phong Phu Corp, Vinatex Hai Ba Trung 2017 69 1,000
6 Pandora Hoa Binh VCM Thanh Xuan 2019 86 3,0007 Pandora Trieu Khuc Vietnam Motors Corp. Thanh Xuan 2019 104 3,300
8 Starlake Deawoo E&C Bac Tu Liem, Tay Ho, Cau Giay 2019 151 5,000
New launches in Q4 2015 1,023 2,360
q4 2015 | serVICeD ApArtMent
hAnOI quArterly KnOWleDGe repOrt
©2016 Colliers International Research Page 14
Table 3: Significant Office ProjectsperfOrMAnCe
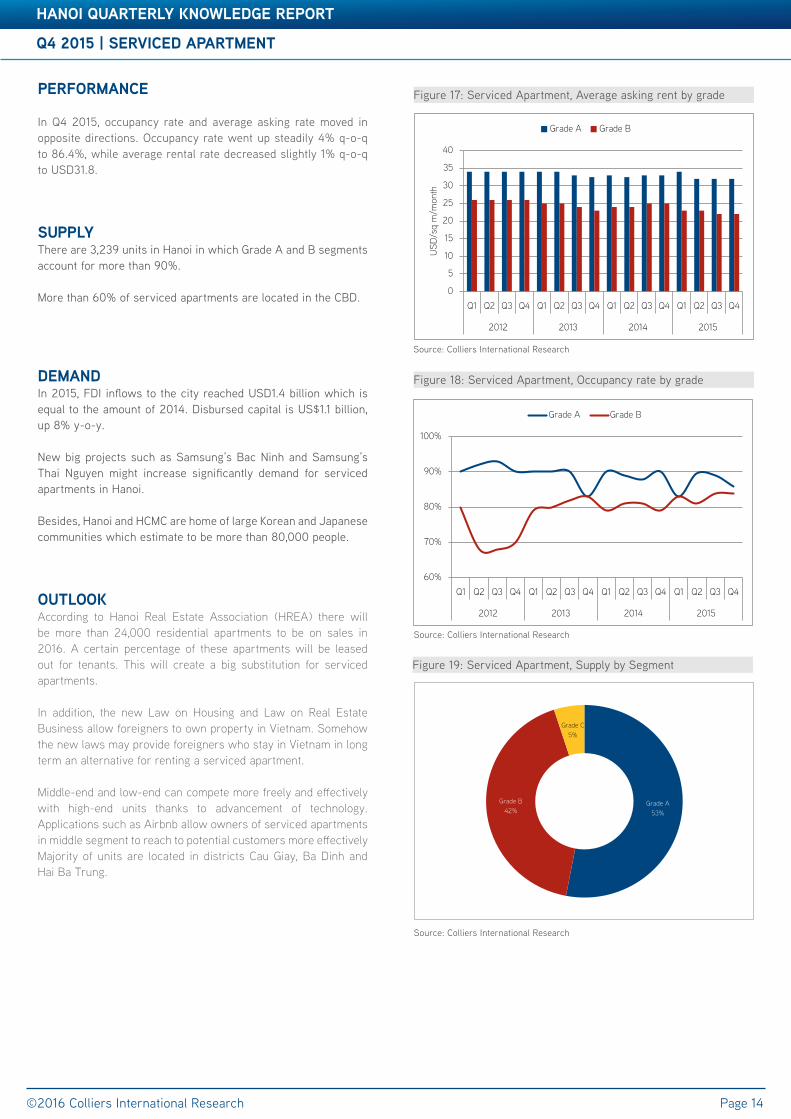
In Q4 2015, occupancy rate and average asking rate moved in opposite directions. Occupancy rate went up steadily 4% q-o-q to 86.4%, while average rental rate decreased slightly 1% q-o-q to USD31.8.
supplyThere are 3,239 units in Hanoi in which Grade A and B segments account for more than 90%.
More than 60% of serviced apartments are located in the CBD.
DeMAnDIn 2015, FDI inflows to the city reached USD1.4 billion which is equal to the amount of 2014. Disbursed capital is US$1.1 billion, up 8% y-o-y.
New big projects such as Samsung’s Bac Ninh and Samsung’s Thai Nguyen might increase significantly demand for serviced apartments in Hanoi.
Besides, Hanoi and HCMC are home of large Korean and Japanese communities which estimate to be more than 80,000 people.
OutlOOKAccording to Hanoi Real Estate Association (HREA) there will be more than 24,000 residential apartments to be on sales in 2016. A certain percentage of these apartments will be leased out for tenants. This will create a big substitution for serviced apartments.
In addition, the new Law on Housing and Law on Real Estate Business allow foreigners to own property in Vietnam. Somehow the new laws may provide foreigners who stay in Vietnam in long term an alternative for renting a serviced apartment. Middle-end and low-end can compete more freely and effectively with high-end units thanks to advancement of technology. Applications such as Airbnb allow owners of serviced apartments in middle segment to reach to potential customers more effectivelyMajority of units are located in districts Cau Giay, Ba Dinh and Hai Ba Trung.
Figure 19: Serviced Apartment, Supply by Segment
Source: Colliers International Research
Figure 17: Serviced Apartment, Average asking rent by grade
Source: Colliers International Research
Figure 18: Serviced Apartment, Occupancy rate by grade
Source: Colliers International Research
Grade A53%
Grade B42%
Grade C5%
0
5
10
15
20
25
30
35
40
Q1 Q2 Q3 Q4 Q1 Q2 Q3 Q4 Q1 Q2 Q3 Q4 Q1 Q2 Q3 Q4
2012 2013 2014 2015
USD
/sq
m/m
onth
Grade A Grade B
60%
70%
80%
90%
100%
Q1 Q2 Q3 Q4 Q1 Q2 Q3 Q4 Q1 Q2 Q3 Q4 Q1 Q2 Q3 Q4
2012 2013 2014 2015
Grade A Grade B
q4 2015 | serVICeD ApArtMent
hAnOI quArterly KnOWleDGe repOrt
Accelerating success
q4 2015 | serVICeD ApArtMent
hAnOI quArterly KnOWleDGe repOrt
©2016 Colliers International Research Page 15
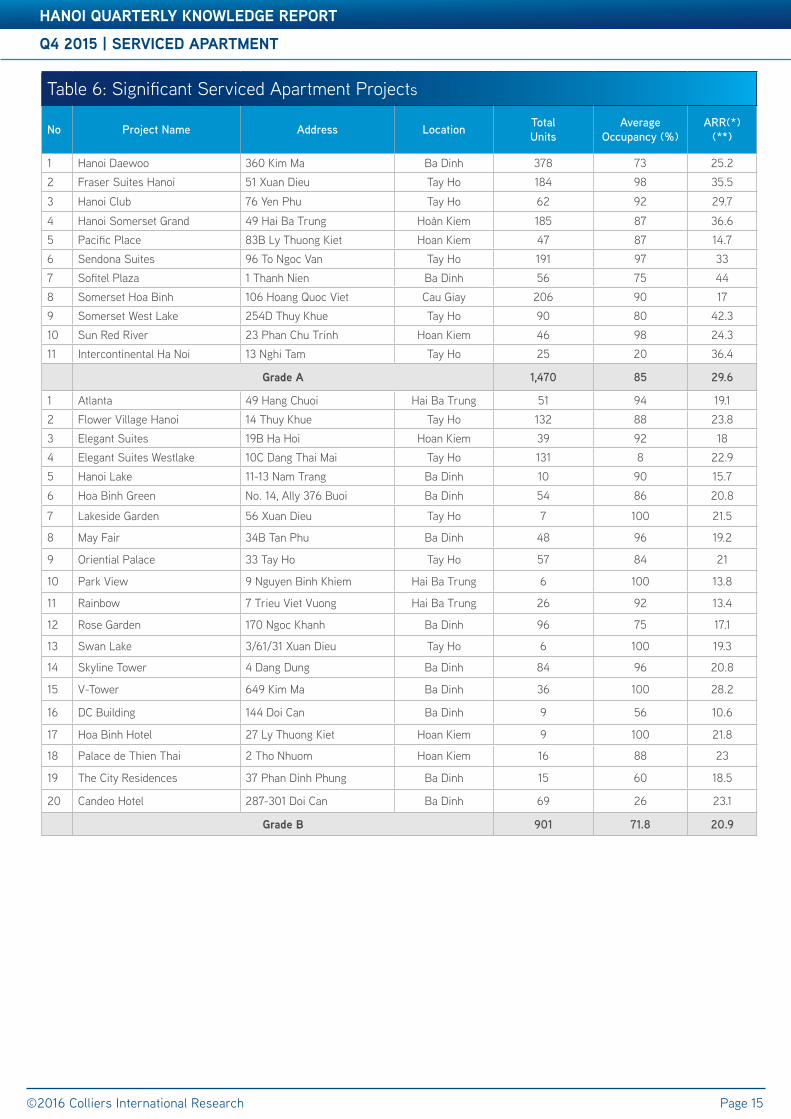
Table 3: Significant Office ProjectsTable 6: Significant Serviced Apartment Projects
No Project Name Address Location Total Units
Average Occupancy (%)
ARR(*) (**)
1 Hanoi Daewoo 360 Kim Ma Ba Dinh 378 73 25.22 Fraser Suites Hanoi 51 Xuan Dieu Tay Ho 184 98 35.5
3 Hanoi Club 76 Yen Phu Tay Ho 62 92 29.7
4 Hanoi Somerset Grand 49 Hai Ba Trung Hoàn Kiem 185 87 36.65 Pacific Place 83B Ly Thuong Kiet Hoan Kiem 47 87 14.76 Sendona Suites 96 To Ngoc Van Tay Ho 191 97 337 Sofitel Plaza 1 Thanh Nien Ba Dinh 56 75 448 Somerset Hoa Binh 106 Hoang Quoc Viet Cau Giay 206 90 179 Somerset West Lake 254D Thuy Khue Tay Ho 90 80 42.310 Sun Red River 23 Phan Chu Trinh Hoan Kiem 46 98 24.311 Intercontinental Ha Noi 13 Nghi Tam Tay Ho 25 20 36.4
Grade A 1,470 85 29.6
1 Atlanta 49 Hang Chuoi Hai Ba Trung 51 94 19.12 Flower Village Hanoi 14 Thuy Khue Tay Ho 132 88 23.83 Elegant Suites 19B Ha Hoi Hoan Kiem 39 92 184 Elegant Suites Westlake 10C Dang Thai Mai Tay Ho 131 8 22.95 Hanoi Lake 11-13 Nam Trang Ba Dinh 10 90 15.7
6 Hoa Binh Green No. 14, Ally 376 Buoi Ba Dinh 54 86 20.8
7 Lakeside Garden 56 Xuan Dieu Tay Ho 7 100 21.5
8 May Fair 34B Tan Phu Ba Dinh 48 96 19.2
9 Oriential Palace 33 Tay Ho Tay Ho 57 84 21
10 Park View 9 Nguyen Binh Khiem Hai Ba Trung 6 100 13.8
11 Rainbow 7 Trieu Viet Vuong Hai Ba Trung 26 92 13.4
12 Rose Garden 170 Ngoc Khanh Ba Dinh 96 75 17.1
13 Swan Lake 3/61/31 Xuan Dieu Tay Ho 6 100 19.3
14 Skyline Tower 4 Dang Dung Ba Dinh 84 96 20.8
15 V-Tower 649 Kim Ma Ba Dinh 36 100 28.2
16 DC Building 144 Doi Can Ba Dinh 9 56 10.6
17 Hoa Binh Hotel 27 Ly Thuong Kiet Hoan Kiem 9 100 21.8
18 Palace de Thien Thai 2 Tho Nhuom Hoan Kiem 16 88 23
19 The City Residences 37 Phan Dinh Phung Ba Dinh 15 60 18.5
20 Candeo Hotel 287-301 Doi Can Ba Dinh 69 26 23.1
Grade b 901 71.8 20.9
q4 2015 | InDustrIAl
VIetnAM quArterly KnOWleDGe repOrt
©2016 Colliers International Research Page 16
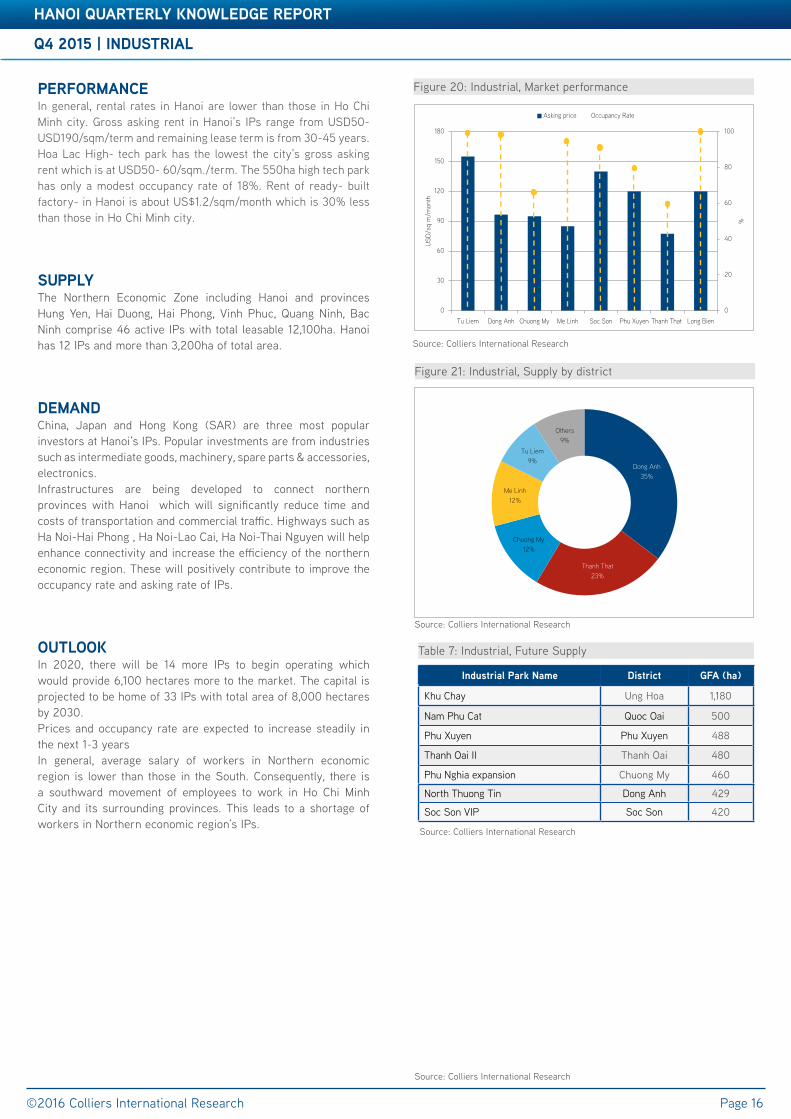
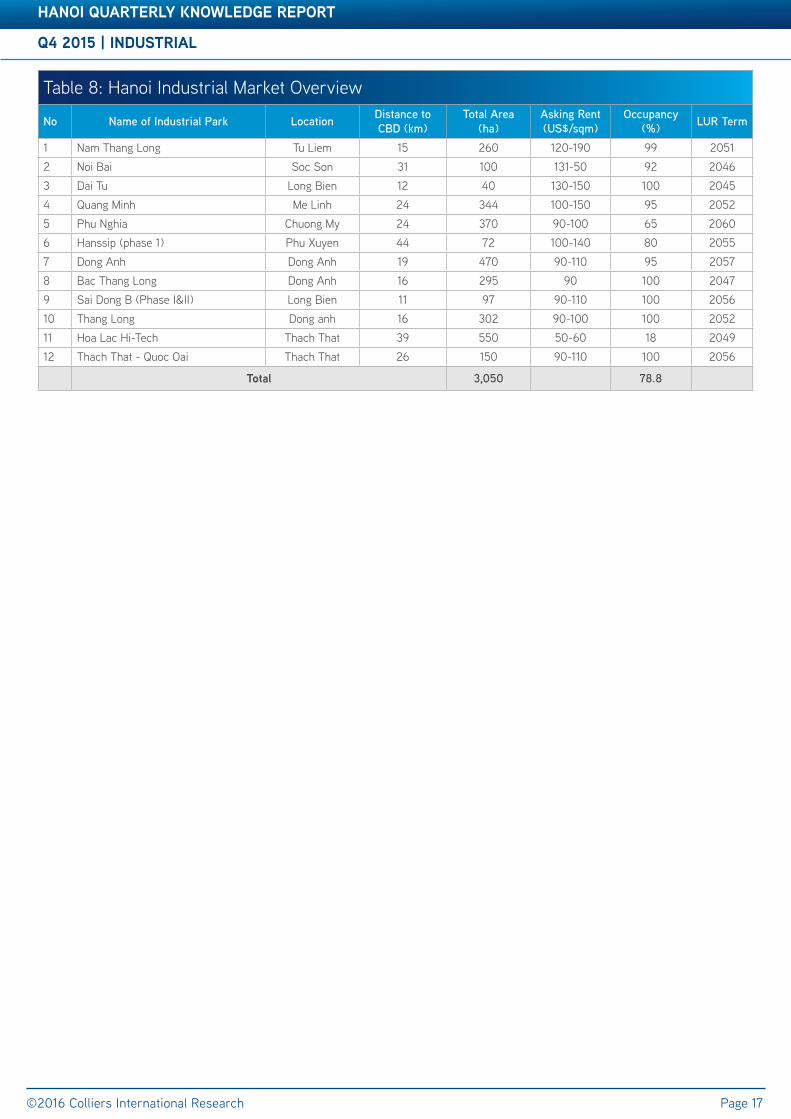
perfOrMAnCeIn general, rental rates in Hanoi are lower than those in Ho Chi Minh city. Gross asking rent in Hanoi’s IPs range from USD50- USD190/sqm/term and remaining lease term is from 30-45 years. Hoa Lac High- tech park has the lowest the city’s gross asking rent which is at USD50- 60/sqm./term. The 550ha high tech park has only a modest occupancy rate of 18%. Rent of ready- built factory- in Hanoi is about US$1.2/sqm/month which is 30% less than those in Ho Chi Minh city.
supplyThe Northern Economic Zone including Hanoi and provinces Hung Yen, Hai Duong, Hai Phong, Vinh Phuc, Quang Ninh, Bac Ninh comprise 46 active IPs with total leasable 12,100ha. Hanoi has 12 IPs and more than 3,200ha of total area.
DeMAnDChina, Japan and Hong Kong (SAR) are three most popular investors at Hanoi’s IPs. Popular investments are from industries such as intermediate goods, machinery, spare parts & accessories, electronics.Infrastructures are being developed to connect northern provinces with Hanoi which will significantly reduce time and costs of transportation and commercial traffic. Highways such as Ha Noi-Hai Phong , Ha Noi-Lao Cai, Ha Noi-Thai Nguyen will help enhance connectivity and increase the efficiency of the northern economic region. These will positively contribute to improve the occupancy rate and asking rate of IPs.
OutlOOKIn 2020, there will be 14 more IPs to begin operating which would provide 6,100 hectares more to the market. The capital is projected to be home of 33 IPs with total area of 8,000 hectares by 2030.Prices and occupancy rate are expected to increase steadily in the next 1-3 yearsIn general, average salary of workers in Northern economic region is lower than those in the South. Consequently, there is a southward movement of employees to work in Ho Chi Minh City and its surrounding provinces. This leads to a shortage of workers in Northern economic region’s IPs.
hAnOI quArterly KnOWleDGe repOrt
Figure 20: Industrial, Market performance
Source: Colliers International Research
Figure 21: Industrial, Supply by district
Source: Colliers International Research
Source: Colliers International Research
Table 7: Industrial, Future Supply
Industrial park name District GfA (ha)
Khu Chay Ung Hoa 1,180
Nam Phu Cat Quoc Oai 500
Phu Xuyen Phu Xuyen 488
Thanh Oai II Thanh Oai 480
Phu Nghia expansion Chuong My 460
North Thuong Tin Dong Anh 429
Soc Son VIP Soc Son 420
Dong Anh35%
Thanh That 23%
Chuong My12%
Me Linh12%
Tu Liem9%
Others9%
0
20
40
60
80
100
0
30
60
90
120
150
180
Tu Liem Dong Anh Chuong My Me Linh Soc Son Phu Xuyen Thanh That Long Bien
%
US
D/s
q m
/mon
th
Asking price Occupancy Rate
Source: Colliers International Research
q4 2015 | InDustrIAl
hAnOI quArterly KnOWleDGe repOrt
Accelerating succ9ss
q4 2015 | InDustrIAl
hAnOI quArterly KnOWleDGe repOrt
©2016 Colliers International Research Page 17
Table 3: Significant Office ProjectsTable 8: Hanoi Industrial Market Overview
No Name of Industrial Park Location Distance to CBD (km)
Total Area(ha)
Asking Rent (US$/sqm)
Occupancy (%) LUR Term
1 Nam Thang Long Tu Liem 15 260 120-190 99 20512 Noi Bai Soc Son 31 100 131-50 92 20463 Dai Tu Long Bien 12 40 130-150 100 20454 Quang Minh Me Linh 24 344 100-150 95 20525 Phu Nghia Chuong My 24 370 90-100 65 20606 Hanssip (phase 1) Phu Xuyen 44 72 100-140 80 20557 Dong Anh Dong Anh 19 470 90-110 95 20578 Bac Thang Long Dong Anh 16 295 90 100 20479 Sai Dong B (Phase I&II) Long Bien 11 97 90-110 100 205610 Thang Long Dong anh 16 302 90-100 100 205211 Hoa Lac Hi-Tech Thach That 39 550 50-60 18 204912 Thach That - Quoc Oai Thach That 26 150 90-110 100 2056
total 3,050 78.8
COLLIERS INTERNATIONAL | VIETNAM
hO ChI MInh CItyBitexco Office Building, 7th Floor19-25 Nguyen Hue StreetDistrict 1, HCM City, VietnamTel: + 84 8 3827 5665
hAnOIPress Club Building, 4th Floor59A Ly Thai To Street, Hoan Kiem District, Hanoi, VietnamTel: +84 8 3827 5665
502 offices in67 countries on6 continents
Accelerating success
DAVID JACKSONGeneral Director
+84 8 3827 5665
About Colliers InternationalColliers International is a leader in global real estate services, defined by our spirit of enterprise.
Through a culture of service excellence and a shared sense of initiative, we integrate the resources of real estate specialists worldwide to accelerate the success of our partners.We connect through a shared set of values that shape a collaborative environment throughout our organization that is unsurpassed in the industry.
With more than 100 professionals in 2 offices in Vietnam, the team is market driven and has proven and successful track record with both international and local experience.
From Hanoi to Ho Chi Minh City, we provide a full range of real estate services
The foundation of our services is the strength and depth of our experience.
publication Coverage frequency Content Availability
Knowledge Report/Market Insights
Vietnam Cities Quarterly All market sectors Publicly available
Investment report Vietnam Quarterly Economic updates and Investment highlights
Publicly available
CBD Report HCMC CBD Monthly Office, Retail, Hotel and Serviced Apartment
Publicly available
Residential launch update
HCMC Monthly Residential Publicly available
Asia Pacific Office Report
Asia Pacificincluding Vietnam
Quarterly Office market Publicly available
Vietnam Property Market Report
Vietnam cities Quarterly All market sectors On subscription
Development Recommendation
Vietnam cities At request All market sectors On subscription
$2.30billion in annual revenue
1.7billion square feet under management
16,300professionalsand staff
This document has been prepared by Colliers International for advertising and general information only. Colliers International makes no guarantees, representations or warranties of any kind, expressed or implied, regarding the information including, but not limited to, warranties of content, accuracy and reliability. Any interested party should undertake their own inquiries as to the accuracy of the information. Colliers International excludes unequivocally all inferred or implied terms, conditions and warranties arising out of this document and excludes all liability for loss and damages arising there from. This publication is the copyrighted property of Colliers International and/or its licensor(s). ©2016. All rights reserved.
For further information, please contact us:
VIetnAM | reseArCh & fOreCAst repOrt
©2016 Colliers International Research www.colliers.com/vietnam
HA VOSenior Research Analyst
+84 8 3827 5665