Embed Size (px)
Citation preview

Accelerating successwww.colliers.com/vietnam
HANOI quArterly KNOWleDGe repOrt q3 2016

tAble Of CONteNts
eCONOMIC OVerVIeW...............................................................................................................
VIETNAM ....................................................................................................................................
HO CHI MINH CITY ......................................................................................................................
HA NOI ........................................................................................................................................
HA NOI MArKet OVerVIeW ................................................................................................ OFFICE ........................................................................................................................................
RETAIL ........................................................................................................................................
CONDOMINIUM ............................................................................................................................
VILLA & TOWNHOUSE .................................................................................................................
SERVICED APARTMENT ..............................................................................................................
INDUSTRIAL ................................................................................................................................
lIst Of AbbreVIAtIONs ARR: Average Rental Rate GRDP: Gross Regional Domestic Product
CBD: Central Business District IP: Industrial Park
CPI: Consumer Price Index NLA: Net Lettable Area
FTA: Free Trade Agreements TPP: Trans-Pacific Partnership GDP: Gross Domestic Product Q-o-Q: Quarter on Quarter
GFA: Gross Floor Area Y-o-Y: Year on Year
Cover page: Keangnam Hanoi Landmark Tower
4-5
4
5
5
6-17
6
8
10
12
14
16
page

lIst Of fIGures Figure 1: Vietnam Exports - Imports in 3Q 2016..................................................................................
Figure 2: International Arrivals to Vietnam in 3Q 2016 ......................................................................
Figure 3: FDI Capital of HCMC and Hanoi ..........................................................................................
Figure 4: GDP Growth Rate of HCMC and Hanoi ................................................................................
HANOI MArKet OVerVIeW Figure 5: Office, Average Asking Rent.................................................................................................
Figure 6: Office, Occupancy Rate .......................................................................................................
Figure 7: Retail, Market Performance .................................................................................................
Figure 8: Retail, Total Supply .............................................................................................................
Figure 9: Condominium, Primary Sales Price ....................................................................................
Figure 10: Condominium, New Launches by Quarter and Segment .....................................................
Figure 11: Condominium, Sold Units by Quarter and Segment .............................................................
Figure 12: Villa and Townhouse, Supply by Quarter ............................................................................
Figure 13: Villa and Townhouse, Supply by District ............................................................................
Figure 14: Villa and Townhouse, Q-o-Q changes in Secondary Price ..................................................
Figure 15: Serviced Apartment, Average Asking Rent by Grade ..........................................................
Figure 16: Serviced Apartment, Occupancy Rate ...............................................................................
Figure 17: Industrial, Market Performance by Distrtict ........................................................................
Figure 18: Industrial, Supply by District .............................................................................................
lIst Of tAbles Table 1: Macroeconomic Indicators of HCMC and Hanoi ......................................................................
Table 2: Office, Future Supply.............................................................................................................
Table 3: Significant CBD Office Projects .............................................................................................
Table 4: Retail, Future Supply ............................................................................................................
Table 5: Significant Retail Projects .....................................................................................................
Table 6: Condominium, New Projects Launched in Q3 2016 ................................................................
Table 7: Villa and Townhouse, New Projects Launched in Q3 2016 .....................................................
Table 8: Serviced Apartment, Supply Supply ......................................................................................
Table 9: Significant Serviced Apartment Projects ...............................................................................
Table 10: Industrial, Future Supply ....................................................................................................
Table 11: Hanoi Industrial Market Overview ........................................................................................
4
4
5
5
6
6
8
8
10
10
10
12
12
12
14
14
16
16
5
6
7
8
9
11
13
14
15
16
17
page
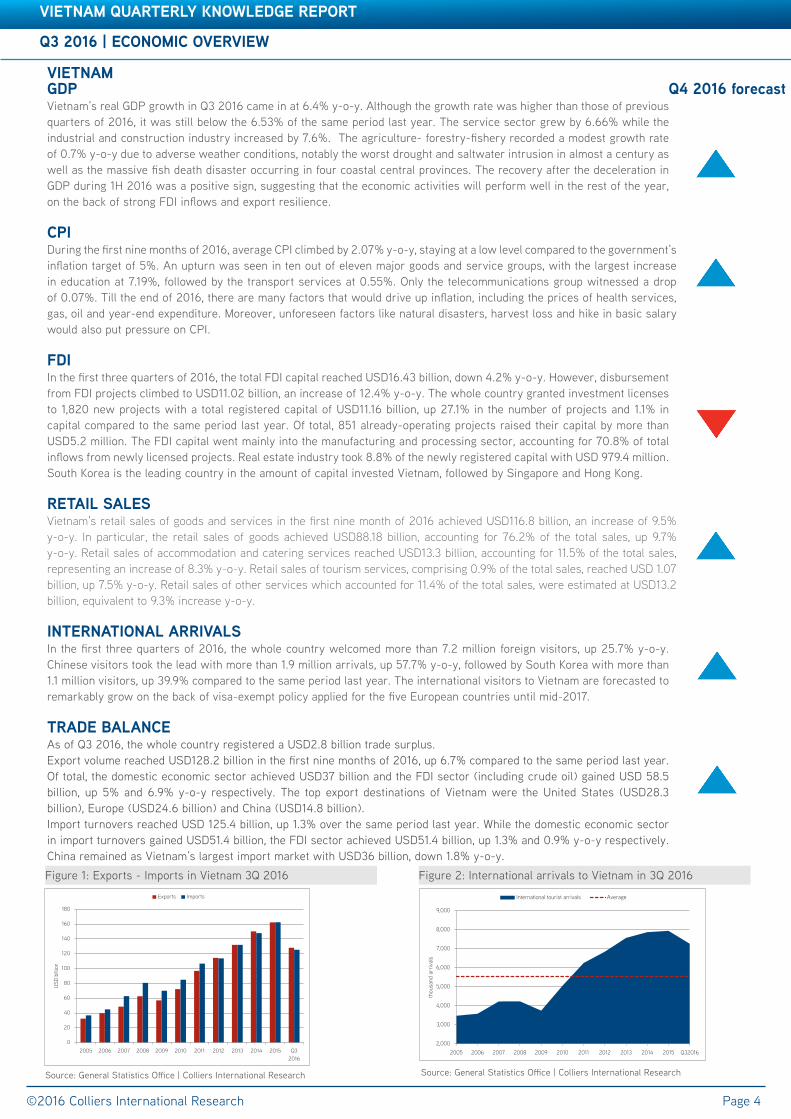
GDpVietnam’s real GDP growth in Q3 2016 came in at 6.4% y-o-y. Although the growth rate was higher than those of previous quarters of 2016, it was still below the 6.53% of the same period last year. The service sector grew by 6.66% while the industrial and construction industry increased by 7.6%. The agriculture- forestry-fishery recorded a modest growth rate of 0.7% y-o-y due to adverse weather conditions, notably the worst drought and saltwater intrusion in almost a century as well as the massive fish death disaster occurring in four coastal central provinces. The recovery after the deceleration in GDP during 1H 2016 was a positive sign, suggesting that the economic activities will perform well in the rest of the year, on the back of strong FDI inflows and export resilience.
CpIDuring the first nine months of 2016, average CPI climbed by 2.07% y-o-y, staying at a low level compared to the government’s inflation target of 5%. An upturn was seen in ten out of eleven major goods and service groups, with the largest increase in education at 7.19%, followed by the transport services at 0.55%. Only the telecommunications group witnessed a drop of 0.07%. Till the end of 2016, there are many factors that would drive up inflation, including the prices of health services, gas, oil and year-end expenditure. Moreover, unforeseen factors like natural disasters, harvest loss and hike in basic salary would also put pressure on CPI.
fDIIn the first three quarters of 2016, the total FDI capital reached USD16.43 billion, down 4.2% y-o-y. However, disbursement from FDI projects climbed to USD11.02 billion, an increase of 12.4% y-o-y. The whole country granted investment licenses to 1,820 new projects with a total registered capital of USD11.16 billion, up 27.1% in the number of projects and 1.1% in capital compared to the same period last year. Of total, 851 already-operating projects raised their capital by more than USD5.2 million. The FDI capital went mainly into the manufacturing and processing sector, accounting for 70.8% of total inflows from newly licensed projects. Real estate industry took 8.8% of the newly registered capital with USD 979.4 million. South Korea is the leading country in the amount of capital invested Vietnam, followed by Singapore and Hong Kong.
retAIl sAles Vietnam’s retail sales of goods and services in the first nine month of 2016 achieved USD116.8 billion, an increase of 9.5% y-o-y. In particular, the retail sales of goods achieved USD88.18 billion, accounting for 76.2% of the total sales, up 9.7% y-o-y. Retail sales of accommodation and catering services reached USD13.3 billion, accounting for 11.5% of the total sales, representing an increase of 8.3% y-o-y. Retail sales of tourism services, comprising 0.9% of the total sales, reached USD 1.07 billion, up 7.5% y-o-y. Retail sales of other services which accounted for 11.4% of the total sales, were estimated at USD13.2 billion, equivalent to 9.3% increase y-o-y.
INterNAtIONAl ArrIVAls In the first three quarters of 2016, the whole country welcomed more than 7.2 million foreign visitors, up 25.7% y-o-y. Chinese visitors took the lead with more than 1.9 million arrivals, up 57.7% y-o-y, followed by South Korea with more than 1.1 million visitors, up 39.9% compared to the same period last year. The international visitors to Vietnam are forecasted to remarkably grow on the back of visa-exempt policy applied for the five European countries until mid-2017.
trADe bAlANCeAs of Q3 2016, the whole country registered a USD2.8 billion trade surplus. Export volume reached USD128.2 billion in the first nine months of 2016, up 6.7% compared to the same period last year. Of total, the domestic economic sector achieved USD37 billion and the FDI sector (including crude oil) gained USD 58.5 billion, up 5% and 6.9% y-o-y respectively. The top export destinations of Vietnam were the United States (USD28.3 billion), Europe (USD24.6 billion) and China (USD14.8 billion). Import turnovers reached USD 125.4 billion, up 1.3% over the same period last year. While the domestic economic sector in import turnovers gained USD51.4 billion, the FDI sector achieved USD51.4 billion, up 1.3% and 0.9% y-o-y respectively. China remained as Vietnam’s largest import market with USD36 billion, down 1.8% y-o-y.
q3 2016 | eCONOMIC OVerVIeW
©2016 Colliers International Research
VIetNAM quArterly KNOWleDGe repOrt
Page 4
q4 2016 forecast
Figure 1: Exports - Imports in Vietnam 3Q 2016
Source: General Statistics Office | Colliers International Research
Figure 2: International arrivals to Vietnam in 3Q 2016
Source: General Statistics Office | Colliers International Research
VIetNAM
2,000
3,000
4,000
5,000
6,000
7,000
8,000
9,000
2005 2006 2007 2008 2009 2010 2011 2012 2013 2014 2015 Q32016
thou
sand
arr
ival
s
International tourist arrivals Average
0
20
40
60
80
100
120
140
160
180
2005 2006 2007 2008 2009 2010 2011 2012 2013 2014 2015 Q32016
USD
billio
n
Exports Imports
q3 2016 | eCONOMIC OVerVIeW
VIetNAM quArterly KNOWleDGe repOrt
q4 2016 forecast
q3 2016 | eCONOMIC OVerVIeW
©2016 Colliers International Research
VIetNAM quArterly KNOWleDGe repOrt
Page 5
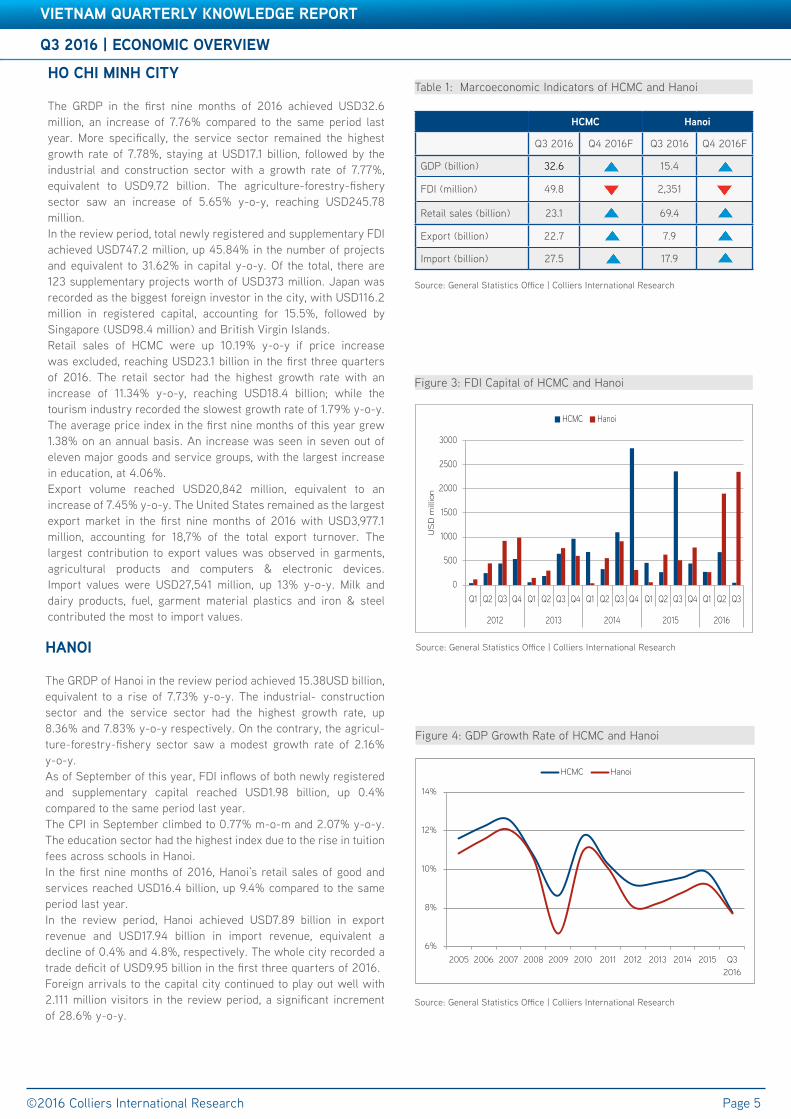
Figure 4: GDP Growth Rate of HCMC and Hanoi
Source: General Statistics Office | Colliers International Research
Source: General Statistics Office | Colliers International Research
Table 1: Marcoeconomic Indicators of HCMC and Hanoi
HCMC Hanoi
Q3 2016 Q4 2016F Q3 2016 Q4 2016F
GDP (billion) 32.6 15.4
FDI (million) 49.8 2,351
Retail sales (billion) 23.1 69.4
Export (billion) 22.7 7.9
Import (billion) 27.5 17.9
HO CHI MINH CIty
The GRDP in the first nine months of 2016 achieved USD32.6 million, an increase of 7.76% compared to the same period last year. More specifically, the service sector remained the highest growth rate of 7.78%, staying at USD17.1 billion, followed by the industrial and construction sector with a growth rate of 7.77%, equivalent to USD9.72 billion. The agriculture-forestry-fishery sector saw an increase of 5.65% y-o-y, reaching USD245.78 million.In the review period, total newly registered and supplementary FDI achieved USD747.2 million, up 45.84% in the number of projects and equivalent to 31.62% in capital y-o-y. Of the total, there are 123 supplementary projects worth of USD373 million. Japan was recorded as the biggest foreign investor in the city, with USD116.2 million in registered capital, accounting for 15.5%, followed by Singapore (USD98.4 million) and British Virgin Islands.Retail sales of HCMC were up 10.19% y-o-y if price increase was excluded, reaching USD23.1 billion in the first three quarters of 2016. The retail sector had the highest growth rate with an increase of 11.34% y-o-y, reaching USD18.4 billion; while the tourism industry recorded the slowest growth rate of 1.79% y-o-y. The average price index in the first nine months of this year grew 1.38% on an annual basis. An increase was seen in seven out of eleven major goods and service groups, with the largest increase in education, at 4.06%. Export volume reached USD20,842 million, equivalent to an increase of 7.45% y-o-y. The United States remained as the largest export market in the first nine months of 2016 with USD3,977.1 million, accounting for 18,7% of the total export turnover. The largest contribution to export values was observed in garments, agricultural products and computers & electronic devices. Import values were USD27,541 million, up 13% y-o-y. Milk and dairy products, fuel, garment material plastics and iron & steel contributed the most to import values.
HANOI
The GRDP of Hanoi in the review period achieved 15.38USD billion, equivalent to a rise of 7.73% y-o-y. The industrial- construction sector and the service sector had the highest growth rate, up 8.36% and 7.83% y-o-y respectively. On the contrary, the agricul-ture-forestry-fishery sector saw a modest growth rate of 2.16% y-o-y.As of September of this year, FDI inflows of both newly registered and supplementary capital reached USD1.98 billion, up 0.4% compared to the same period last year. The CPI in September climbed to 0.77% m-o-m and 2.07% y-o-y. The education sector had the highest index due to the rise in tuition fees across schools in Hanoi.In the first nine months of 2016, Hanoi’s retail sales of good and services reached USD16.4 billion, up 9.4% compared to the same period last year. In the review period, Hanoi achieved USD7.89 billion in export revenue and USD17.94 billion in import revenue, equivalent a decline of 0.4% and 4.8%, respectively. The whole city recorded a trade deficit of USD9.95 billion in the first three quarters of 2016.Foreign arrivals to the capital city continued to play out well with 2.111 million visitors in the review period, a significant increment of 28.6% y-o-y.
Figure 3: FDI Capital of HCMC and Hanoi
Source: General Statistics Office | Colliers International Research
0
500
1000
1500
2000
2500
3000
Q1 Q2 Q3 Q4 Q1 Q2 Q3 Q4 Q1 Q2 Q3 Q4 Q1 Q2 Q3 Q4 Q1 Q2 Q3
2012 2013 2014 2015 2016
US
D m
illio
nHCMC Hanoi
6%
8%
10%
12%
14%
2005 2006 2007 2008 2009 2010 2011 2012 2013 2014 2015 Q32016
HCMC Hanoi
Accelerating success
q3 2016 | HA NOI | OffICe
VIetNAM quArterly KNOWleDGe repOrt
©2016 Colliers International Research Page 6
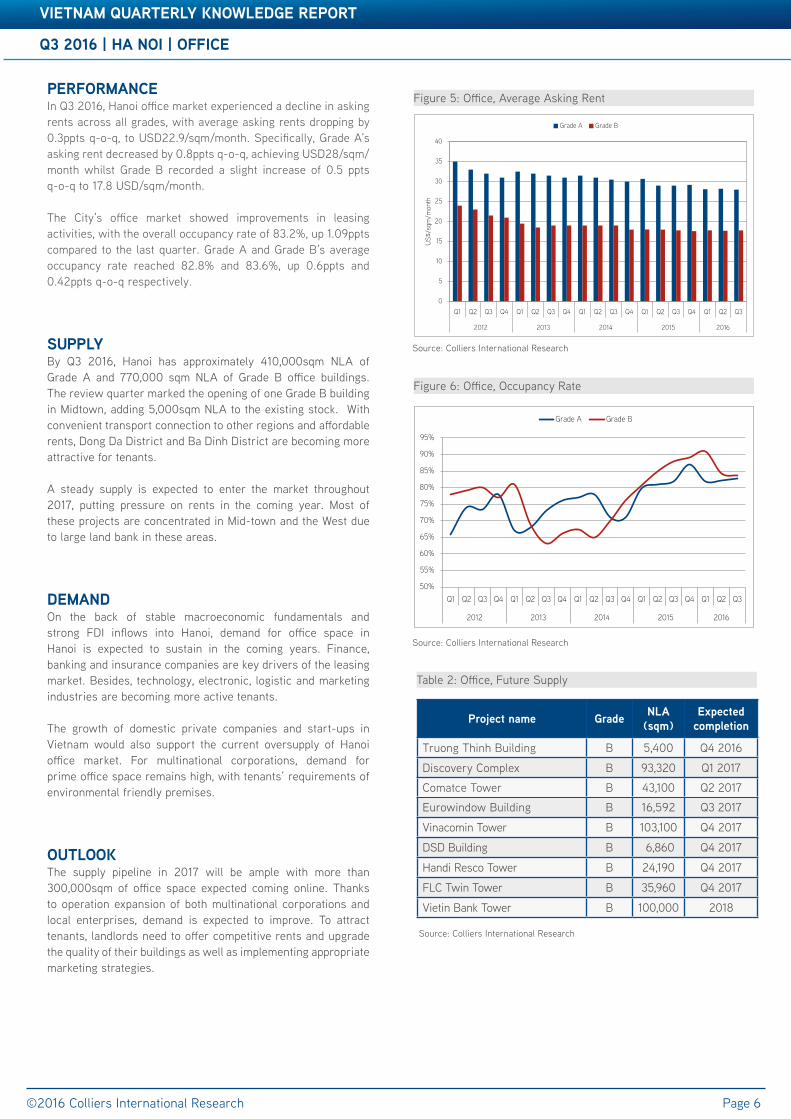
perfOrMANCeIn Q3 2016, Hanoi office market experienced a decline in asking rents across all grades, with average asking rents dropping by 0.3ppts q-o-q, to USD22.9/sqm/month. Specifically, Grade A’s asking rent decreased by 0.8ppts q-o-q, achieving USD28/sqm/month whilst Grade B recorded a slight increase of 0.5 ppts q-o-q to 17.8 USD/sqm/month.
The City’s office market showed improvements in leasing activities, with the overall occupancy rate of 83.2%, up 1.09ppts compared to the last quarter. Grade A and Grade B’s average occupancy rate reached 82.8% and 83.6%, up 0.6ppts and 0.42ppts q-o-q respectively.
supplyBy Q3 2016, Hanoi has approximately 410,000sqm NLA of Grade A and 770,000 sqm NLA of Grade B office buildings. The review quarter marked the opening of one Grade B building in Midtown, adding 5,000sqm NLA to the existing stock. With convenient transport connection to other regions and affordable rents, Dong Da District and Ba Dinh District are becoming more attractive for tenants.
A steady supply is expected to enter the market throughout 2017, putting pressure on rents in the coming year. Most of these projects are concentrated in Mid-town and the West due to large land bank in these areas.
DeMANDOn the back of stable macroeconomic fundamentals and strong FDI inflows into Hanoi, demand for office space in Hanoi is expected to sustain in the coming years. Finance, banking and insurance companies are key drivers of the leasing market. Besides, technology, electronic, logistic and marketing industries are becoming more active tenants.
The growth of domestic private companies and start-ups in Vietnam would also support the current oversupply of Hanoi office market. For multinational corporations, demand for prime office space remains high, with tenants’ requirements of environmental friendly premises.
OutlOOKThe supply pipeline in 2017 will be ample with more than 300,000sqm of office space expected coming online. Thanks to operation expansion of both multinational corporations and local enterprises, demand is expected to improve. To attract tenants, landlords need to offer competitive rents and upgrade the quality of their buildings as well as implementing appropriate marketing strategies.
Figure 5: Office, Average Asking Rent
Source: Colliers International Research
Figure 6: Office, Occupancy Rate
Source: Colliers International Research
Table 2: Office, Future Supply
Source: Colliers International Research
project name Grade NlA (sqm)
expected completion
Truong Thinh Building B 5,400 Q4 2016
Discovery Complex B 93,320 Q1 2017
Comatce Tower B 43,100 Q2 2017
Eurowindow Building B 16,592 Q3 2017
Vinacomin Tower B 103,100 Q4 2017
DSD Building B 6,860 Q4 2017
Handi Resco Tower B 24,190 Q4 2017
FLC Twin Tower B 35,960 Q4 2017
Vietin Bank Tower B 100,000 2018
0
5
10
15
20
25
30
35
40
Q1 Q2 Q3 Q4 Q1 Q2 Q3 Q4 Q1 Q2 Q3 Q4 Q1 Q2 Q3 Q4 Q1 Q2 Q3
2012 2013 2014 2015 2016
US
$/sq
m/m
onth
Grade A Grade B
50%
55%
60%
65%
70%
75%
80%
85%
90%
95%
Q1 Q2 Q3 Q4 Q1 Q2 Q3 Q4 Q1 Q2 Q3 Q4 Q1 Q2 Q3 Q4 Q1 Q2 Q3
2012 2013 2014 2015 2016
Grade A Grade B

q3 2016 | HA NOI | OffICe
©2016 Colliers International Research
VIetNAM quArterly KNOWleDGe repOrt
Page 7
(*) US$/sqm/month (NLA)
Table 3: Significant CBD Office Projects
No Name Address Completion Year
NLA (sqm)
Service Charges
(*)
Occupancy rate
Average asking rent
(**)1 Central Building 31 Hai Ba Trung 1995 3,653 9.0 100% 33.0
2 International Centre 17 Ngo Quyen 1995 6,500 7.0 90% 24.03 Hanoi Tower 49 Hai Ba Trung 1997 9,000 7.0 100% 27.04 63 Ly Thai To Building 63 Ly Thai To 1998 6,753 - 100% 47.05 Sun Red River Building 23 Phan Chu Trinh 1999 13,459 7.0 75% 28.06 Vietcombank Tower 198 Tran Quang Khai 2000 19,563 - 100% 29.0
7 Opera Business Centre 60 Ly Thai To 2007 3,787 included 85% 24.08 Pacific Palace 83B Ly Thuong Kiet 2007 16,600 7.0 91% 25.0
9 Asia Tower 2 Nha Tho 2007 3,100 included 77% 35.010 Sun City Building 13 Hai Ba Trung 2007 6,400 - 100% 45.0
11 BIDV Tower 194 Tran Quang Khai 2010 10,120 7.0 95% 30.0
12 Sentinel Place Hang Da 2010 8,000 8.5 95% 45.0
13 Corner Stone 16 Phan Chu Trinh 2013 26,500 7.0 70% 30.0
14 Hong Ha Center 25 Ly Thuong Kiet 2013 11,000 5.0 27.0% 19.0
Grade A 144,435 7.0 84% 30.0
1 Tungshing Square 2 Ngo Quyen 1996 8,306 7.0 89% 21.02 Melia Hotel 44B Ly Thuong Kiet 1997 8,500 - 90% 38.0
3 Prime Centre 53 Quang Trung 1998 7,600 - 100% 27.0
4 VIB Hai Ba Trung 59 Quang Trung 2006 3,000 - 68% 16.05 Capital Tower 109 Tran Hung Dao 2010 21,089 7.0 87% 20.06 Hanoi Tourist Building 18 Ly Thuong Kiet 2010 7,600 - 100% 24.0
7 Capital Building 72 Tran Hung Dao 2013 5,800 - 100% 25.08 Coalimex Building 33 Trang Thi 2013 5,071 5.0 79% 18.09 VID Building 115 Tran Hung Dao 2013 4,930 - 89% 23.010 Artex Port 31-33 Ngo Quyen 2014 4,725 - 100% 23
Grade B 76,621 6.0 91% 23.5
Accelerating success
q3 2016 | HA NOI | retAIl
VIetNAM quArterly KNOWleDGe repOrt
©2016 Colliers International Research Page 8
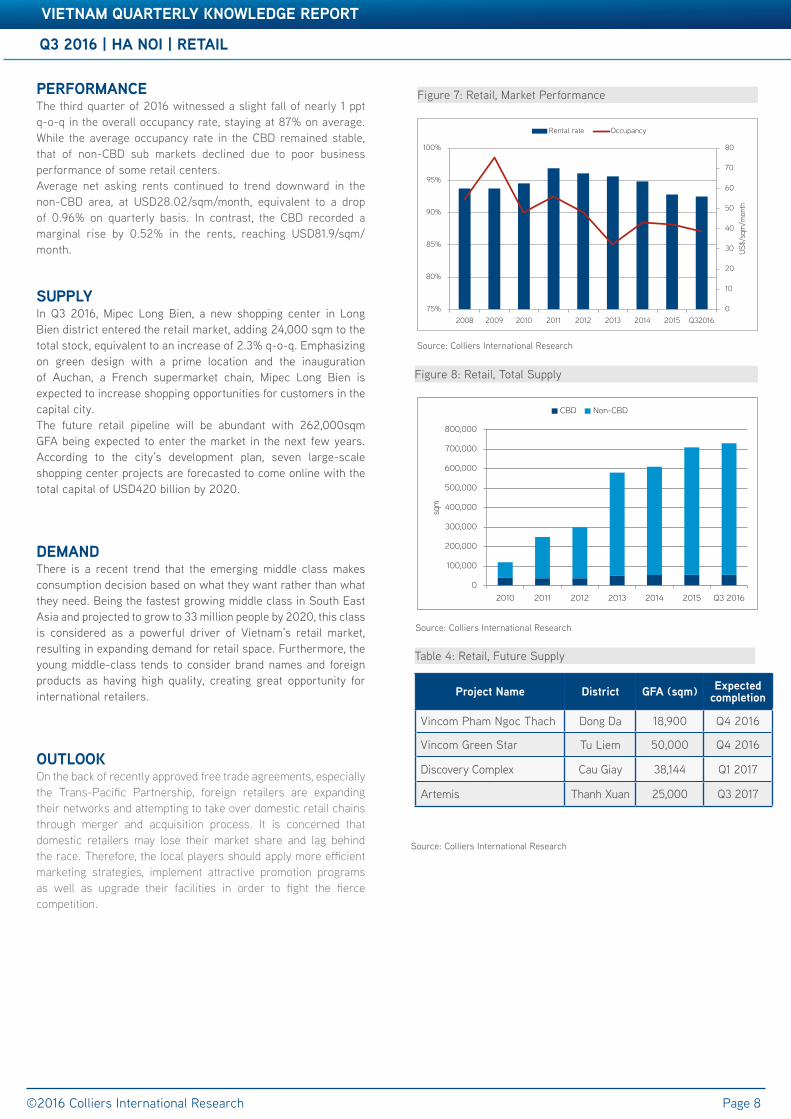
Table 3: Significant Office ProjectsperfOrMANCeThe third quarter of 2016 witnessed a slight fall of nearly 1 ppt q-o-q in the overall occupancy rate, staying at 87% on average. While the average occupancy rate in the CBD remained stable, that of non-CBD sub markets declined due to poor business performance of some retail centers.Average net asking rents continued to trend downward in the non-CBD area, at USD28.02/sqm/month, equivalent to a drop of 0.96% on quarterly basis. In contrast, the CBD recorded a marginal rise by 0.52% in the rents, reaching USD81.9/sqm/month.
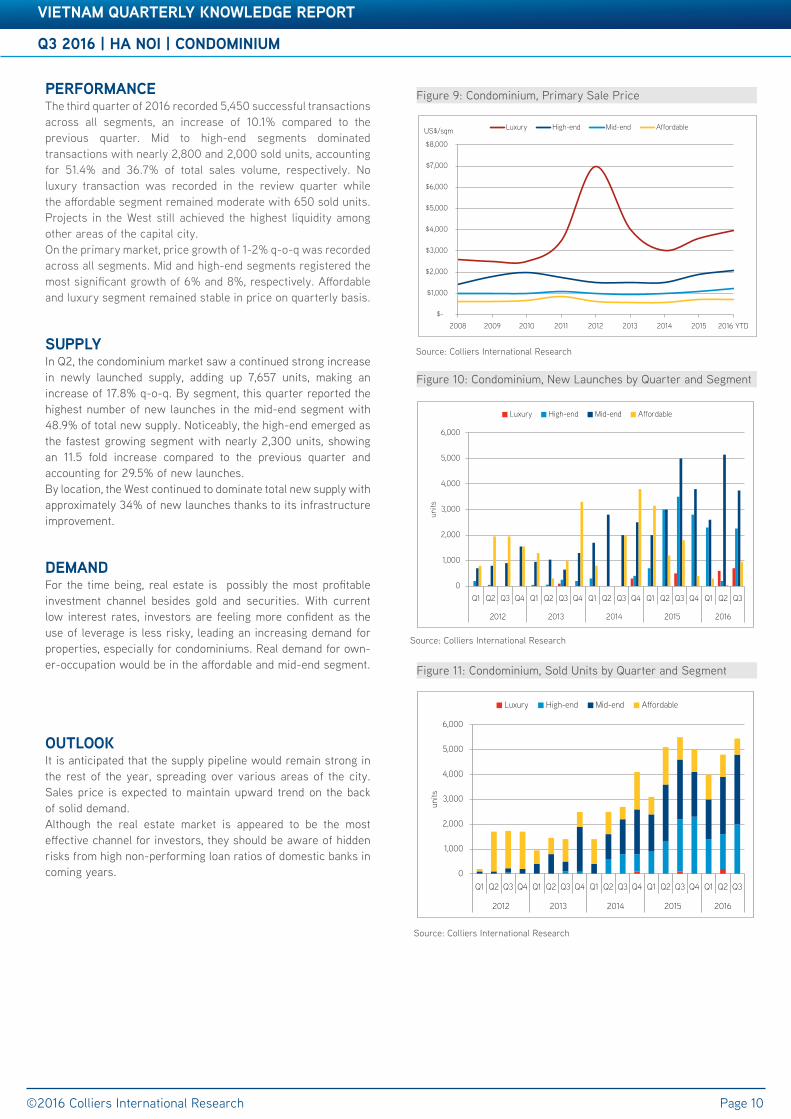
supplyIn Q3 2016, Mipec Long Bien, a new shopping center in Long Bien district entered the retail market, adding 24,000 sqm to the total stock, equivalent to an increase of 2.3% q-o-q. Emphasizing on green design with a prime location and the inauguration of Auchan, a French supermarket chain, Mipec Long Bien is expected to increase shopping opportunities for customers in the capital city.The future retail pipeline will be abundant with 262,000sqm GFA being expected to enter the market in the next few years. According to the city’s development plan, seven large-scale shopping center projects are forecasted to come online with the total capital of USD420 billion by 2020.
DeMANDThere is a recent trend that the emerging middle class makes consumption decision based on what they want rather than what they need. Being the fastest growing middle class in South East Asia and projected to grow to 33 million people by 2020, this class is considered as a powerful driver of Vietnam’s retail market, resulting in expanding demand for retail space. Furthermore, the young middle-class tends to consider brand names and foreign products as having high quality, creating great opportunity for international retailers.
OutlOOKOn the back of recently approved free trade agreements, especially the Trans-Pacific Partnership, foreign retailers are expanding their networks and attempting to take over domestic retail chains through merger and acquisition process. It is concerned that domestic retailers may lose their market share and lag behind the race. Therefore, the local players should apply more efficient marketing strategies, implement attractive promotion programs as well as upgrade their facilities in order to fight the fierce competition.
Figure 7: Retail, Market Performance
Table 4: Retail, Future Supply
Source: Colliers International Research
Source: Colliers International Research
Figure 8: Retail, Total Supply
Source: Colliers International Research
project Name District GfA (sqm) expected completion
Vincom Pham Ngoc Thach Dong Da 18,900 Q4 2016
Vincom Green Star Tu Liem 50,000 Q4 2016
Discovery Complex Cau Giay 38,144 Q1 2017
Artemis Thanh Xuan 25,000 Q3 2017
0
100,000
200,000
300,000
400,000
500,000
600,000
700,000
800,000
2010 2011 2012 2013 2014 2015 Q3 2016
sqm
CBD Non-CBD
0
10
20
30
40
50
60
70
80
75%
80%
85%
90%
95%
100%
2008 2009 2010 2011 2012 2013 2014 2015 Q32016
US$/
sqm
/mon
th
Rental rate Occupancy

VIetNAM quArterly KNOWleDGe repOrt
Accelerating success
q3 2016 | HA NOI | retAIl
VIetNAM quArterly KNOWleDGe repOrt
©2016 Colliers International Research Page 9
Table 5: Significant Retail Projects
No Name of Project /Building Address Location Completion
YearNLA
(sq m) ARR (*) Occupancy Rate
1 Central Building 31 Hai Ba Trung Hoan Kiem 1995 550 90-100 100%2 Hanoi Tower 49 Hai Ba Trung Hoan Kiem 1997 2,056 50-60 73%3 63 Ly Thai To Building 63 Ly Thai To Hoan Kiem 1998 594 150 100%4 ICC Building 71 Nguyen Chi Thanh Dong Da 2006 2,900 16 50%5 Pacific Place 83b Ly Thuong Kiet Hoan Kiem 2007 2,000 70 88%6 Opera Business Center 6b Trang Tien Hoan Kiem 2007 1,070 90-150 100%7 Golden Westlake 151 Thuy Khue Tay Ho 2007 1,000 25 75%8 Sun City 13 Hai Ba Trung Hoan Kiem 2008 861 90-95 100%
9 Asia Tower 6 Pho Nha Tho Hoan Kiem 2008 500 100 100%
10 Sentinel Place 41A Ly Thai To Hoan Kiem 2010 550 45 57%11 Sky City Tower 88 Lang Ha Dong Da 2010 5,400 20-80 100%12 Han Viet Tower 203 Minh Khai Hai Ba Trung 2012 600 16-17 59%13 Rainbow Tower 19/5 KDT Van Quan Ha Dong 2012 900 20 100%14 Hapumedicenter 85 Vu Trong Phung Thanh Xuan 2012 18,500 20 100%15 The Lancaster Hanoi 20 Nui Truc Ba Dinh 2013 3,123 33 45%16 Madarin Garden Residential 1 Hoang Minh Giam Cau Giay 2013 11,000 25-30 100%
Retail Podium 51,604 91%
1 Vincom Center Ba Trieu - Tower A&B 191 Ba Trieu Hai Ba Trung 2004 17,000 90-100 99%2 Vincom Center Ba Trieu - Tower C 191 Ba Trieu Hai Ba Trung 2004 10,974 80 100%3 Ruby Plaza 44 Le Ngoc Han Hai Ba Trung 2007 5,200 28 96%4 Syrena 51B Xuan Dieu Tay Ho 2008 5,000 30 100%5 Trang Tien Plaza 24 Hai Ba Trung Hoan Kiem 2008 14,000 10 85%6 Savico MegaMall 7-9 Nguyen Van Linh Long Bien 2011 54,900 20-25 99%7 Keangnam Palace Landmark Lot E6, Pham Hung Tu Liem 2011 60,771 20-53 80%8 Vincom Center Long Bien KDT Vincom Long Bien 2012 45,000 20 70%9 Indochina Plaza Hanoi 241 Xuan Thuy Cau Giay 2012 19,929 22 97%10 Vincom Mega Mall - Royal City 72A Nguyen Trai Thanh Xuan 2013 230,000 70 99%11 Vincom Mega Mall - Time City 458 Minh Khai Hai Ba Trung 2014 200,000 50 100%12 Aeon Mall Long Bien 2 Co Linh Long Bien 2015 72.000 45 100%13 Vincom Nguyen Chi Thanh 54A Nguyen Chi Thanh Dong Da 2015 34,500 70-80 99%
Shopping Centre 719,346 96%
1 Parkson (Viet Tower) 198 Tay Son Dong Da 2007 15,761 15 97%2 The Garden (Bitexco) Me Tri Tu Liem 2007 23,700 28-35 99%3 Ho Guom Plaza Ha Dong Ha Dong 2013 23,380 16 94%4 Lotte Department Store 54 Lieu Giai Ba Dinh 2014 38,709 43 97%
Department Store 101,550 97%
(*) ARR (Average Rental Rate): All rents are stated in net rents per sqm, inclusive service charge but exculding VAT
Accelerating success
q3 2016 | HA NOI | CONDOMINIuM
VIetNAM quArterly KNOWleDGe repOrt
©2016 Colliers International Research Page 10
perfOrMANCeThe third quarter of 2016 recorded 5,450 successful transactions across all segments, an increase of 10.1% compared to the previous quarter. Mid to high-end segments dominated transactions with nearly 2,800 and 2,000 sold units, accounting for 51.4% and 36.7% of total sales volume, respectively. No luxury transaction was recorded in the review quarter while the affordable segment remained moderate with 650 sold units. Projects in the West still achieved the highest liquidity among other areas of the capital city. On the primary market, price growth of 1-2% q-o-q was recorded across all segments. Mid and high-end segments registered the most significant growth of 6% and 8%, respectively. Affordable and luxury segment remained stable in price on quarterly basis.
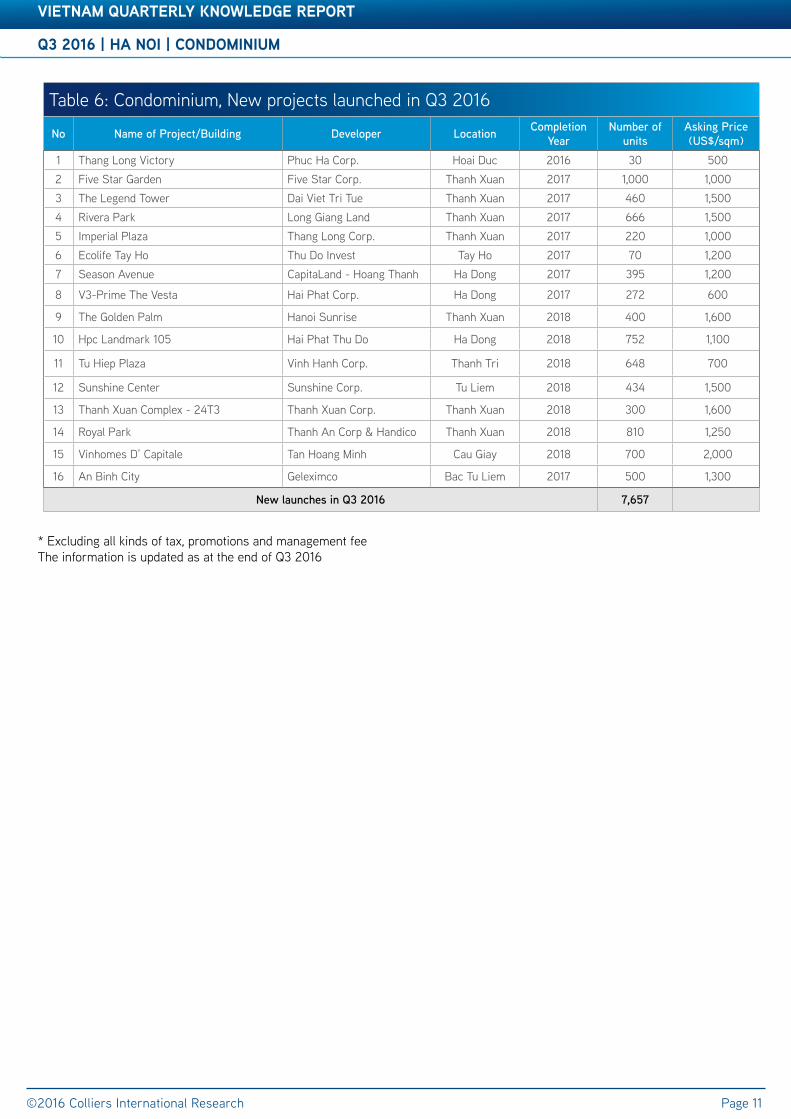
supplyIn Q2, the condominium market saw a continued strong increase in newly launched supply, adding up 7,657 units, making an increase of 17.8% q-o-q. By segment, this quarter reported the highest number of new launches in the mid-end segment with 48.9% of total new supply. Noticeably, the high-end emerged as the fastest growing segment with nearly 2,300 units, showing an 11.5 fold increase compared to the previous quarter and accounting for 29.5% of new launches. By location, the West continued to dominate total new supply with approximately 34% of new launches thanks to its infrastructure improvement.
DeMANDFor the time being, real estate is possibly the most profitable investment channel besides gold and securities. With current low interest rates, investors are feeling more confident as the use of leverage is less risky, leading an increasing demand for properties, especially for condominiums. Real demand for own-er-occupation would be in the affordable and mid-end segment.
OutlOOKIt is anticipated that the supply pipeline would remain strong in the rest of the year, spreading over various areas of the city. Sales price is expected to maintain upward trend on the back of solid demand. Although the real estate market is appeared to be the most effective channel for investors, they should be aware of hidden risks from high non-performing loan ratios of domestic banks in coming years.
Figure 9: Condominium, Primary Sale Price
Source: Colliers International Research
Figure 10: Condominium, New Launches by Quarter and Segment
Source: Colliers International Research
Source: Colliers International Research
Figure 11: Condominium, Sold Units by Quarter and Segment
0
1,000
2,000
3,000
4,000
5,000
6,000
Q1 Q2 Q3 Q4 Q1 Q2 Q3 Q4 Q1 Q2 Q3 Q4 Q1 Q2 Q3 Q4 Q1 Q2 Q3
2012 2013 2014 2015 2016
units
Luxury High-end Mid-end Affordable
$-
$1,000
$2,000
$3,000
$4,000
$5,000
$6,000
$7,000
$8,000
2008 2009 2010 2011 2012 2013 2014 2015 2016 YTD
Luxury High-end Mid-end AffordableUS$/sqm
0
1,000
2,000
3,000
4,000
5,000
6,000
Q1 Q2 Q3 Q4 Q1 Q2 Q3 Q4 Q1 Q2 Q3 Q4 Q1 Q2 Q3 Q4 Q1 Q2 Q3
2012 2013 2014 2015 2016
units
Luxury High-end Mid-end Affordable
q3 2016 | HA NOI | CONDOMINIuM
VIetNAM quArterly KNOWleDGe repOrt
q3 2016 | HA NOI | CONDOMINIuM
VIetNAM quArterly KNOWleDGe repOrt
©2016 Colliers International Research Page 11
Table 3: Significant Office ProjectsTable 3: Significant Office Projects
* Excluding all kinds of tax, promotions and management feeThe information is updated as at the end of Q3 2016
Table 6: Condominium, New projects launched in Q3 2016
No Name of Project/Building Developer Location Completion Year
Number of units
Asking Price (US$/sqm)
1 Thang Long Victory Phuc Ha Corp. Hoai Duc 2016 30 500 2 Five Star Garden Five Star Corp. Thanh Xuan 2017 1,000 1,000 3 The Legend Tower Dai Viet Tri Tue Thanh Xuan 2017 460 1,500 4 Rivera Park Long Giang Land Thanh Xuan 2017 666 1,500 5 Imperial Plaza Thang Long Corp. Thanh Xuan 2017 220 1,000 6 Ecolife Tay Ho Thu Do Invest Tay Ho 2017 70 1,200 7 Season Avenue CapitaLand - Hoang Thanh Ha Dong 2017 395 1,200
8 V3-Prime The Vesta Hai Phat Corp. Ha Dong 2017 272 600
9 The Golden Palm Hanoi Sunrise Thanh Xuan 2018 400 1,600
10 Hpc Landmark 105 Hai Phat Thu Do Ha Dong 2018 752 1,100
11 Tu Hiep Plaza Vinh Hanh Corp. Thanh Tri 2018 648 700
12 Sunshine Center Sunshine Corp. Tu Liem 2018 434 1,500
13 Thanh Xuan Complex - 24T3 Thanh Xuan Corp. Thanh Xuan 2018 300 1,600
14 Royal Park Thanh An Corp & Handico Thanh Xuan 2018 810 1,250
15 Vinhomes D’ Capitale Tan Hoang Minh Cau Giay 2018 700 2,000
16 An Binh City Geleximco Bac Tu Liem 2017 500 1,300
New launches in Q3 2016 7,657
Accelerating success
q3 2016 | HA NOI | VIllA & tOWNHOuse
VIetNAM quArterly KNOWleDGe repOrt
©2016 Colliers International Research Page 12
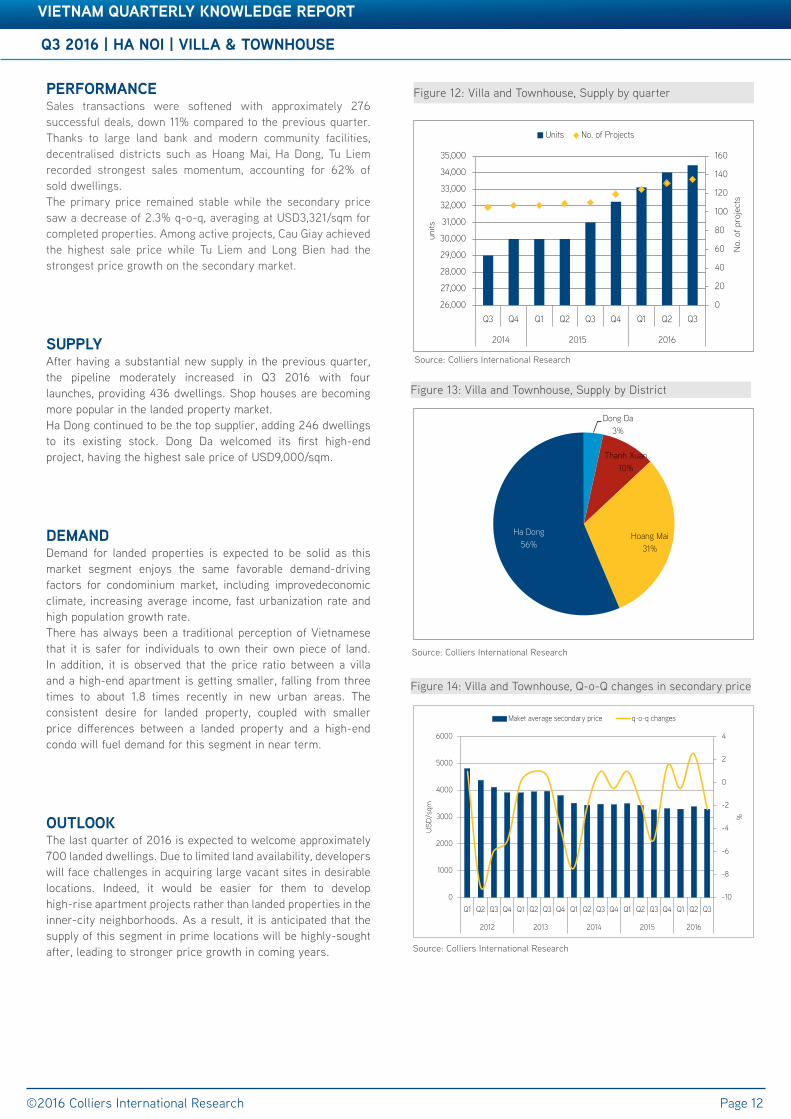
perfOrMANCeSales transactions were softened with approximately 276 successful deals, down 11% compared to the previous quarter. Thanks to large land bank and modern community facilities, decentralised districts such as Hoang Mai, Ha Dong, Tu Liem recorded strongest sales momentum, accounting for 62% of sold dwellings. The primary price remained stable while the secondary price saw a decrease of 2.3% q-o-q, averaging at USD3,321/sqm for completed properties. Among active projects, Cau Giay achieved the highest sale price while Tu Liem and Long Bien had the strongest price growth on the secondary market.
supplyAfter having a substantial new supply in the previous quarter, the pipeline moderately increased in Q3 2016 with four launches, providing 436 dwellings. Shop houses are becoming more popular in the landed property market. Ha Dong continued to be the top supplier, adding 246 dwellings to its existing stock. Dong Da welcomed its first high-end project, having the highest sale price of USD9,000/sqm.
DeMANDDemand for landed properties is expected to be solid as this market segment enjoys the same favorable demand-driving factors for condominium market, including improvedeconomic climate, increasing average income, fast urbanization rate and high population growth rate. There has always been a traditional perception of Vietnamese that it is safer for individuals to own their own piece of land. In addition, it is observed that the price ratio between a villa and a high-end apartment is getting smaller, falling from three times to about 1.8 times recently in new urban areas. The consistent desire for landed property, coupled with smaller price differences between a landed property and a high-end condo will fuel demand for this segment in near term.
OutlOOKThe last quarter of 2016 is expected to welcome approximately 700 landed dwellings. Due to limited land availability, developers will face challenges in acquiring large vacant sites in desirable locations. Indeed, it would be easier for them to develop high-rise apartment projects rather than landed properties in the inner-city neighborhoods. As a result, it is anticipated that the supply of this segment in prime locations will be highly-sought after, leading to stronger price growth in coming years.
Figure 12: Villa and Townhouse, Supply by quarter
Source: Colliers International Research
Figure 13: Villa and Townhouse, Supply by District
Source: Colliers International Research
Source: Colliers International Research
Figure 14: Villa and Townhouse, Q-o-Q changes in secondary price
0
20
40
60
80
100
120
140
160
26,000
27,000
28,000
29,000
30,000
31,000
32,000
33,000
34,000
35,000
Q3 Q4 Q1 Q2 Q3 Q4 Q1 Q2 Q3
2014 2015 2016
No.
of p
roje
cts
units
Units No. of Projects
-10
-8
-6
-4
-2
0
2
4
0
1000
2000
3000
4000
5000
6000
Q1 Q2 Q3 Q4 Q1 Q2 Q3 Q4 Q1 Q2 Q3 Q4 Q1 Q2 Q3 Q4 Q1 Q2 Q3
2012 2013 2014 2015 2016
%
US
D/s
qm
Maket average secondary price q-o-q changes
Dong Da3%
Thanh Xuan10%
Hoang Mai31%
Ha Dong 56%

q3 2016 | HA NOI | VIllA & tOWNHOuse
VIetNAM quArterly KNOWleDGe repOrt
Accelerating success
q3 2016 | HA NOI | VIllA & tOWNHOuse
VIetNAM quArterly KNOWleDGe repOrt
©2016 Colliers International Research Page 13
Table 3: Significant Office ProjectsTable 3: Significant Office ProjectsTable 3: Significant Office Projects
* Excluding all kinds of tax, promotions and management feeThe information is updated as at the end of Q3 2016
Table 7: Significant new projects launched in Q3 2016
No Name of Project/Building Developer Location Completion Year
Number of units
Asking Price (US$/sqm)
1 La Casa Villa RITM – MEKONG Dong Da 2016 15 9,000 2 Imperia Garden villas HBI Thanh Xuan 2017 42 7,000 3 Camellia (ST4) Gamuda Land Hoang Mai 2018 133 2,000 4 An Phu Shop villa Nam Cuong Ha Dong 246 1,700
New launches in Q3 2016 436
Accelerating success
q3 2016 | HA NOI | serVICeD ApArtMeNt
VIetNAM quArterly KNOWleDGe repOrt
©2016 Colliers International Research Page 14
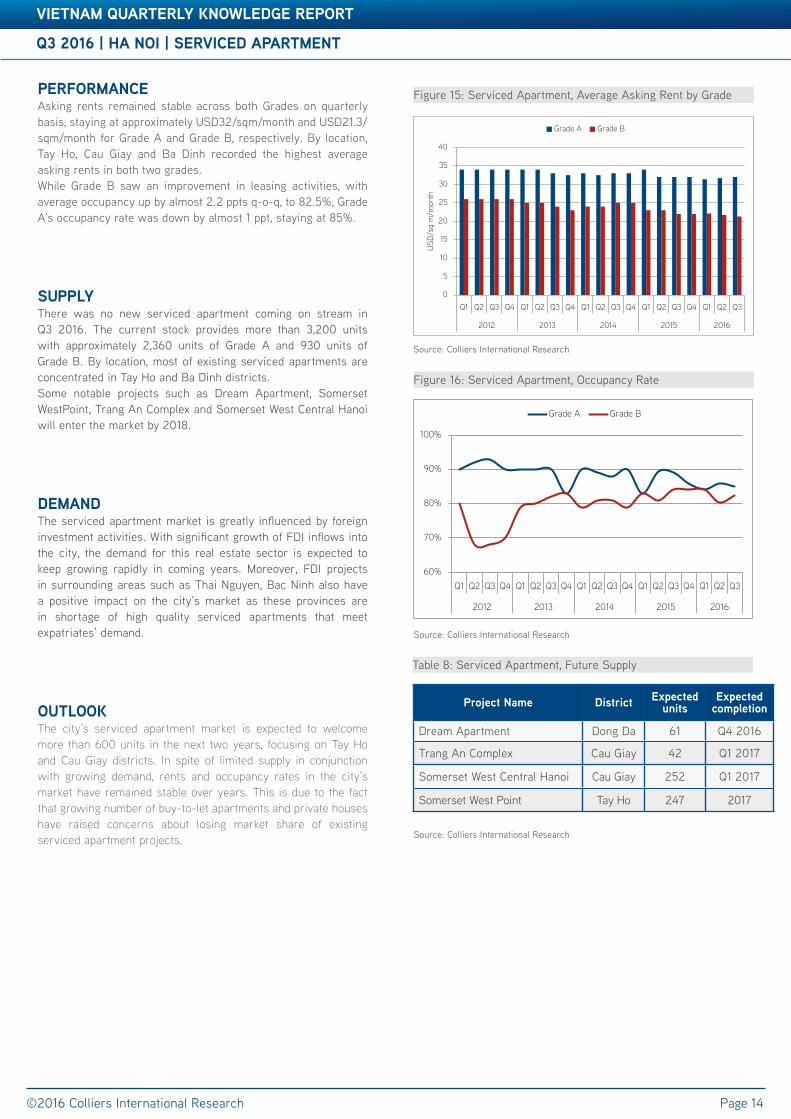
Table 3: Significant Office ProjectsperfOrMANCeAsking rents remained stable across both Grades on quarterly basis, staying at approximately USD32/sqm/month and USD21.3/sqm/month for Grade A and Grade B, respectively. By location, Tay Ho, Cau Giay and Ba Dinh recorded the highest average asking rents in both two grades. While Grade B saw an improvement in leasing activities, with average occupancy up by almost 2.2 ppts q-o-q, to 82.5%, Grade A’s occupancy rate was down by almost 1 ppt, staying at 85%.
supplyThere was no new serviced apartment coming on stream in Q3 2016. The current stock provides more than 3,200 units with approximately 2,360 units of Grade A and 930 units of Grade B. By location, most of existing serviced apartments are concentrated in Tay Ho and Ba Dinh districts. Some notable projects such as Dream Apartment, Somerset WestPoint, Trang An Complex and Somerset West Central Hanoi will enter the market by 2018.
DeMANDThe serviced apartment market is greatly influenced by foreign investment activities. With significant growth of FDI inflows into the city, the demand for this real estate sector is expected to keep growing rapidly in coming years. Moreover, FDI projects in surrounding areas such as Thai Nguyen, Bac Ninh also have a positive impact on the city’s market as these provinces are in shortage of high quality serviced apartments that meet expatriates’ demand.
OutlOOKThe city’s serviced apartment market is expected to welcome more than 600 units in the next two years, focusing on Tay Ho and Cau Giay districts. In spite of limited supply in conjunction with growing demand, rents and occupancy rates in the city’s market have remained stable over years. This is due to the fact that growing number of buy-to-let apartments and private houses have raised concerns about losing market share of existing serviced apartment projects.
Table 8: Serviced Apartment, Future Supply
Source: Colliers International Research
Figure 15: Serviced Apartment, Average Asking Rent by Grade
Source: Colliers International Research
Figure 16: Serviced Apartment, Occupancy Rate
Source: Colliers International Research
project Name District expected units
expected completion
Dream Apartment Dong Da 61 Q4 2016
Trang An Complex Cau Giay 42 Q1 2017
Somerset West Central Hanoi Cau Giay 252 Q1 2017
Somerset West Point Tay Ho 247 2017
60%
70%
80%
90%
100%
Q1 Q2 Q3 Q4 Q1 Q2 Q3 Q4 Q1 Q2 Q3 Q4 Q1 Q2 Q3 Q4 Q1 Q2 Q3
2012 2013 2014 2015 2016
Grade A Grade B
0
5
10
15
20
25
30
35
40
Q1 Q2 Q3 Q4 Q1 Q2 Q3 Q4 Q1 Q2 Q3 Q4 Q1 Q2 Q3 Q4 Q1 Q2 Q3
2012 2013 2014 2015 2016
USD
/sq
m/m
onth
Grade A Grade B
q3 2016 | HA NOI | serVICeD ApArtMeNt
VIetNAM quArterly KNOWleDGe repOrt
Accelerating success
q3 2016 | HA NOI | serVICeD ApArtMeNt
VIetNAM quArterly KNOWleDGe repOrt
©2016 Colliers International Research Page 15
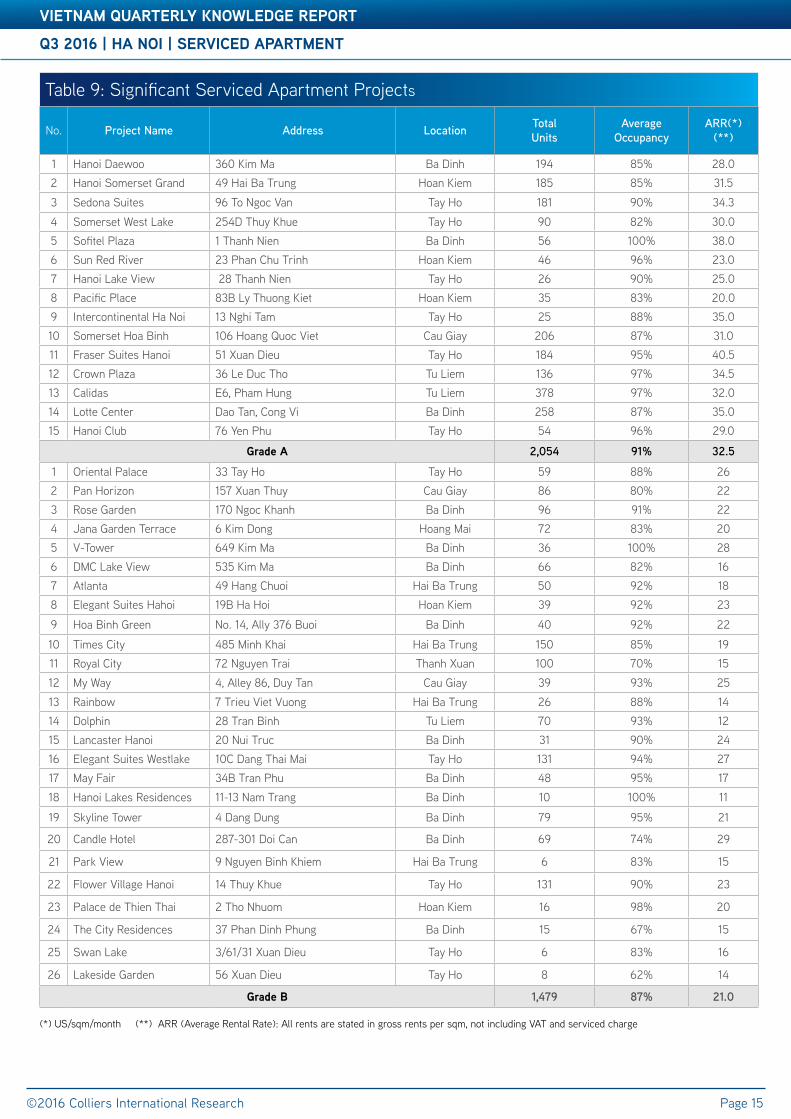
Table 3: Significant Office ProjectsTable 9: Significant Serviced Apartment Projects
No. Project Name Address Location Total Units
Average Occupancy
ARR(*) (**)
1 Hanoi Daewoo 360 Kim Ma Ba Dinh 194 85% 28.02 Hanoi Somerset Grand 49 Hai Ba Trung Hoan Kiem 185 85% 31.5
3 Sedona Suites 96 To Ngoc Van Tay Ho 181 90% 34.3
4 Somerset West Lake 254D Thuy Khue Tay Ho 90 82% 30.05 Sofitel Plaza 1 Thanh Nien Ba Dinh 56 100% 38.06 Sun Red River 23 Phan Chu Trinh Hoan Kiem 46 96% 23.07 Hanoi Lake View 28 Thanh Nien Tay Ho 26 90% 25.08 Pacific Place 83B Ly Thuong Kiet Hoan Kiem 35 83% 20.09 Intercontinental Ha Noi 13 Nghi Tam Tay Ho 25 88% 35.010 Somerset Hoa Binh 106 Hoang Quoc Viet Cau Giay 206 87% 31.011 Fraser Suites Hanoi 51 Xuan Dieu Tay Ho 184 95% 40.512 Crown Plaza 36 Le Duc Tho Tu Liem 136 97% 34.513 Calidas E6, Pham Hung Tu Liem 378 97% 32.014 Lotte Center Dao Tan, Cong Vi Ba Dinh 258 87% 35.015 Hanoi Club 76 Yen Phu Tay Ho 54 96% 29.0
Grade A 2,054 91% 32.5
1 Oriental Palace 33 Tay Ho Tay Ho 59 88% 262 Pan Horizon 157 Xuan Thuy Cau Giay 86 80% 223 Rose Garden 170 Ngoc Khanh Ba Dinh 96 91% 224 Jana Garden Terrace 6 Kim Dong Hoang Mai 72 83% 205 V-Tower 649 Kim Ma Ba Dinh 36 100% 286 DMC Lake View 535 Kim Ma Ba Dinh 66 82% 167 Atlanta 49 Hang Chuoi Hai Ba Trung 50 92% 188 Elegant Suites Hahoi 19B Ha Hoi Hoan Kiem 39 92% 23
9 Hoa Binh Green No. 14, Ally 376 Buoi Ba Dinh 40 92% 22
10 Times City 485 Minh Khai Hai Ba Trung 150 85% 1911 Royal City 72 Nguyen Trai Thanh Xuan 100 70% 15
12 My Way 4, Alley 86, Duy Tan Cau Giay 39 93% 25
13 Rainbow 7 Trieu Viet Vuong Hai Ba Trung 26 88% 1414 Dolphin 28 Tran Binh Tu Liem 70 93% 1215 Lancaster Hanoi 20 Nui Truc Ba Dinh 31 90% 2416 Elegant Suites Westlake 10C Dang Thai Mai Tay Ho 131 94% 2717 May Fair 34B Tran Phu Ba Dinh 48 95% 17
18 Hanoi Lakes Residences 11-13 Nam Trang Ba Dinh 10 100% 11
19 Skyline Tower 4 Dang Dung Ba Dinh 79 95% 21
20 Candle Hotel 287-301 Doi Can Ba Dinh 69 74% 29
21 Park View 9 Nguyen Binh Khiem Hai Ba Trung 6 83% 15
22 Flower Village Hanoi 14 Thuy Khue Tay Ho 131 90% 23
23 Palace de Thien Thai 2 Tho Nhuom Hoan Kiem 16 98% 20
24 The City Residences 37 Phan Dinh Phung Ba Dinh 15 67% 15
25 Swan Lake 3/61/31 Xuan Dieu Tay Ho 6 83% 16
26 Lakeside Garden 56 Xuan Dieu Tay Ho 8 62% 14
Grade b 1,479 87% 21.0
(*) US/sqm/month (**) ARR (Average Rental Rate): All rents are stated in gross rents per sqm, not including VAT and serviced charge

q3 2016 | HA NOI | INDustrIAl
VIetNAM quArterly KNOWleDGe repOrt
©2016 Colliers International Research Page 16
perfOrMANCeDue to the conversion of Dai Tu IP, the average gross asking rent nominally dropped 0.3% to USD82.8/sqm/term and the remaining Land Use Right was 34.9 years. Noi Bai IP had the highest asking rent of USD5/sqm/year. Ready- built factories offered rents ranged from USD1.5 – USD2.5/sqm/month while their management fees were at USD0.43/sqm/month on average.
The average occupancy rate increased by 0.4ppts, reaching 61.9%. Noi Bai, Phu Nghia, Sai Dong B, Thach That and Thang Long have been leased out.
supplyIn April 2016, the Government accepted a proposal to convert Dai Tu IP into an urban residential area. This was due to its low occupancy rate of 30%-35% and inefficient operation which negatively affected the surrounding environment. Hence, the total existing supply went down by 1% q-o-q, with 10 IPs and 3,800ha of total land area.
DeMANDIn recent years, due to rising operation cost in China, foreign manufacturers have chosen Vietnam as their alternative production bases. The country’s northern centres- notably Hanoi, Haiphong and Bac Ninh province – have been attractive location on the back of their close proximity to China, lower labour costs than in the south and a variety of tax incentives. A surge in for-eign-invested manufacturing activities in the region has fuelled strong demand for industrial properties.
OutlOOKThe supply pipeline by 2020 is expected to have 10 new IPs with a total land area of 2,650ha. Under the socioeconomic development plan by 2020 with visions until 2050, Hanoi will be home of 33 industrial and hi tech parks. As the fast growth of industrial parks has outpaced infrastructural development, it is suggested that the government should have a comprehensive planning to establish efficient logistics network.
VIetNAM quArterly KNOWleDGe repOrt
Figure 17: Industrial, Market Performance by District
Source: Colliers International Research
Figure 18: Industrial, Supply by District
Source: Colliers International Research
Table 10: Industrial, Future Supply
Source: Colliers International Research
Industrial park Name District GfA (ha)
Quang Minh II Industrial park Me Linh 266
Phuc Tho Industrial park Phuc Tho 74
Phu Xuyen Industrial park Phu Xuyen 488
Thanh My - Xuan Son Industrial park Son Tay 108
Soc Son Industrial park Soc Son 340
Soc Son II Industrial park Soc Son 204
Soc Son III Industrial park Soc Son 180
Soc Son IV Industrial park Soc Son 216
Thanh Oai II Industrial park Thanh Oai 480
Habeco Industrial park Thuong Tin 300
Ha Noi Hi-BioTech Park Tu Liem 200
0%
10%
20%
30%
40%
50%
60%
70%
80%
0
20
40
60
80
100
120
140
160
180
Tu Liem Soc Son ChuongMy
Me Linh Long Bien ThachThat
Dong Anh PhuXuyen
US
D/s
qm/t
erm
Average asking rent Vacancy rate
Chuong My18%
Thach That18%
Dong Anh18%
Others46%

q3 2016 | HA NOI | INDustrIAl q3 2016 | HA NOI | INDustrIAl
VIetNAM quArterly KNOWleDGe repOrt
©2016 Colliers International Research Page 17
Table 3: Significant Office ProjectsTable 11: Hanoi Industrial Market Overview
No. Name of Industrial Park Location Distance to CBD (km)
Total Area(ha)
Asking Rent (US$/sqm) Occupancy LUR Term
1 Nam Thang Long Tu Liem 15 261 155 100% 20482 Noi Bai Soc Son 31 116 135 99% 20443 Phu Nghia 1 Chuong My 24 170 95 100% 20584 Phu Nghia 2 Chuong My 24 238 95 65% 20585 Quang Minh Me Linh 24 344 130 95% 20536 Sai Dong B (Phase I&II) Long Bien 11 97 95 100% 20467 Thach That Thach That 24 150 100 100% 20568 Thang Long Dong anh 16 302 95 100% 20479 Hanssip (phase 1) Phu Xuyen 44 72 120 25% 206010 Hoa Lac Hi-Tech Thach That 39 549 50 20% 204811 Dong Anh Dong Anh 19 470 100 95% 2057
total 2,770 99.5 77.7%
COLLIERS INTERNATIONAL | VIETNAM
HO CHI MINH CIty18HBT Building, 4th floor16-18 Hai Ba Trung Street,Ben Nghe Ward, District 1HCMC, VietnamTel: + 84 8 3827 5665
HANOIRoom A52, 5th Floor68 Nguyen Du Street, Hai Ba Trung District, Hanoi, VietnamTel: +84 4 3942 2769
502 offices in67 countries on6 continents
Accelerating success
DAVID JACKSONGeneral Director
+84 8 3827 5665
About Colliers InternationalColliers International is a leader in global real estate services, defined by our spirit of enterprise.
Through a culture of service excellence and a shared sense of initiative, we integrate the resources of real estate specialists worldwide to accelerate the success of our partners.We connect through a shared set of values that shape a collaborative environment throughout our organization that is unsurpassed in the industry.
With more than 100 professionals in 2 offices in Vietnam, the team is market driven and has proven and successful track record with both international and local experience.
From Hanoi to Ho Chi Minh City, we provide a full range of real estate services
The foundation of our services is the strength and depth of our experience.
publication Coverage frequency Content Availability
Knowledge Report/Market Insights
Vietnam Cities Quarterly All market sectors Publicly available
Investment report Vietnam Quarterly Economic updates and Investment highlights
Publicly available
CBD Report HCMC CBD Monthly Office, Retail, Hotel and Serviced Apartment
Publicly available
Residential launch update
HCMC Monthly Residential Publicly available
Asia Pacific Office Report
Asia Pacificincluding Vietnam
Quarterly Office market Publicly available
Vietnam Property Market Report
Vietnam cities Quarterly All market sectors On subscription
Development Recommendation
Vietnam cities At request All market sectors On subscription
$2.30billion in annual revenue
158million square meter under management
16,300professionalsand staff
This document has been prepared by Colliers International for advertising and general information only. Colliers International makes no guarantees, representations or warranties of any kind, expressed or implied, regarding the information including, but not limited to, warranties of content, accuracy and reliability. Any interested party should undertake their own inquiries as to the accuracy of the information. Colliers International excludes unequivocally all inferred or implied terms, conditions and warranties arising out of this document and excludes all liability for loss and damages arising there from. This publication is the copyrighted property of Colliers International and/or its licensor(s). ©2016. All rights reserved.
For further information, please contact us:
VIetNAM | reseArCH & fOreCAst repOrt
©2016 Colliers International Research www.colliers.com/vietnam
HA VOResearch Manager
+84 8 3827 5665