Embed Size (px)
Citation preview

/4 [email protected] relaxation path sampling (DRPS) 1
Rate constants: from Sinai billiards to protein folding
Wales group Department of Chemistry University of Cambridge
Boris Fačkovec
Alumni festival 26th September 2014

/4 [email protected] relaxation path sampling (DRPS)
• large separation of smallest and largest time scales
2
molecular vibration (~1 fs)
folding (~1 ms)
Rare events
AB
J
I
H
G
E
F
CD
A C
B D
J H E
I G F
kAB / exp(��E)

/4 [email protected] relaxation path sampling (DRPS) 3
Transition state theory
position
pote
ntia
l
prob
abilit
y de
nsity
position
relaxation
kTSTAB =
eq.flux
eq.population
• cell-to-cell rate constant in DRPS is based on relaxation:
/4 [email protected] relaxation path sampling (DRPS) 4
peptide dynamicspolymer reversal polymer translocation
where the unnecessary constant terms are ignored. kB is theBoltzmann constant and T is the absolute temperature. !1!and !2! are the values of !! in regions I and II, respectively.Fm exhibits a free energy barrier as a function of m. Thenature of the free energy barrier depends on "i# conforma-tional statistics on both regions, and "ii# value of the chemi-cal potential mismatch $% relative to the entropic part &firsttwo terms on the right-hand side of Eq. "2#'. The results areillustrated in Figs. 2 and 3. When $%!0, the barrier is sym-metric in f!m/N if the size exponent is the same in bothregions. For (1)(2 , the barrier becomes asymmetric. Thefree energy minima are downhill from I to II if the chain ismore compact in II than in I. This is illustrated in Fig. 2 bytaking !1!!0.9, !2!!0.5, and N$%/kBT!"3.0. On theother hand, the free energy minima are uphill if the chain ismore compact in I. This is illustrated in Fig. 2 by taking!1!!0.5, !2!!0.9, and N$%/kBT!3.0. By keeping the samevalue of ( in both regions, the free energy barrier can bemade asymmetric if $%)0, as illustrated in Fig. 3 with !1!!0.69!!2! .
Following the usual arguments of the nucleationtheory,13 the transport of the chain through the barrier isdescribed by
*
*t Wm" t #!km"1Wm"1" t #"km!Wm" t #"kmWm" t #
#km#1! Wm#1" t #, "3#
where Wm is the probability of finding a nucleus of m seg-ments in region II. km is the rate constant for the formationof a nucleus with m#1 segments from a nucleus with msegments. km! is the rate constant for the decay of a nucleuswith m segments into a nucleus of m"1 segments. Using thedetailed balance to express km#1! in terms of km and adoptingm to be a continuous variable, we get
*
*t Wm" t #!!"*
*m D "1 #"m ##*2
$*m2 km"Wm" t #, "4#
where
D "1 #"m #!"km*
*mFm
kBT#
*
*m km . "5#
As mentioned above, we assume that the rate constant km isindependent of m "because we deal here with only ho-mopolymers#, and is dictated by the ratchet potential arisingfrom the details of the pore. Under this condition, valid forthe experimental problem addressed in this paper, km is takento be a nonuniversal constant k0 independent of N. ThereforeWm is given by
*
*t Wm" t #!*
*m ! k0kBT *Fm
*m Wm" t ##k0*
*m Wm" t #" , "6#
It follows14 from Eq. "6# that the mean first passage time +for the process described by Eq. "6#, i.e., the average timerequired by the chain, having already placed at least onesegment in region II, to go from region I to region II is
+!1k0#0
Ndm1 exp$ Fm1
kBT% #
0
m1dm2 exp$ "
Fm2
kBT% . "7#
The limits 0 and N are actually 1 and N"1, respectively, andN in the following formulas should be replaced by (N"2) ifone is interested in small values of N. Substituting Eq. "2# inEq. "7#, the general results are given in Fig. 4, where + "in
FIG. 1. Polymer escape in transition.
FIG. 2. Plot of Fm in units of kBT against f. Curves represent: solid line,N$%/kBT!0, !1!!0.5!!2! ; long-dashed line, N$%/kBT!"3, !1!!0.9,!2!!0.5; dashed line, N$%/kBT!"3, !1!!0.5, !2!!0.9.
FIG. 3. Plot of Fm in units of kBT against f for !1!!0.69!!2! . Curvesrepresent: solid line, N$%/kBT!0; long-dashed line, N$%/kBT!"1;dashed line, N$%/kBT!"1.
10372 J. Chem. Phys., Vol. 111, No. 22, 8 December 1999 M. Muthukumar
This article is copyrighted as indicated in the article. Reuse of AIP content is subject to the terms at: http://scitation.aip.org/termsconditions. Downloaded to IP:131.111.184.86 On: Thu, 19 Jun 2014 00:33:12
0 10 20 30 40 50
0
10
20
30
Stationary PointPote
ntial
Ene
rgy D
iffere
nce
(kca
l/mol)
A
Misfolded
Unfolded
Native
0 10 20 30 40 50
0
10
20
30
Stationary PointPote
ntial
Ene
rgy D
iffere
nce
(kca
l/mol)
B
Native
Unfolded
biomolecular folding
010
2030
4050
0102030
Stat
ionar
y Poin
t
Potential Energy Difference (kcal/mol)
A
Misf
olde
d
Unfo
lded
Nativ
e
010
2030
4050
0102030
Stat
ionar
y Poin
t
Potential Energy Difference (kcal/mol)
B
Nativ
e
Unfo
lded
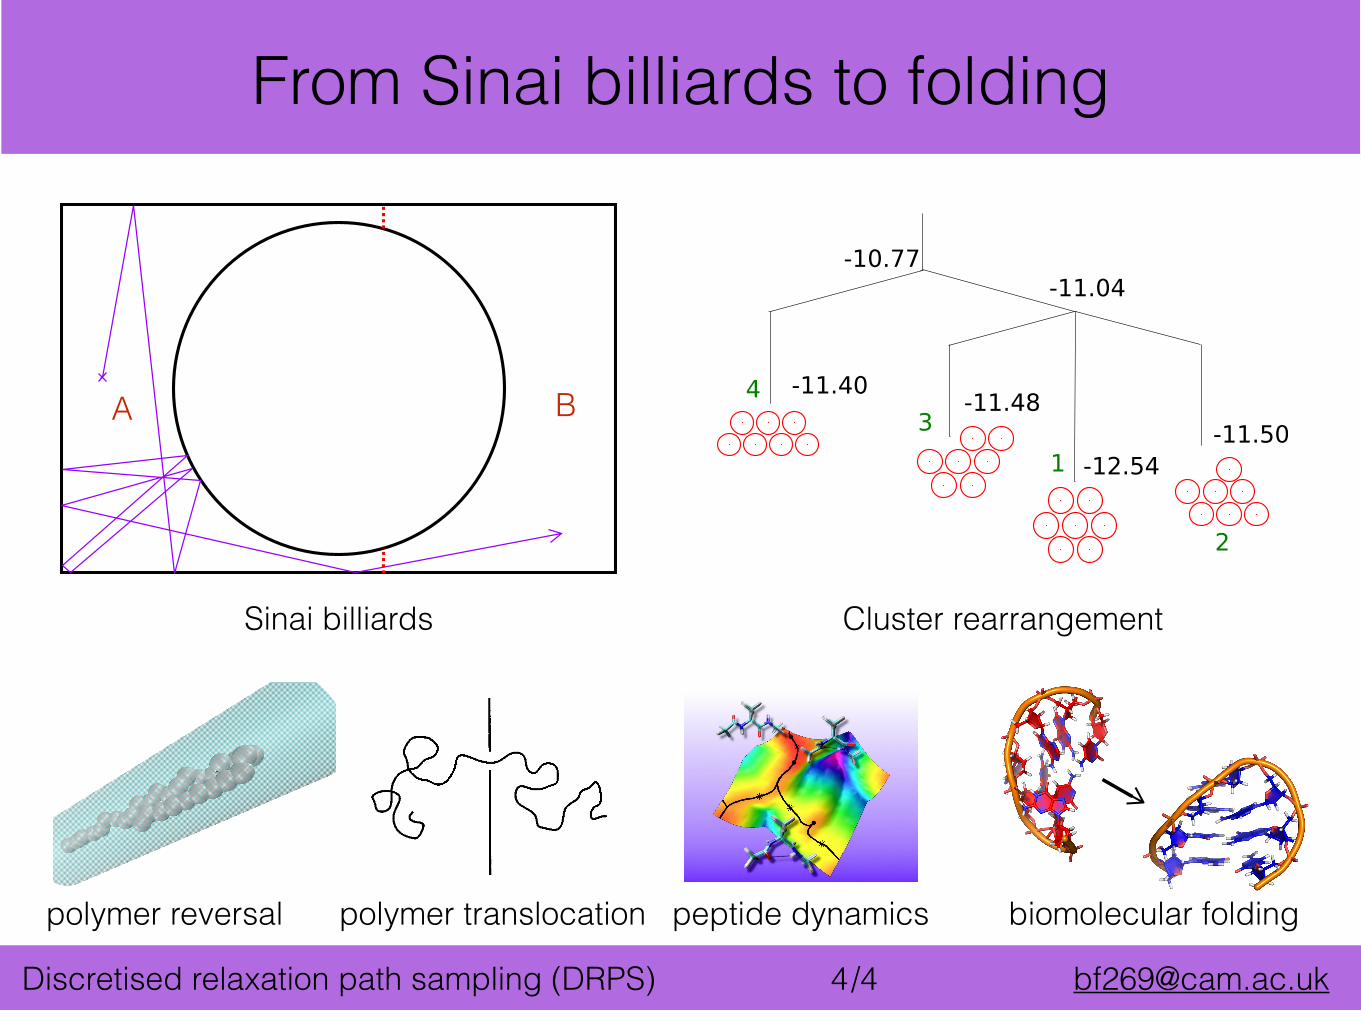
A B
Sinai billiards
-11.40 -11.48
-12.54-11.50
-11.04
43
2
1
-10.77
Cluster rearrangement
From Sinai billiards to folding

QUESTIONS?