Embed Size (px)
Citation preview
Informi GIS Handout
Following Presentation at Esri UC 2014
Informi GIS A/S Author: Jens Dalsgaard July 4th 2014 www.informi.dk http://www.linkedin.com/in/jensdalsgaard
Visualizing Knowledge
Optimizing Electric Utility
Grid Operations
through GIS and Powergrid
-
Integrating Asset Management
&
Extracting to CIM
Summary:
Previously siloed systems are broken down and data is increasingly shared across lines of business. For an electric utility operator the most fundamental data is the network model. With the right network model, grid documentation can be shared between applications, thus ensuring consolidated data usage.
GIS is the logical center for electric utilities. Implementing the PowerGrid data model en-
sures that grid documentation can be shared across platforms like DMS and asset man-
agement. Besides this, in GIS itself offers great support for in-field crew and central dis-
patching teams.
Keywords:
Electric Utility; Transmission System Operator; Distribution; Grid Optimization; ArcGIS; Geographic Information System; GIS; Asset Management; Field Crew; Dispatching; DMS; CIM extract; PSS(R)E; PSS(R)ODMS; PowerGrid; Data Model; IBM; Maximo; Fingrid; Informi GIS
Optimizing Electric Utility Grid Operations Using GIS
Informi GIS July 4th
2014 Page 2 / 12 Jaegerborg Allé 4 DK - 2920 Charlottenlund Phone: +45 3996 5900
Introduction Typically, Electric utility companies have acquired or developed a large number of extremely specialized
software solutions to support specific challenges met in the business over the years. But often such systems
are custom developed and are referred to as point-solutions – they may each be useful in a specific context,
but there’s a lack of consistency and coherence in between the many systems. Each part-solution requires
specific data to operate so users must obtain separate skills for each application. Thus, upholding opera-
tions and services for the many diverse applications can take its toll on the IT-department.
As the electric utility companies continue into the digital age, former previously siloed systems are broken
down and data is increasingly shared across lines of business. For a grid operator the most fundamental
data is the network model. The advanced PowerGrid data model from Informi GIS allows focus on a single
network model shared between applications which support business needs in a much broader perspective.
Various Complex Tasks in Electric Utility Operations Today an electric utility must be able to support a large number of complex tasks – a few examples are:
Optimizing grid operation during highly fluctuating production and consumption
Optimizing asset life cycle cost and operability
Extracting asset data for benchmarking, valuations etc.
Supporting the various planning phases
Protecting buried assets from excavation damage
Calculating overhead line sag
Calculating induced voltage on nearby underground pipelines
Pinpointing fault location, based on distance relay output
Planning outages and switching operations
Supporting field crew operation
Keeping track of field crew position
Ensuring management, overview of grid operation, planned service …
…
It is fairly obvious that IT-solutions are needed – but which and how?
This paper aims at briefly describing an approach and a solution that ensures consolidated grid documenta-
tion using the ArcGIS solution from Esri. A solution built on 20+ years of experience in delivering solutions
to electric distribution and transmission utilities; a solution that proves useful in all of the above mentioned
tasks and many more.
Optimizing Electric Utility Grid Operations Using GIS
Informi GIS July 4th
2014 Page 3 / 12 Jaegerborg Allé 4 DK - 2920 Charlottenlund Phone: +45 3996 5900
The Fingrid ‘ELVIS’ Project In 2010 the Finnish Electricity Transmission System Operator (TSO), Fingrid, initiated 'ELVIS'1 - a replace-
ment of their entire grid planning, asset and work management IT system landscape. In order to maintain
its position among the most reliable and lean TSO’s, Fingrid needed a robust, flexible and fully integrated
grid, asset and work management system – data should be entered once and distributed as needed.
The winning solution had ArcGIS as a cornerstone component. The ELVIS project was a rare opportunity to
build a fully coherent solution, combining best in class products, industry standards and stringent architec-
tural principles. As intended, it serves as a “point-of-reference” system for any modern network utility.
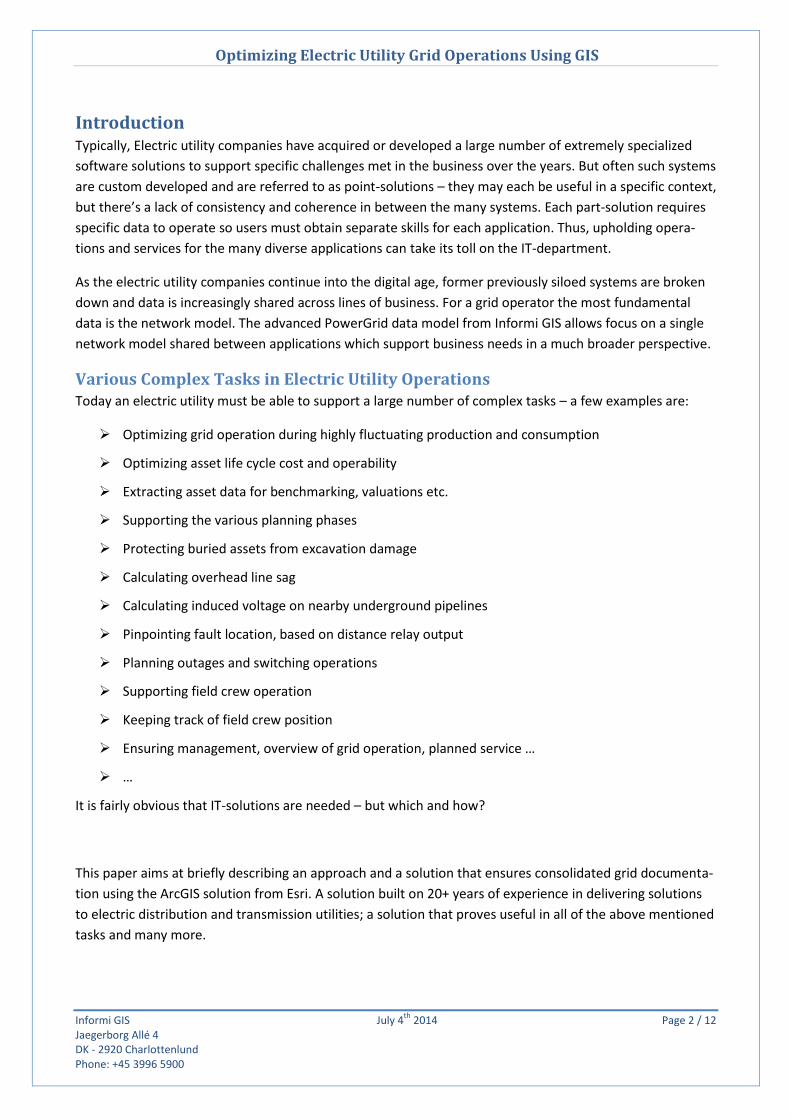
The ELVIS solution delivers a consolidated grid design, asset and work management solution. Centered on the electrical grid model the solution supports key planning areas such as project management as well as grid and asset modelling though out the asset lifecycle.
In this project the Powergrid data model from Informi GIS is essential.
Besides providing a data foundation for DMS and asset management systems, the GIS solution in itself sup-
ports a large number of business processes related to data maintenance, grid planning, field crew support
etc.
The presentation by Informi GIS, IBM and Fingrid at Esri UC 2014 gave a glimpse into this solution - we’ll
readily elaborate on this upon request.
1 http://www.fingrid.fi/en/company/elvis/Pages/default.aspx
Optimizing Electric Utility Grid Operations Using GIS
Informi GIS July 4th
2014 Page 4 / 12 Jaegerborg Allé 4 DK - 2920 Charlottenlund Phone: +45 3996 5900
Smart Grid – Definition and Ways of Optimizing Grid Operation You have probably all seen several definitions on Smart Grid – but let us here add another definition here:
“Automating an optimized grid operation
despite significantly fluctuating production and consumption
– to largest possible extent even during faults.”
Power production depends more and more on how the wind blows and how the sun shines. Consumers are
expected to act more on market fluctuation – when energy is cheap, more will be used.
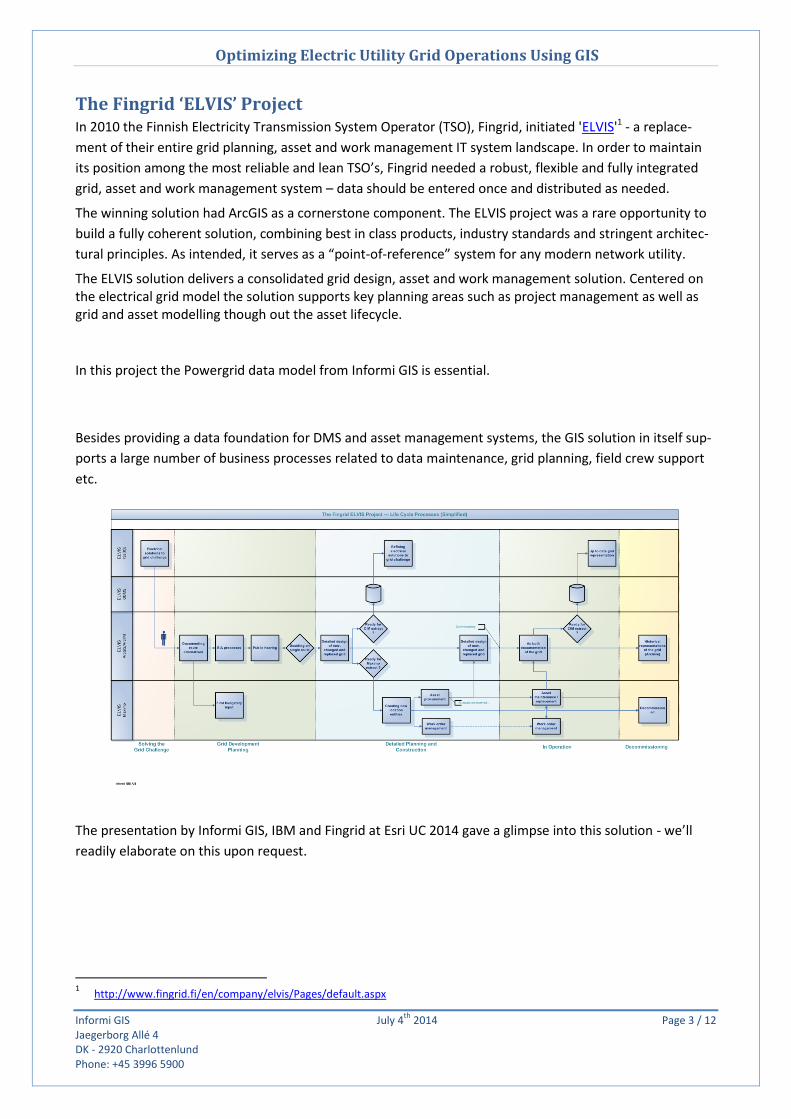
Metering and forecasting consumption is part of the picture, and many vendors offer solutions for this:
However, metering alone leaves out a crucial part of the equation: The grid itself.
In order to optimize grid operation (minimizing losses, avoiding overloading/damaging equipment etc.) we
must know
how the grid is connected
what types of cables/overhead lines transport the energy
where the customers (loads) are connected in the grid
…
In the following pages we’ll take a look at how GIS lets you document such data – in doing so we’ll be look-
ing at an example from one of our electric utility distribution customers.
Figure 1: Metering voltages and power flow in substations and at customers offers useful input when optimizing grid operation
Optimizing Electric Utility Grid Operations Using GIS
Informi GIS July 4th
2014 Page 5 / 12 Jaegerborg Allé 4 DK - 2920 Charlottenlund Phone: +45 3996 5900
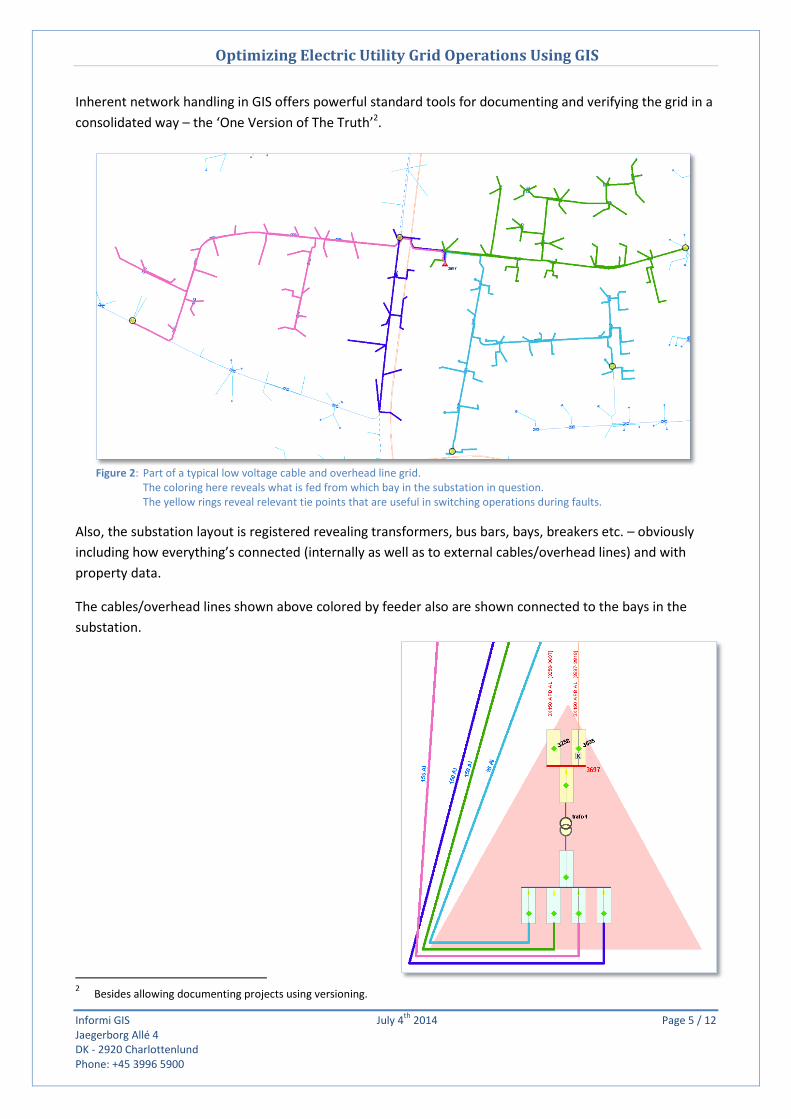
Inherent network handling in GIS offers powerful standard tools for documenting and verifying the grid in a
consolidated way – the ‘One Version of The Truth’2.
Also, the substation layout is registered revealing transformers, bus bars, bays, breakers etc. – obviously
including how everything’s connected (internally as well as to external cables/overhead lines) and with
property data.
The cables/overhead lines shown above colored by feeder also are shown connected to the bays in the
substation.
2 Besides allowing documenting projects using versioning.
Figure 2: Part of a typical low voltage cable and overhead line grid. The coloring here reveals what is fed from which bay in the substation in question. The yellow rings reveal relevant tie points that are useful in switching operations during faults.
Optimizing Electric Utility Grid Operations Using GIS
Informi GIS July 4th
2014 Page 6 / 12 Jaegerborg Allé 4 DK - 2920 Charlottenlund Phone: +45 3996 5900
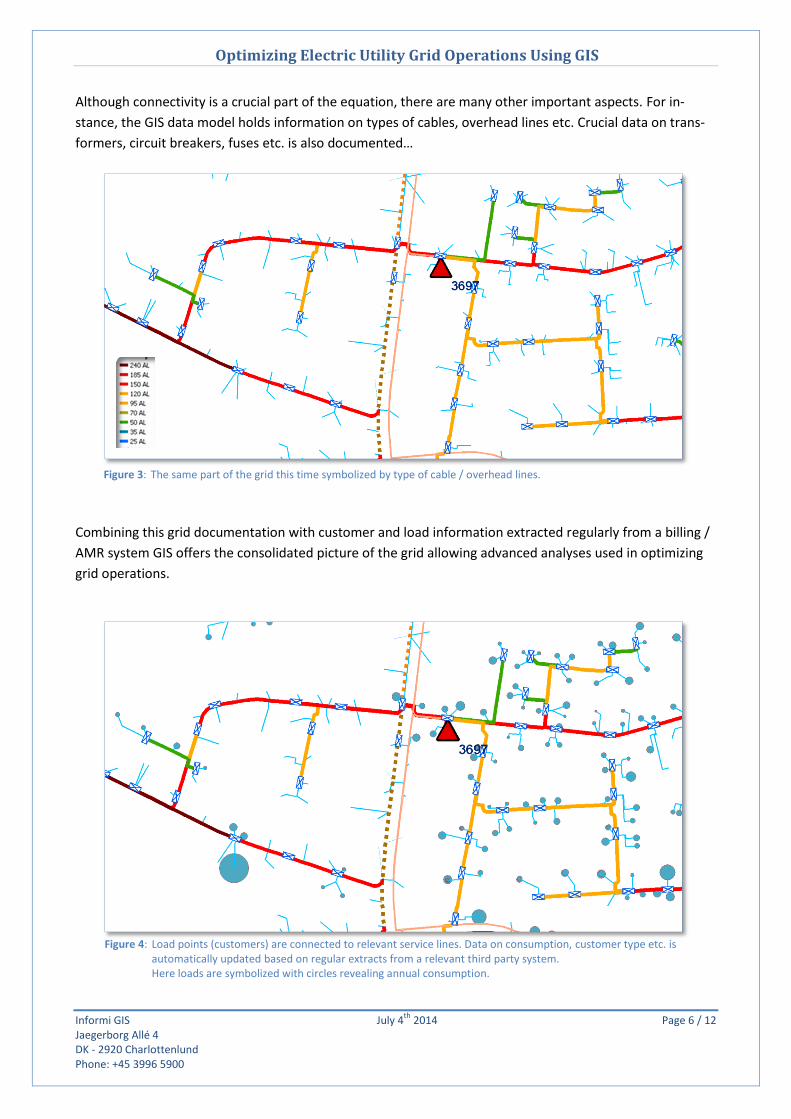
Figure 4: Load points (customers) are connected to relevant service lines. Data on consumption, customer type etc. is automatically updated based on regular extracts from a relevant third party system. Here loads are symbolized with circles revealing annual consumption.
Figure 3: The same part of the grid this time symbolized by type of cable / overhead lines.
Although connectivity is a crucial part of the equation, there are many other important aspects. For in-
stance, the GIS data model holds information on types of cables, overhead lines etc. Crucial data on trans-
formers, circuit breakers, fuses etc. is also documented…
Combining this grid documentation with customer and load information extracted regularly from a billing /
AMR system GIS offers the consolidated picture of the grid allowing advanced analyses used in optimizing
grid operations.
Optimizing Electric Utility Grid Operations Using GIS
Informi GIS July 4th
2014 Page 7 / 12 Jaegerborg Allé 4 DK - 2920 Charlottenlund Phone: +45 3996 5900
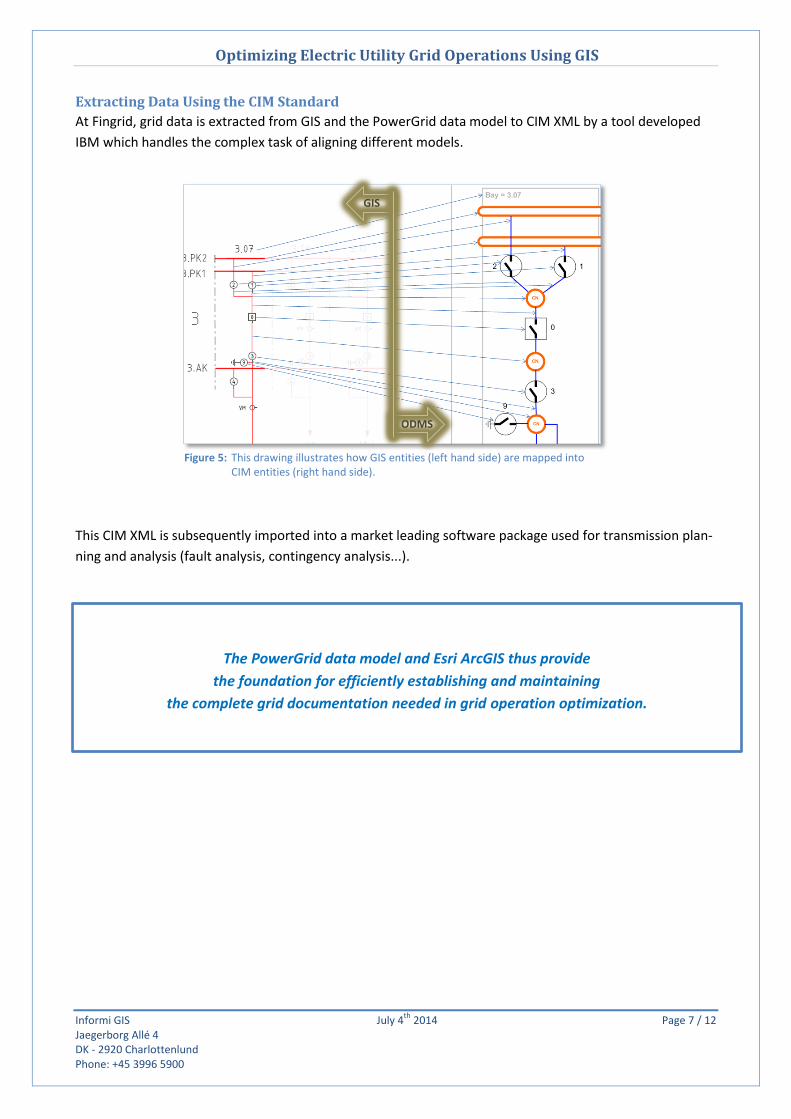
Extracting Data Using the CIM Standard
At Fingrid, grid data is extracted from GIS and the PowerGrid data model to CIM XML by a tool developed
IBM which handles the complex task of aligning different models.
This CIM XML is subsequently imported into a market leading software package used for transmission plan-
ning and analysis (fault analysis, contingency analysis...).
The PowerGrid data model and Esri ArcGIS thus provide
the foundation for efficiently establishing and maintaining
the complete grid documentation needed in grid operation optimization.
Figure 5: This drawing illustrates how GIS entities (left hand side) are mapped into CIM entities (right hand side).
ODMS
GIS
Optimizing Electric Utility Grid Operations Using GIS
Informi GIS July 4th
2014 Page 8 / 12 Jaegerborg Allé 4 DK - 2920 Charlottenlund Phone: +45 3996 5900
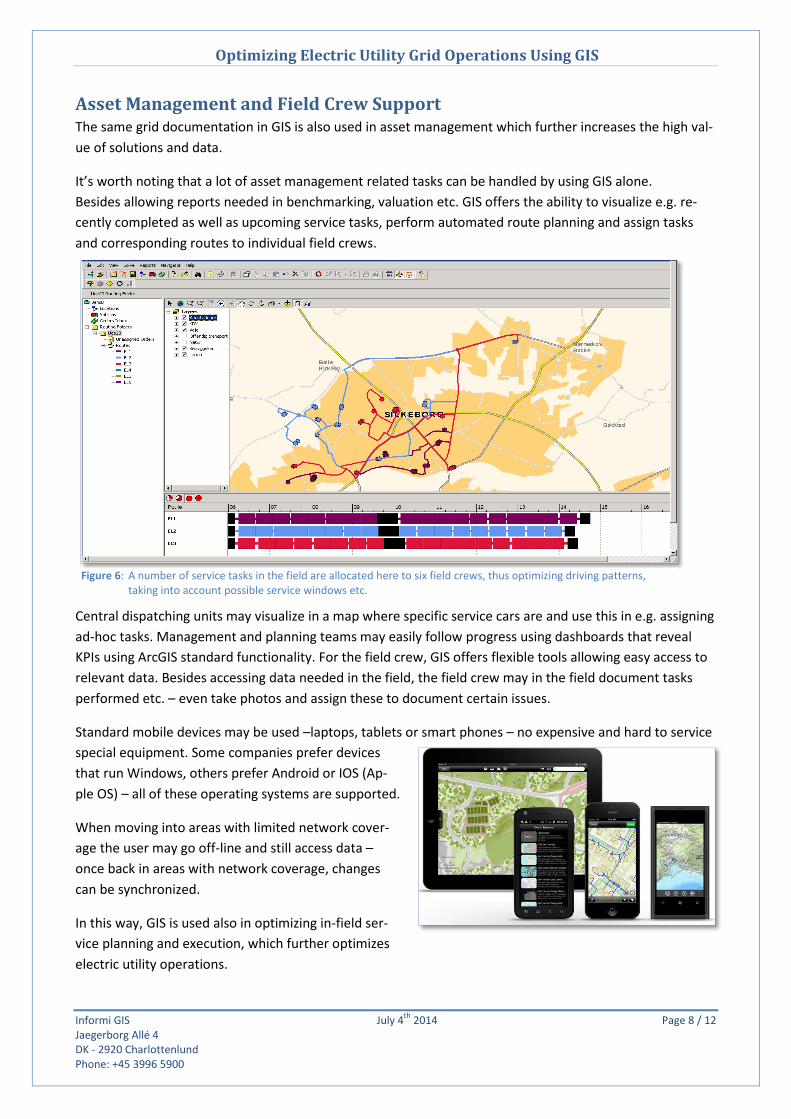
Figure 6: A number of service tasks in the field are allocated here to six field crews, thus optimizing driving patterns, taking into account possible service windows etc.
Asset Management and Field Crew Support The same grid documentation in GIS is also used in asset management which further increases the high val-
ue of solutions and data.
It’s worth noting that a lot of asset management related tasks can be handled by using GIS alone.
Besides allowing reports needed in benchmarking, valuation etc. GIS offers the ability to visualize e.g. re-
cently completed as well as upcoming service tasks, perform automated route planning and assign tasks
and corresponding routes to individual field crews.
Central dispatching units may visualize in a map where specific service cars are and use this in e.g. assigning
ad-hoc tasks. Management and planning teams may easily follow progress using dashboards that reveal
KPIs using ArcGIS standard functionality. For the field crew, GIS offers flexible tools allowing easy access to
relevant data. Besides accessing data needed in the field, the field crew may in the field document tasks
performed etc. – even take photos and assign these to document certain issues.
Standard mobile devices may be used –laptops, tablets or smart phones – no expensive and hard to service
special equipment. Some companies prefer devices
that run Windows, others prefer Android or IOS (Ap-
ple OS) – all of these operating systems are supported.
When moving into areas with limited network cover-
age the user may go off-line and still access data –
once back in areas with network coverage, changes
can be synchronized.
In this way, GIS is used also in optimizing in-field ser-
vice planning and execution, which further optimizes
electric utility operations.
Optimizing Electric Utility Grid Operations Using GIS
Informi GIS July 4th
2014 Page 9 / 12 Jaegerborg Allé 4 DK - 2920 Charlottenlund Phone: +45 3996 5900
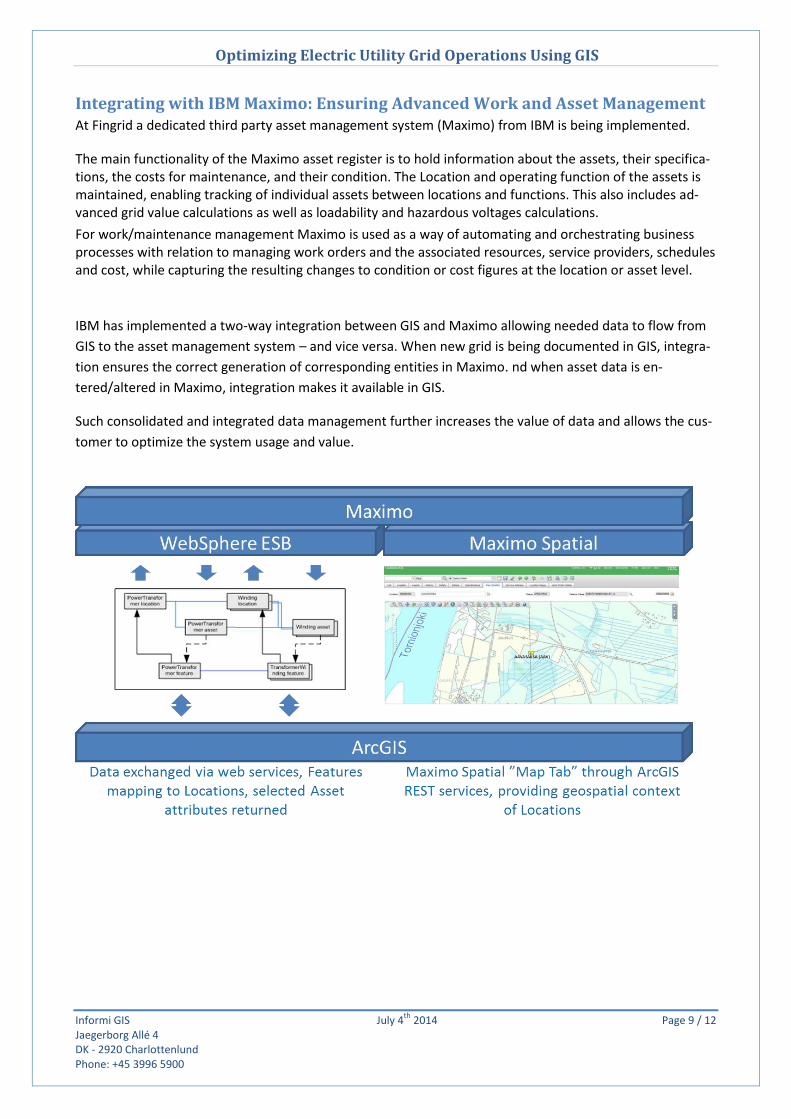
Integrating with IBM Maximo: Ensuring Advanced Work and Asset Management At Fingrid a dedicated third party asset management system (Maximo) from IBM is being implemented.
The main functionality of the Maximo asset register is to hold information about the assets, their specifica-tions, the costs for maintenance, and their condition. The Location and operating function of the assets is maintained, enabling tracking of individual assets between locations and functions. This also includes ad-vanced grid value calculations as well as loadability and hazardous voltages calculations.
For work/maintenance management Maximo is used as a way of automating and orchestrating business processes with relation to managing work orders and the associated resources, service providers, schedules and cost, while capturing the resulting changes to condition or cost figures at the location or asset level.
IBM has implemented a two-way integration between GIS and Maximo allowing needed data to flow from
GIS to the asset management system – and vice versa. When new grid is being documented in GIS, integra-
tion ensures the correct generation of corresponding entities in Maximo. nd when asset data is en-
tered/altered in Maximo, integration makes it available in GIS.
Such consolidated and integrated data management further increases the value of data and allows the cus-
tomer to optimize the system usage and value.
Optimizing Electric Utility Grid Operations Using GIS
Informi GIS July 4th
2014 Page 10 / 12 Jaegerborg Allé 4 DK - 2920 Charlottenlund Phone: +45 3996 5900
Establishing Requested Data Quality Whenever requirements regarding data quality are high, separate attention should be put towards ensur-
ing data completeness. Initial migration from previous source systems allows good starting point but most
likely won’t get you all the way. Besides this, users may make mistakes when editing data.
ArcGIS holds efficient tools for analyzing and verifying that the data quality requirements are met. Where
requirements are not met, the user is guided to data needing further processing.
ArcGIS offers useful functionality to experts throughout the organization that work with the grid – be it the
central planning team, the field crews doing maintenance, the dispatching teams, the outage management
teams or management. And it’s a well-known fact that nothing works better in establishing and maintaining
a high data quality than offering useful functionality to the experts throughout the organization that actual-
ly work with the grid.
The ability to easily access GIS data through fully fledged desktop applications or through standard web
browsers and using standard mobile eases deployment, ensures return of investment and helps ensure da-
ta quality that makes the difference between actually being able to optimize grid operations or simply
dreaming of it.
The PowerGrid Data Model The Powergrid solution is based on market leading standard software systems from Esri. Over the years
Informi GIS has not only gained a high level of expertise in the immense functionality palette of ArcGIS but
has also formed a close relationship with Esri, allowing us to be at the forefront for new and upcoming
functionality.
The Powergrid data model, developed by Informi GIS, is based on
20+ years of experience in the electric utility industry using GIS. The
data model is to a large extent inspired by the CIM standard.
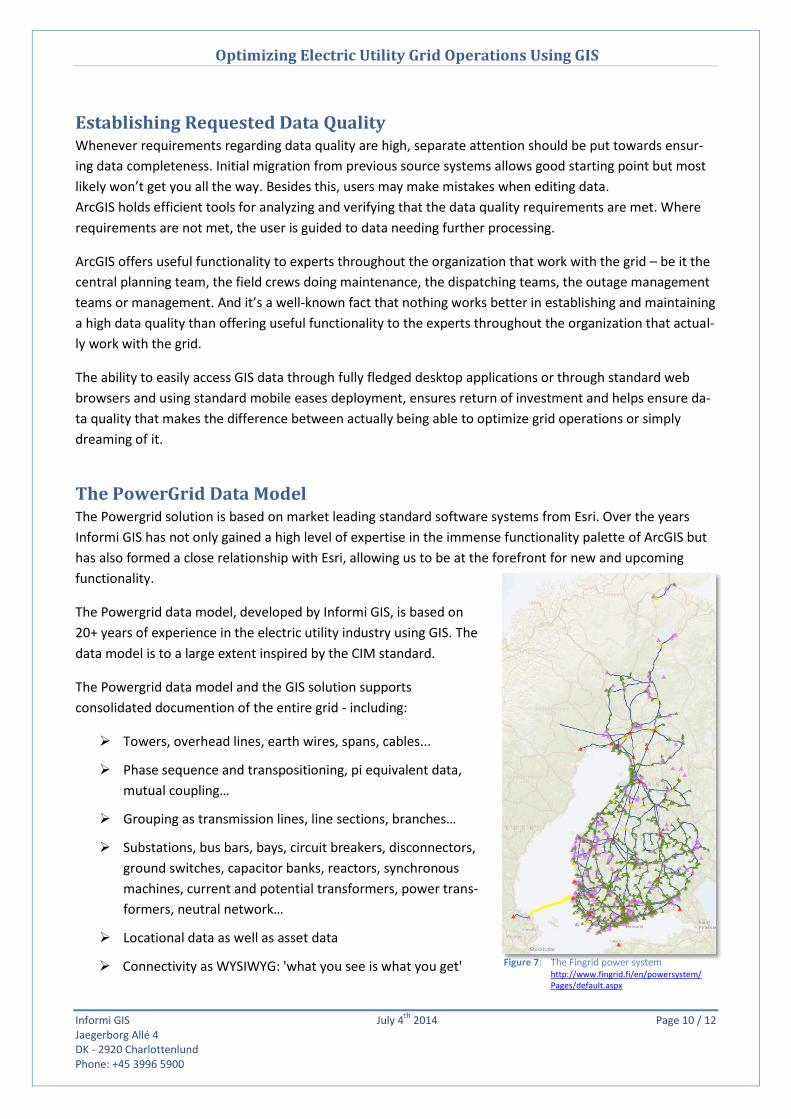
The Powergrid data model and the GIS solution supports
consolidated documention of the entire grid - including:
Towers, overhead lines, earth wires, spans, cables...
Phase sequence and transpositioning, pi equivalent data,
mutual coupling…
Grouping as transmission lines, line sections, branches…
Substations, bus bars, bays, circuit breakers, disconnectors,
ground switches, capacitor banks, reactors, synchronous
machines, current and potential transformers, power trans-
formers, neutral network…
Locational data as well as asset data
Connectivity as WYSIWYG: 'what you see is what you get' Figure 7: The Fingrid power system http://www.fingrid.fi/en/powersystem/ Pages/default.aspx
Optimizing Electric Utility Grid Operations Using GIS
Informi GIS July 4th
2014 Page 11 / 12 Jaegerborg Allé 4 DK - 2920 Charlottenlund Phone: +45 3996 5900
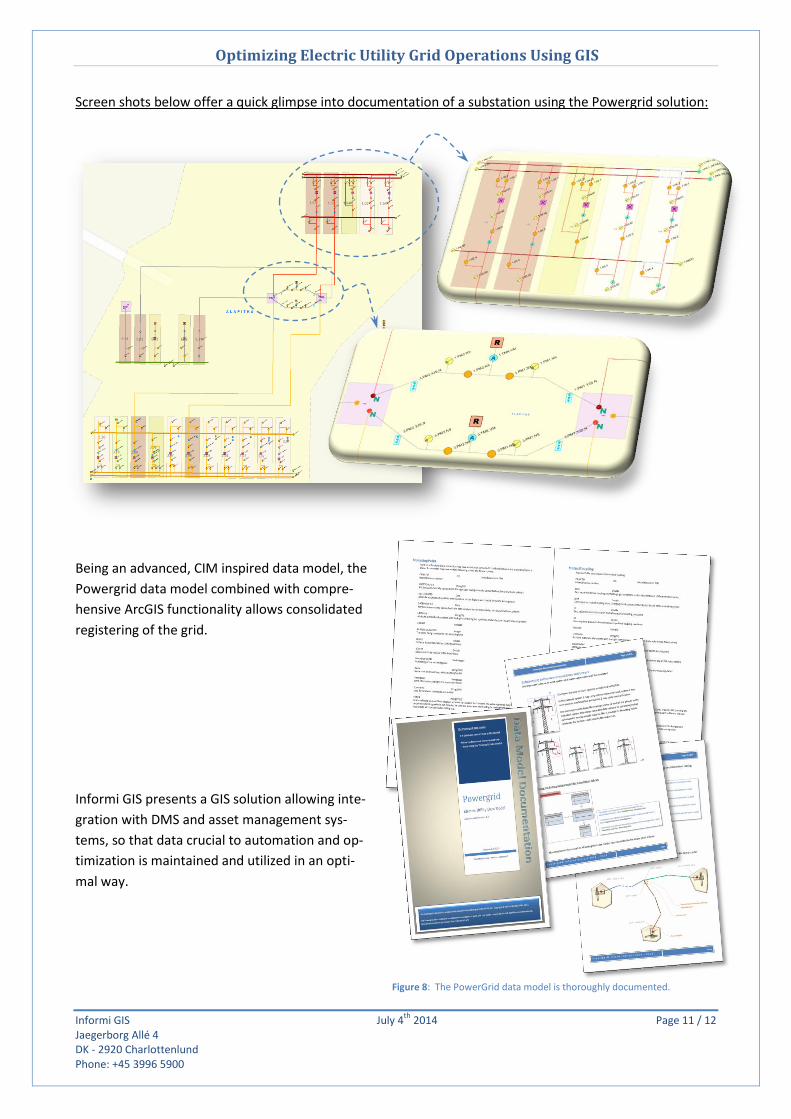
Figure 8: The PowerGrid data model is thoroughly documented.
Screen shots below offer a quick glimpse into documentation of a substation using the Powergrid solution:
Being an advanced, CIM inspired data model, the
Powergrid data model combined with compre-
hensive ArcGIS functionality allows consolidated
registering of the grid.
Informi GIS presents a GIS solution allowing inte-
gration with DMS and asset management sys-
tems, so that data crucial to automation and op-
timization is maintained and utilized in an opti-
mal way.

Optimizing Electric Utility Grid Operations Using GIS
Informi GIS July 4th
2014 Page 12 / 12 Jaegerborg Allé 4 DK - 2920 Charlottenlund Phone: +45 3996 5900
Informi GIS has 20+ Years of Experience in Electric Utility Solutions Informi GIS is based in Denmark and has more than 20 years of experience as a distributor for and as a
partner with a number of leading companies including Esri, Schneider Electric, Telcordia, ENVI and Mi-
crosoft.
Our involvement with this global network positions us in the forefront of technologic development and
trends, as well as up-to-date in new techniques in strategic counseling, project management, education,
and marketing.
Through implementation projects and subsequent partnership with a large number of distribution and
transmission companies, Informi GIS has gained valuable knowledge of crucial business processes and use
cases.
Thus, the Informi GIS solutions intuitively support a large number of processes throughout the electric utili-
ty organization.
Planning new transmission lines and substations - including parts of the EIA processes
Detailed design of new (or altered) transmission lines and / or substations
Task centered on- and off-line tools empowering field crews
Web maps, dash boards etc. used externally and / or internally
Right of Way analyses
Co-existence with third party asset management systems
Extracts in CIM format
…
Informi GIS has been a central part in a large number of projects for electric utility companies involving
leading processes regarding clarification, migration, customization, training, implementation or support.
Based on this, we hold not only the right software, functionality and data models but also skilled consult-
ants with proven experience and the ability to deliver in a complex field.
We continuously strive to maintain a positive work relationship with our customers, partners and employ-
ees.
Please feel free to contact us for further information or to speak to a representative directly.
Visit Informi GIS at: Or simply contact:
www.informi.dk Jens Dalsgaard
http://www.linkedin.com/in/jensdalsgaard Solution Strategist and Smart Grid Specialist
Cell Phone: +45 23 31 78 89