Embed Size (px)
Citation preview
ASX:WSA ASX:WSA
westernareas.com.au | ASX: WSA www.westernareas.com.au | ASX: WSA
FULL YEAR RESULTS PRESENTATION Full Year Ended 30 June 2015 August 2015
ASX:WSA ASX:WSA ASX:WSA
DISCLAIMER AND FORWARD LOOKING STATEMENTS
2
This presentation is being furnished to you solely for your information and for your use and may not be copied, reproduced or redistributed to any other person in any manner. You agree to keep the contents of this presentation and these materials confidential. The information contained in this presentation does not constitute or form any part of any offer or invitation to purchase any securities and neither the issue of the information nor anything contained herein shall form the basis of, or be relied upon in connection with, any contract or commitment on the part of any person to proceed with any transaction.
The distribution of this presentation in jurisdictions outside Australia may be restricted by law, and persons into whose possession this presentation comes should inform themselves about, and observe, any such restrictions. This is not for distribution or dissemination in the U.S.
The information contained in this presentation has been prepared by Western Areas Ltd. No representation or warranty, express or implied, is or will be made in or in relation to, and no responsibility or liability is or will be accepted by Western Areas Ltd, employees or representatives as to the accuracy or completeness of this information or any other written or oral information made available to any interested party or its advisers and any liability therefore is hereby expressly disclaimed. No party has any obligation to notify opinion changes or if it becomes aware of any inaccuracy in or omission from this presentation. All opinions and projections expressed in this presentation are given as of this date and are subject to change without notice.
This document contains forward-looking statements including nickel production targets and cost estimates. These statements are based on assumptions and contingencies that are subject to change without notice, and certain risks and uncertainties that could cause the performance or achievements of Western Areas Ltd to differ materially from the information set forth herein. Often, but not always, forward looking statements can generally be identified by the use of forward looking words such as “may”, “will”, “expect”, “intend”, “plan”, “estimate”, “anticipate”, “continue”, and “guidance”, or other similar words and may include, without limitation, statements regarding plans, strategies and objectives of management, anticipated production and expected costs. Western Areas Ltd undertakes no obligation to revise these forward-looking statements to reflect subsequent events or circumstances. Individuals should not place undue reliance on forward-looking statements and are advised to make their own independent analysis and determination with respect to the forecasted periods, which reflect Western Areas Ltd’s view only as of the date hereof.
The information within this PowerPoint presentation was compiled by Western Areas management, but the information as it relates to mineral resources and reserves was prepared by Mr. Dan Lougher and Mr. Andre Wulfse. Mr. Lougher and Mr. Wulfse are full time employees of Western Areas Ltd. Mr. Lougher and Mr. Wulfse are members of Australian Institute of Mining and Metallurgy (AusIMM) and have sufficient experience which is relevant to the style of mineralisation and type of deposit under consideration and to the activity which they are undertaking to qualify as Competent Persons as defined in the 2012 Edition of the ‘Australasian Code for Reporting of Exploration Results, Mineral Resources and Ore Reserves’(2012 JORC Code). Mr. Lougher and Mr. Wulfse consent to the inclusion in this presentation of the matters based on the information in the form and context in which it appears. The information contained in this presentation in relation to the New Morning Deposit was prepared and first disclosed under the 2004 Edition of the JORC Code. It has not been updated since to comply with the 2012 JORC Code on the basis that the information has not materially changed since it was last reported.
For the Purposes of Clause 3.4(e) in Canadian instrument 43-101, the Company warrants that Mineral Resources which are not Mineral Reserves do not have demonstrated economic viability.
ASX:WSA ASX:WSA ASX:WSA
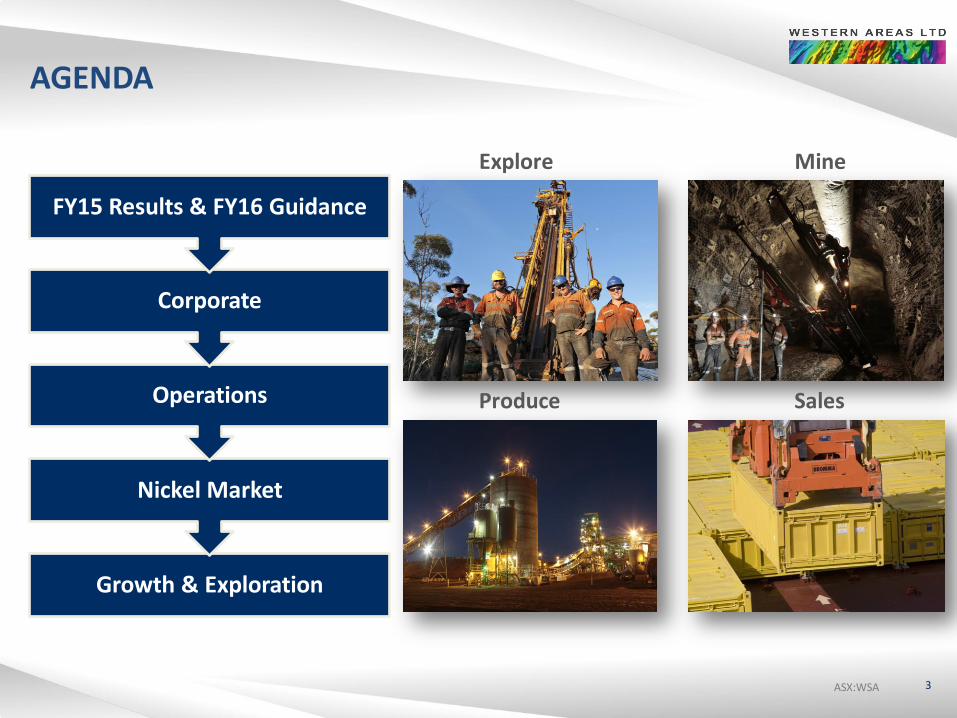
AGENDA
3
Explore Mine
Produce Sales
Growth & Exploration
Nickel Market
Operations
Corporate
FY15 Results & FY16 Guidance
ASX:WSA ASX:WSA ASX:WSA ASX:WSA
FY15 RESULTS & FY16 GUIDANCE
4
ASX:WSA ASX:WSA ASX:WSA
KEY TAKEAWAYS – FULL YEAR
5
LTIFR of 0.00 – one of the lowest in the mining industry
26,524t nickel in ore production averaging 4.9% nickel grade
Nickel contained in concentrate sold of 26,036t
A$2.31/lb (US$1.94/lb) cash cost in concentrate (upgrade guidance was A$2.40/lb to A$2.50/lb): Remains best in class in Australia Significant reduction over the prior year of A$2.50/lb
Capital, Mine Development and Exploration Expenditure incurred A$71.7m: Within the lower full year guidance range of A$70m to A$80m
Operating Cashflow of A$148.5m: 27% increase of A$31.4m versus FY14, despite A$0.33/lb decrease in the nickel price Operating cashflow (after capex) up 21%, despite an increase of A$18.5m in total capex
Reported NPAT of A$35.0m: Realised nickel price reduction leading to negative Quotational Pricing (QP) of A$27.8m before tax QP was adjusted for the July 2015 nickel price movement – impact on revenue was -A$5.1m
Net cash increased A$60.0m to A$70.4m from FY14
Fully franked final dividend of 4 cents, bringing full year to 7 cents (FY14: 5 cents)
ASX:WSA ASX:WSA ASX:WSA
FINANCIAL SNAPSHOT
6
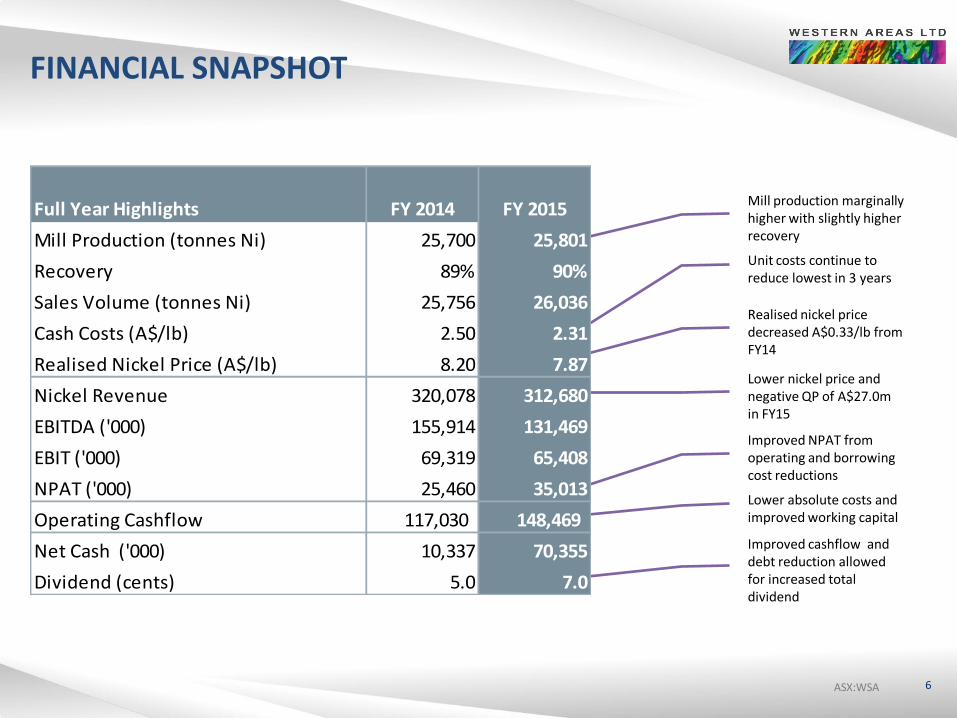
Mill production marginally higher with slightly higher recovery
Unit costs continue to reduce lowest in 3 years
Realised nickel price decreased A$0.33/lb from FY14
Lower nickel price and negative QP of A$27.0m in FY15
Lower absolute costs and improved working capital
Improved cashflow and debt reduction allowed for increased total dividend
Improved NPAT from operating and borrowing cost reductions
Full Year Highlights FY 2014 FY 2015
Mill Production (tonnes Ni) 25,700 25,801
Recovery 89% 90%
Sales Volume (tonnes Ni) 25,756 26,036
Cash Costs (A$/lb) 2.50 2.31
Realised Nickel Price (A$/lb) 8.20 7.87
Nickel Revenue 320,078 312,680
EBITDA ('000) 155,914 131,469
EBIT ('000) 69,319 65,408
NPAT ('000) 25,460 35,013
Operating Cashflow 117,030 148,469
Net Cash ('000) 10,337 70,355
Dividend (cents) 5.0 7.0
ASX:WSA ASX:WSA ASX:WSA
INCOME STATEMENT
7
Commentary
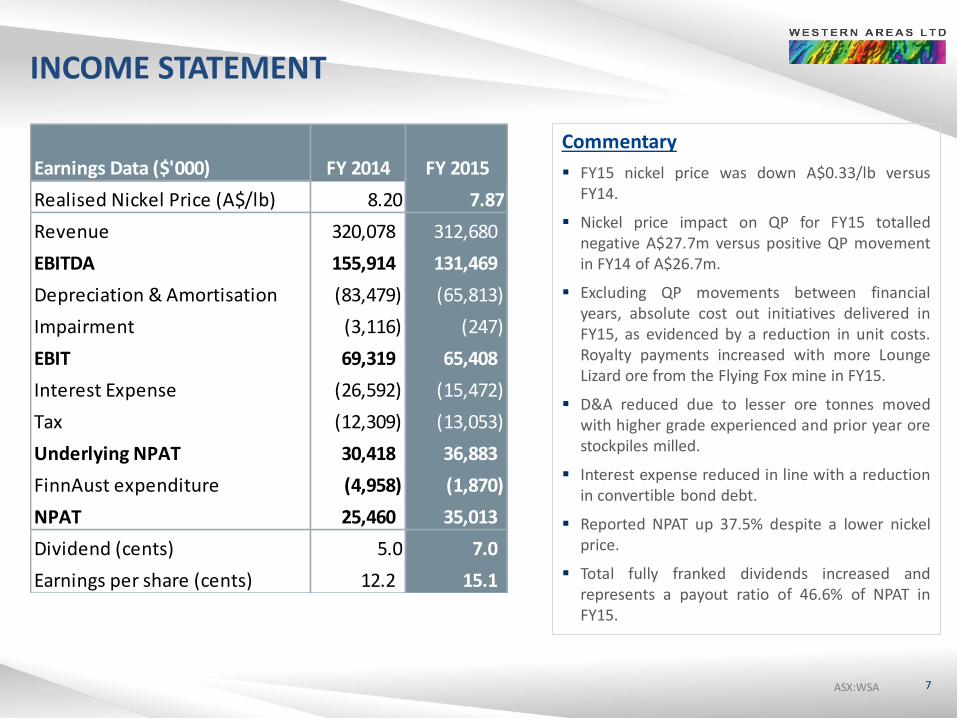
FY15 nickel price was down A$0.33/lb versus FY14.
Nickel price impact on QP for FY15 totalled negative A$27.7m versus positive QP movement in FY14 of A$26.7m.
Excluding QP movements between financial years, absolute cost out initiatives delivered in FY15, as evidenced by a reduction in unit costs. Royalty payments increased with more Lounge Lizard ore from the Flying Fox mine in FY15.
D&A reduced due to lesser ore tonnes moved with higher grade experienced and prior year ore stockpiles milled.
Interest expense reduced in line with a reduction in convertible bond debt.
Reported NPAT up 37.5% despite a lower nickel price.
Total fully franked dividends increased and represents a payout ratio of 46.6% of NPAT in FY15.
Earnings Data ($'000) FY 2014 FY 2015
Realised Nickel Price (A$/lb) 8.20 7.87
Revenue 320,078 312,680
EBITDA 155,914 131,469
Depreciation & Amortisation (83,479) (65,813)
Impairment (3,116) (247)
EBIT 69,319 65,408
Interest Expense (26,592) (15,472)
Tax (12,309) (13,053)
Underlying NPAT 30,418 36,883
FinnAust expenditure (4,958) (1,870)
NPAT 25,460 35,013
Dividend (cents) 5.0 7.0
Earnings per share (cents) 12.2 15.1
ASX:WSA ASX:WSA ASX:WSA
INCOME STATEMENT WATERFALLS
8
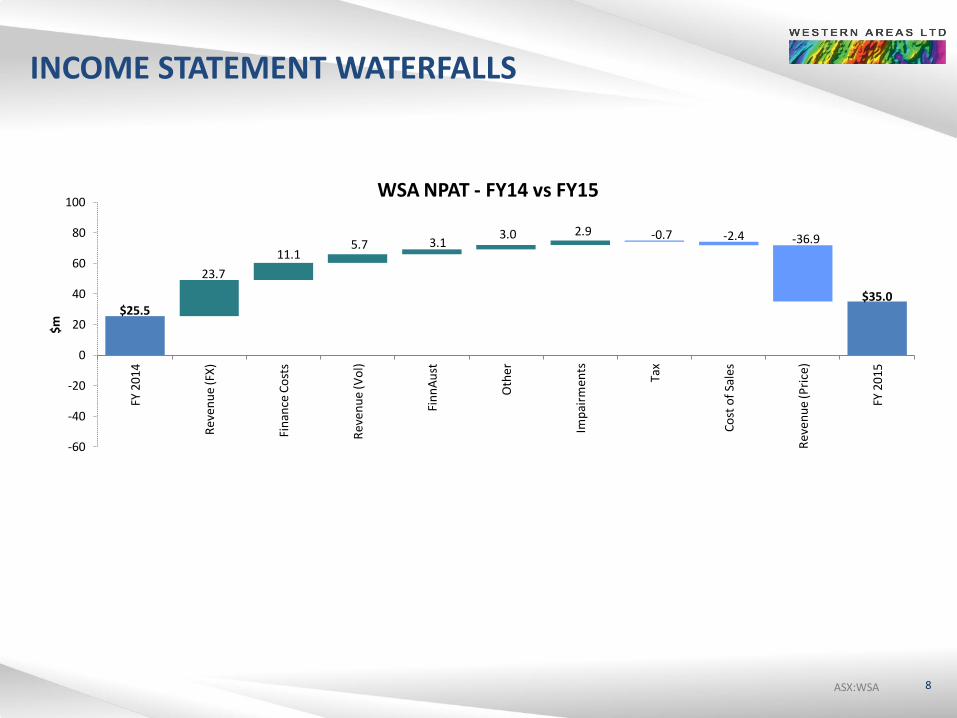
$25.5 $35.0
23.7
11.1 5.7 3.1
3.0 2.9 -0.7 -2.4 -36.9
-60
-40
-20
0
20
40
60
80
100
FY 2
014
Rev
en
ue
(FX
)
Fin
ance
Co
sts
Re
ven
ue
(Vo
l)
Fin
nA
ust
Oth
er
Imp
airm
ents
Tax
Co
st o
f Sa
les
Re
ven
ue
(Pri
ce)
FY 2
015
$m
WSA NPAT - FY14 vs FY15
ASX:WSA ASX:WSA ASX:WSA
NICKEL PRICE MOVEMENTS & QUOTATIONAL PRICING
9
$10,000
$12,000
$14,000
$16,000
$18,000
$20,000
$22,000
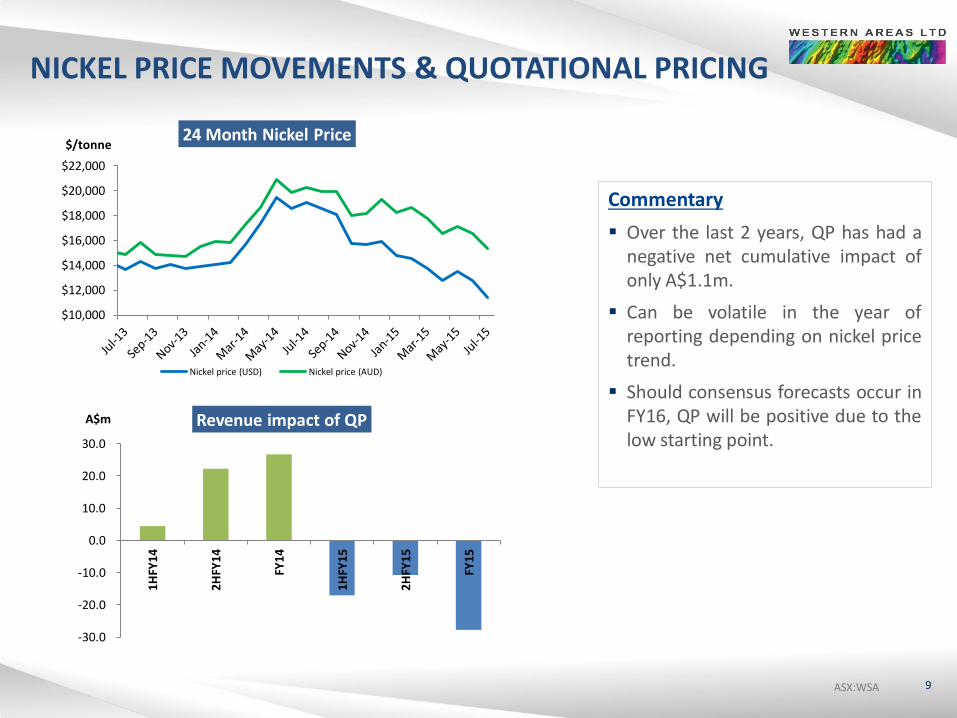
24 Month Nickel Price
Nickel price (USD) Nickel price (AUD)
-30.0
-20.0
-10.0
0.0
10.0
20.0
30.0
1HFY
14
2HFY
14
FY14
1HFY
15
2HFY
15
FY15
Revenue impact of QP A$m
Commentary
Over the last 2 years, QP has had a negative net cumulative impact of only A$1.1m.
Can be volatile in the year of reporting depending on nickel price trend.
Should consensus forecasts occur in FY16, QP will be positive due to the low starting point.
$/tonne
ASX:WSA ASX:WSA ASX:WSA
CASHFLOW STATEMENT
10
Commentary
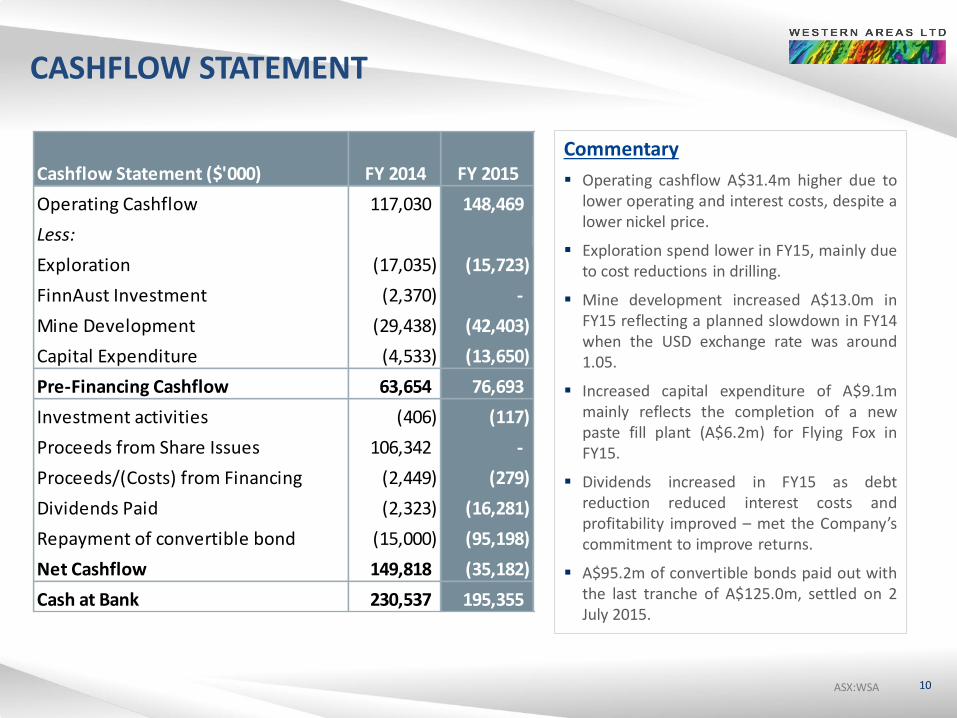
Operating cashflow A$31.4m higher due to lower operating and interest costs, despite a lower nickel price.
Exploration spend lower in FY15, mainly due to cost reductions in drilling.
Mine development increased A$13.0m in FY15 reflecting a planned slowdown in FY14 when the USD exchange rate was around 1.05.
Increased capital expenditure of A$9.1m mainly reflects the completion of a new paste fill plant (A$6.2m) for Flying Fox in FY15.
Dividends increased in FY15 as debt reduction reduced interest costs and profitability improved – met the Company’s commitment to improve returns.
A$95.2m of convertible bonds paid out with the last tranche of A$125.0m, settled on 2 July 2015.
Cashflow Statement ($'000) FY 2014 FY 2015
Operating Cashflow 117,030 148,469
Less:
Exploration (17,035) (15,723)
FinnAust Investment (2,370) -
Mine Development (29,438) (42,403)
Capital Expenditure (4,533) (13,650)
Pre-Financing Cashflow 63,654 76,693
Investment activities (406) (117)
Proceeds from Share Issues 106,342 -
Proceeds/(Costs) from Financing (2,449) (279)
Dividends Paid (2,323) (16,281)
Repayment of convertible bond (15,000) (95,198)
Net Cashflow 149,818 (35,182)
Cash at Bank 230,537 195,355
ASX:WSA ASX:WSA ASX:WSA
CASHFLOW STATEMENT WATERFALL
11
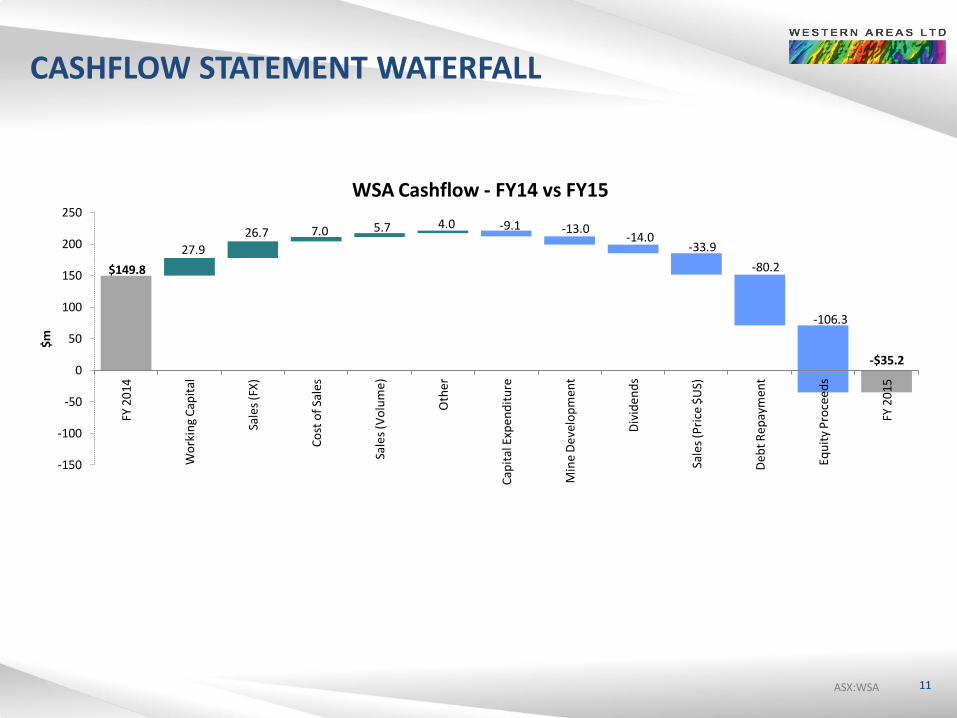
$149.8
-$35.2
27.9
26.7 7.0 5.7 4.0 -9.1 -13.0 -14.0
-33.9
-80.2
-106.3
-150
-100
-50
0
50
100
150
200
250
FY 2
014
Wo
rkin
g C
apit
al
Sale
s (F
X)
Co
st o
f Sa
les
Sale
s (V
olu
me
)
Oth
er
Cap
ital
Exp
end
itu
re
Min
e D
evel
op
men
t
Div
iden
ds
Sale
s (P
rice
$U
S)
Deb
t R
epay
men
t
Equ
ity
Pro
cee
ds
FY 2
015
$m
WSA Cashflow - FY14 vs FY15
ASX:WSA ASX:WSA ASX:WSA
BALANCE SHEET
12
Commentary
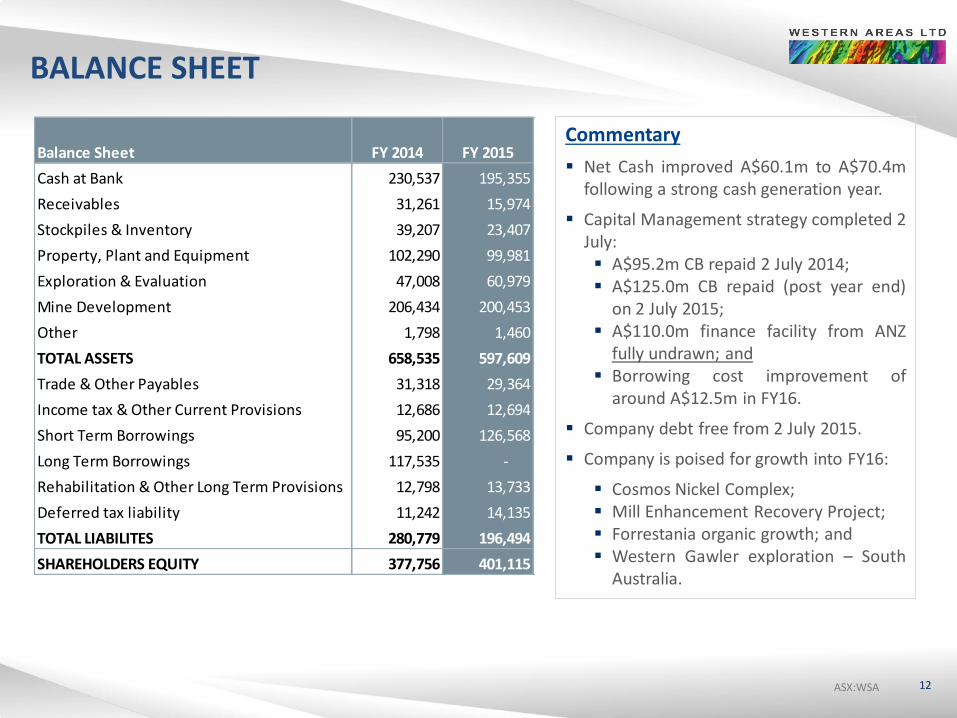
Net Cash improved A$60.1m to A$70.4m following a strong cash generation year.
Capital Management strategy completed 2 July: A$95.2m CB repaid 2 July 2014; A$125.0m CB repaid (post year end)
on 2 July 2015; A$110.0m finance facility from ANZ
fully undrawn; and Borrowing cost improvement of
around A$12.5m in FY16.
Company debt free from 2 July 2015.
Company is poised for growth into FY16:
Cosmos Nickel Complex; Mill Enhancement Recovery Project; Forrestania organic growth; and Western Gawler exploration – South
Australia.
Balance Sheet FY 2014 FY 2015
Cash at Bank 230,537 195,355
Receivables 31,261 15,974
Stockpiles & Inventory 39,207 23,407
Property, Plant and Equipment 102,290 99,981
Exploration & Evaluation 47,008 60,979
Mine Development 206,434 200,453
Other 1,798 1,460
TOTAL ASSETS 658,535 597,609
Trade & Other Payables 31,318 29,364
Income tax & Other Current Provisions 12,686 12,694
Short Term Borrowings 95,200 126,568
Long Term Borrowings 117,535 -
Rehabilitation & Other Long Term Provisions 12,798 13,733
Deferred tax liability 11,242 14,135
TOTAL LIABILITES 280,779 196,494
SHAREHOLDERS EQUITY 377,756 401,115
ASX:WSA ASX:WSA ASX:WSA
FY16 GUIDANCE
13
Comments
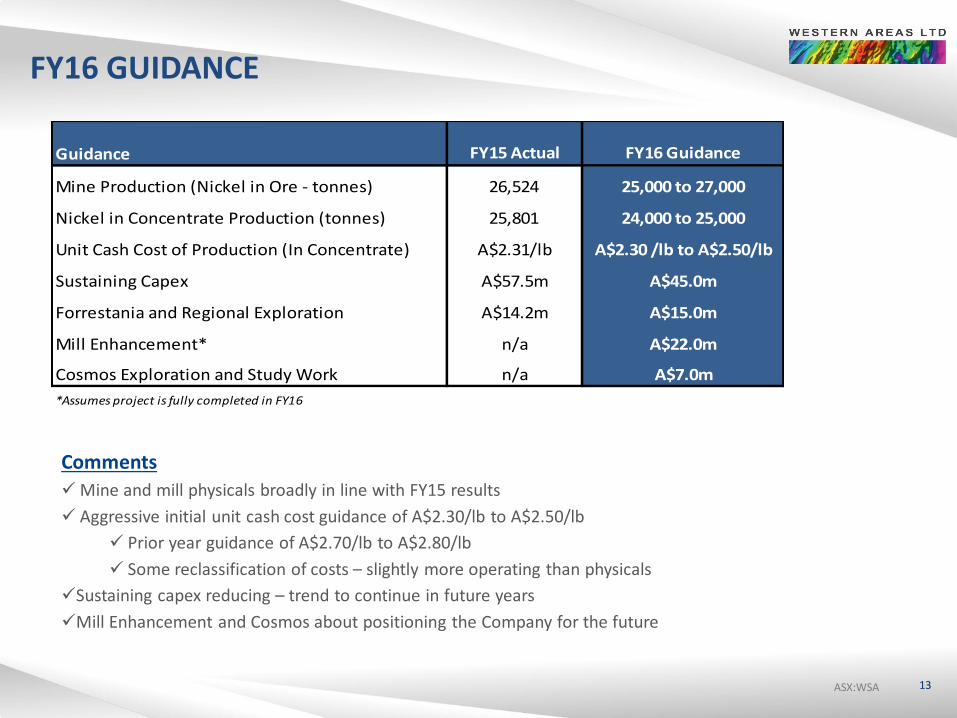
Mine and mill physicals broadly in line with FY15 results
Aggressive initial unit cash cost guidance of A$2.30/lb to A$2.50/lb
Prior year guidance of A$2.70/lb to A$2.80/lb
Some reclassification of costs – slightly more operating than physicals
Sustaining capex reducing – trend to continue in future years
Mill Enhancement and Cosmos about positioning the Company for the future
Guidance FY15 Actual FY16 Guidance
Mine Production (Nickel in Ore - tonnes) 26,524 25,000 to 27,000
Nickel in Concentrate Production (tonnes) 25,801 24,000 to 25,000
Unit Cash Cost of Production (In Concentrate) A$2.31/lb A$2.30 /lb to A$2.50/lb
Sustaining Capex A$57.5m A$45.0m
Forrestania and Regional Exploration A$14.2m A$15.0m
Mill Enhancement* n/a A$22.0m
Cosmos Exploration and Study Work n/a A$7.0m
*Assumes project is fully completed in FY16
ASX:WSA ASX:WSA ASX:WSA ASX:WSA
CORPORATE
14
ASX:WSA ASX:WSA ASX:WSA
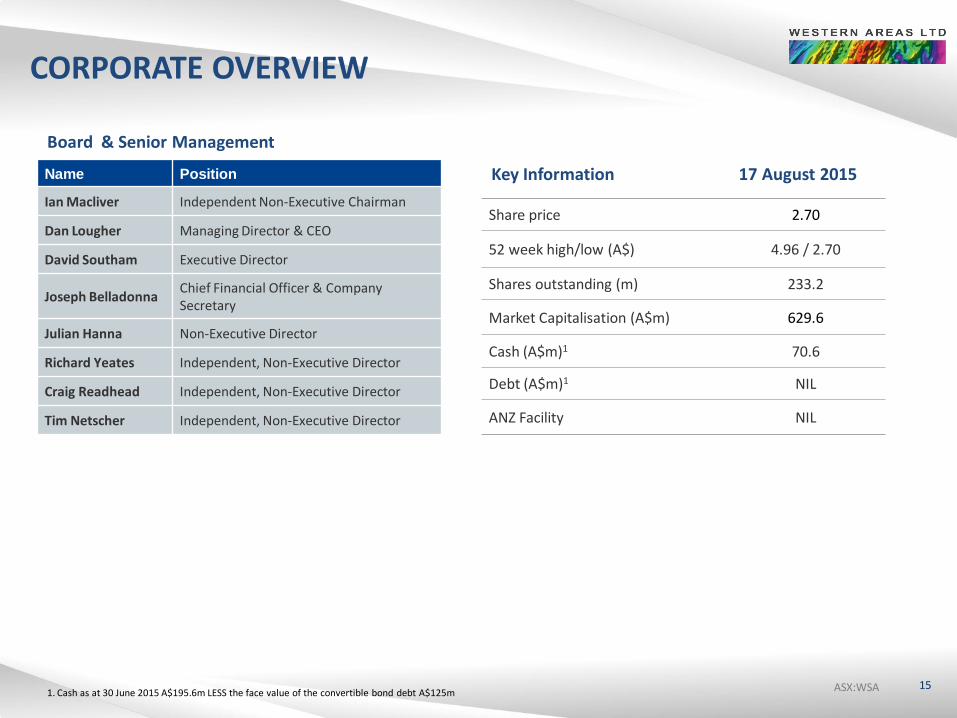
Share price 2.70
52 week high/low (A$) 4.96 / 2.70
Shares outstanding (m) 233.2
Market Capitalisation (A$m) 629.6
Cash (A$m)1 70.6
Debt (A$m)1 NIL
ANZ Facility NIL
CORPORATE OVERVIEW
15
Key Information 17 August 2015
Board & Senior Management
Name Position
Ian Macliver Independent Non-Executive Chairman
Dan Lougher Managing Director & CEO
David Southam Executive Director
Joseph Belladonna Chief Financial Officer & Company Secretary
Julian Hanna Non-Executive Director
Richard Yeates Independent, Non-Executive Director
Craig Readhead Independent, Non-Executive Director
Tim Netscher Independent, Non-Executive Director
1. Cash as at 30 June 2015 A$195.6m LESS the face value of the convertible bond debt A$125m
ASX:WSA ASX:WSA ASX:WSA
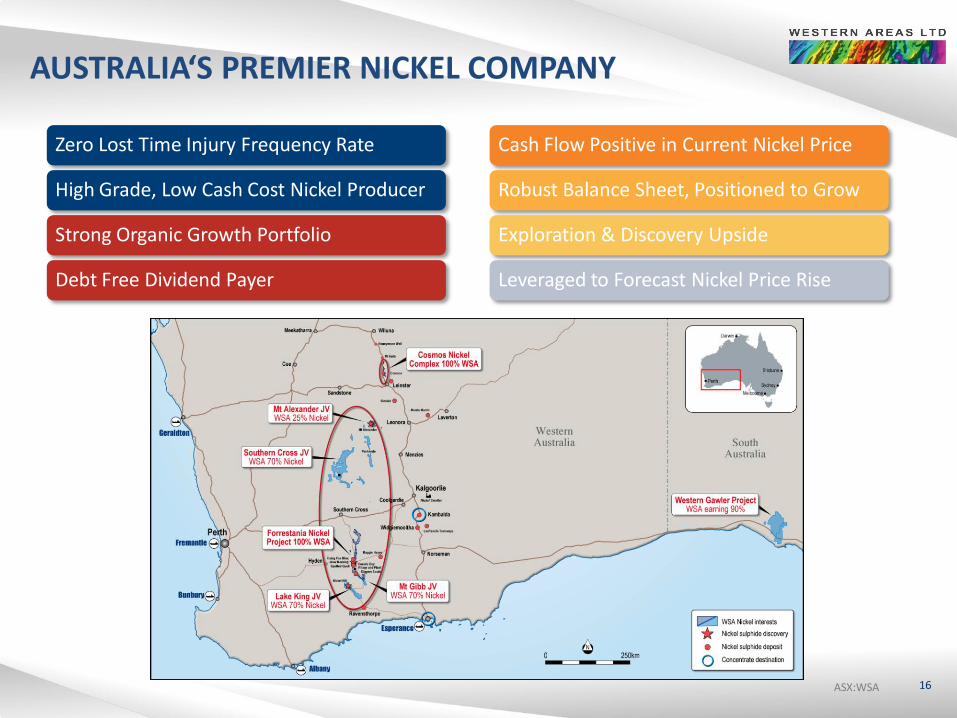
AUSTRALIA‘S PREMIER NICKEL COMPANY
Zero Lost Time Injury Frequency Rate
High Grade, Low Cash Cost Nickel Producer
Strong Organic Growth Portfolio
Debt Free Dividend Payer
16
Cash Flow Positive in Current Nickel Price
Robust Balance Sheet, Positioned to Grow
Exploration & Discovery Upside
Leveraged to Forecast Nickel Price Rise
ASX:WSA ASX:WSA ASX:WSA
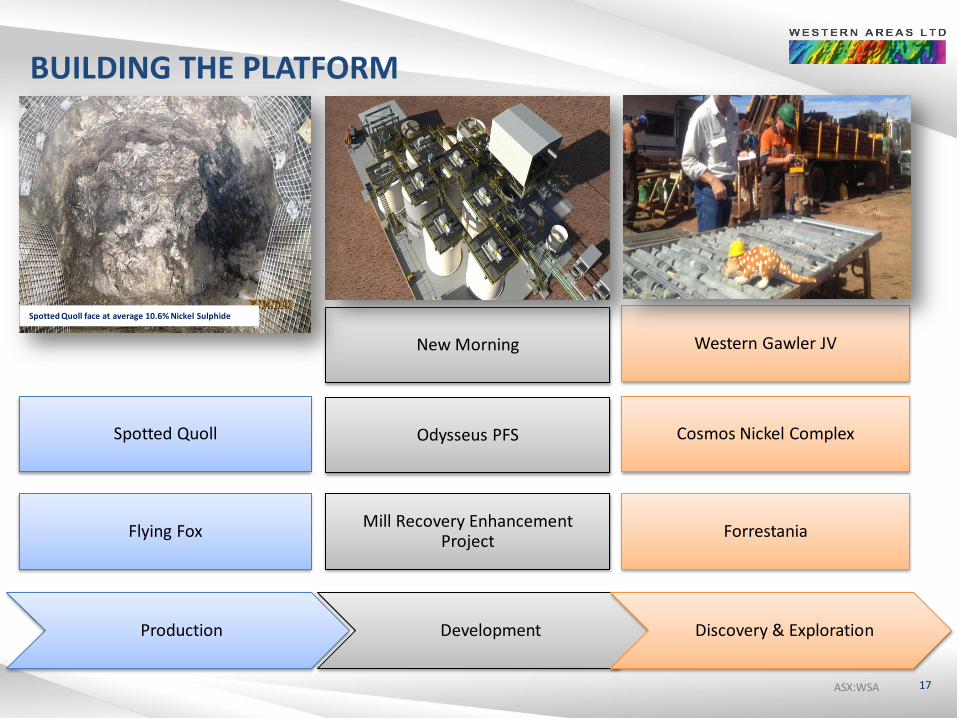
BUILDING THE PLATFORM
17
Production Development Discovery & Exploration
Flying Fox
Spotted Quoll
Mill Recovery Enhancement Project
Odysseus PFS
New Morning
Forrestania
Cosmos Nickel Complex
Western Gawler JV
Spotted Quoll face at average 10.6% Nickel Sulphide
ASX:WSA ASX:WSA
WESTERN AREAS VALUE EQUATION
18
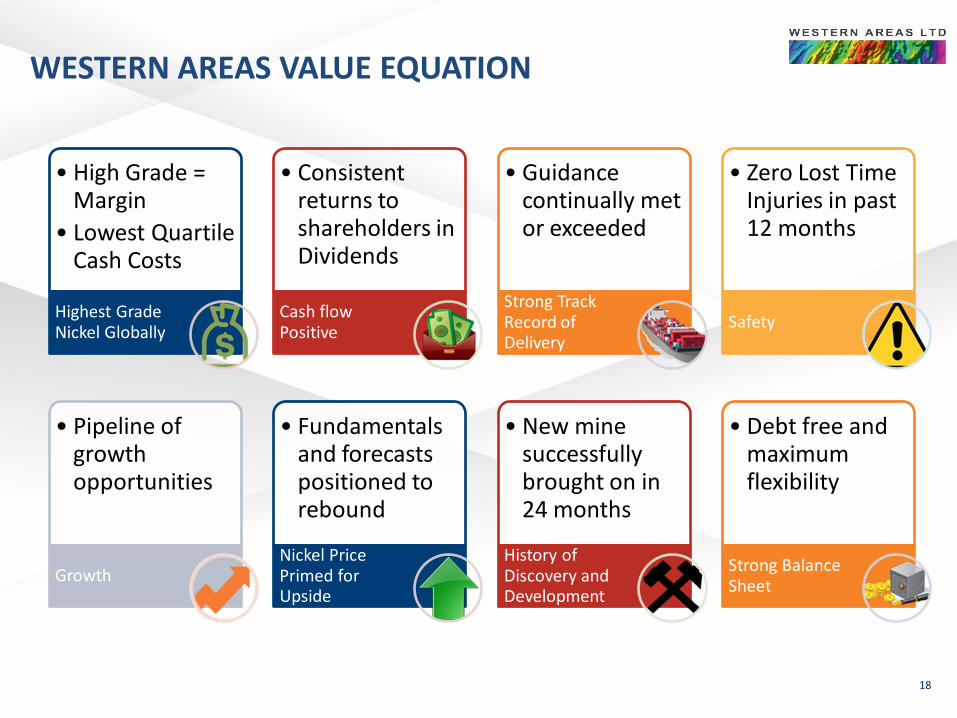
• High Grade = Margin
• Lowest Quartile Cash Costs
Highest Grade Nickel Globally
• Consistent returns to shareholders in Dividends
Cash flow Positive
• Guidance continually met or exceeded
Strong Track Record of Delivery
• Zero Lost Time Injuries in past 12 months
Safety
• Pipeline of growth opportunities
Growth
• Fundamentals and forecasts positioned to rebound
Nickel Price Primed for Upside
• New mine successfully brought on in 24 months
History of Discovery and Development
• Debt free and maximum flexibility
Strong Balance Sheet
ASX:WSA ASX:WSA ASX:WSA ASX:WSA 19
OPERATIONS
ASX:WSA ASX:WSA ASX:WSA
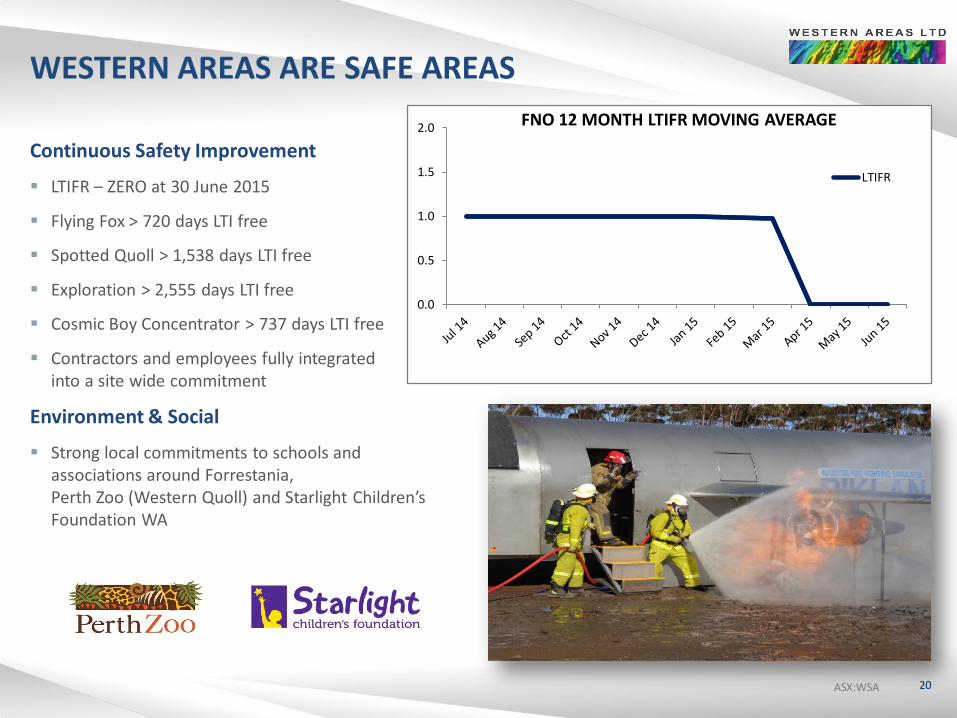
WESTERN AREAS ARE SAFE AREAS
Continuous Safety Improvement
LTIFR – ZERO at 30 June 2015
Flying Fox > 720 days LTI free
Spotted Quoll > 1,538 days LTI free
Exploration > 2,555 days LTI free
Cosmic Boy Concentrator > 737 days LTI free
Contractors and employees fully integrated into a site wide commitment
Environment & Social
Strong local commitments to schools and associations around Forrestania, Perth Zoo (Western Quoll) and Starlight Children’s Foundation WA
20
0.0
0.5
1.0
1.5
2.0 FNO 12 MONTH LTIFR MOVING AVERAGE
LTIFR
ASX:WSA ASX:WSA ASX:WSA
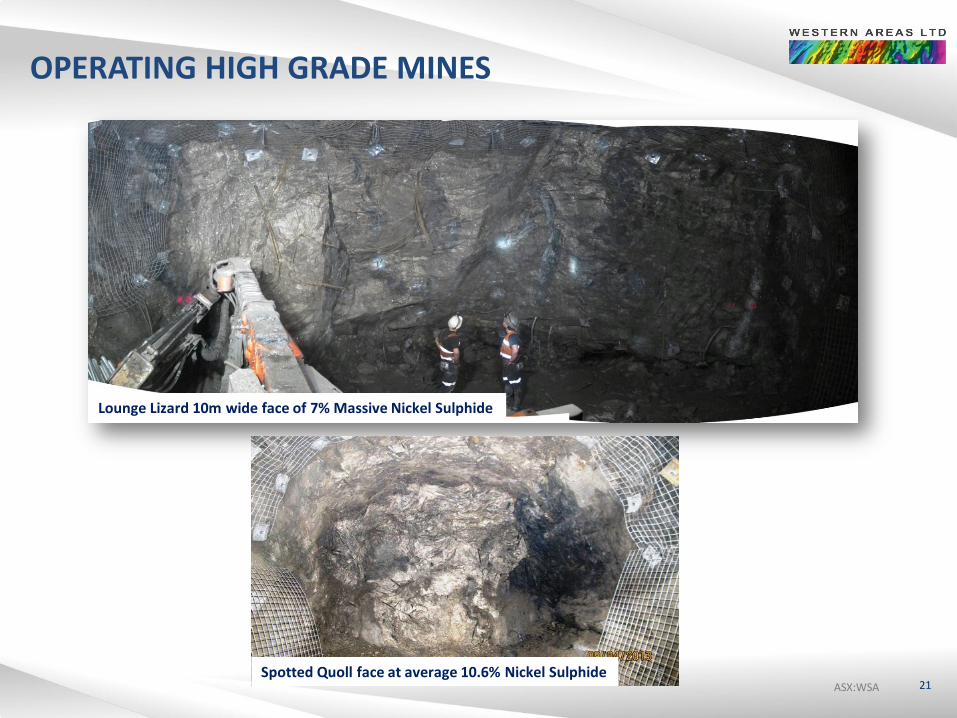
OPERATING HIGH GRADE MINES
21
Lounge Lizard 10m wide face of 7% Massive Nickel Sulphide
Spotted Quoll face at average 10.6% Nickel Sulphide
ASX:WSA ASX:WSA ASX:WSA
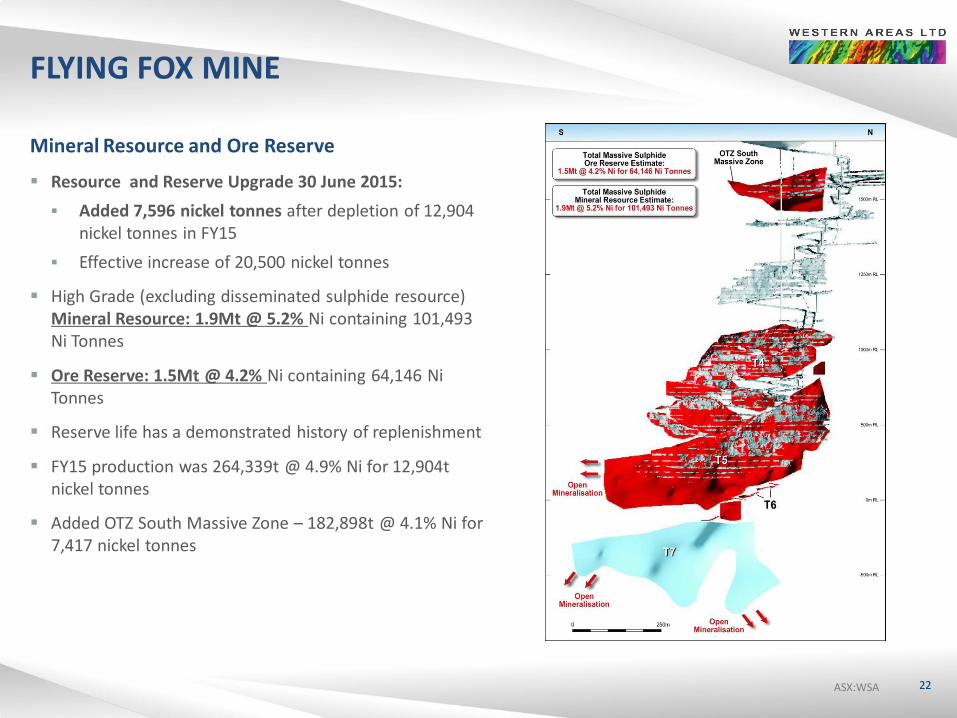
FLYING FOX MINE
Mineral Resource and Ore Reserve
Resource and Reserve Upgrade 30 June 2015:
Added 7,596 nickel tonnes after depletion of 12,904 nickel tonnes in FY15
Effective increase of 20,500 nickel tonnes
High Grade (excluding disseminated sulphide resource) Mineral Resource: 1.9Mt @ 5.2% Ni containing 101,493 Ni Tonnes
Ore Reserve: 1.5Mt @ 4.2% Ni containing 64,146 Ni Tonnes
Reserve life has a demonstrated history of replenishment
FY15 production was 264,339t @ 4.9% Ni for 12,904t nickel tonnes
Added OTZ South Massive Zone – 182,898t @ 4.1% Ni for 7,417 nickel tonnes
22
ASX:WSA ASX:WSA ASX:WSA
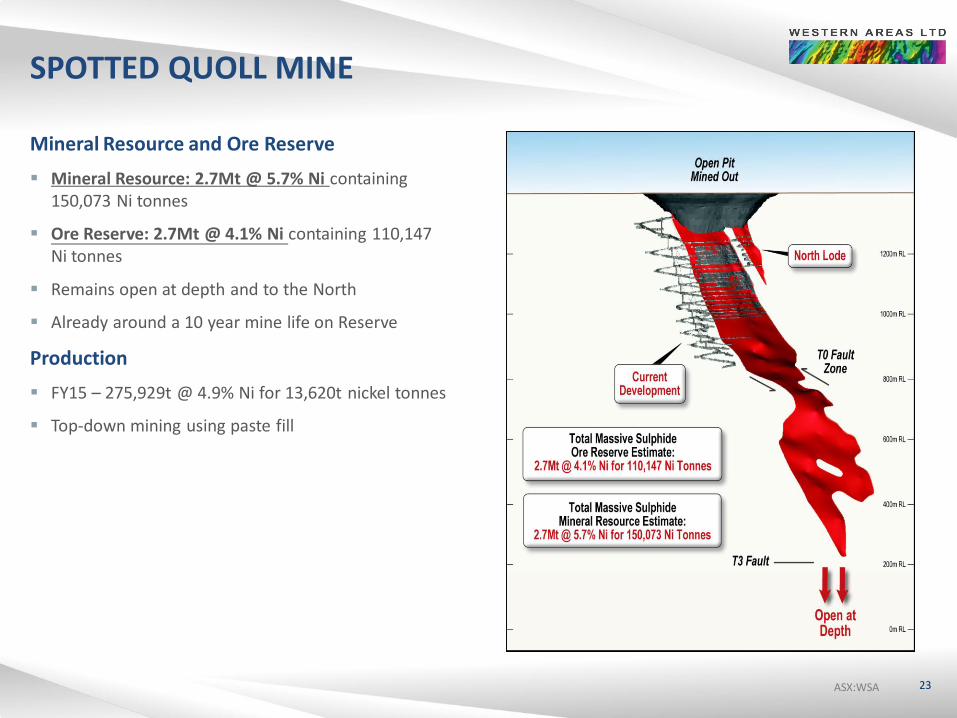
SPOTTED QUOLL MINE
Mineral Resource and Ore Reserve
Mineral Resource: 2.7Mt @ 5.7% Ni containing 150,073 Ni tonnes
Ore Reserve: 2.7Mt @ 4.1% Ni containing 110,147 Ni tonnes
Remains open at depth and to the North
Already around a 10 year mine life on Reserve
Production
FY15 – 275,929t @ 4.9% Ni for 13,620t nickel tonnes
Top-down mining using paste fill
23
ASX:WSA ASX:WSA ASX:WSA
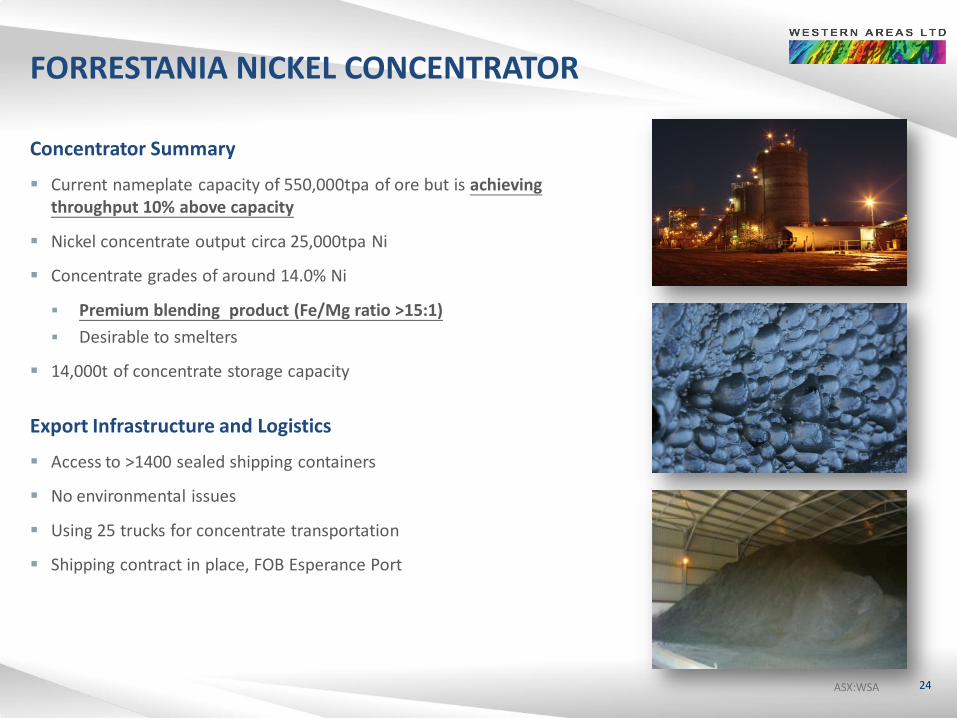
FORRESTANIA NICKEL CONCENTRATOR
Concentrator Summary
Current nameplate capacity of 550,000tpa of ore but is achieving throughput 10% above capacity
Nickel concentrate output circa 25,000tpa Ni
Concentrate grades of around 14.0% Ni
Premium blending product (Fe/Mg ratio >15:1)
Desirable to smelters
14,000t of concentrate storage capacity
Export Infrastructure and Logistics
Access to >1400 sealed shipping containers
No environmental issues
Using 25 trucks for concentrate transportation
Shipping contract in place, FOB Esperance Port
24
ASX:WSA ASX:WSA ASX:WSA
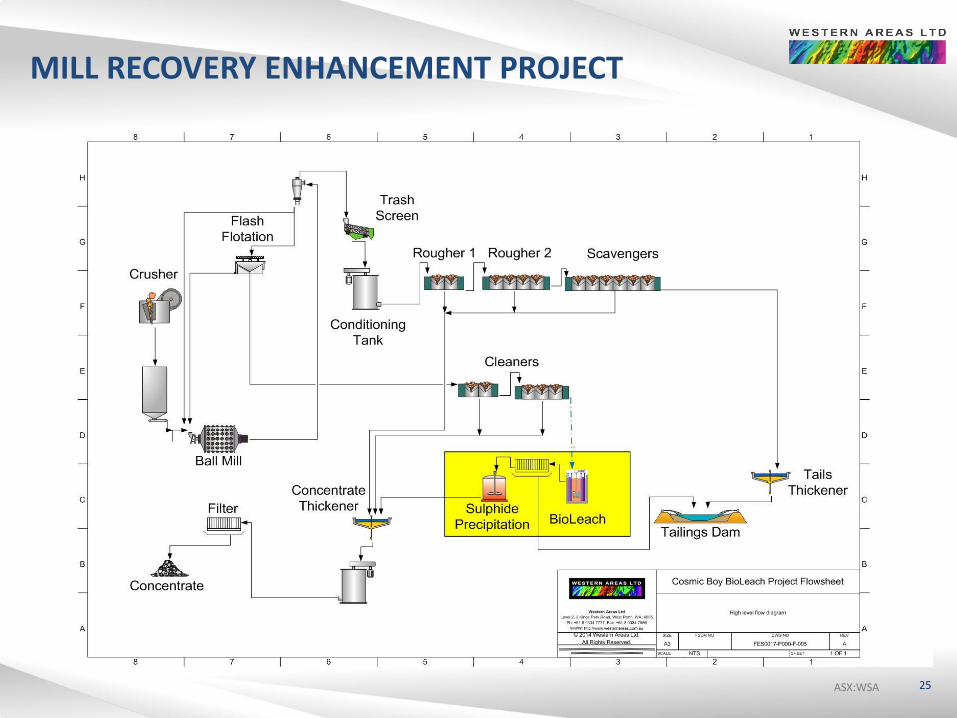
MILL RECOVERY ENHANCEMENT PROJECT
25
ASX:WSA ASX:WSA ASX:WSA
MILL RECOVERY ENHANCEMENT PROJECT
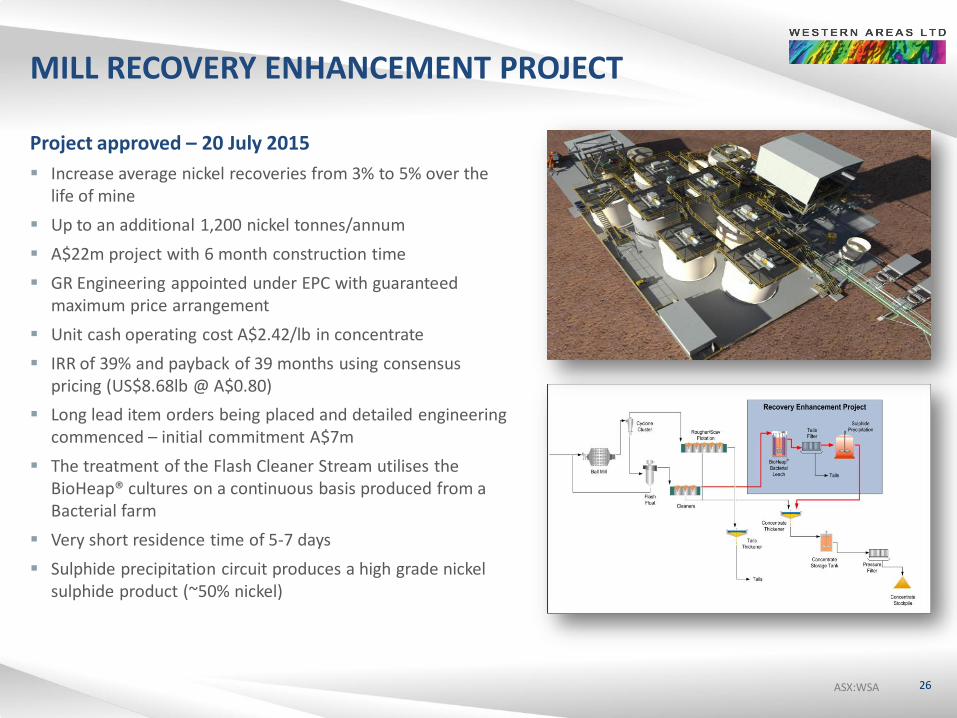
Project approved – 20 July 2015
Increase average nickel recoveries from 3% to 5% over the life of mine
Up to an additional 1,200 nickel tonnes/annum
A$22m project with 6 month construction time
GR Engineering appointed under EPC with guaranteed maximum price arrangement
Unit cash operating cost A$2.42/lb in concentrate
IRR of 39% and payback of 39 months using consensus pricing (US$8.68lb @ A$0.80)
Long lead item orders being placed and detailed engineering commenced – initial commitment A$7m
The treatment of the Flash Cleaner Stream utilises the BioHeap® cultures on a continuous basis produced from a Bacterial farm
Very short residence time of 5-7 days
Sulphide precipitation circuit produces a high grade nickel sulphide product (~50% nickel)
26
ASX:WSA ASX:WSA ASX:WSA
JUNE 2015 QUARTERLY REPORT
Some Facts
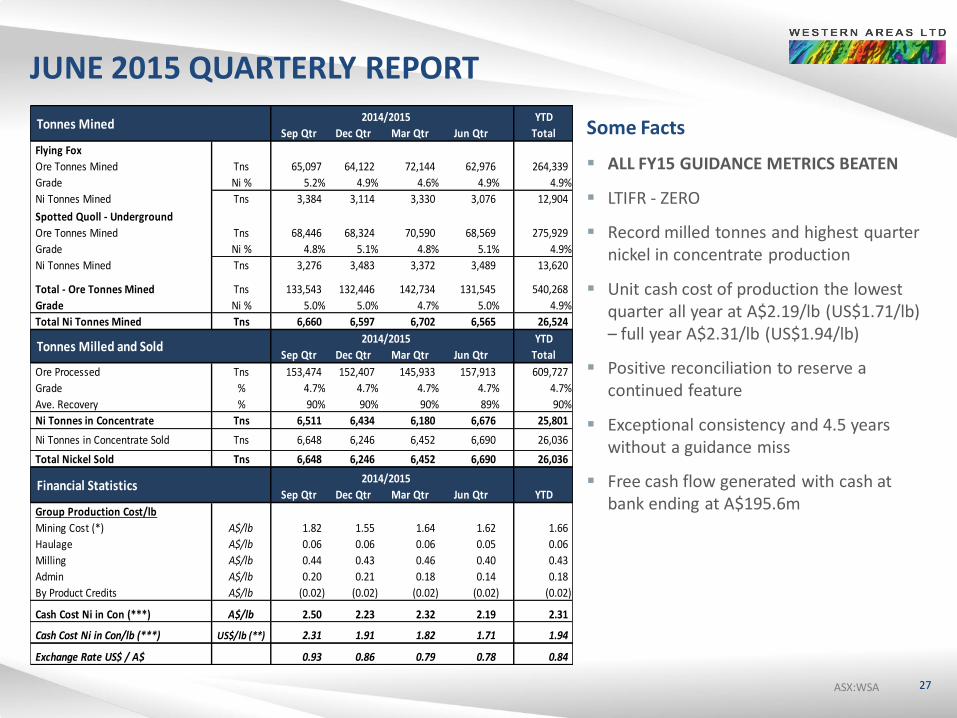
ALL FY15 GUIDANCE METRICS BEATEN
LTIFR - ZERO
Record milled tonnes and highest quarter nickel in concentrate production
Unit cash cost of production the lowest quarter all year at A$2.19/lb (US$1.71/lb) – full year A$2.31/lb (US$1.94/lb)
Positive reconciliation to reserve a continued feature
Exceptional consistency and 4.5 years without a guidance miss
Free cash flow generated with cash at bank ending at A$195.6m
27
YTD
Sep Qtr Dec Qtr Mar Qtr Jun Qtr Total
Flying Fox
Ore Tonnes Mined Tns 65,097 64,122 72,144 62,976 264,339
Grade Ni % 5.2% 4.9% 4.6% 4.9% 4.9%
Ni Tonnes Mined Tns 3,384 3,114 3,330 3,076 12,904
Spotted Quoll - Underground
Ore Tonnes Mined Tns 68,446 68,324 70,590 68,569 275,929
Grade Ni % 4.8% 5.1% 4.8% 5.1% 4.9%
Ni Tonnes Mined Tns 3,276 3,483 3,372 3,489 13,620
Total - Ore Tonnes Mined Tns 133,543 132,446 142,734 131,545 540,268
Grade Ni % 5.0% 5.0% 4.7% 5.0% 4.9%
Total Ni Tonnes Mined Tns 6,660 6,597 6,702 6,565 26,524
YTD
Sep Qtr Dec Qtr Mar Qtr Jun Qtr Total
Ore Processed Tns 153,474 152,407 145,933 157,913 609,727
Grade % 4.7% 4.7% 4.7% 4.7% 4.7%
Ave. Recovery % 90% 90% 90% 89% 90%
Ni Tonnes in Concentrate Tns 6,511 6,434 6,180 6,676 25,801
Ni Tonnes in Concentrate Sold Tns 6,648 6,246 6,452 6,690 26,036 - - - -
Total Nickel Sold Tns 6,648 6,246 6,452 6,690 26,036
Sep Qtr Dec Qtr Mar Qtr Jun Qtr YTD
Group Production Cost/lb
Mining Cost (*) A$/lb 1.82 1.55 1.64 1.62 1.66
Haulage A$/lb 0.06 0.06 0.06 0.05 0.06
Milling A$/lb 0.44 0.43 0.46 0.40 0.43
Admin A$/lb 0.20 0.21 0.18 0.14 0.18
By Product Credits A$/lb (0.02) (0.02) (0.02) (0.02) (0.02)
Cash Cost Ni in Con (***) A$/lb 2.50 2.23 2.32 2.19 2.31
Cash Cost Ni in Con/lb (***) US$/lb (**) 2.31 1.91 1.82 1.71 1.94
Exchange Rate US$ / A$ 0.93 0.86 0.79 0.78 0.84
2014/2015
2014/2015
Tonnes Mined
Tonnes Milled and Sold
Financial Statistics2014/2015
ASX:WSA ASX:WSA ASX:WSA ASX:WSA 28
NICKEL MARKET
ASX:WSA ASX:WSA ASX:WSA
NICKEL PRICE DRIVERS
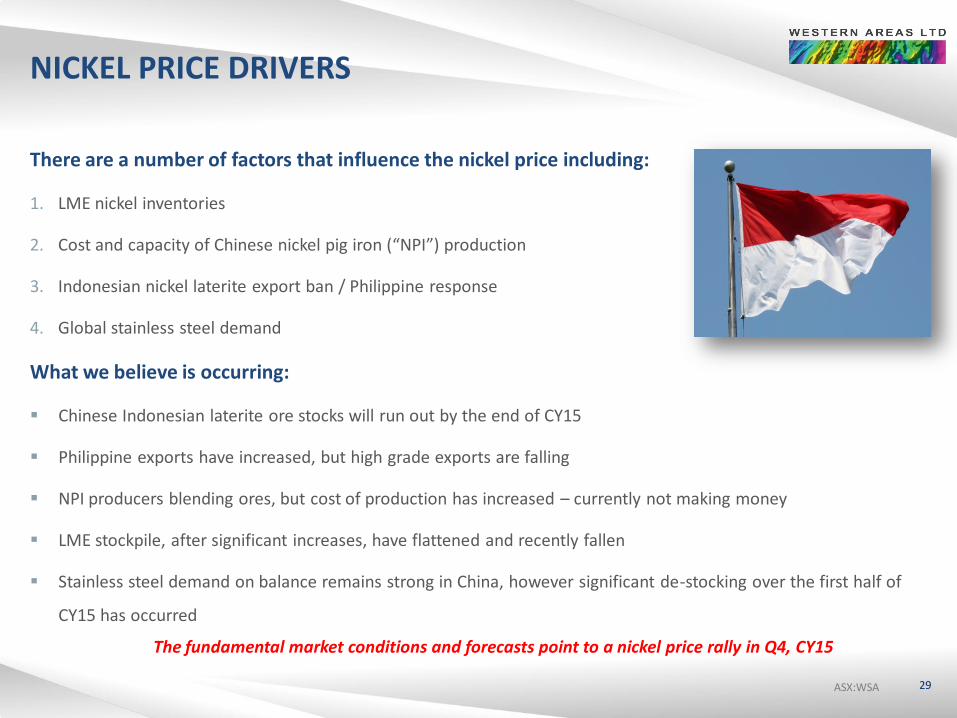
There are a number of factors that influence the nickel price including:
1. LME nickel inventories
2. Cost and capacity of Chinese nickel pig iron (“NPI”) production
3. Indonesian nickel laterite export ban / Philippine response
4. Global stainless steel demand
What we believe is occurring:
Chinese Indonesian laterite ore stocks will run out by the end of CY15
Philippine exports have increased, but high grade exports are falling
NPI producers blending ores, but cost of production has increased – currently not making money
LME stockpile, after significant increases, have flattened and recently fallen
Stainless steel demand on balance remains strong in China, however significant de-stocking over the first half of
CY15 has occurred
29
The fundamental market conditions and forecasts point to a nickel price rally in Q4, CY15
ASX:WSA ASX:WSA ASX:WSA
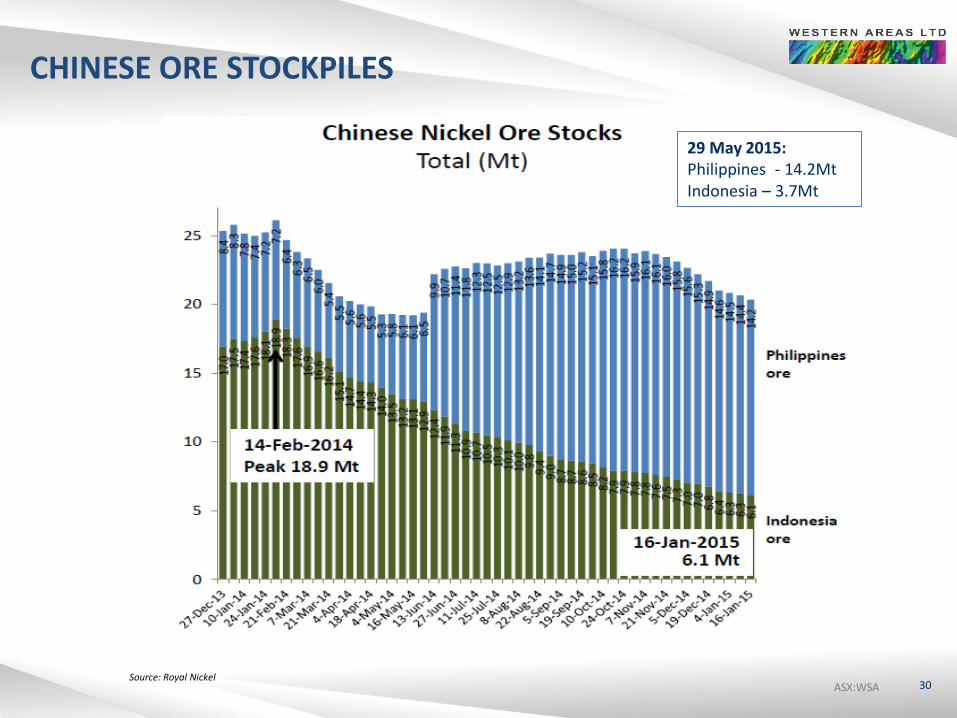
CHINESE ORE STOCKPILES
30 Source: Royal Nickel
29 May 2015: Philippines - 14.2Mt Indonesia – 3.7Mt
ASX:WSA ASX:WSA ASX:WSA
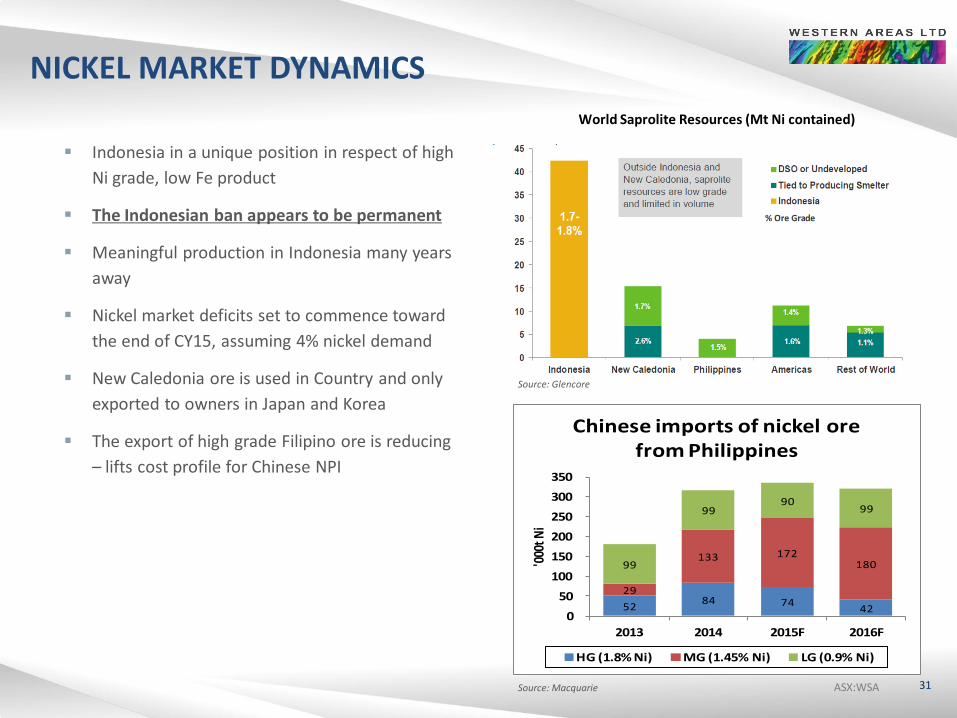
NICKEL MARKET DYNAMICS
31
Indonesia in a unique position in respect of high
Ni grade, low Fe product
The Indonesian ban appears to be permanent
Meaningful production in Indonesia many years
away
Nickel market deficits set to commence toward
the end of CY15, assuming 4% nickel demand
New Caledonia ore is used in Country and only
exported to owners in Japan and Korea
The export of high grade Filipino ore is reducing
– lifts cost profile for Chinese NPI
Source: Glencore
World Saprolite Resources (Mt Ni contained)
52 84 74
42
29
133 172 180 99
99 90
99
0
50
100
150
200
250
300
350
2013 2014 2015F 2016F
'000
t Ni
Chinese imports of nickel ore from Philippines
HG (1.8% Ni) MG (1.45% Ni) LG (0.9% Ni)
Source: Macquarie
ASX:WSA ASX:WSA ASX:WSA
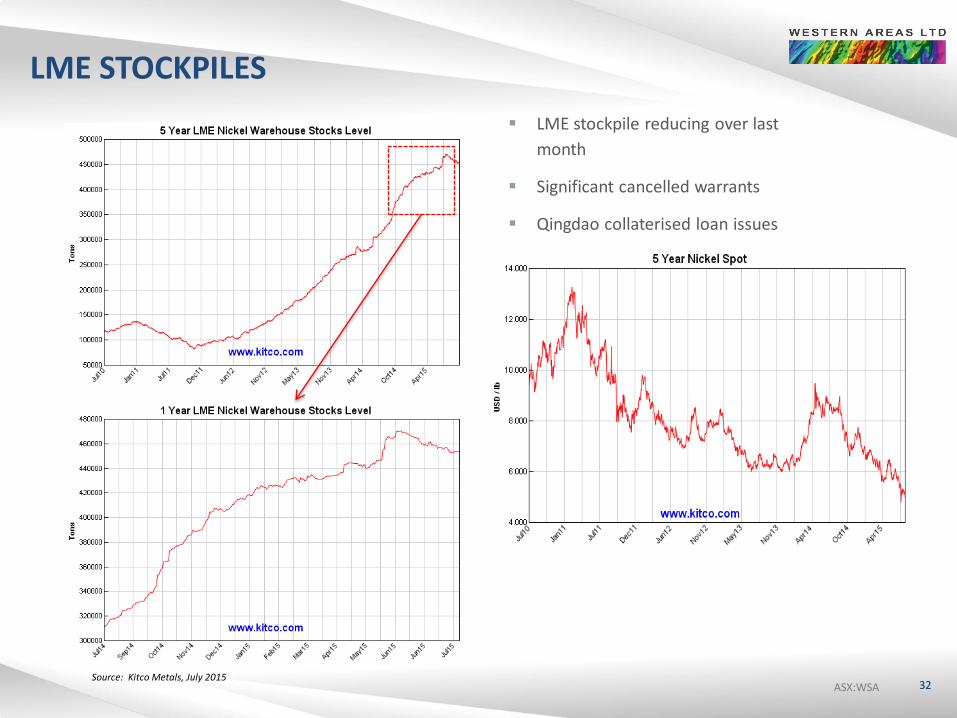
LME STOCKPILES
32 Source: Kitco Metals, July 2015
LME stockpile reducing over last
month
Significant cancelled warrants
Qingdao collaterised loan issues
ASX:WSA ASX:WSA ASX:WSA
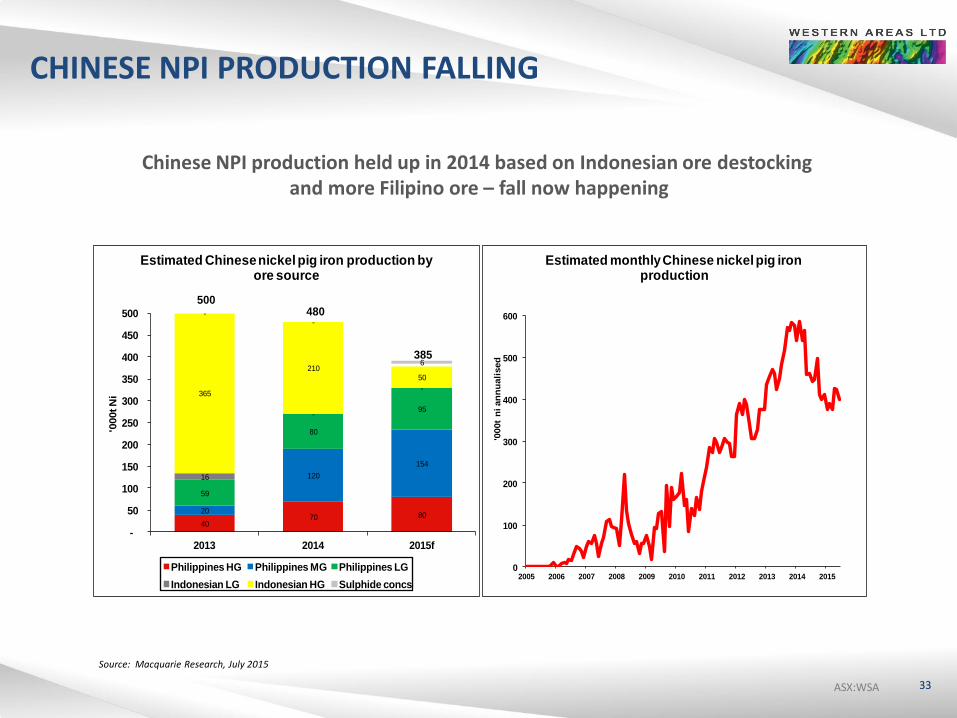
CHINESE NPI PRODUCTION FALLING
33
Source: Macquarie Research, July 2015
40 70 80
20
120
154
59
80
95
16
-
-365
210 50
500 480
385
--
6
-
50
100
150
200
250
300
350
400
450
500
2013 2014 2015f
'000t N
i
Estimated Chinese nickel pig iron production by ore source
Philippines HG Philippines MG Philippines LG
Indonesian LG Indonesian HG Sulphide concs
0
100
200
300
400
500
600
2005 2006 2007 2008 2009 2010 2011 2012 2013 2014 2015
'000t
ni an
nu
ali
sed
Estimated monthly Chinese nickel pig iron production
Chinese NPI production held up in 2014 based on Indonesian ore destocking and more Filipino ore – fall now happening
ASX:WSA ASX:WSA ASX:WSA
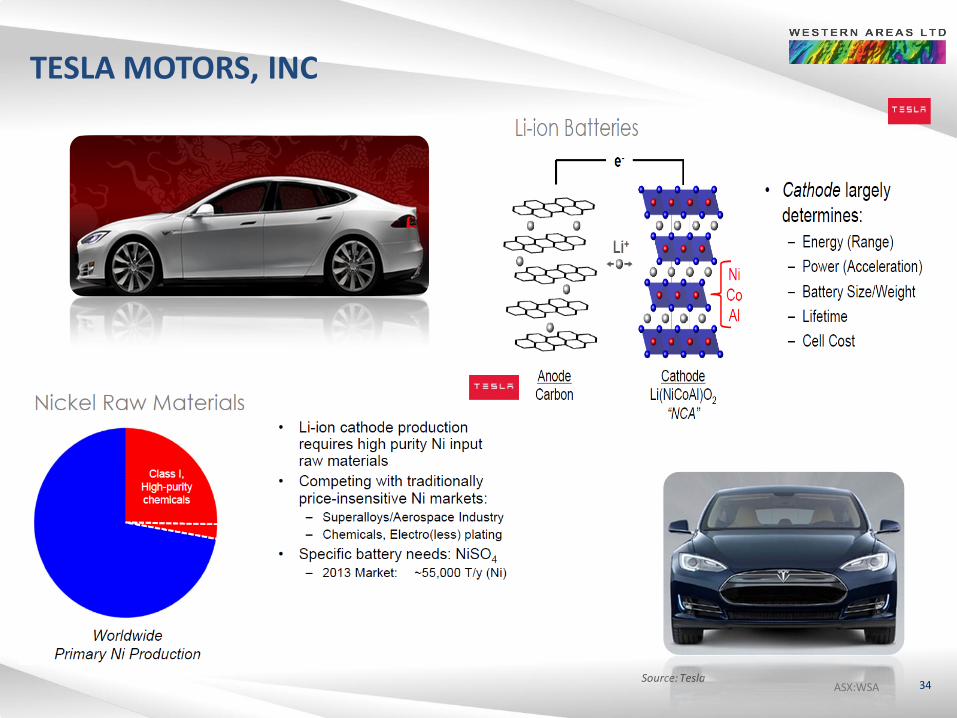
TESLA MOTORS, INC
34 Source: Tesla
ASX:WSA ASX:WSA ASX:WSA ASX:WSA 35
GROWTH & EXPLORATION
ASX:WSA ASX:WSA ASX:WSA
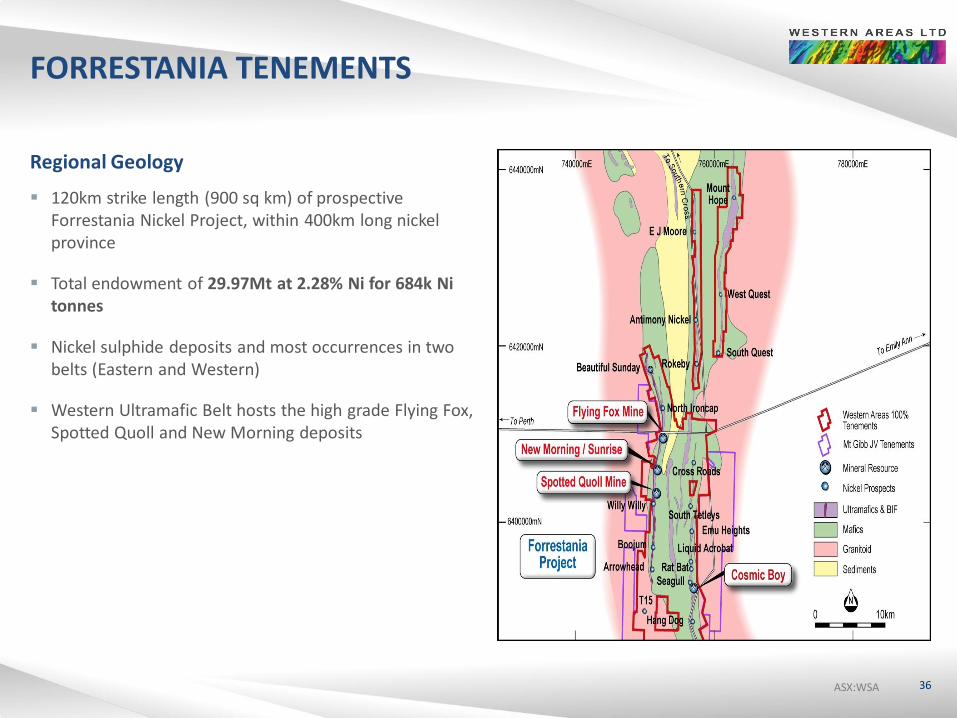
FORRESTANIA TENEMENTS
Regional Geology
120km strike length (900 sq km) of prospective Forrestania Nickel Project, within 400km long nickel province
Total endowment of 29.97Mt at 2.28% Ni for 684k Ni tonnes
Nickel sulphide deposits and most occurrences in two belts (Eastern and Western)
Western Ultramafic Belt hosts the high grade Flying Fox, Spotted Quoll and New Morning deposits
36
ASX:WSA ASX:WSA ASX:WSA
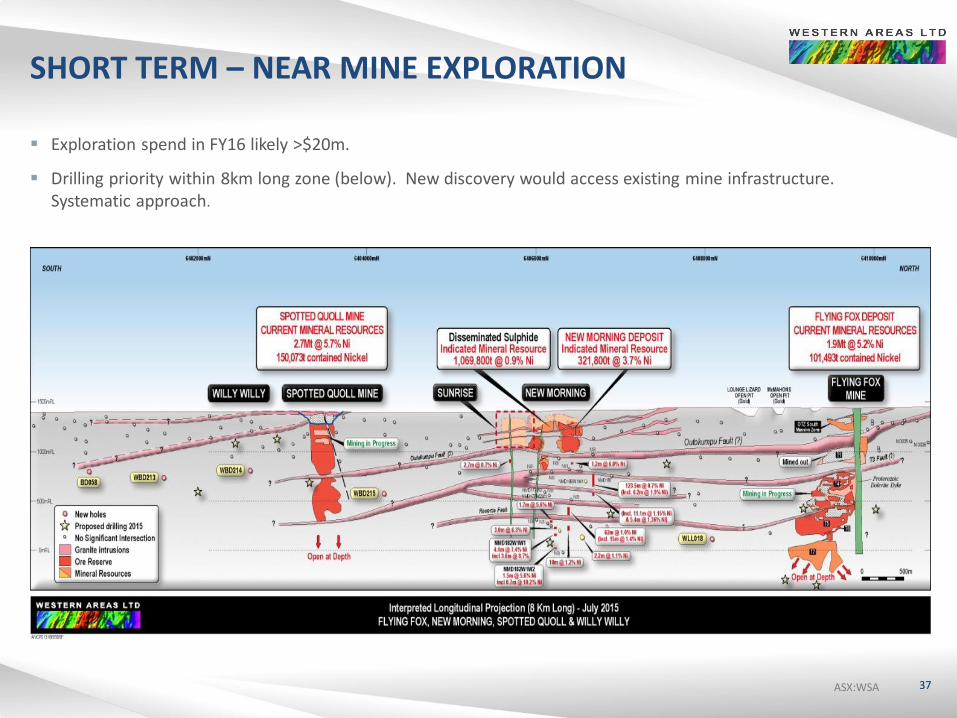
SHORT TERM – NEAR MINE EXPLORATION
Exploration spend in FY16 likely >$20m.
Drilling priority within 8km long zone (below). New discovery would access existing mine infrastructure. Systematic approach.
37
ASX:WSA ASX:WSA ASX:WSA
NEW MORNING
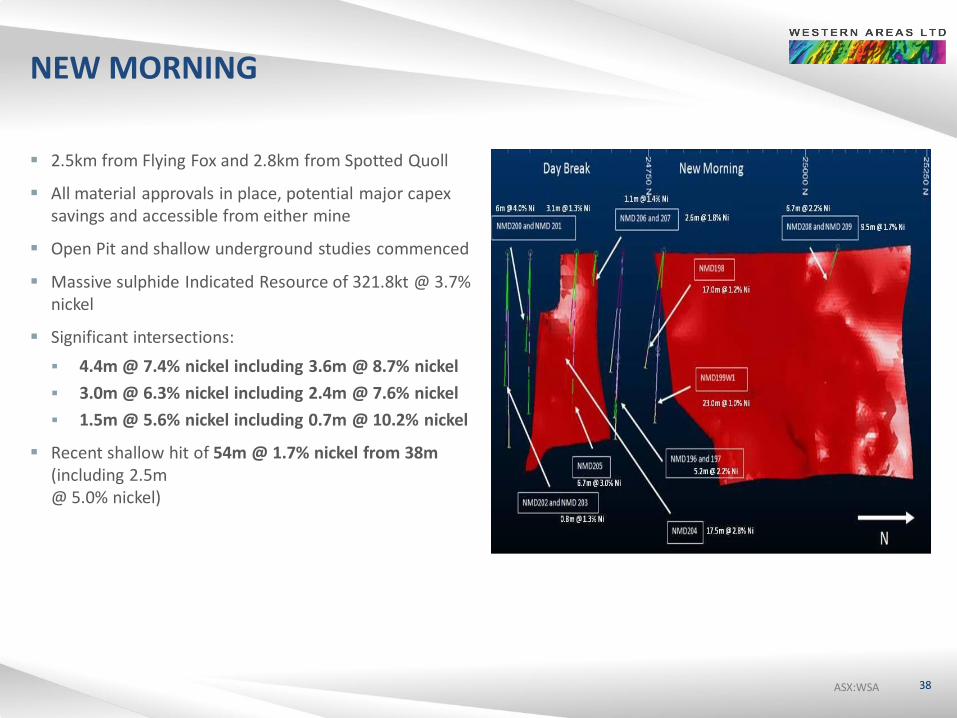
2.5km from Flying Fox and 2.8km from Spotted Quoll
All material approvals in place, potential major capex savings and accessible from either mine
Open Pit and shallow underground studies commenced
Massive sulphide Indicated Resource of 321.8kt @ 3.7% nickel
Significant intersections:
4.4m @ 7.4% nickel including 3.6m @ 8.7% nickel
3.0m @ 6.3% nickel including 2.4m @ 7.6% nickel
1.5m @ 5.6% nickel including 0.7m @ 10.2% nickel
Recent shallow hit of 54m @ 1.7% nickel from 38m (including 2.5m @ 5.0% nickel)
38
ASX:WSA ASX:WSA ASX:WSA
WESTERN GAWLER JOINT VENTURES
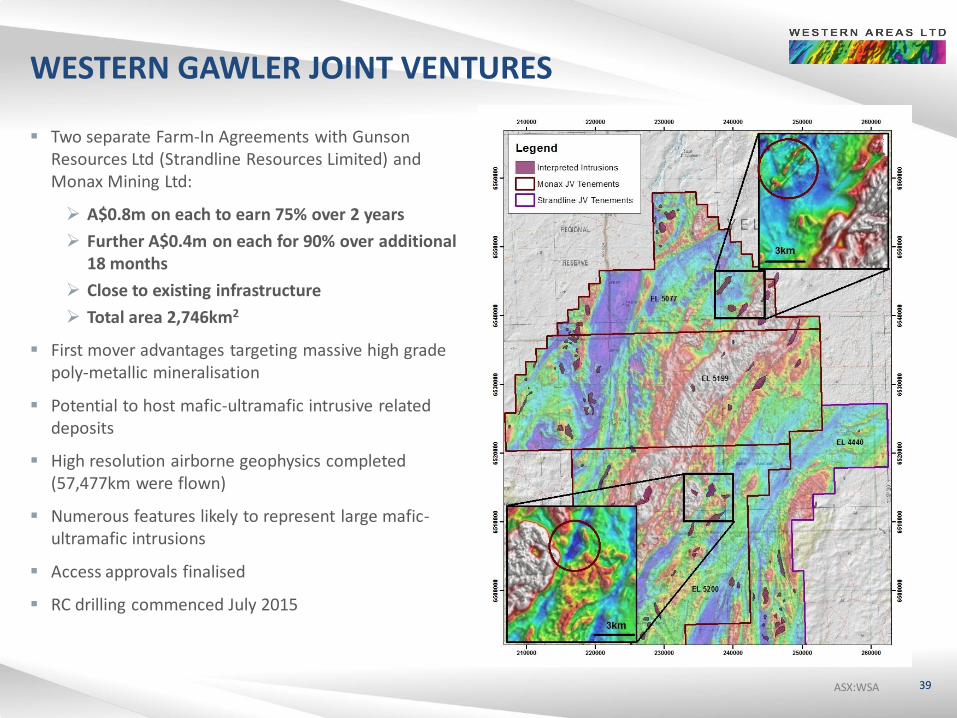
Two separate Farm-In Agreements with Gunson Resources Ltd (Strandline Resources Limited) and Monax Mining Ltd:
A$0.8m on each to earn 75% over 2 years
Further A$0.4m on each for 90% over additional 18 months
Close to existing infrastructure
Total area 2,746km2
First mover advantages targeting massive high grade poly-metallic mineralisation
Potential to host mafic-ultramafic intrusive related deposits
High resolution airborne geophysics completed (57,477km were flown)
Numerous features likely to represent large mafic-ultramafic intrusions
Access approvals finalised
RC drilling commenced July 2015
39
ASX:WSA ASX:WSA ASX:WSA
COSMOS STRATEGIC RATIONALE & SUMMARY
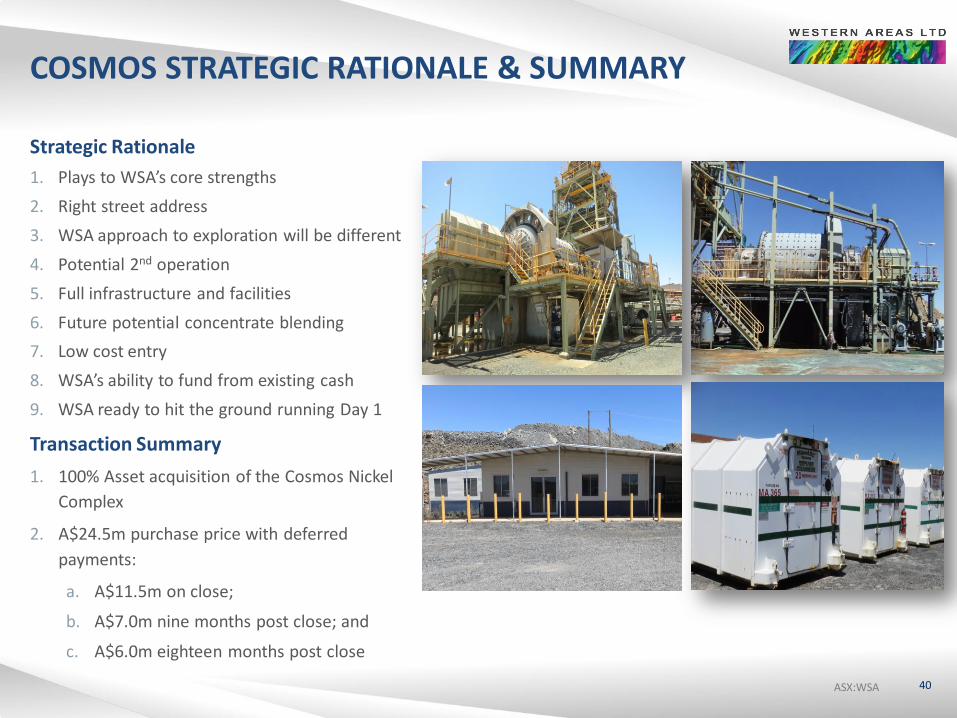
Strategic Rationale
1. Plays to WSA’s core strengths
2. Right street address
3. WSA approach to exploration will be different
4. Potential 2nd operation
5. Full infrastructure and facilities
6. Future potential concentrate blending
7. Low cost entry
8. WSA’s ability to fund from existing cash
9. WSA ready to hit the ground running Day 1
Transaction Summary
1. 100% Asset acquisition of the Cosmos Nickel
Complex
2. A$24.5m purchase price with deferred
payments:
a. A$11.5m on close;
b. A$7.0m nine months post close; and
c. A$6.0m eighteen months post close
40
ASX:WSA ASX:WSA ASX:WSA
COSMOS NICKEL COMPLEX
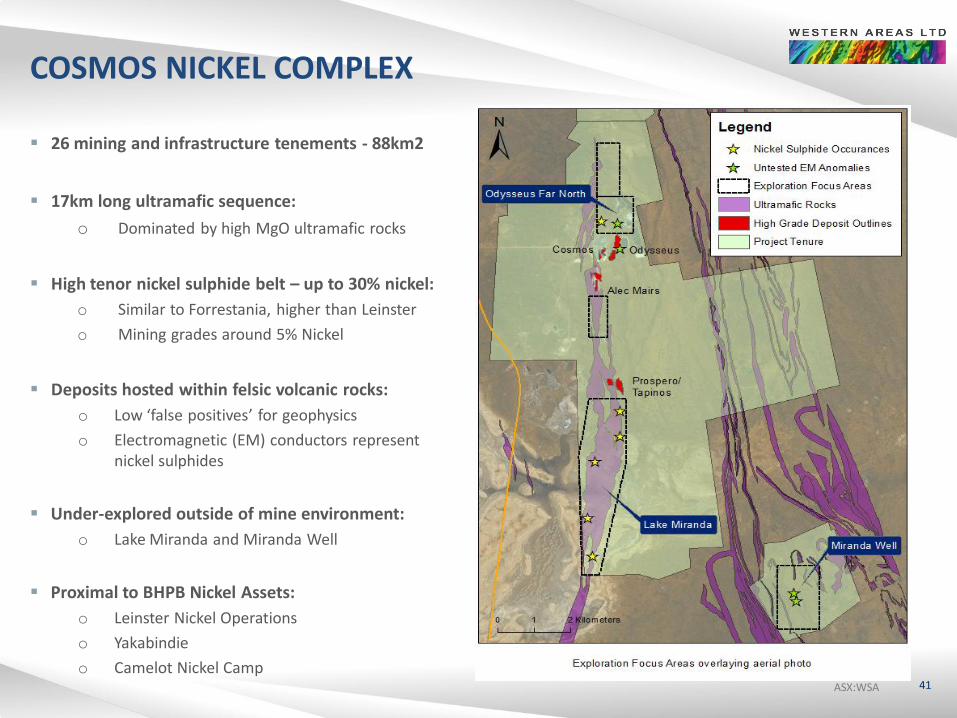
26 mining and infrastructure tenements - 88km2
17km long ultramafic sequence:
o Dominated by high MgO ultramafic rocks
High tenor nickel sulphide belt – up to 30% nickel:
o Similar to Forrestania, higher than Leinster
o Mining grades around 5% Nickel
Deposits hosted within felsic volcanic rocks:
o Low ‘false positives’ for geophysics
o Electromagnetic (EM) conductors represent nickel sulphides
Under-explored outside of mine environment:
o Lake Miranda and Miranda Well
Proximal to BHPB Nickel Assets:
o Leinster Nickel Operations
o Yakabindie
o Camelot Nickel Camp
41
ASX:WSA ASX:WSA ASX:WSA
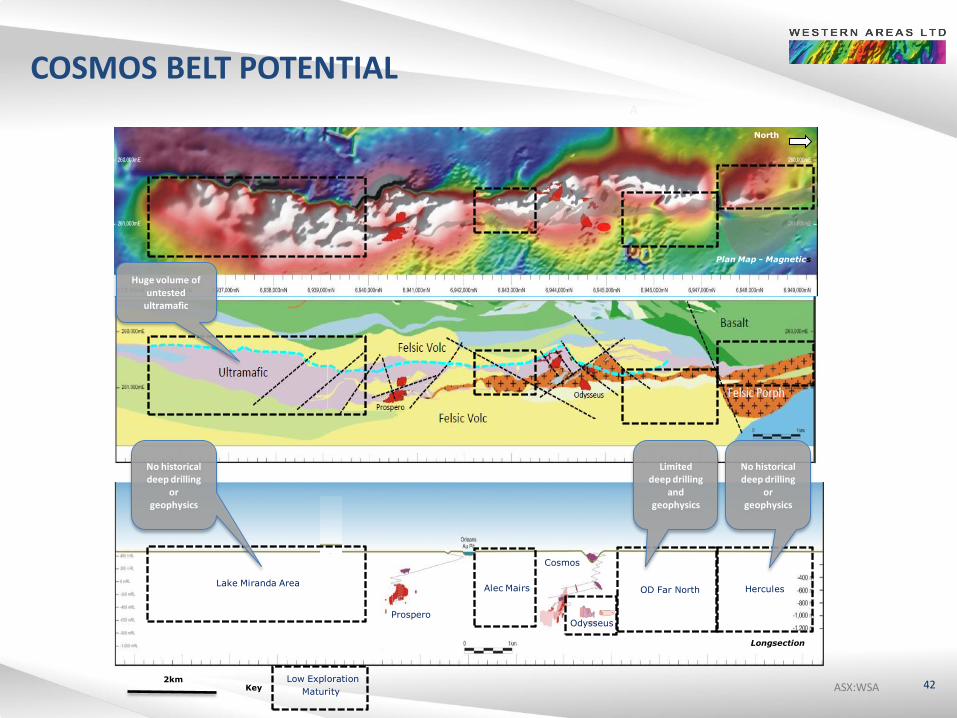
A
A
B B North
Plan Map - Magnetics
Longsection
OD Far North
Prospero
Alec Mairs Lake Miranda Area
Key
Odysseus
COSMOS BELT POTENTIAL
Low Exploration
Maturity
Cosmos
No historical deep drilling
or geophysics
Hercules
2km
Limited deep drilling
and geophysics
Huge volume of untested
ultramafic
No historical deep drilling
or geophysics
42
ASX:WSA ASX:WSA ASX:WSA
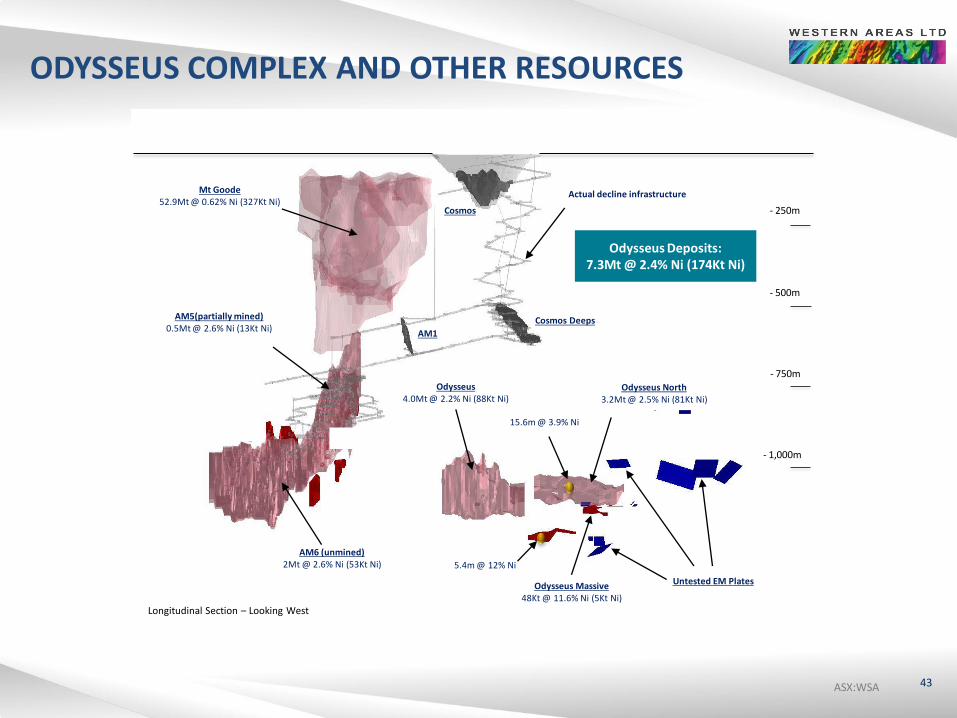
ODYSSEUS COMPLEX AND OTHER RESOURCES
Longitudinal Section – Looking West
AM6 (unmined) 2Mt @ 2.6% Ni (53Kt Ni)
Odysseus 4.0Mt @ 2.2% Ni (88Kt Ni)
Odysseus North 3.2Mt @ 2.5% Ni (81Kt Ni)
Cosmos Deeps
Cosmos
AM1
Untested EM Plates
Odysseus Deposits: 7.3Mt @ 2.4% Ni (174Kt Ni)
5.4m @ 12% Ni
15.6m @ 3.9% Ni
Odysseus Massive 48Kt @ 11.6% Ni (5Kt Ni)
Mt Goode 52.9Mt @ 0.62% Ni (327Kt Ni)
AM5(partially mined) 0.5Mt @ 2.6% Ni (13Kt Ni)
- 250m
- 500m
- 750m
- 1,000m
Actual decline infrastructure
43
ASX:WSA ASX:WSA ASX:WSA ASX:WSA 44
THE END