Embed Size (px)
Citation preview

FY 2020 Results Presentation8 April 2021
Disclaimer
This presentation is based on FBN Holdings Plc’s (‘FBNH’ or ‘FBNHoldings’ or the ‘Group’) audited financial statements for the year ended 31 December 2020. TheGroup’s Financial statements represent FBN Holdings Plc and its subsidiaries.
FBNHoldings has obtained some information from sources it believes to be credible. Although FBNHoldings has taken all reasonable care to ensure that all information hereinis accurate and correct, FBNHoldings makes no representation or warranty, express or implied, as to the accuracy, correctness or completeness of the information. In addition,some of the information in this presentation may be condensed or incomplete and this presentation may not contain all material information in respect of FBNHoldings.
This presentation contains forward-looking statements which reflect management's expectations regarding the Group’s future growth, results of operations, performance,business prospects and opportunities. Wherever possible, words such as “anticipate”, “believe”, “expect”, “intend”, “estimate”, “project”, “target”, “risk”, “goal” and similarterms and phrases have been used to identify the forward-looking statements. These statements reflect management's current beliefs and are based on information currentlyavailable to the management. Certain material factors or assumptions have been applied in drawing the conclusions contained in the forward-looking statements. Thesefactors or assumptions are subject to inherent risks and uncertainties surrounding future expectations generally.
FBNHoldings cautions readers that a number of factors could cause actual results, performances or achievements to differ materially from the results discussed or implied inthe forward-looking statements. These factors should be considered carefully, and undue reliance should not be placed on the forward-looking statements. For additionalinformation with respect to certain risks or factors, reference should be made to the Group’s continuous disclosure materials filed from time to time with the Nigerian StockExchange and other relevant regulatory authorities. The Group disclaims any intention or obligation to update or revise any forward-looking statements, whether as a result ofnew information, future events or otherwise.

Key Highlights 04
Financial Performance 10
Sustainability Priorities 21
Outlook 23
Appendix 25

Key Highlights
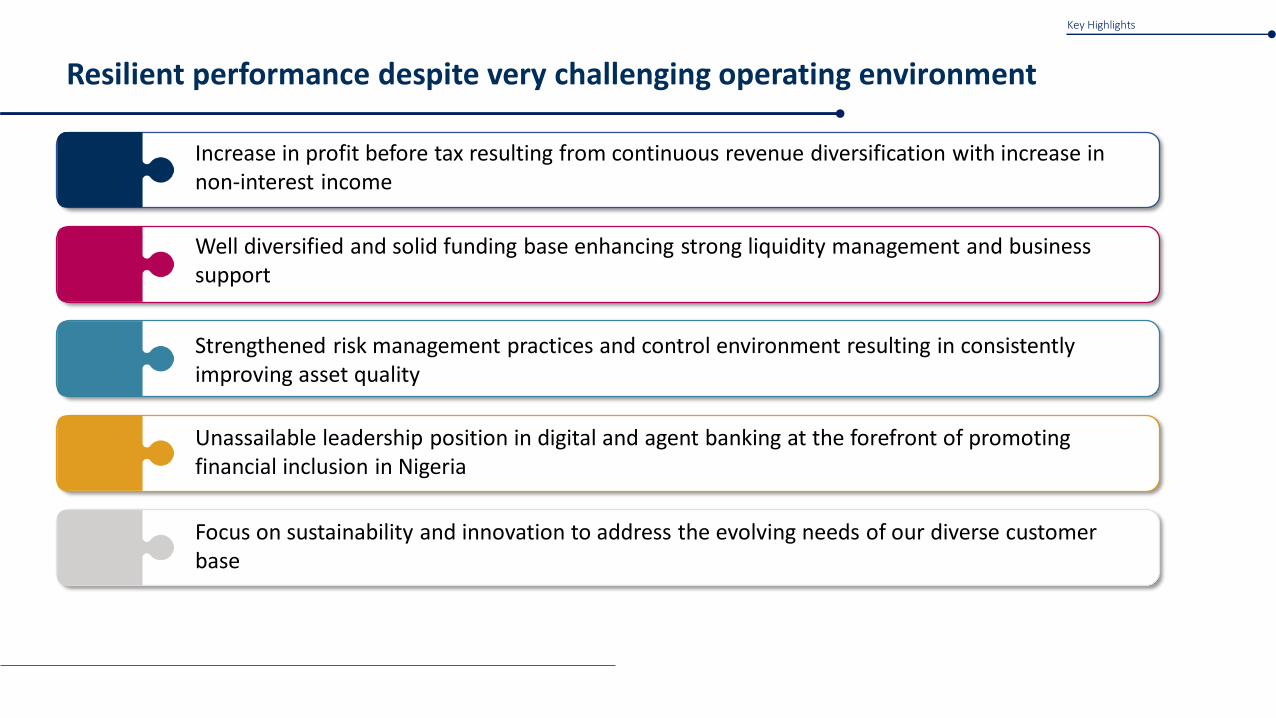
Resilient performance despite very challenging operating environment
Increase in profit before tax resulting from continuous revenue diversification with increase in non-interest income
Well diversified and solid funding base enhancing strong liquidity management and business support
Strengthened risk management practices and control environment resulting in consistently improving asset quality
Unassailable leadership position in digital and agent banking at the forefront of promoting financial inclusion in Nigeria
Focus on sustainability and innovation to address the evolving needs of our diverse customer base
Key Highlights
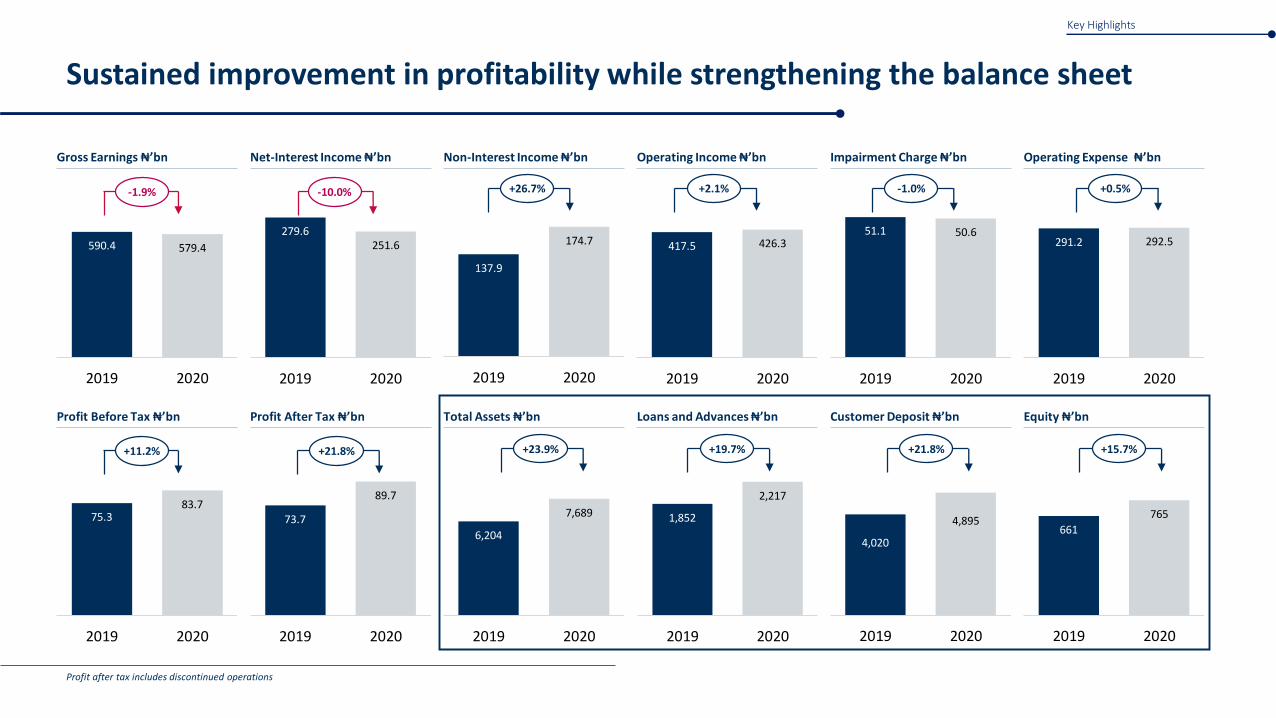
Net-Interest Income ₦’bn
279.6251.6
2019 2020
Sustained improvement in profitability while strengthening the balance sheet
Gross Earnings ₦’bn
590.4 579.4
2019 2020
Profit Before Tax ₦’bn
75.383.7
2019 2020
Operating Income ₦’bn
417.5 426.3
2019 2020
Total Assets ₦’bn
6,204
7,689
2019 2020
Non-Interest Income ₦’bn
137.9
174.7
2019 2020
Profit After Tax ₦’bn
73.7
89.7
2019 2020
Impairment Charge ₦’bn
51.1 50.6
2019 2020
Loans and Advances ₦’bn
1,852
2,217
2019 2020
Operating Expense ₦’bn
291.2 292.5
2019 2020
Customer Deposit ₦’bn
4,020
4,895
2019 2020
Equity ₦’bn
661
765
2019 2020
-10.0%-1.9% +26.7% +2.1% -1.0% +0.5%
+11.2% +21.8% +23.9% +19.7% +21.8% +15.7%
Key Highlights
Profit after tax includes discontinued operations
Net Interest Margin (%)
7.4
6.1
2019 2020
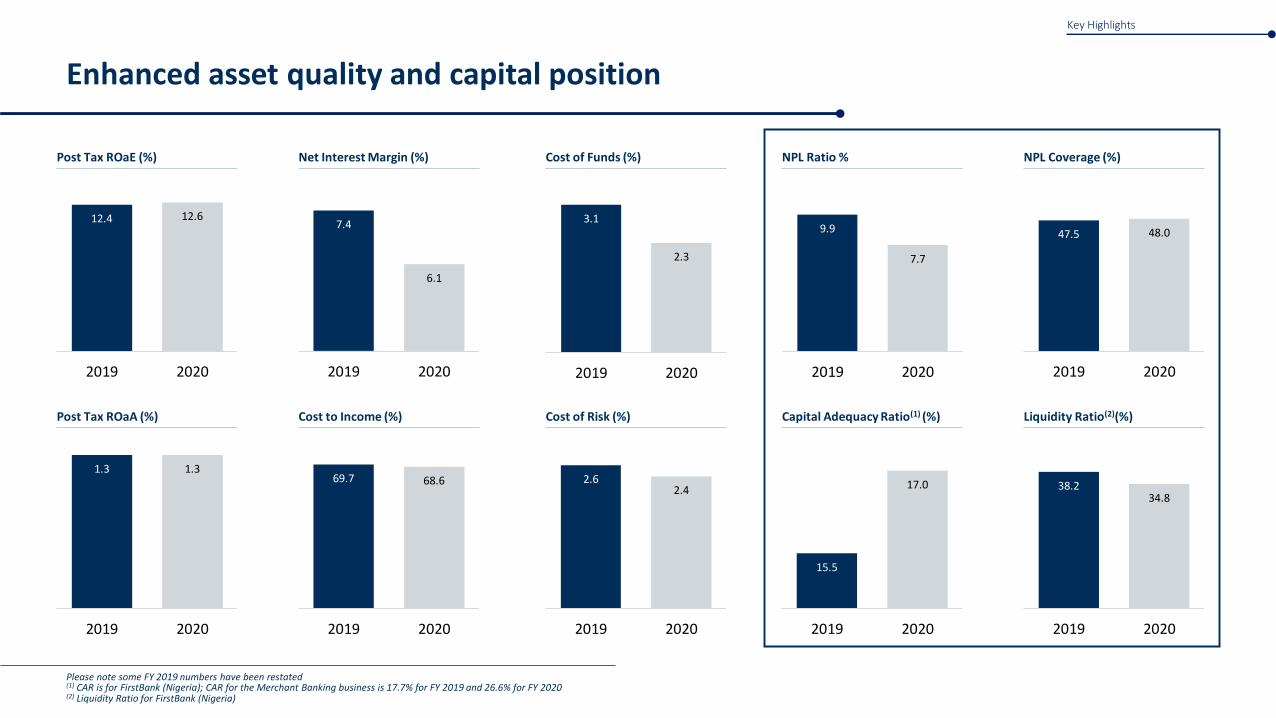
Enhanced asset quality and capital position
Post Tax ROaE (%)
12.4 12.6
2019 2020
Post Tax ROaA (%)
1.3 1.3
2019 2020
NPL Ratio %
9.9
7.7
2019 2020
Cost of Risk (%)
2.62.4
2019 2020
Cost of Funds (%)
3.1
2.3
2019 2020
Cost to Income (%)
69.7 68.6
2019 2020
Capital Adequacy Ratio(1) (%)
15.5
17.0
2019 2020
NPL Coverage (%)
47.5 48.0
2019 2020
Liquidity Ratio(2)(%)
38.234.8
2019 2020
Key Highlights
Please note some FY 2019 numbers have been restated(1) CAR is for FirstBank (Nigeria); CAR for the Merchant Banking business is 17.7% for FY 2019 and 26.6% for FY 2020(2) Liquidity Ratio for FirstBank (Nigeria)
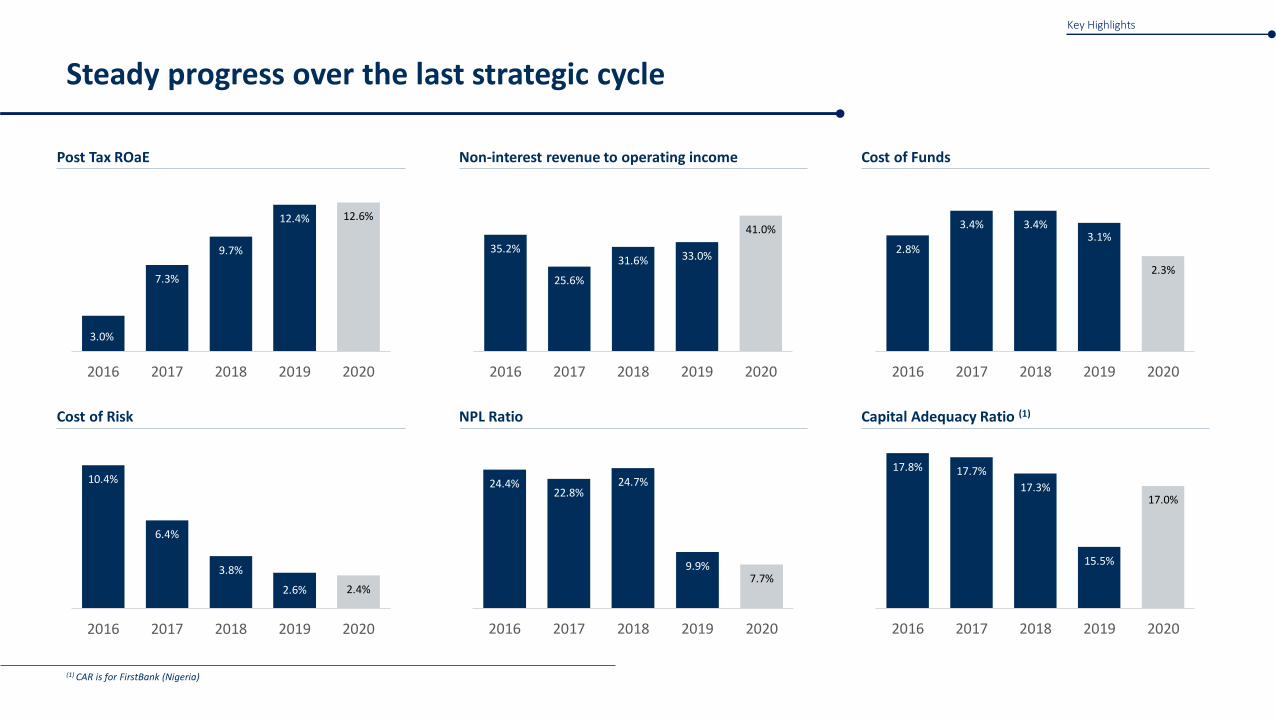
Steady progress over the last strategic cycle
(1) CAR is for FirstBank (Nigeria)
3.0%
7.3%
9.7%
12.4% 12.6%
2016 2017 2018 2019 2020
35.2%
25.6%
31.6% 33.0%
41.0%
2016 2017 2018 2019 2020
2.8%
3.4% 3.4%3.1%
2.3%
2016 2017 2018 2019 2020
10.4%
6.4%
3.8%
2.6% 2.4%
2016 2017 2018 2019 2020
24.4%22.8%
24.7%
9.9%7.7%
2016 2017 2018 2019 2020
17.8% 17.7%
17.3%
15.5%
17.0%
2016 2017 2018 2019 2020
Non-interest revenue to operating income Post Tax ROaE
Cost of Risk NPL Ratio
Cost of Funds
Capital Adequacy Ratio (1)
Key Highlights
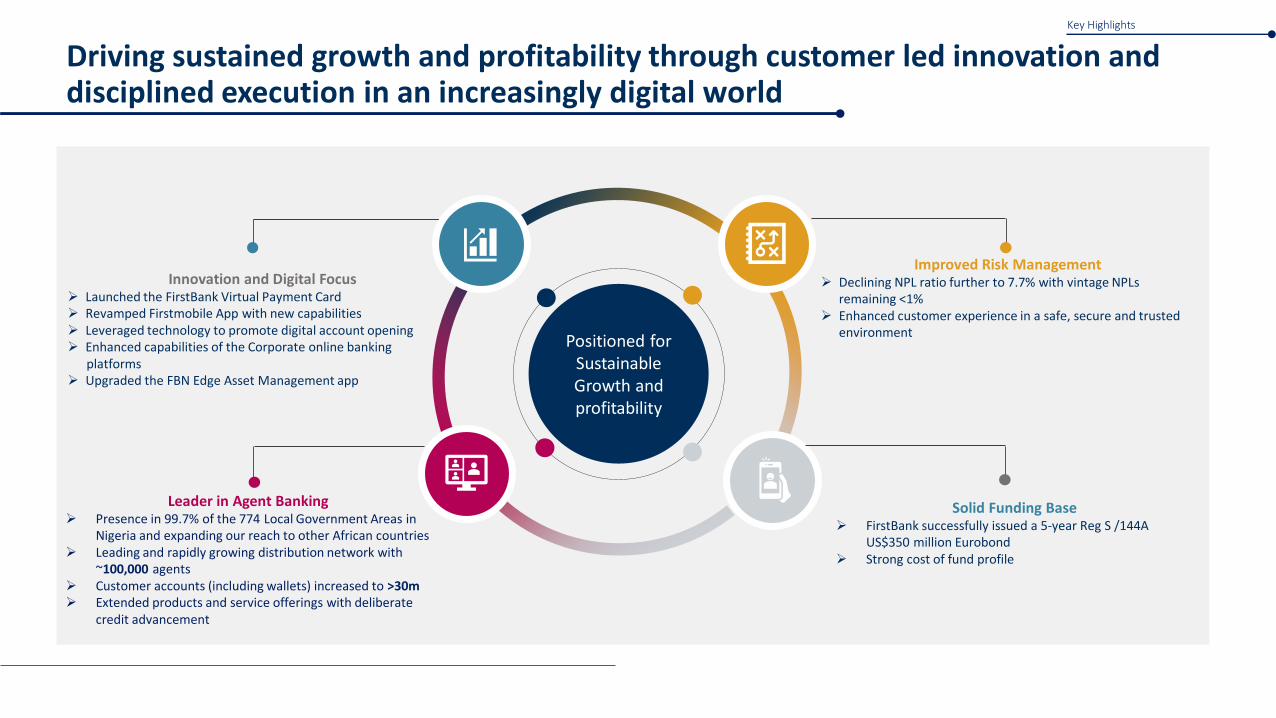
Driving sustained growth and profitability through customer led innovation and disciplined execution in an increasingly digital world
Solid Funding Base➢ FirstBank successfully issued a 5-year Reg S /144A
US$350 million Eurobond ➢ Strong cost of fund profile
Leader in Agent Banking➢ Presence in 99.7% of the 774 Local Government Areas in
Nigeria and expanding our reach to other African countries ➢ Leading and rapidly growing distribution network with
~100,000 agents➢ Customer accounts (including wallets) increased to >30m ➢ Extended products and service offerings with deliberate
credit advancement
Innovation and Digital Focus➢ Launched the FirstBank Virtual Payment Card ➢ Revamped Firstmobile App with new capabilities➢ Leveraged technology to promote digital account opening ➢ Enhanced capabilities of the Corporate online banking
platforms➢ Upgraded the FBN Edge Asset Management app
Improved Risk Management➢ Declining NPL ratio further to 7.7% with vintage NPLs
remaining <1%➢ Enhanced customer experience in a safe, secure and trusted
environmentPositioned for
Sustainable Growth and profitability
Key Highlights

Financial Review
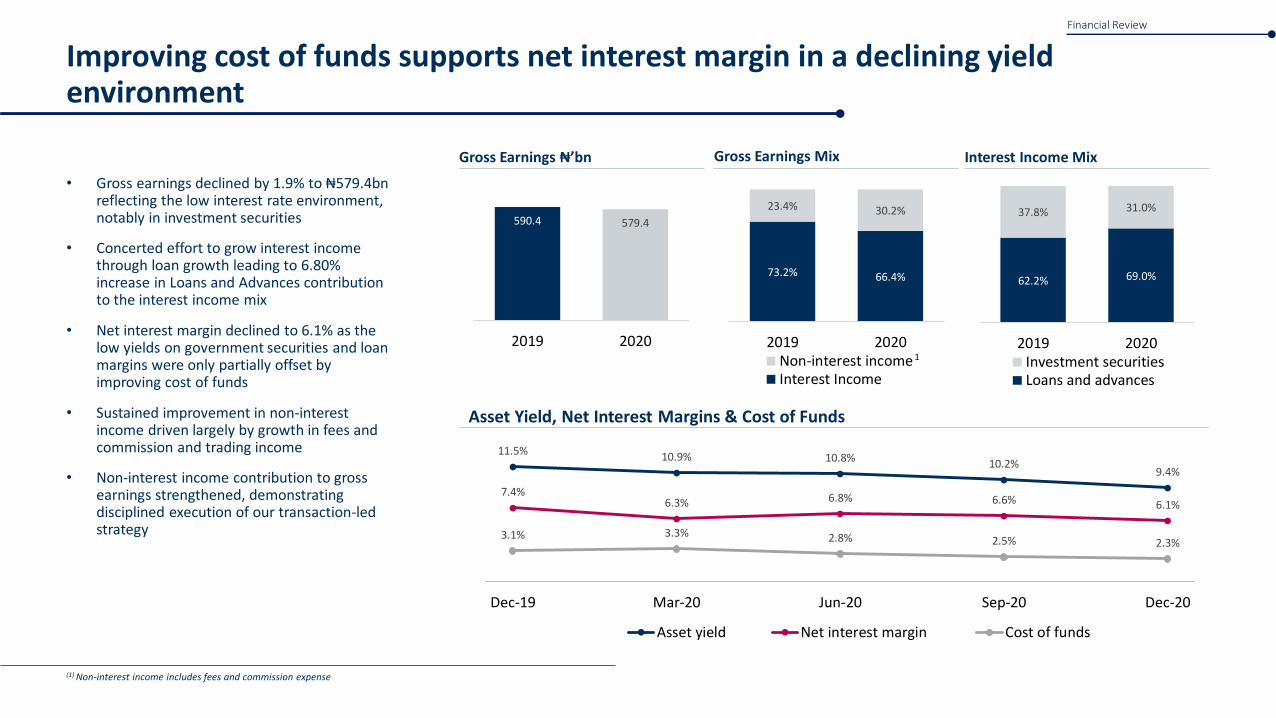
Improving cost of funds supports net interest margin in a declining yield environment
• Gross earnings declined by 1.9% to ₦579.4bn reflecting the low interest rate environment, notably in investment securities
• Concerted effort to grow interest income through loan growth leading to 6.80% increase in Loans and Advances contribution to the interest income mix
• Net interest margin declined to 6.1% as the low yields on government securities and loan margins were only partially offset by improving cost of funds
• Sustained improvement in non-interest income driven largely by growth in fees and commission and trading income
• Non-interest income contribution to gross earnings strengthened, demonstrating disciplined execution of our transaction-led strategy
Gross Earnings ₦’bn
590.4 579.4
2019 2020
Interest Income Mix
62.2% 69.0%
37.8% 31.0%
2019 2020Investment securitiesLoans and advances
Gross Earnings Mix
73.2% 66.4%
23.4% 30.2%
2019 2020Non-interest incomeInterest Income
Asset Yield, Net Interest Margins & Cost of Funds
11.5% 10.9% 10.8% 10.2%9.4%
7.4%6.3% 6.8% 6.6% 6.1%
3.1% 3.3% 2.8% 2.5% 2.3%
0.0%
2.0%
4.0%
6.0%
8.0%
10.0%
12.0%
Dec-19 Mar-20 Jun-20 Sep-20 Dec-20
Asset yield Net interest margin Cost of funds
(1) Non-interest income includes fees and commission expense
Financial Review
1
Robust non-interest income supported by improving fees and commission
(1) Others include commission on bonds and guarantees, custodian fees, financial advisory fees, fund management fees, brokerage and Intermediations, other fees and commissions, trust fee income
Non-interest Breakdown Net (₦’bn)
82.9 93.8
47.6
73.3 7.4
7.6
2019 2020
Other
Net gains on investment securities
Net fees & commission
Fees & Commission Breakdown Gross (₦’bn)
48.0 48.7
13.3 12.8
6.4 11.94.9
9.67.8
9.2
23.021.0
2019 2020
E-banking Account Maintence
LoC commission & fees Credit related fees
Remittances Others (1)
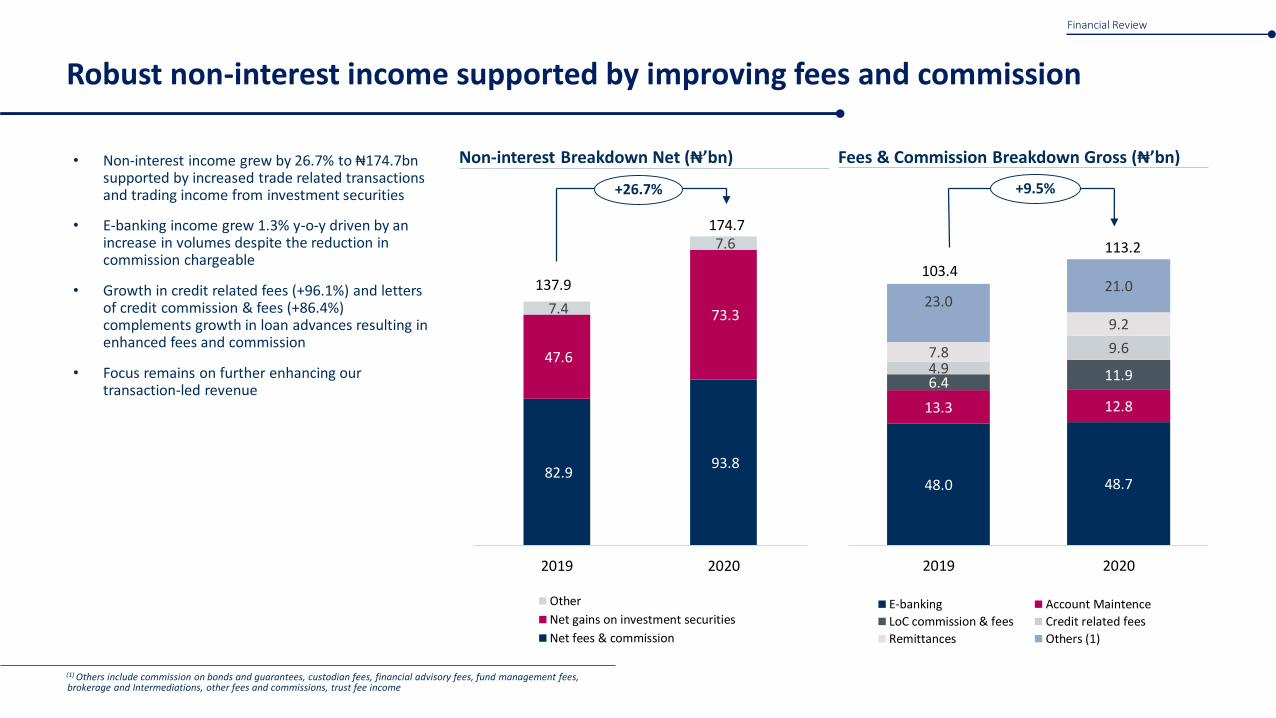
• Non-interest income grew by 26.7% to ₦174.7bn supported by increased trade related transactions and trading income from investment securities
• E-banking income grew 1.3% y-o-y driven by an increase in volumes despite the reduction in commission chargeable
• Growth in credit related fees (+96.1%) and letters of credit commission & fees (+86.4%) complements growth in loan advances resulting in enhanced fees and commission
• Focus remains on further enhancing our transaction-led revenue
+9.5%
103.4
113.2
137.9
174.7
Financial Review
+26.7%
Controlled opex growth despite high inflationary environment and currency devaluation
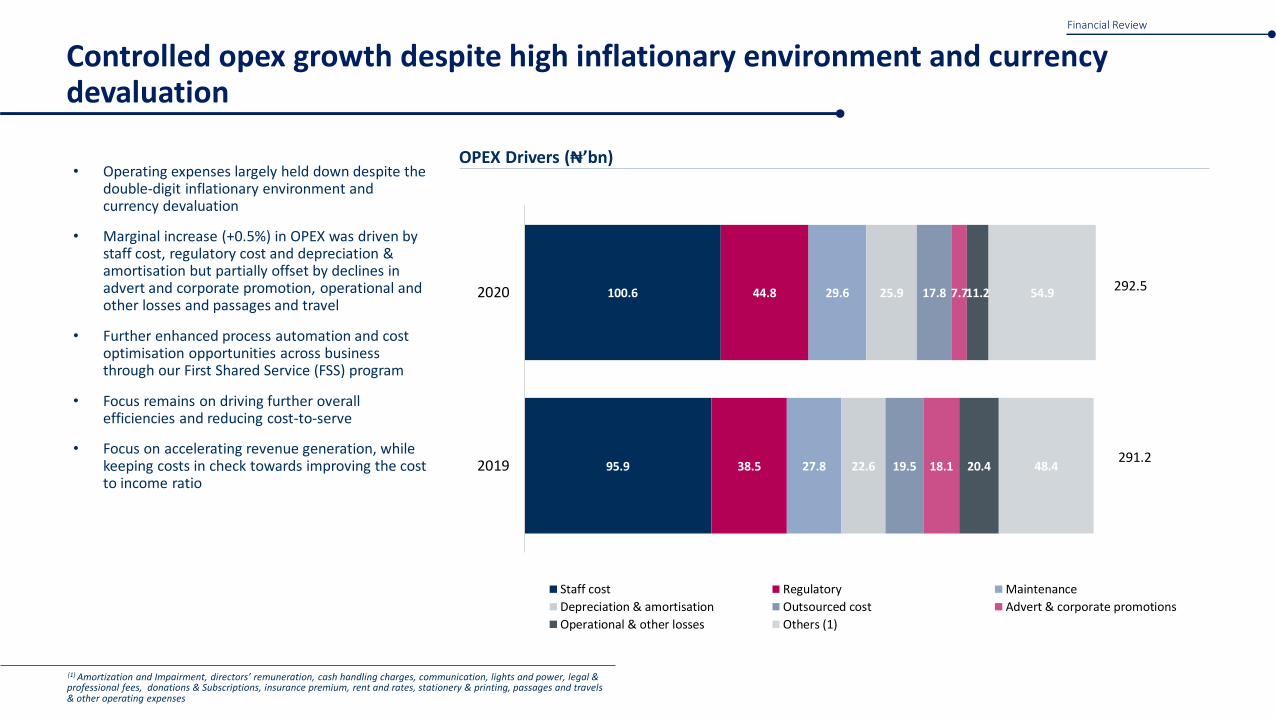
• Operating expenses largely held down despite the double-digit inflationary environment and currency devaluation
• Marginal increase (+0.5%) in OPEX was driven by staff cost, regulatory cost and depreciation & amortisation but partially offset by declines in advert and corporate promotion, operational and other losses and passages and travel
• Further enhanced process automation and cost optimisation opportunities across business through our First Shared Service (FSS) program
• Focus remains on driving further overall efficiencies and reducing cost-to-serve
• Focus on accelerating revenue generation, while keeping costs in check towards improving the cost to income ratio
OPEX Drivers (₦’bn)
95.9
100.6
38.5
44.8
27.8
29.6
22.6
25.9
19.5
17.8
18.1
7.7
20.4
11.2
48.4
54.9
2019
2020
Staff cost Regulatory Maintenance
Depreciation & amortisation Outsourced cost Advert & corporate promotions
Operational & other losses Others (1)
292.5
291.2
(1) Amortization and Impairment, directors’ remuneration, cash handling charges, communication, lights and power, legal & professional fees, donations & Subscriptions, insurance premium, rent and rates, stationery & printing, passages and travels& other operating expenses
Financial Review
Enhancing our digital offering to meet the needs of our customers
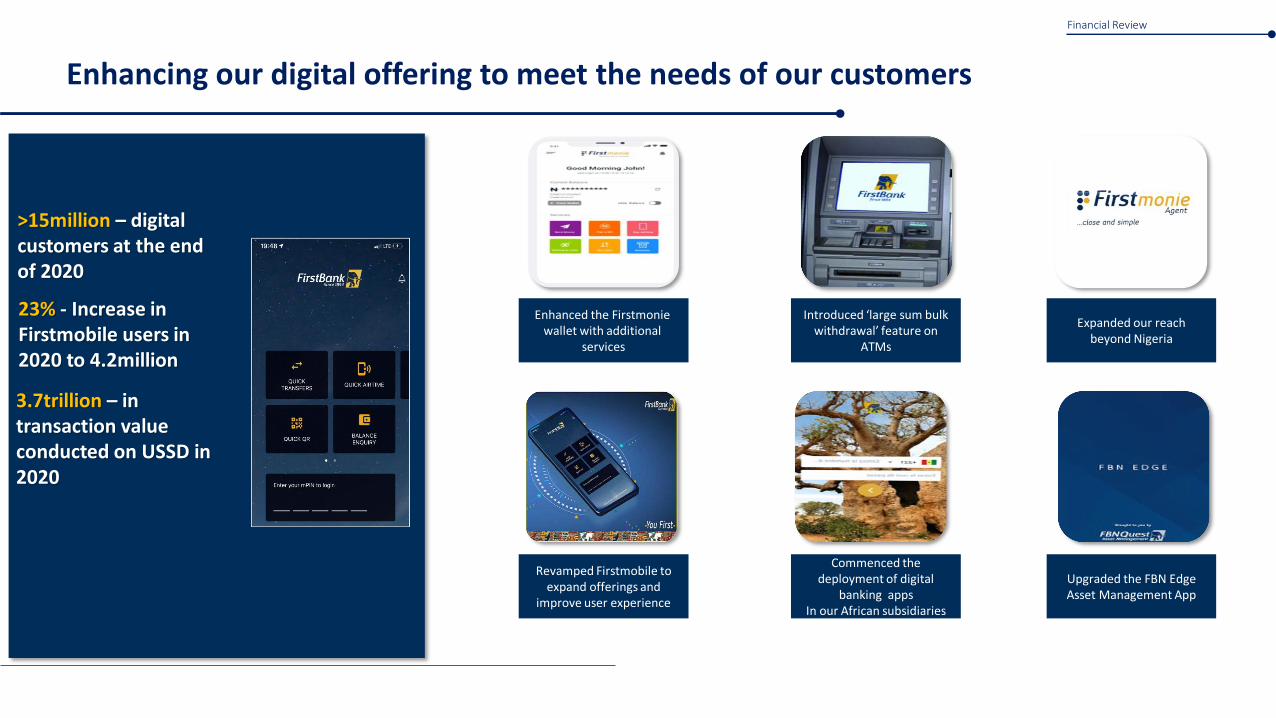
Commenced the deployment of digital
banking appsIn our African subsidiaries
Enhanced the Firstmoniewallet with additional
services
Revamped Firstmobile to expand offerings and
improve user experience
Introduced ‘large sum bulk withdrawal’ feature on
ATMs
Expanded our reach beyond Nigeria
>15million – digital customers at the end of 2020
23% - Increase in Firstmobile users in 2020 to 4.2million
3.7trillion – in transaction value conducted on USSD in 2020
Financial Review
Upgraded the FBN Edge Asset Management App
Monetising our leadership position in digital solutions
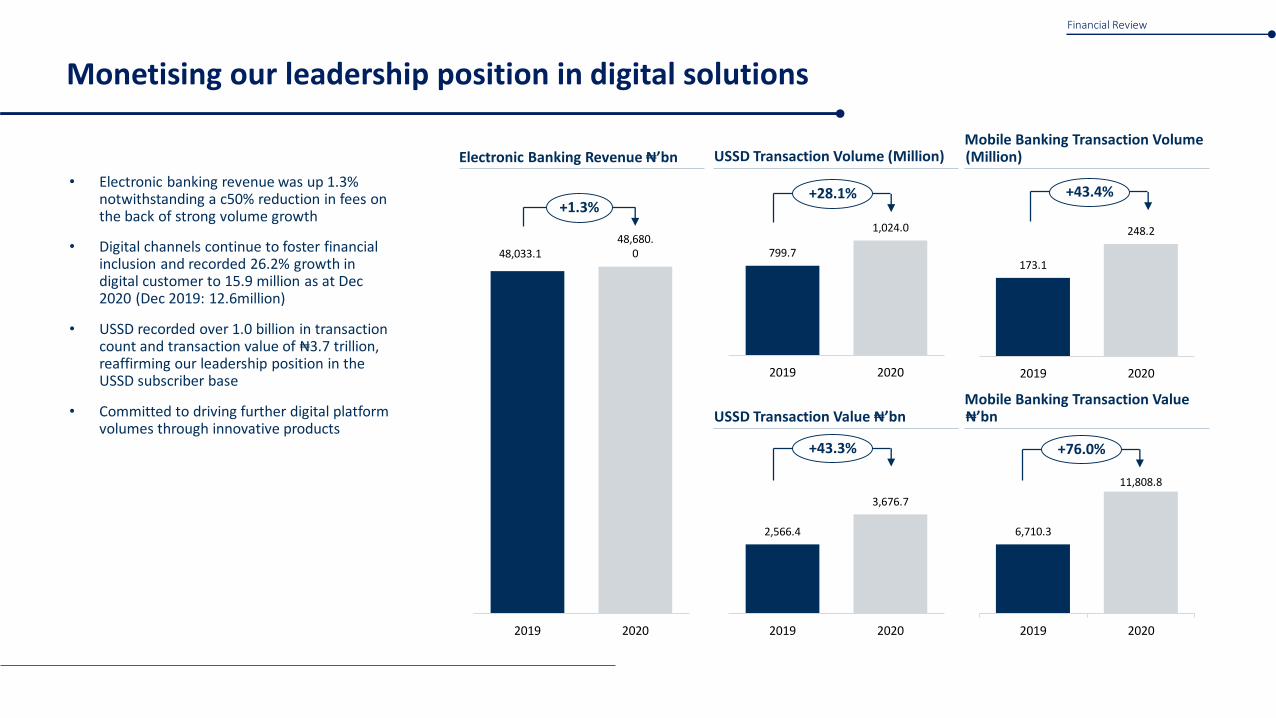
• Electronic banking revenue was up 1.3% notwithstanding a c50% reduction in fees on the back of strong volume growth
• Digital channels continue to foster financial inclusion and recorded 26.2% growth in digital customer to 15.9 million as at Dec 2020 (Dec 2019: 12.6million)
• USSD recorded over 1.0 billion in transaction count and transaction value of ₦3.7 trillion, reaffirming our leadership position in the USSD subscriber base
• Committed to driving further digital platform volumes through innovative products
Electronic Banking Revenue ₦’bn
48,033.148,680.
0
2019 2020
Mobile Banking Transaction Volume (Million)
173.1
248.2
2019 2020
USSD Transaction Volume (Million)
799.7
1,024.0
2019 2020
Mobile Banking Transaction Value ₦’bn
6,710.3
11,808.8
2019 2020
USSD Transaction Value ₦’bn
2,566.4
3,676.7
2019 2020
+1.3%+28.1% +43.4%
+43.3% +76.0%
Financial Review
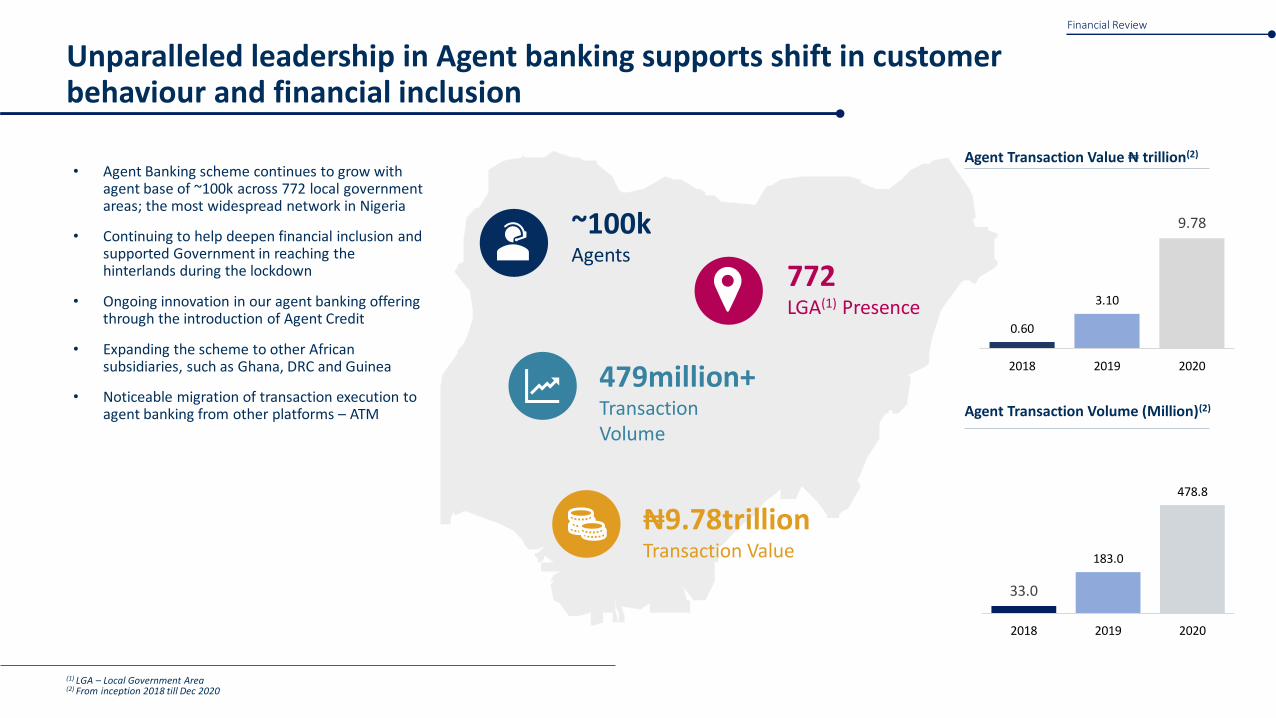
Unparalleled leadership in Agent banking supports shift in customer behaviour and financial inclusion
• Agent Banking scheme continues to grow with agent base of ~100k across 772 local government areas; the most widespread network in Nigeria
• Continuing to help deepen financial inclusion and supported Government in reaching the hinterlands during the lockdown
• Ongoing innovation in our agent banking offering through the introduction of Agent Credit
• Expanding the scheme to other African subsidiaries, such as Ghana, DRC and Guinea
• Noticeable migration of transaction execution to agent banking from other platforms – ATM
Agent Transaction Value ₦ trillion(2)
Agent Transaction Volume (Million)(2)
33.0
183.0
478.8
2018 2019 2020
(1) LGA – Local Government Area(2) From inception 2018 till Dec 2020
~100kAgents
772 LGA(1) Presence
479million+Transaction Volume
₦9.78trillionTransaction Value
Financial Review
0.60
3.10
9.78
2018 2019 2020
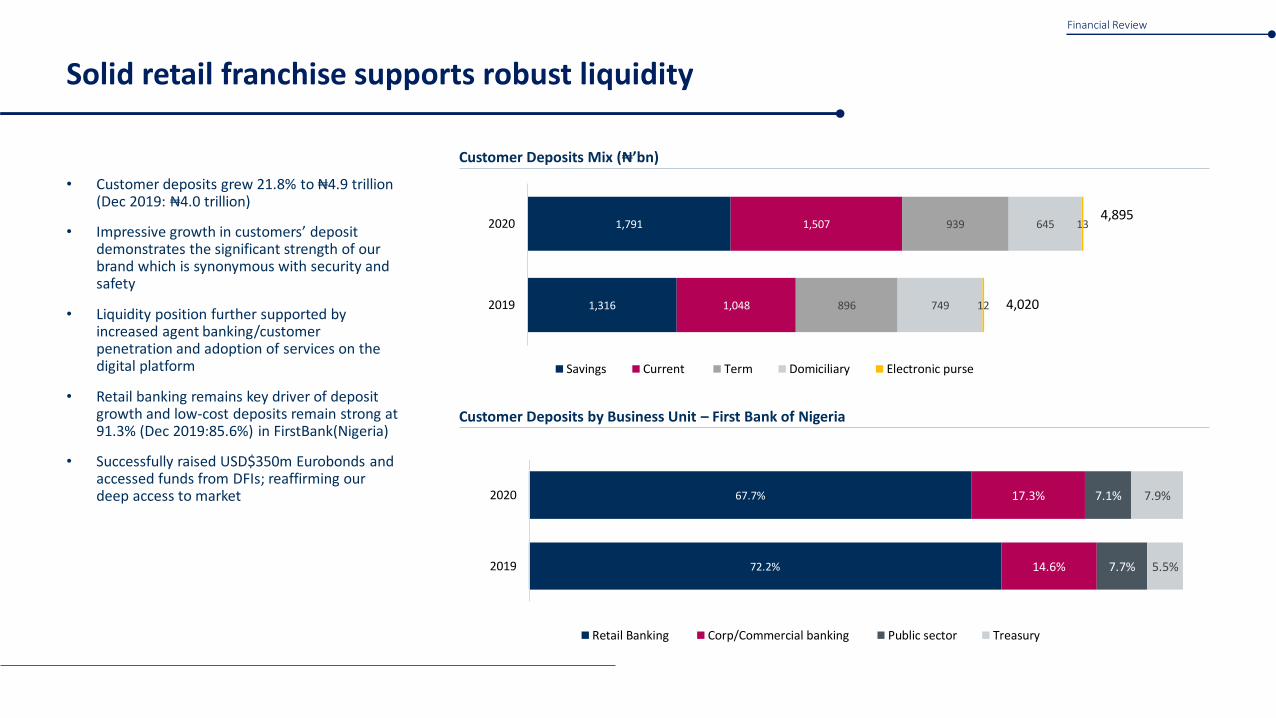
Solid retail franchise supports robust liquidity
• Customer deposits grew 21.8% to ₦4.9 trillion (Dec 2019: ₦4.0 trillion)
• Impressive growth in customers’ deposit demonstrates the significant strength of our brand which is synonymous with security and safety
• Liquidity position further supported by increased agent banking/customer penetration and adoption of services on the digital platform
• Retail banking remains key driver of deposit growth and low-cost deposits remain strong at 91.3% (Dec 2019:85.6%) in FirstBank(Nigeria)
• Successfully raised USD$350m Eurobonds and accessed funds from DFIs; reaffirming our deep access to market
Customer Deposits Mix (₦’bn)
Customer Deposits by Business Unit – First Bank of Nigeria
72.2%
67.7%
14.6%
17.3%
7.7%
7.1%
5.5%
7.9%
2019
2020
Retail Banking Corp/Commercial banking Public sector Treasury
1,316
1,791
1,048
1,507
896
939
749
645
12
13
2019
2020
Savings Current Term Domiciliary Electronic purse
4,020
4,895
Financial Review
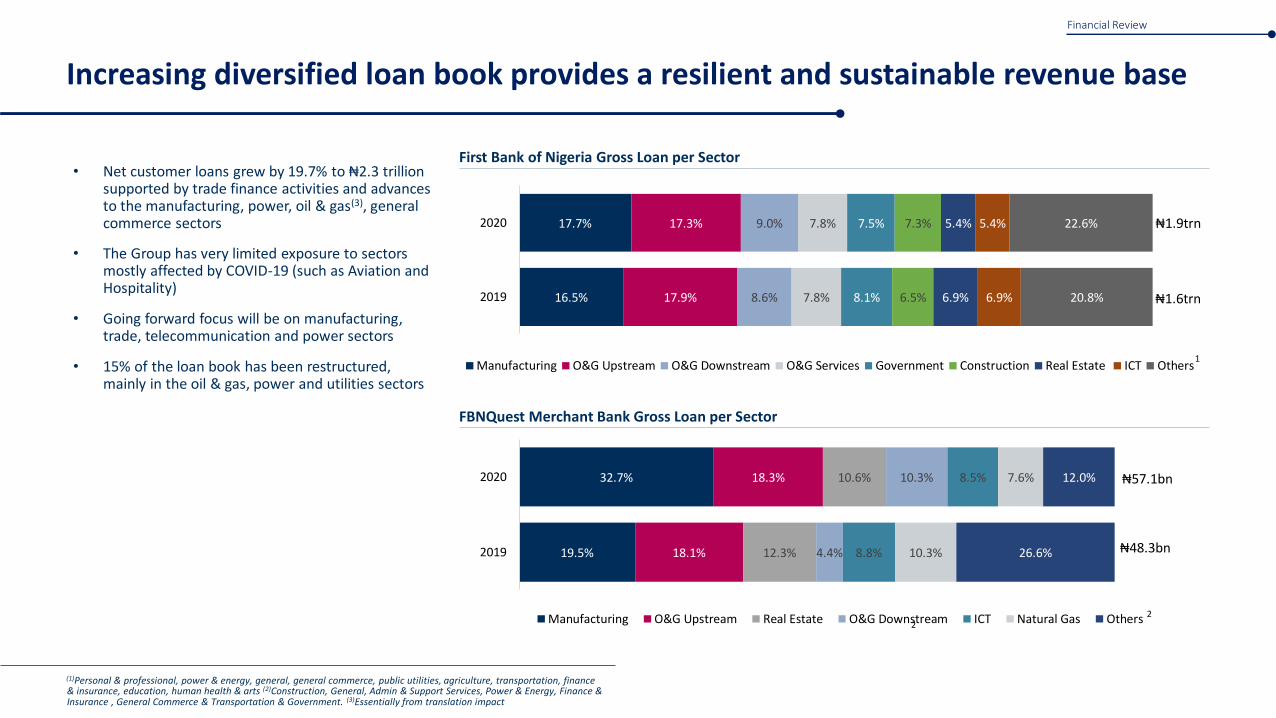
Increasing diversified loan book provides a resilient and sustainable revenue base
• Net customer loans grew by 19.7% to ₦2.3 trillion supported by trade finance activities and advances to the manufacturing, power, oil & gas(3), general commerce sectors
• The Group has very limited exposure to sectors mostly affected by COVID-19 (such as Aviation and Hospitality)
• Going forward focus will be on manufacturing, trade, telecommunication and power sectors
• 15% of the loan book has been restructured, mainly in the oil & gas, power and utilities sectors
First Bank of Nigeria Gross Loan per Sector
16.5%
17.7%
17.9%
17.3%
8.6%
9.0%
7.8%
7.8%
8.1%
7.5%
6.5%
7.3%
6.9%
5.4%
6.9%
5.4%
20.8%
22.6%
2019
2020
Manufacturing O&G Upstream O&G Downstream O&G Services Government Construction Real Estate ICT Others
₦1.9trn
₦1.6trn
1
FBNQuest Merchant Bank Gross Loan per Sector
19.5%
32.7%
18.1%
18.3%
12.3%
10.6%
4.4%
10.3%
8.8%
8.5%
10.3%
7.6%
26.6%
12.0%
2019
2020
Manufacturing O&G Upstream Real Estate O&G Downstream ICT Natural Gas Others
₦57.1bn
2
₦48.3bn
2
(1)Personal & professional, power & energy, general, general commerce, public utilities, agriculture, transportation, finance & insurance, education, human health & arts (2)Construction, General, Admin & Support Services, Power & Energy, Finance & Insurance , General Commerce & Transportation & Government. (3)Essentially from translation impact
Financial Review
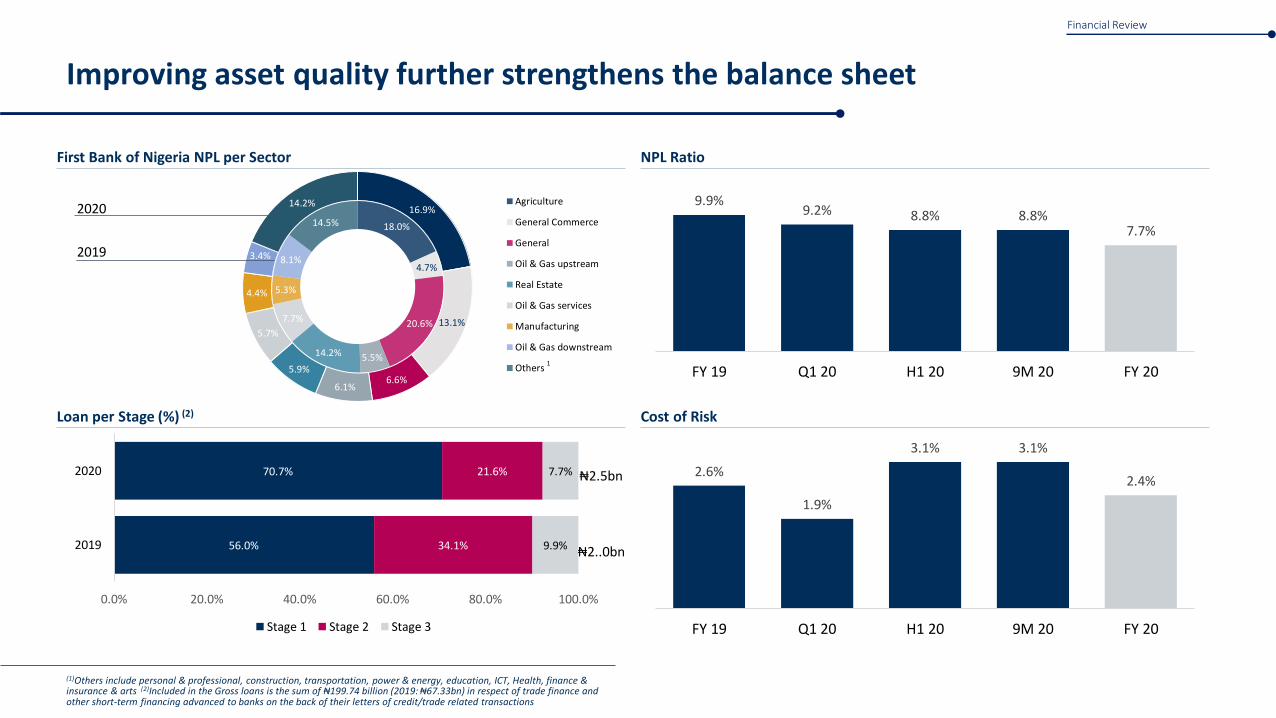
18.0%
4.7%
20.6%
5.5%14.2%
7.7%
5.3%
8.1%
14.5%16.9%
13.1%
6.6%6.1%
5.9%
5.7%
4.4%
3.4%
14.2% Agriculture
General Commerce
General
Oil & Gas upstream
Real Estate
Oil & Gas services
Manufacturing
Oil & Gas downstream
Others1
Improving asset quality further strengthens the balance sheet
First Bank of Nigeria NPL per Sector
Loan per Stage (%) (2)
NPL Ratio
Cost of Risk
56.0%
70.7%
34.1%
21.6%
9.9%
7.7%
0.0% 20.0% 40.0% 60.0% 80.0% 100.0%
2019
2020
Stage 1 Stage 2 Stage 3
₦2.5bn
₦2..0bn
Financial Review
(1)Others include personal & professional, construction, transportation, power & energy, education, ICT, Health, finance & insurance & arts (2)Included in the Gross loans is the sum of ₦199.74 billion (2019: ₦67.33bn) in respect of trade finance and other short-term financing advanced to banks on the back of their letters of credit/trade related transactions
2020
2019
2.6%
1.9%
3.1% 3.1%
2.4%
FY 19 Q1 20 H1 20 9M 20 FY 20
9.9%9.2% 8.8% 8.8%
7.7%
FY 19 Q1 20 H1 20 9M 20 FY 20
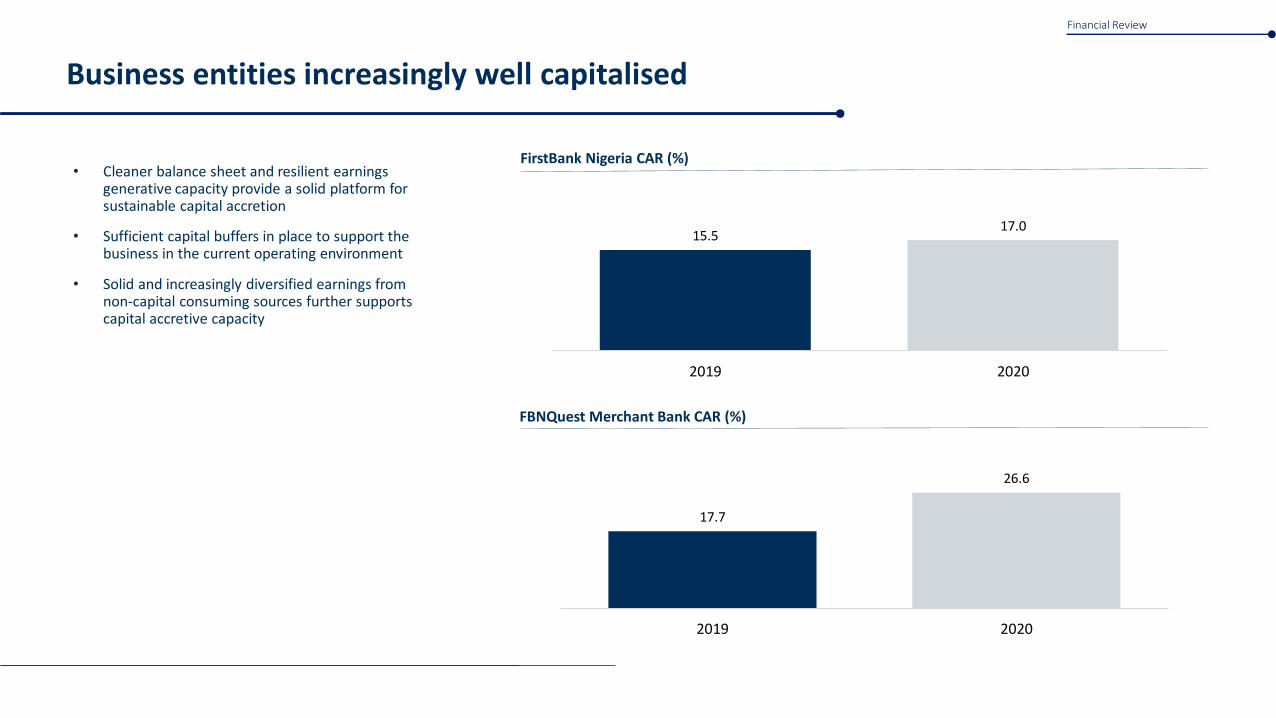
Business entities increasingly well capitalised
• Cleaner balance sheet and resilient earnings generative capacity provide a solid platform for sustainable capital accretion
• Sufficient capital buffers in place to support the business in the current operating environment
• Solid and increasingly diversified earnings from non-capital consuming sources further supports capital accretive capacity
FirstBank Nigeria CAR (%)
FBNQuest Merchant Bank CAR (%)
Financial Review
15.517.0
2019 2020
17.7
26.6
2019 2020

Sustainability Priorities
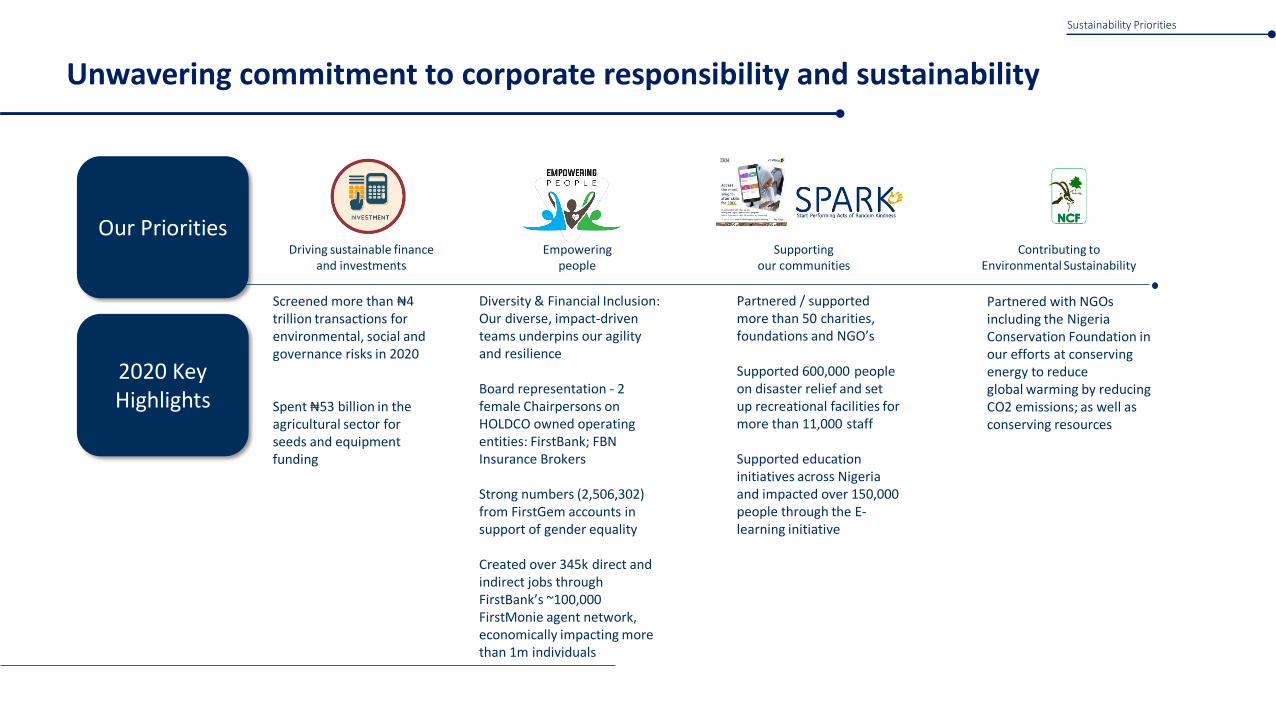
Our Priorities
Unwavering commitment to corporate responsibility and sustainability
Driving sustainable finance and investments
Empowering people
Supporting our communities
Contributing to Environmental Sustainability
Sustainability Priorities
2020 Key Highlights
Diversity & Financial Inclusion: Our diverse, impact-driven teams underpins our agility and resilience
Board representation - 2 female Chairpersons onHOLDCO owned operating entities: FirstBank; FBN Insurance Brokers
Strong numbers (2,506,302) from FirstGem accounts in support of gender equality
Created over 345k direct and indirect jobs through FirstBank’s ~100,000 FirstMonie agent network, economically impacting more than 1m individuals
Screened more than ₦4 trillion transactions for environmental, social and governance risks in 2020
Spent ₦53 billion in the agricultural sector for seeds and equipment funding
Partnered / supported more than 50 charities, foundations and NGO’s
Supported 600,000 people on disaster relief and set up recreational facilities for more than 11,000 staff
Supported educationinitiatives across Nigeria and impacted over 150,000 people through the E-learning initiative
Partnered with NGOs including the Nigeria Conservation Foundation in our efforts at conserving energy to reduceglobal warming by reducing CO2 emissions; as well as conserving resources

Outlook
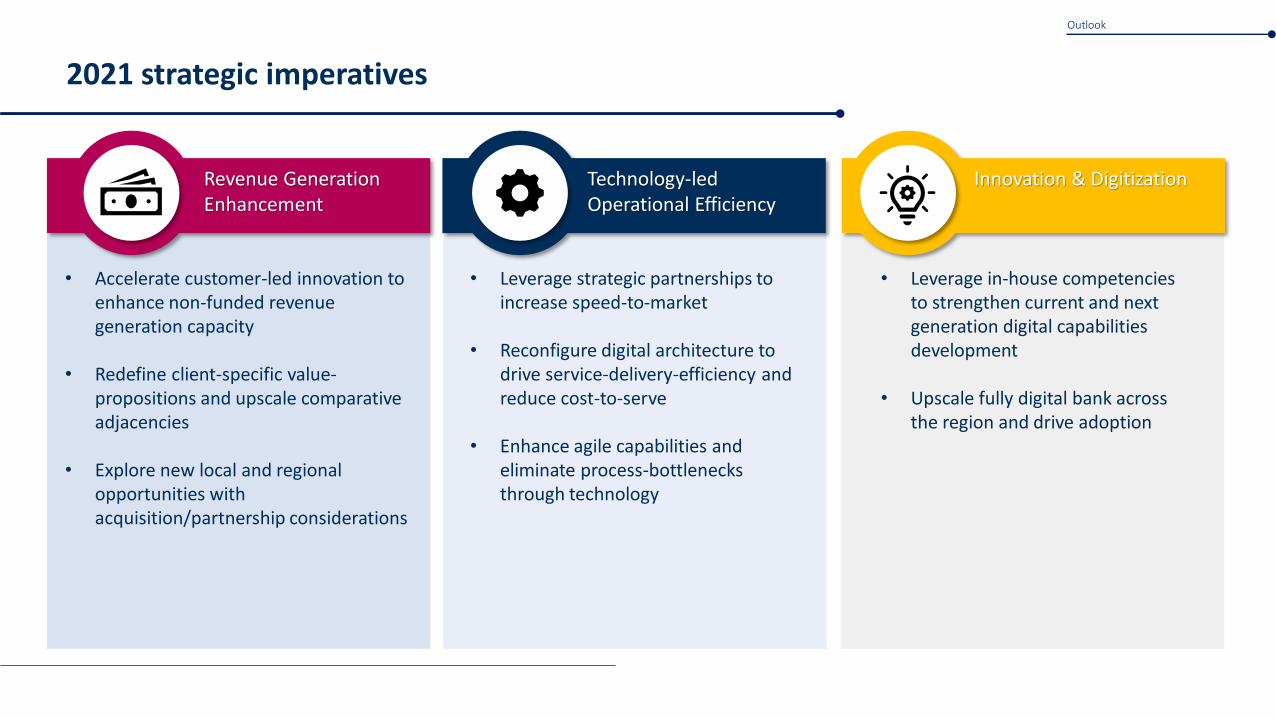
2021 strategic imperatives
Revenue Generation Enhancement
Technology-led Operational Efficiency
Innovation & Digitization
• Leverage strategic partnerships to increase speed-to-market
• Reconfigure digital architecture to drive service-delivery-efficiency and reduce cost-to-serve
• Enhance agile capabilities and eliminate process-bottlenecks through technology
• Leverage in-house competencies to strengthen current and next generation digital capabilities development
• Upscale fully digital bank across the region and drive adoption
• Accelerate customer-led innovation to enhance non-funded revenue generation capacity
• Redefine client-specific value-propositions and upscale comparative adjacencies
• Explore new local and regional opportunities with acquisition/partnership considerations
Outlook

Appendix
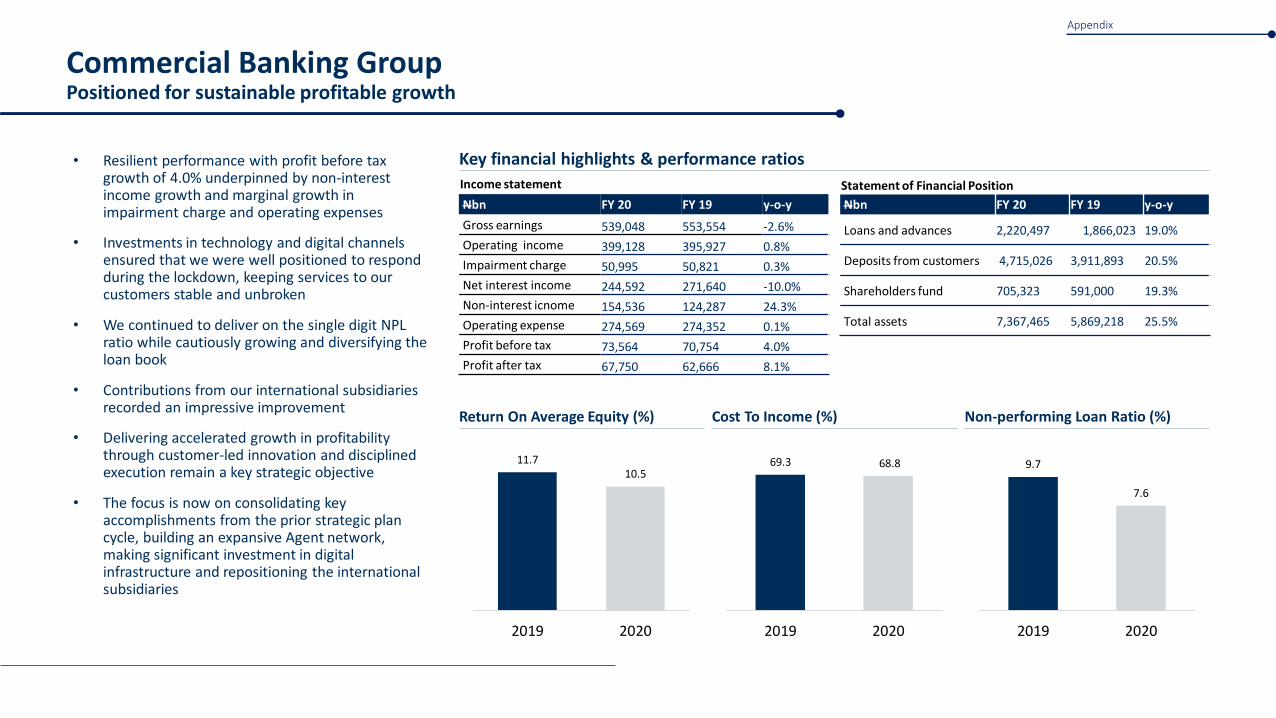
Key financial highlights & performance ratios
Income statement
Nbn FY 20 FY 19 y-o-y
Gross earnings 539,048 553,554 -2.6%
Operating income 399,128 395,927 0.8%
Impairment charge 50,995 50,821 0.3%
Net interest income 244,592 271,640 -10.0%
Non-interest icnome 154,536 124,287 24.3%
Operating expense 274,569 274,352 0.1%
Profit before tax 73,564 70,754 4.0%
Profit after tax 67,750 62,666 8.1%
Commercial Banking GroupPositioned for sustainable profitable growth
Return On Average Equity (%)
11.710.5
2019 2020
Non-performing Loan Ratio (%)
9.7
7.6
2019 2020
Cost To Income (%)
69.3 68.8
2019 2020
AHA
Statement of Financial Position
Nbn FY 20 FY 19 y-o-y
Loans and advances 2,220,497 1,866,023 19.0%
Deposits from customers 4,715,026 3,911,893 20.5%
Shareholders fund 705,323 591,000 19.3%
Total assets 7,367,465 5,869,218 25.5%
• Resilient performance with profit before tax growth of 4.0% underpinned by non-interest income growth and marginal growth in impairment charge and operating expenses
• Investments in technology and digital channels ensured that we were well positioned to respond during the lockdown, keeping services to our customers stable and unbroken
• We continued to deliver on the single digit NPL ratio while cautiously growing and diversifying the loan book
• Contributions from our international subsidiaries recorded an impressive improvement
• Delivering accelerated growth in profitability through customer-led innovation and disciplined execution remain a key strategic objective
• The focus is now on consolidating key accomplishments from the prior strategic plan cycle, building an expansive Agent network, making significant investment in digital infrastructure and repositioning the international subsidiaries
Appendix
Key Financial Highlights & Performance Ratios
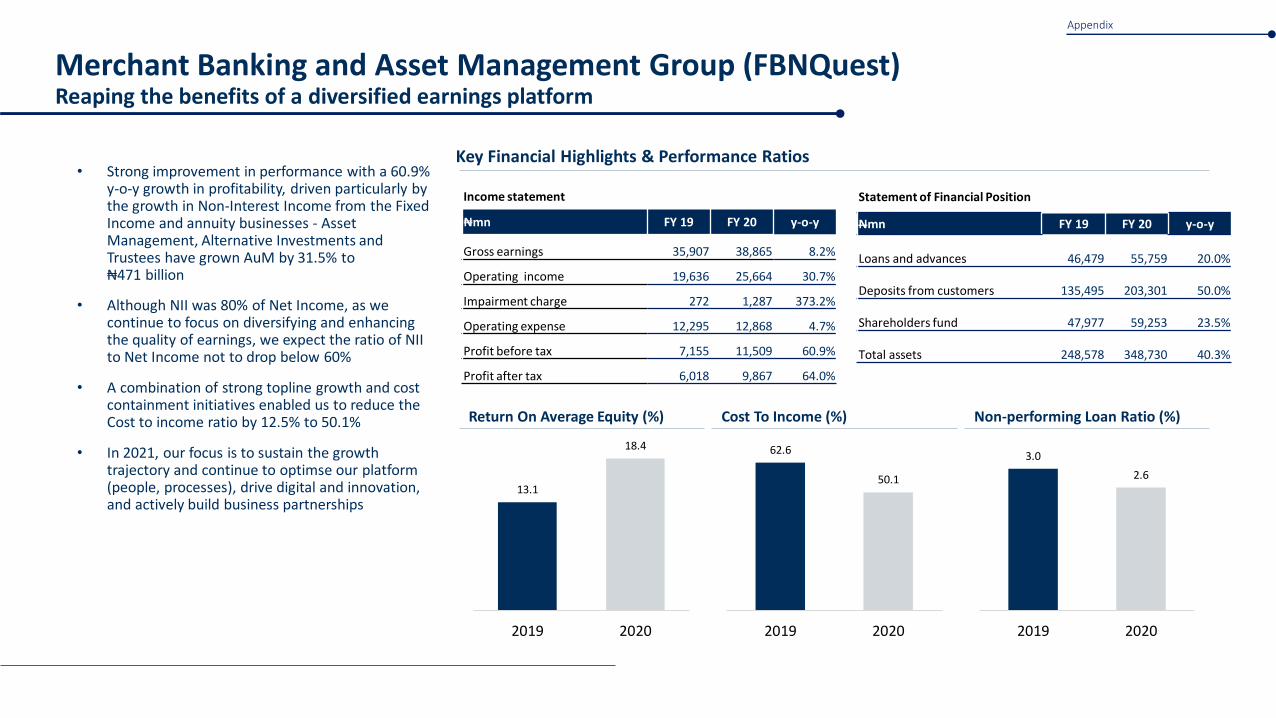
Merchant Banking and Asset Management Group (FBNQuest)Reaping the benefits of a diversified earnings platform
• Strong improvement in performance with a 60.9% y-o-y growth in profitability, driven particularly by the growth in Non-Interest Income from the Fixed Income and annuity businesses - Asset Management, Alternative Investments and Trustees have grown AuM by 31.5% to ₦471 billion
• Although NII was 80% of Net Income, as we continue to focus on diversifying and enhancing the quality of earnings, we expect the ratio of NII to Net Income not to drop below 60%
• A combination of strong topline growth and cost containment initiatives enabled us to reduce the Cost to income ratio by 12.5% to 50.1%
• In 2021, our focus is to sustain the growth trajectory and continue to optimse our platform (people, processes), drive digital and innovation, and actively build business partnerships
Return On Average Equity (%) Non-performing Loan Ratio (%) Cost To Income (%)
sshh
13.1
18.4
2019 2020
62.6
50.1
2019 2020
3.0
2.6
2019 2020
Appendix
Income statement
₦mn FY 19 FY 20 y-o-y
Gross earnings 35,907 38,865 8.2%
Operating income 19,636 25,664 30.7%
Impairment charge 272 1,287 373.2%
Operating expense 12,295 12,868 4.7%
Profit before tax 7,155 11,509 60.9%
Profit after tax 6,018 9,867 64.0%
Statement of Financial Position
Nmn FY 19 FY 20 y-o-y
Loans and advances 46,479 55,759 20.0%
Deposits from customers 135,495 203,301 50.0%
Shareholders fund 47,977 59,253 23.5%
Total assets 248,578 348,730 40.3%
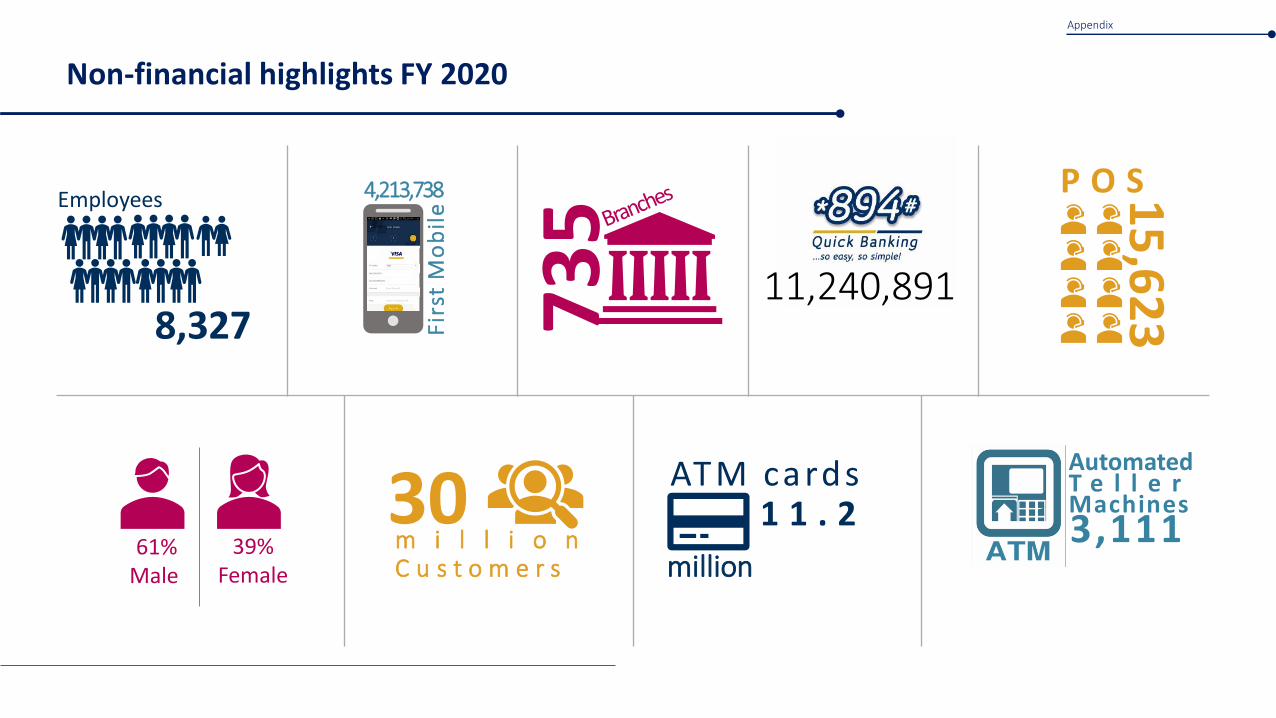
Non-financial highlights FY 2020
8,327 73
5
15
,62
3Employees
P O S
30m i l l i o nC u s t o m e r s
11,240,891
ATM cards
million
1 1 . 261%
Male 39%
Female
AutomatedT e l l e r Machines 3,111
4,213,738
Fir
st M
ob
ile
Appendix
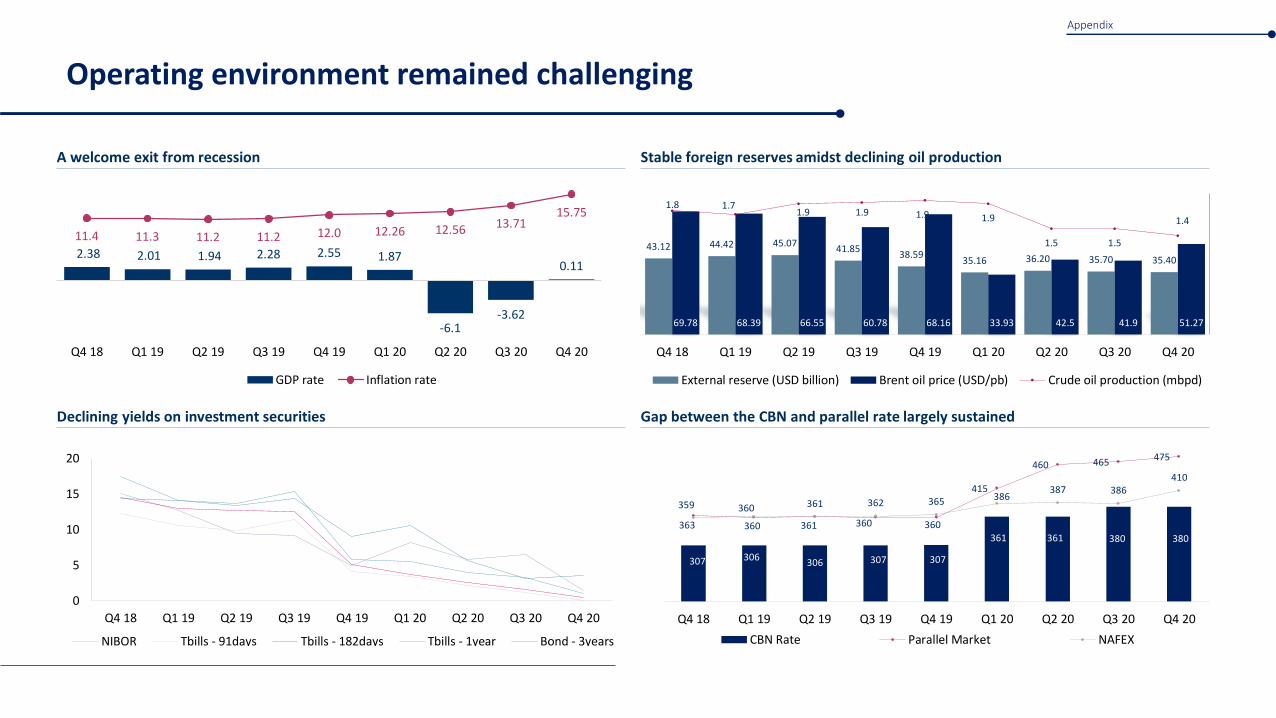
Operating environment remained challenging
A welcome exit from recession
2.38 2.01 1.94 2.28 2.55 1.87
-6.1-3.62
0.11
11.4 11.3 11.2 11.2 12.0 12.26 12.56 13.7115.75
Q4 18 Q1 19 Q2 19 Q3 19 Q4 19 Q1 20 Q2 20 Q3 20 Q4 20
GDP rate Inflation rate
Declining yields on investment securities
0
5
10
15
20
Q4 18 Q1 19 Q2 19 Q3 19 Q4 19 Q1 20 Q2 20 Q3 20 Q4 20
NIBOR Tbills - 91days Tbills - 182days Tbills - 1year Bond - 3years
Stable foreign reserves amidst declining oil production
43.12 44.42 45.0741.85
38.5935.16 36.20 35.70 35.40
69.78 68.39 66.55 60.78 68.16 33.93 42.5 41.9 51.27
1.8 1.71.9 1.9 1.9 1.9
1.5 1.5
1.4
Q4 18 Q1 19 Q2 19 Q3 19 Q4 19 Q1 20 Q2 20 Q3 20 Q4 20
External reserve (USD billion) Brent oil price (USD/pb) Crude oil production (mbpd)
Gap between the CBN and parallel rate largely sustained
307 306306 307 307
361 361 380 380
363 360 361 360 360
415
460 465 475
359 360 361 362 365 386387 386
410
Q4 18 Q1 19 Q2 19 Q3 19 Q4 19 Q1 20 Q2 20 Q3 20 Q4 20
CBN Rate Parallel Market NAFEX
Appendix
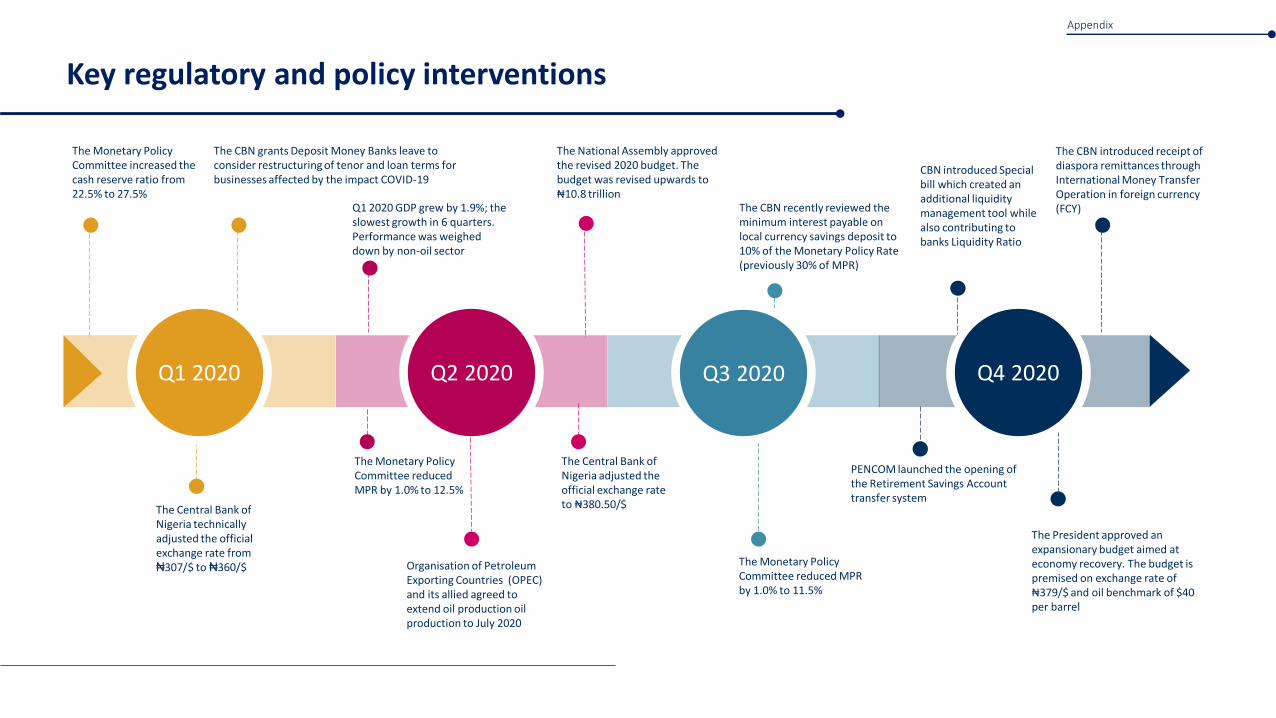
Organisation of Petroleum Exporting Countries (OPEC) and its allied agreed to extend oil production oil production to July 2020
The Monetary Policy Committee reduced MPR by 1.0% to 12.5%
The CBN recently reviewed the minimum interest payable on local currency savings deposit to 10% of the Monetary Policy Rate (previously 30% of MPR)
The National Assembly approved the revised 2020 budget. The budget was revised upwards to ₦10.8 trillion
The Monetary Policy Committee increased the cash reserve ratio from 22.5% to 27.5%
The Central Bank of Nigeria technically adjusted the official exchange rate from ₦307/$ to ₦360/$
Q2 2020
Q1 2020 GDP grew by 1.9%; the slowest growth in 6 quarters. Performance was weighed down by non-oil sector
The CBN grants Deposit Money Banks leave to consider restructuring of tenor and loan terms for businesses affected by the impact COVID-19
The Central Bank of Nigeria adjusted the official exchange rate to ₦380.50/$
The Monetary Policy Committee reduced MPR by 1.0% to 11.5%
Q3 2020
CBN introduced Special bill which created an additional liquidity management tool while also contributing to banks Liquidity Ratio
The CBN introduced receipt of diaspora remittances through International Money Transfer Operation in foreign currency (FCY)
Q4 2020
Key regulatory and policy interventions
Q1 2020
The President approved an expansionary budget aimed at economy recovery. The budget is premised on exchange rate of ₦379/$ and oil benchmark of $40 per barrel
PENCOM launched the opening of the Retirement Savings Account transfer system
Appendix
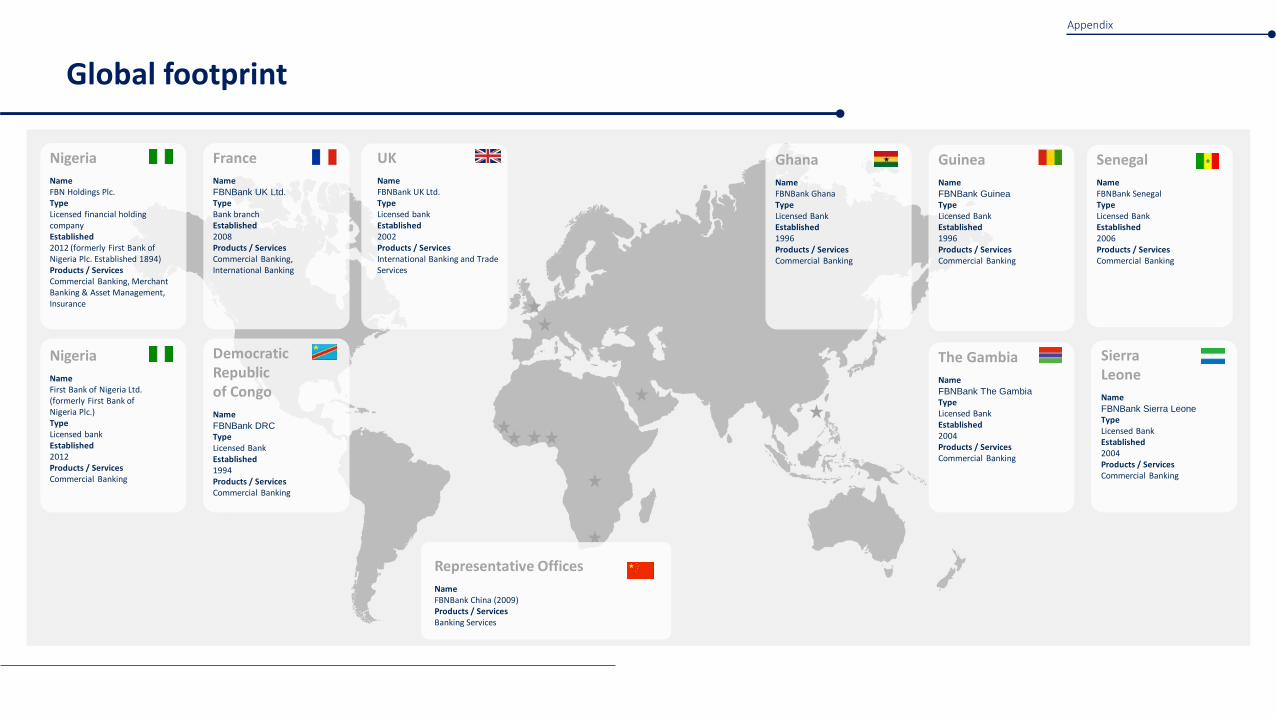
Global footprint
Ghana
NameFBNBank GhanaTypeLicensed BankEstablished1996Products / Services Commercial Banking
France
NameFBNBank UK Ltd.TypeBank branchEstablished2008Products / Services Commercial Banking, International Banking
Nigeria
NameFBN Holdings Plc.TypeLicensed financial holding companyEstablished2012 (formerly First Bank of Nigeria Plc. Established 1894)Products / Services Commercial Banking, Merchant Banking & Asset Management, Insurance
Nigeria
NameFirst Bank of Nigeria Ltd. (formerly First Bank of Nigeria Plc.)TypeLicensed bankEstablished2012Products / Services Commercial Banking
Democratic Republic of Congo
NameFBNBank DRCTypeLicensed BankEstablished1994Products / Services Commercial Banking
Guinea
NameFBNBank Guinea TypeLicensed BankEstablished1996Products / Services Commercial Banking
The Gambia
NameFBNBank The GambiaTypeLicensed BankEstablished2004Products / Services Commercial Banking
Sierra Leone
NameFBNBank Sierra LeoneTypeLicensed BankEstablished2004Products / Services Commercial Banking
Senegal
NameFBNBank SenegalTypeLicensed BankEstablished2006Products / Services Commercial Banking
UK
NameFBNBank UK Ltd.TypeLicensed bankEstablished2002Products / Services International Banking and Trade Services
Representative Offices
NameFBNBank China (2009)Products / Services Banking Services
Appendix
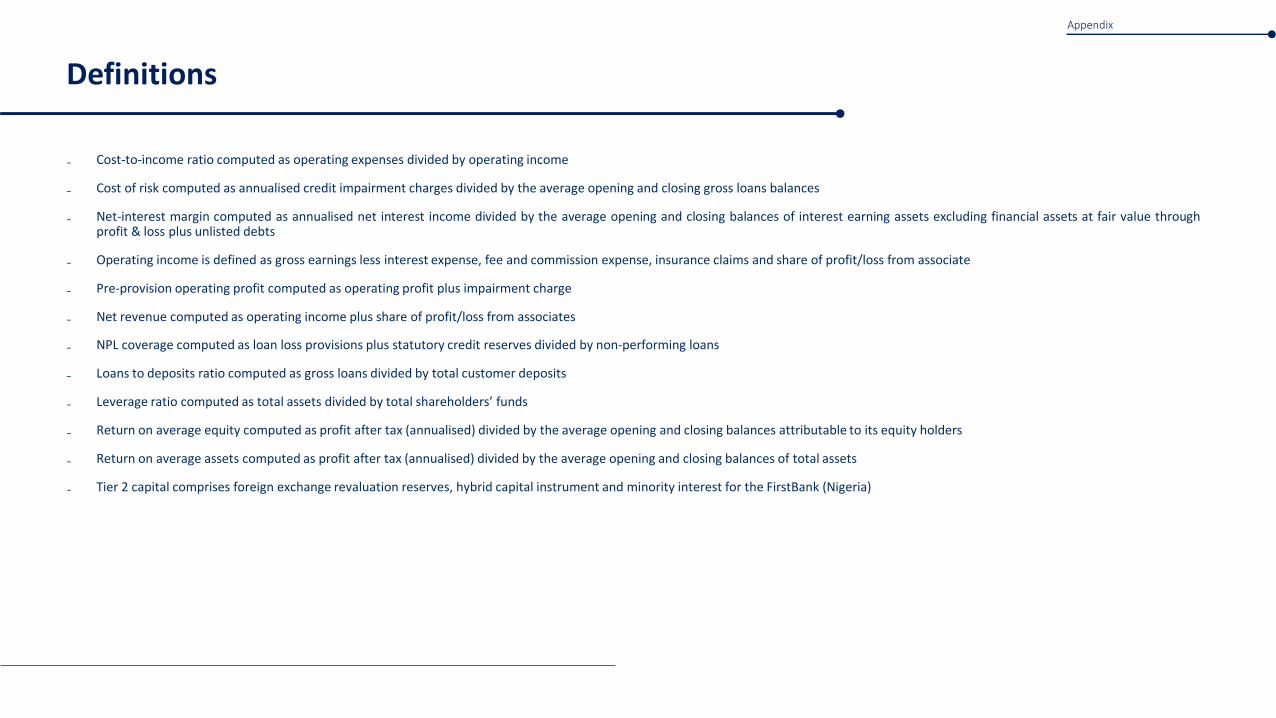
₋ Cost-to-income ratio computed as operating expenses divided by operating income
₋ Cost of risk computed as annualised credit impairment charges divided by the average opening and closing gross loans balances
₋ Net-interest margin computed as annualised net interest income divided by the average opening and closing balances of interest earning assets excluding financial assets at fair value throughprofit & loss plus unlisted debts
₋ Operating income is defined as gross earnings less interest expense, fee and commission expense, insurance claims and share of profit/loss from associate
₋ Pre-provision operating profit computed as operating profit plus impairment charge
₋ Net revenue computed as operating income plus share of profit/loss from associates
₋ NPL coverage computed as loan loss provisions plus statutory credit reserves divided by non-performing loans
₋ Loans to deposits ratio computed as gross loans divided by total customer deposits
₋ Leverage ratio computed as total assets divided by total shareholders’ funds
₋ Return on average equity computed as profit after tax (annualised) divided by the average opening and closing balances attributable to its equity holders
₋ Return on average assets computed as profit after tax (annualised) divided by the average opening and closing balances of total assets
₋ Tier 2 capital comprises foreign exchange revaluation reserves, hybrid capital instrument and minority interest for the FirstBank (Nigeria)
Definitions
Appendix
Contact details
Head, Investor Relations
Tolu Oluwole
Investor Relations Team
: +234 (1) 905 1086; 1147
+234 (1) 905 2720
Appendix