Embed Size (px)
Citation preview

FY 2020Results Presentation
26 February 2021

Agenda
➢ Operations Review– Singapore Operations
– International Operations
– Hospitality
➢ Overview &
Strategic Initiatives
➢ Financial Highlights
➢ Sincere Property Update

Overview

Key Financial Highlights
4
No fair values adopted on investment properties.
Investment properties are stated at cost less accumulated depreciation and accumulated impairment losses.
Revenue EBITDA PBT PATMI
$1.0B ($1.6B) ($1.8B) ($1.9B)
$187MMExclude Sincere
($18MM)Exclude Sincere
($134MM)Exclude Sincere
2H 2019
$1.8B $464.8MM $263.8MM $202.6MM
2H
20
20
Revenue EBITDA PBT PATMI
$2.1B ($1.4B) ($1.8B) ($1.9B)
$367MMExclude Sincere
($14MM)Exclude Sincere
($140MM)Exclude Sincere
FY 2019
$3.4B $1.1B $754.1MM $564.6MM
FY 2
02
0

Key Financial Highlights – FY 2020
5
^ As of 31 Dec 2020
NAV per share RNAV per share
$9.3819.1% YoY
$14.2613.4% YoY
FY 2019 FY 2019:
$11.60 $16.46
No fair values (FV) adopted on investment properties.
Investment properties are stated at cost less accumulated depreciation and accumulated impairment losses.
FY
2020
Proposed Dividend Share Price Performance
12.0 cents per share
40.0%
Comprises:
• Special Final Dividend:
– 4.0 cents
• Final Dividend:
– 8.0 cents
$7.97^
27.2%
FY 2019:
20.0 cents
2020 HIGHEST - $11.42 (14 Jan)
$10.95(31 Dec)
$7.97(31 Dec)
FY
2020
If FV gains on
investment
properties had
been factored in
and the Group’s
hotels continue to
be stated at cost
$16.88If revaluation
surpluses of the
hotel portfolio had
been included
(based on 2020
internal & external
valuations)

Key Operational Highlights – FY 2020
6
Performance Summary
Property
Development
▪ SINGAPORE: Sold 1,318 units with total sales value of $1.846B*
▪ CHINA: Sold 441 units with total sales value of RMB 1.48B ($284MM)
▪ AUSTRALIA: Sold over 77% of 198-unit The Marker project in Melbourne
Asset
Management
▪ SINGAPORE: Resilient committed occupancy for core Singapore office & retail portfolio:
− Office: 92.2% (NLA: 1.7MM sq ft)
− Retail: 92.2% (NLA: 686,000 sq ft)
▪ OVERSEAS: Stable occupancy for office assets in London and China
Hotel
Operations
▪ Performance severely impacted by COVID-19 pandemic:
− Hotel closures: 8% of 152 hotels worldwide temporarily closed
− Global occupancy: 38.6% (▼ 35.7% yoy)
− Global RevPAR: $52.90 (▼ 64.5% yoy)
− Global ARR: $137.20 (▼ 31.6% yoy)
▪ Divestment of four hotel assets in Malaysia, Singapore, the UK and the US
Fund
Management
▪ Continue to build pipeline, in active collaboration with capital partners to acquire new AUM
‒ Acquired additional 8.4% effective stake in IREIT Global units in Apr 2020 for $25.5MM
‒ Exploring establishment of a REIT with commercial assets located in the UK to be
listed on SGX-ST
* Includes Executive Condominiums (ECs) and share of JV partners, excludes Nouvel 18

Total Assets ^
$23.7B
Adjusted
EBITDA *
$466.3MMFY 2020
$267.9MM Property Development
Hotel Operations
Investment Properties
Others
* Earnings before interest, tax, depreciation and amortisation exclude impairment losses on investment properties and property, plant and
equipment, and net loss from Sincere.
^ Excludes tax recoverable and deferred tax asset.
Portfolio Composition by Segment – FY 2020
7
($201.5MM)
$307.5MM
$92.4MM
$9.4B
$5.8B
$6.8B
$1.7B

Global Portfolio Overview
8
Total Assets:
$23.7B
The Group's diversified portfolioenables it to weather cyclical typhoons from timeto time
Assets by
GeographySingapore
50%
UK14%
China12%
US6%
Others18%
As at 31 December 2020

StrategicInitiatives

GET StrategyAccelerate Transformation of Asset Portfolio and Business Operations for Growth
10
Growth
Enhancement
Transformation
Growth
Enhancement Transformation
➢ Build development
pipeline & recurring
income streams
➢ Enhance asset portfolio
➢ Drive operational
efficiency
➢ Transform business via
new platforms:
Strategic Investments,
Fund Management,
Innovation &
Venture Capital
Artist’s Impression

11
Enhancement
• Pipeline launches: Irwell Hill Residences
and Liang Court redevelopment project
• Active land replenishment: Maintain a
strategic inventory level
• Asset rejuvenation: Redevelopment of
Fuji Xerox Towers (CBD Incentive
Scheme) and Central Mall (Strategic
Development Incentive Scheme)
Growth
Transformation
• Fund management: Establish SGX-
listed REIT with UK commercial assets
• Strategic review: M&C and Sincere
Property Group
Focus 2021

StrategicInitiatives
Growth➢Build development
pipeline & recurring
income streams
Artist’s Impression

Completed Strategic Acquisitions & Investments
13
Additional 8.4% stake in
Singapore-listed IREIT Global
Darmstadt Campus, Germany
FY 2020:
~$1.52B^Acquisitions & investments
Refers to CDL’s attributable share
Europe
$25.5MM
GROWTH
Japan
¥2.4B ($31.4MM)
78-unit prime freehold residential
development, Yokohama City
Singapore
China
51.01% joint venture equity investment
in Sincere Property Group
RMB 4.39B ($0.88B)
Starlight 68@Sincere Centre, Chongqing
重庆星光68
City Lux Yokohama
Irwell Bank Road GLS site
$583.9MM

14
Diversified Singapore Residential Launch Pipeline
* Includes JV partners share.
Launch Pipeline
>1,200 units*
^ JV project.
Upcoming Launches
Irwell Hill Residences Q2 2021
Liang Court redevelopment^ 2H 2021
GROWTH
Liang Court redevelopment^
(696 units)
Irwell Hill Residences
(540 units)
Land cost: $583.9MM
($1,515 psf ppr)
Preliminary Artist’s Impression
GLS site near
upcoming
Great World
MRT station
awarded in
Jan 2020

15
GROWTH
Location Tenure Equity Stake Total Units Site Area (sq ft) Gross Floor Area (sq ft)
Irwell Hill Residences 99-year 100% 540 137,634 Approx. 385,400
540-unit Residences at Prime District 9
• Comprises 2 elegant 36-storey high towers with exclusive unitsranging from studio apartments to 4-bedroom Premium apartmentsand 3 exquisite penthouses
Upcoming Launch in Q2 2021Irwell Hill Residences – Exclusive Luxury Living Designed by World-Renowned Architects MVRDV (Concept) and ADDP (Principal)
• Just a few minutes’ walk to Great World City shopping mall and theupcoming Great World MRT station
• Uniquely-curated communal spaces with expansive landscape andrecreational spaces innovatively catered for work, live, play andfitness, and is complemented with a suite of premier residentialservices
• Selected units are provided with convertible furniture for flexible useof space
Artist’s Impression
Preliminary Artist’s Impression

StrategicInitiatives
Enhancement➢Enhance asset portfolio
➢Drive operational efficiency

Focus on Asset & Operational Efficiency
17
Improve Asset Positioning and Relevance, Enhance Asset
Portfolio and Drive Operational Efficiency and Returns
ENHANCEMENT
Asset Enhancement Initiatives
(AEI)
Rejuvenating existing assets to
unlock value and strengthen
recurring income stream
Asset Rejuvenation
and Redevelopment
Reposition assets and replenish
land bank through schemes such
as the CBD Incentive Scheme
and Strategic Development
Incentive Scheme
Operational Efficiency
Deriving synergy through
consolidating functions &
inculcating the future CDL culture
for success through innovation &
teamwork, execution & customer
focused
Artist’s Impression

ENHANCEMENT
18
Asset Enhancement Initiatives (AEI)City Industrial Building and Cideco Industrial Complex: Functional Upgrade
• Refresh the buildings’ aesthetics.
• Upgrade amenities to improve user experience.
City Industrial Building – Completed in 2020
Cideco Industrial Complex – Target to complete in 2021
Artist’s Impression
Artist’s Impression Artist’s Impression
Artist’s Impression

Asset RejuvenationENHANCEMENT
19
* Subject to authorities’ approval ^ Planned number of units
47-storey freehold mixed-use integrated development comprising
office, retail, residential and serviced apartments
Potential uplift in GFA by 25%
to approximately 655,000 sq ftPreliminary Artist’s Impression
Residential Use
35%(286 units^)
Serviced
Apartments Use
25%
Commercial
Use
40%
Redevelopment of Existing Assets – RealiseGFA uplift from Incentive Schemes
Fuji Xerox Towers
Central Mall
Preliminary Artist’s Impression
Mixed-use integrated development comprising office, retail,
serviced apartments and hotel
Potential uplift in GFA
Commercial
Use
70%
Hotel & Serviced
Apartments Use
30%
Proposed redevelopment under Strategic Development Incentive Scheme*:
Proposed redevelopment under CBD Incentive Scheme*:

StrategicInitiatives
Transformation➢Transform business via new
platforms: Strategic Investments,
Fund Management, Innovation &
Venture Capital

Fund Management
21
TRANSFORMATION
TWO-PRONGED STRATEGY
Organic
Growth
Merger &
Acquisitions
l Hospitality l Commercial l Residential l
Build asset pipeline to seed assets for
Fund Management
Partner with institutional investors in
countries and asset classes where CDL
has domain knowledge and track record
Accelerate growth of Fund
Management business through
acquisitions
l Listed / unlisted Real Estate platforms l
Acquire new
expertise
Build track
record
Strengthen fund management expertise
through strategic investments
Target AUM:
US$5B AUM by
2023

TRANSFORMATION
IREIT Global (IREIT) is the first Singapore-listed real estate investment trust which is principally investing in a portfolio of
income-producing real estate in Europe which is used primarily for office, retail and industrial (including logistics) purposes.
CDL acquired a total of 21% stake in IREIT Global’s units :
• 12.5% in 2019
• 8.4% in April 2020
IREIT’s AUM grew 41% from €504.9MM ($813.0MM) (at the point of investment by CDL) to €711.3MM ($1.1B) as at 31
Dec 2020. In Oct 2020, IREIT recorded a successful fund-raising exercise of $143MM which was 1.66x oversubscribed.
5
Properties
€504.9MM
/ $813.0MM• Portfolio valued at acquisition based on Dec 2018
• 5 assets in Germany
9
Properties
€630.2MM
/ $1.0B
(+25%)
• Portfolio valued as at on Dec 2019
• 5 assets in Germany
• 40% stake in 4 Spanish assets
• CDL extended €32MM Bridge Loan
9
Properties
€711.3MM
/ $1.1B
(+41%)
• Successful $143MM Rights issues (1.66x sub)
• Acquisition of 60% stake in Spanish properties
• Repayment of CDL’s Bridge Loan
50% stake in REIT Manager and 21% Stake in IREIT Units
Sep 2020
Dec 2019
Apr 2019
(Acquisition)
AU
M
22S$1 to €0.621
Strengthen Fund Management Expertise Through Strategic Investments
Fund Management

Strategic ESG Integration
Driving Business Transformation through Strong Sustainability Focus
Since 2002 Since 2017‘AAA’ since 2010
LATEST
ESG
MILESTONES Only Singapore
real estate company
listed for 4th
consecutive year
Ranked world’s top real estate
company, top Singapore company,
and 1st & only Singapore company
listed on Global 100 for
12 consecutive years
Only company in Southeast Asia
& Hong Kong to achieve
double ‘A’ honour for both climate
change and water security for 2nd
consecutive year
Ranked on 12 Leading Global Sustainability Ratings and Rankings
23
Since 2011
Since 2018Since 2014
Rated Prime Since 2018
Since 2020 Since 2016
Top 7% of CDP
participants, assessed for
supplier engagement on
climate change
Environmental Performance▪ First Singapore real estate developer and conglomerate in
Southeast Asia to sign WorldGBC’s Net Zero Carbon Buildings Commitment – pledging net zero carbon in operations by 2030
▪ 44% reduction in carbon emissions intensity from 2007; on track to achieve SBTi target of 59% reduction by 2030 from 2007 levels
▪ Achieved energy savings of more than $30MM for 8 commercial properties from 2012 to 2020
Sustainability-linked Financing▪ S$470MM Green Revolving Credit Facility (RCF) to refinance RP and other green projects
Singapore Governance and
Transparency Index 2020
Ranked #3 out of 577 companies
TRANSFORMATION

FinancialHighlights

Financial Highlights
25
PBT Reconciliation$ (MM)
FY
2020
Decline in
PD*
Impairment
losses for
Hotels~
Decline in
Hotels~Foreseeable
losses for
PD*
FY
2019
FY
2020
(Exclude
Sincere)
* Property Development Investment Properties ~ Hotel Operations
Net loss
from
Sincere
(1,777)

26
Sincere Property – Profit & Loss Effect
Jun 2020
Feb 2021Apr 2020 Sep 2020
Recognise
Impairment loss:
• Investment - $806MM
• USD bond - $288MM
• Trade & receivables - $324MM
Provision for guarantee - $283MM
Reversal of FV gain /
Negative goodwill - $ 51MM
Dec 2020
Recognise
+$43MM of negative goodwill
+$8MM of FV gain on call option
-$41MM of share of JV loss
Interest
income of
$128MM
Invested in
Shenzhen
Invested in
Sincere
Property
Recognise
Q3 share of JV
loss -$35MM
Loss of
$1.78B
Financial Highlights

27
Investment in Sincere (51.01%) RMB 4.4B ≈ ($882MM)
As at 30 April 2020 Management accounts
(per Sincere Group)
– PRC GAAP
RMB (billion)
Management accounts
(per the Group)
– SFRS(I)
RMB (billion)
Total Assets 92.4 83.1
Less: Total Liabilities (74.2) (80.8)
18.2 2.3
Less: Minority interest (2.8) (1.5)
NAV/RNAV 15.4 0.8
• Eroding of RNAV due to Sincere being highly geared
❑ 10% ↓ in total assets
❑ 9% ↑ in total liabilities
• Decline in RNAV due to
✓ Property valuations for investment properties ~ RMB 5B
✓ Adjustments to development properties ~ RMB 4B
✓ Impairment loss on receivables ~ RMB 2B
✓ Reversal of deferred tax assets ~ RMB 1B
✓ Adjustments for understated liabilities ~ RMB 3B
Equity accounting for losses (up to Sep 20) ($76MM)
Impairment loss ($806MM)
95% ↓ in RNAV
Sincere Property – Impairment on Equity Investment
Full write off of cost of investment

Credit impaired
28
In line with accounting standards, the Group considers the financial assets to be credit impaired
FRS 109
• Significant financial difficulty of the
borrower
• A breach of contract such as default
• Restructuring of a loan or advance that
the Group would not have considered
• Probable that the borrower will enter
bankruptcy or other financial
reorganisation
• Disappearance of an active market for a
security because of financial difficulties
• 3 Red Lines
• Refinancing / new loans challenging
without credit enhancement
• A portion of loans due by 31 Dec 2020
remain unpaid / in negotiations with
lenders
• RMB 22.6B of interest bearing liabilities
(includes loans, interest, other
payables) due in the next 12 months
• Credit downgrade to AA- for bonds
• One of Sincere bonds plunged by 65%
on Shanghai Exchange (Source: Bloomberg)
Impairment loss on USD bonds ($288MM) & loans extended to Sincere Property ($324MM)
Sincere Property – Impairment on Financial Assets
Impairment loss of $612MM provided

Financial Highlights
29
Property
Development
Hotel
Operations
Investment
Properties
FY
2020
FY
2019
Revenue $640MM $1.7B
PBT ($573MM) ($7MM)
Exclude net
loss from
Sincere
($467MM)
FY
2020
FY
2019
Revenue $361MM $438MM
PBT ($575MM) $333MM
Exclude net
loss from
Sincere
$136MM
FY
2020
FY
2019
Revenue $966MM $1.1B
PBT ($740MM) $378MM
Exclude net
loss from
Sincere
$220MM
Others
FY
2020
FY
2019
Revenue $141MM $149MM
PBT $97MM $50MM
Exclude net
loss from
Sincere
$97MM
▪ Decrease in revenue and PBT mainly
due to timing of profit recognition
✓ FY 2020 contributions largely from
The Tapestry, Whistler Grand and
Amber Park, with thinner profit
margins
Vis-à-vis
✓ FY 2019 contribution largely from
New Futura, Gramercy Park and
Hong Leong City Center, Suzhou,
with higher profit margins
▪ Allowance for foreseeable losses of
$35MM were made in FY 2020 vis-à-vis
write-back of foreseeable losses of
$7MM in FY 2019
▪ More financing costs expensed off for
new projects
▪ This segment was severely impacted
by the prolonged COVID-19 pandemic
which severely affected the global
hospitality sector with travel restrictions,
trip cancellations, postponement of
major events and a steep reduction in
F&B spend
▪ Global RevPAR declined 65% driven
by decline in occupancies with the
lockdowns
▪ US, Europe and Asia all generated
pre-tax losses.
▪ Impairment losses of $87MM was
provided in FY 2020
▪ Divestment gain of $26MM upon the
sale of Cincinnati Hotel mitigated the
losses
▪ Decrease in revenue was mainly due
to
✓ rental rebates granted mainly to
retail tenants in Singapore, Phuket
and Suzhou
✓ Lower rental from CDLHT hotels
accounted for as investment
properties due to the pandemic
▪ Lower divestment gains in FY 2020
accounts for the sharp decline in pre-tax
profits. Included in FY 2020 was a gain
of $108MM for the disposal of Novotel
Clark Quay and $9MM for the disposal
of Novotel Brisbane
Included in FY 2019 was a substantial
gain of $207MM resulting from the
closure of the Group’s PPS2 platform,
following the sale of Manulife Centre
and 7 & 9 Tampines Grande, as well as
gain of $11MM on disposal of Jervois
Road
▪ Gain mainly relate to:
✓ $23MM divestment gain upon sale
of a non-core subsidiary
✓ Higher contribution from property
financing business from an
associate

30
Financial Highlights
Revenue by Segment for 2H (2018 – 2020)
663 601
502
881 920
285
190 230
176
72 81 72
0
100
200
300
400
500
600
700
800
900
1,000
2H 2018 2H 2019 2H 2020
$ (M
M)
Property Development Hotel Operations Investment Properties Others
$1,806MM $1,832MM $1,035MM

31
Financial Highlights
EBITDA by Segment for 2H (2018 – 2020)
288 238
(838)^
62 62
(269)^
157 140
(524)^
21 25 31
(900)
(800)
(700)
(600)
(500)
(400)
(300)
(200)
(100)
0
100
200
300
400
500
2H 2018 2H 2019 2H 2020
$ (MM) $528MM $465MM ($1,600MM)
^ Include net loss from Sincere of $1.79B – Property Development $0.96B– Hotel Operations $0.11B– Investment Properties $0.72B
Exclude Sincere
$187MM
127
(162)
191
31
2H 2020

32
Financial Highlights
Profit Before Tax by Segment for 2H (2018 – 2020)
$362MM $264MM ($1,805MM)
267 198
(855)^
(16) (36)
(365)^
102 75
(601)^
9 27 16
(900)
(800)
(700)
(600)
(500)
(400)
(300)
(200)
(100)
0
100
200
300
400
2H 2018 2H 2019 2H 2020
$ (MM)
Exclude Sincere
($18MM)
110
(258)
114
16
2H 2020
^ Include net loss from Sincere of $1.79B – Property Development $0.96B– Hotel Operations $0.11B– Investment Properties $0.72B

33
Financial Highlights
Revenue by Segment for Full Year (2018 – 2020)
2,045
1,137 966
1,679 1,705
640
359 438
361
140 149 141
0
200
400
600
800
1,000
1,200
1,400
1,600
1,800
2,000
2,200
2,400
FY 2018 FY 2019 FY 2020
$ (M
M)
Property Development Hotel Operations Investment Properties Others
$4,223MM $3,429MM $2,108MM

34
Financial Highlights
EBITDA by Segment for Full Year (2018 – 2020)
658
435
(691)^
192 178
(395)^
303
474
(416)^
35 39 92
(900)
(800)
(700)
(600)
(500)
(400)
(300)
(200)
(100)
0
100
200
300
400
500
600
700
FY 2018 FY 2019 FY 2020
$ (MM) $1,188MM $1,126MM ($1,410MM)Exclude Sincere
$367MM
268
(288)
295
92
FY 2020
^ Include net loss from Sincere of $1.78B – Property Development $0.96B– Hotel Operations $0.11B– Investment Properties $0.71B

35
Financial Highlights
Profit Before Tax by Segment for Full Year (2018 – 2020)
$876MM $754MM ($1,791MM)
624
378
(740)^
40
(7)
(573)^
189
333
(575)^
23 50 97
(800)
(700)
(600)
(500)
(400)
(300)
(200)
(100)
0
100
200
300
400
500
600
700
800
FY 2018 FY 2019 FY 2020
$ (MM)
Exclude Sincere
($14MM)
220
(467)
136 97
FY 2020
^ Include net loss from Sincere of $1.78B – Property Development $0.96B– Hotel Operations $0.11B– Investment Properties $0.71B

Financial Highlights
36
Strong Balance Sheet & Liquidity Position
1 Exclude non-cash impairment losses on investment properties and property, plant and equipment, and net loss from Sincere
2 After taking in fair value on investment properties
GearingSufficient
Liquidity
Financing
Flexibility
Balanced
Debt Profile
Net Gearing 2
(include fair value)
62%
FY 2019: 43%
Net Gearing
93%
FY 2019: 61%
Interest Cover
Ratio 1
3.4x
FY 2019: 9.1x
Average
Borrowing Cost
1.8%
FY 2019: 2.4%
Average
Debt Maturity
2.3 years
FY 2019: 2.4 years
Total Cash
$3.2B
FY 2019: $3.1B
Cash and Available
Committed Credit
Facilities
$5.2B
FY 2019: $5.6B
% of
Fixed Rate Debt
34%
FY 2019: 40%

Financial Highlights
37
Prudent Capital Management
➢ Balanced debt expiry profile
➢ Balanced debt currency mix – adopting a natural hedging strategy
➢ Average borrowing cost kept low
De
bt
$ (
MM
)
Well-Spread Debt Maturity Profile
2,488
4,121
296 981 938
312
100
400
890 698
350 0400800
1,2001,6002,0002,4002,8003,2003,6004,0004,400
2021 2022 2023 2024 2025 2026onwards
Bond Bank Loan
Debt
Currency
Mix SGD(50.3%)
GBP (28.8%)
USD (9.7%)
JPY (4.8%)
RMB (4.3%)Others (2.1%)
3,335
1,120
$11,574MM
551493
250
5,825
24%
37%
6%
16%14%
3%

Sincere Property Update

➢ Operating Challenges
➢ Corporate Action to Improve Liquidity
Strategic Review
Shenzhen Longgang Tusincere Tech Park

40
$8 Trillion of China Real Estate Loans Outstanding
0
10
20
30
40
50
60
2012 2013 2014 2015 2016 2017 2018 2019 3Q20
Trilli
on
Yu
an
Other Real Estate Loans Outstanding
Construction Loans Outstanding
Mortgage Loans Outstanding
Real Estate Sector Loans as a % of Total Loans Outstanding
19.2% 20.3%21.3%
22.4%25.0%
26.8%28.4% 29.0% 28.8%
Source: People’s Bank of China
Bloomberg

41
China Property Control Measures
“To unswervingly implement the real estate long-term mechanism;
focus on the goals of stabilising land and home prices and expectations;
insist on one city and one policy;
strengthen real estate financial regulation;
to firmly adhere to the positioning that houses are for living in, not for speculation;
not to use real estate as a short-term means of stimulating the economy;
always keep tightening the string of real estate market regulation, pragmatically
continue to improve the policy toolbox to promote the healthy and stable
development of the housing market”
Han Zheng – Senior Vice Premier of the State Council and Politburo Standing Committee Member of the Communist Party, Speaking at MOHURD’s Real Estate Work Symposium
Xinhua, Originally in Chinese, Translated by Bloomberg Intelligence, 3 Dec 2020
42
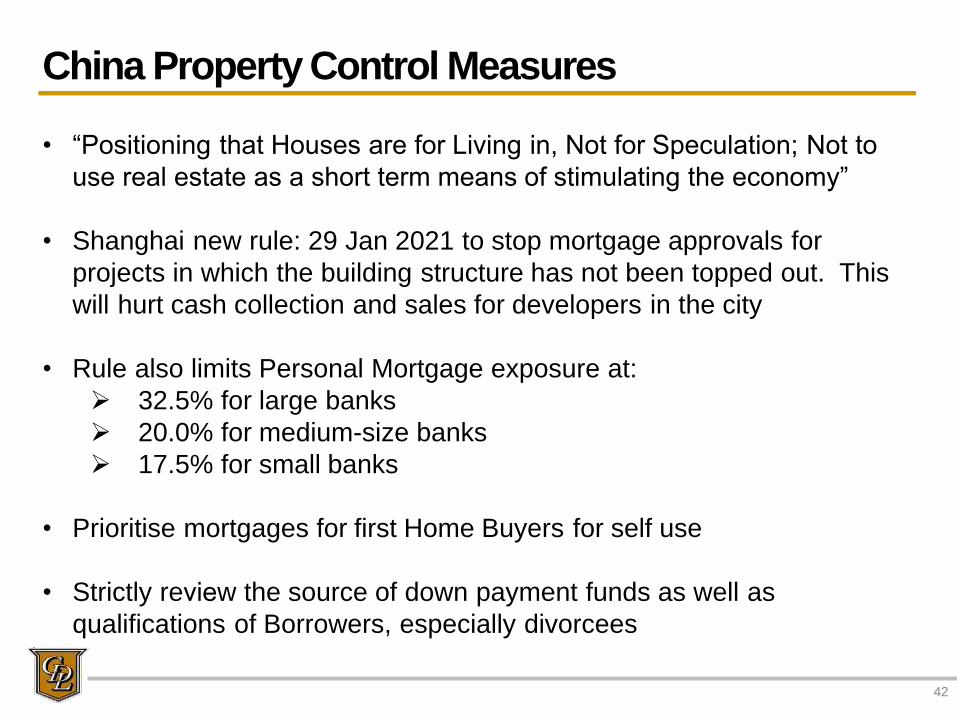
• “Positioning that Houses are for Living in, Not for Speculation; Not to use real estate as a short term means of stimulating the economy”
• Shanghai new rule: 29 Jan 2021 to stop mortgage approvals for projects in which the building structure has not been topped out. This will hurt cash collection and sales for developers in the city
• Rule also limits Personal Mortgage exposure at:
➢ 32.5% for large banks
➢ 20.0% for medium-size banks
➢ 17.5% for small banks
• Prioritise mortgages for first Home Buyers for self use
• Strictly review the source of down payment funds as well as qualifications of Borrowers, especially divorcees
China Property Control Measures

43
Sincere Property – Overview of Projects
Tianjin
Yantai
Northern China Region8 projects
Wuxi
Jiangsu Region13 projects
Changzhou
ShanghaiZhejiang and
Shanghai Region10 projects
ShenzhenPearl River Delta Region
1 project (Divested)
Chongqing
Changsha
Chengdu
Kunming
Southwest Region7 projects
Central Region2 projects
Zhengzhou
Central and Western Region27 projects Sanya
Qingdao
Suzhou
Over 300 entities under Sincere Property Group, 67 projects over 17 cities
(As at 31 Dec 2020)
Beijing
LuoyangZhenjiang
NingboHangzhou

44
Sincere Property – Portfolio by Property Type
3%
36%
22%
33%
6%
Commercial &
Office
Business Park
Residential
Others
Hotel &Serviced
Apartments
Two-thirds of the portfolio are non-residential properties

Debt Restructuring Framework
Review of financial positions
Debt
Restructuring Identify
sources for
restructuring
Portfolio
Grouping
Identify potential
business partners
Framework of
Debt
Restructuring
45

46
Sincere Property Loans Summary
Interest Rate
8.62%
8.21%
11.18% 11.58%
9.12%
0.00%
2.00%
4.00%
6.00%
8.00%
10.00%
12.00%
14.00%
Banks Bonds AssetManagement
Co.
Others Others -Related
Party
9.6
2.3 1.9 1.6
4.4
4.6
2.6
0.2 0.4
1.7
0.9 0.1 0.4
2.2
0.0
5.0
10.0
15.0
20.0
25.0
2021 2022 2023 2024 2025
Principal Loan Repayment
Banks Bonds AssetManagementCo.
Others Others -Related Party
RMB’B
20.6
3.5 2.4 2.0
4.4
RMB 26.0B
78%
RMB 7.0B
22%
Secured
Loan
Unsecured
Loan
As at 31 Dec 2020

47
Three Red Lines 31-12-2019 30-4-2020 31-12-2020Policy
Target红线1:剔除预收款后的资产负债率大于70%剔除预收款后的资产负债率=(总负债-预收账款)/(总资产-预收账款)
(Total liabilities less advances received)/
(Total assets less advances received)>
70%;
77% 77% 79% <70%
红线2:净负债率大于100% 净负债率=(有息负债-货币资金)/净资产
(Interest bearing liabilities – Cash)/ Net
Assets > 100%;
193% 187% 180% <100%
红线3:现金短债比小于1.0倍。现金短债比=非受限资金/(短期借款+一年内到期的非流动负债)
(unrestricted cash/(short-term loan+long
term loan to be repaid in one year)<1.0)
10% 10% 13% >100%
*: the ratios for three red lines are computed based on management account of Sincere Property prepared under
PRC GAAP
Sincere Property – Three Red Lines Impact

Challenging Liquidity Position➢ Severe Impact by the Prolonged COVID-19 Pandemic
➢ Tightening of Liquidity for Real Estate Companies in China with Three Red Lines
48
• Significant changes in China’s operating conditions has stymied the progress of the Group’s initial portfolio rebalancing and capital optimisation and restructuring plan post-transaction
• Intended asset divestment plan expected to take place over a longer period of time due to current climate
• Immediate focus: Lighten debt load on investment properties exposure and shore up residential development plans
Planned Post-transaction
Priorities
CAPABILITY
ENHANCEMENT
PORTFOLIO
REBALANCING
SALES
ACCELERATION
ASSET
DIVESTMENT
TREASURY
OPTIMISATION
Current Scenario
& Immediate Focus

Shenzhen LonggangTusincere Tech Park Acquisition

Shenzhen Longgang Tusincere Tech Park
50
Acquisition of Majority Stake in Tech Park in China’s “Silicon Valley”
– First Corporate Action to Improve Liquidity of Sincere Property
Development Details
Location Longcheng Street, Longgang District, Shenzhen
(northeast of Shenzhen city, 30km from Hong
Kong, 150km from Guangzhou)
Site Area Approx. 192,739 sqm
Tenure Leasehold till 1 Dec 2045
Expected
Completion
• Phase 1: Completed
• Phases 2 and 3: Under construction;
expected completion in Apr 2022
• Phase 4: not commenced
GFA
Breakdown
• Saleable area: 413,634 sqm
• Self-use leasable area: 162,144 sqm
*Based on exchange rate of RMB 1 to S$0.2051 as at 20 February 2021
Artist’s Impression
• Transaction involves acquisition from Sincere Property
and two entities of China Ping An totalling 84.6% interest
in Shenzhen Tusincere Technology Park Development
Co. Ltd. for RMB 850MM
• Combined transaction will accord CDL an effective 55%
stake in a Shenzhen tech park, valued at RMB 8.8B
• Tech park located at the technology hub of Greater Bay
Area in southern China developing over four phases
Transaction Overview
Acquisition
Price
• RMB 850MM (approx. $174MM) for 84.6%
interest in asset holdco
• Assumption of its proportionate share of
existing shareholders’ loans
Valuation RMB 8.8B (approx. $1,805MM)
(as at 30 Nov 2020)
OperationsReview

SingaporeOperations
Property Development

Source: URA, Q4 2020
Property Price Index – Residential (2014 – 2020)
Singapore Property Market
120
140
160
180
Q114
Q214
Q314
Q414
Q115
Q215
Q315
Q415
Q116
Q216
Q316
Q416
Q117
Q217
Q317
Q417
Q118
Q218
Q318
Q418
Q119
Q219
Q319
Q419
Q120
Q220
Q320
Q420
All Residential
53
Price Increase(2.2% YoY)
Residential prices continue to increase,
following recovery from the previous quarter Q4 20: 157.0

4,264
14,688
16,292 15,904
22,197
14,948
7,316 7,440 7,972
10,566
8,795 9,912
-4.7%
1.7%
17.6%
5.9%
2.8%1.1%
-4.0% -3.7% -3.1%
1.1%
7.9%
2.7%
2.2%
-10.0%
-5.0%
0.0%
5.0%
10.0%
15.0%
20.0%
-
5,000
10,000
15,000
20,000
25,000
2008 2009 2010 2011 2012 2013 2014 2015 2016 2017 2018 2019 2020
Sales Volume vs Price Growth
CCR RCR OCR Price growth (year on year)
Price
Growth (%)
Price growth of 10.9% over
the 5-year period from
Q4 2015 – Q4 2020
Sales
Volume
• Private residential market continues to show signs of recovery with URA Private Residential PropertyPrice Index registering a 2.1% increase in Q4 2020. Cumulatively, prices have risen 2.2% in 2020.
• Robust primary home sales in Q4 2020 with 2,603 units sold registering a 6.5% increase ascompared to Q4 2019. Developers sold a total of 9,982 private homes in the whole of 2020, marking a0.7% increase compared to the previous year.
Singapore Property Market
54
9,982
Source: URA Statistics

Singapore Property Development
Residential Units Sold
Sales Value*($'000)
$1,845,844
$3,268,242
No. of Units*
1,318
1,554
Total FloorArea* (sq ft)
1,168,178
1,639,742
FY 2020FY 2019
55
* Includes Executive Condominiums (ECs) and share of JV partners, excludes Nouvel 18
Majority of units sold were
The Tapestry, Whistler
Grand, Piermont Grand and
Penrose projects
1H
2H 2020 Highlights
2H
2H
1H
1H
2H
1H
2H
1H
2H
1H
2H
Units
Sold
1H 346 units
Units sold and
sales value for 2H
were three times
that of 1H
2H 972 units
Sales
Value
1H $498.0MM
2H $1.348B
Resilient performance
➢ Improved performance from 1H:
− Residential units sold in 2H 2020 were almost
three times that of 1H 2020
− Sales value increased 171% in 2H 2020
➢ Stronger 2H performance due to Penrose launch
➢ Healthy residential sales momentum – overall FY
2020 performance is quite comparable with
2019, despite the pandemic
➢ Steady take-up of existing inventory
(FY 2020: 1 launch vs
FY 2019: 5 launches*)
➢ Mainly mass market projects sold in Q4 2020

➢ Sold 1,318 units with total sales value of $1.85B for FY 2020^
Singapore Property DevelopmentResilient / Strong Sales Performance for FY 2020 Amid Pandemic
Best-Selling Projects in 2020Project Location Tenure Equity Stake Total Units Units Sold* Units Sold in
2020
Achieved Average
Selling Price (ASP)*Launch
Penrose Sims Drive 99 years 40% 566 420 414 >$1,570 psf 2020
Piermont Grand Sumang Walk 99 years 60% 820 714 244 >$1,100 psf 2019
Whistler Grand West Coast Vale 99 years 100% 716 684 205 >$1,400 psf 2018
The Tapestry Tampines Street 99 years 100% 861 860 166 >$1,330 psf 2018
^ Includes Executive Condominiums (ECs) and share of JV partners, excludes Nouvel 18 ~ Divested project marketed by CDL
* As of 21 Feb 2021
Artist’s Impression
Steady Sales for Existing Inventory – 2019 Launches
Artist’s Impression Piermont GrandPenrose Artist’s Impression Whistler Grand Artist’s Impression The Tapestry
Project Location Tenure Equity Stake Total Units Units Sold* ASP*
Boulevard 88 Orchard Boulevard Freehold 40% 154 107 >$3,770 psf
Amber Park Amber Road Freehold 80% 592 265 >$2,470 psf
Haus on Handy Handy Road 99 years 100% 188 39 >$2,840 psf
Sengkang Grand Residences Sengkang Central 99 years 50% 680 358 $1,730 psf
Nouvel 18~ Anderson Road Freehold - 156 71 >$3,380 psf
Artist’s Impression Boulevard 88
56

Singapore Property Development
Inventory of Launched Residential Projects –As at 31 Dec 2020
The Venue Shoppes – sold 16 units out of 28 sold, 12 units unsold with 3 units leased
57
** Leasing strategy implemented
Project Equity Stake Total Units Units SoldTotal Unsold
Inventory
CDL’s Share of
Unsold Inventory
Cuscaden Residences 25% 75 74 1 0.3
St. Regis Residences 33% 173 161 12 4.0
The Oceanfront @ Sentosa Cove 50% 264 263 1 0.5
One Shenton 100% 341 328 13 13.0
Cliveden at Grange** 100% 110 43 67 67.0
UP@Robertson Quay 100% 70 61 9 9.0
The Venue Residences 60% 266 265 1 0.6
Forest Woods 50% 519 518 1 0.5
The Tapestry 100% 861 860 1 1.0
Whistler Grand 100% 716 652 64 64.0
Boulevard 88 40% 154 105 49 19.6
Amber Park 80% 592 237 355 284.0
Haus on Handy 100% 188 34 154 154.0
Piermont Grand 60% 820 691 129 77.4
Sengkang Grand Residences 50% 680 330 350 175.0
South Beach Residences 50% 190 152 38 19.0
The Jovell 33% 428 183 245 80.9
Penrose 40% 566 414 152 60.8
TOTAL: 7,013 5,371 1,642 ~1,031

SingaporeOperations
Asset Management

80
90
100
110
120
130
140
150
Q114
Q214
Q314
Q414
Q115
Q215
Q315
Q415
Q116
Q216
Q316
Q416
Q117
Q217
Q317
Q417
Q118
Q218
Q318
Q418
Q119
Q219
Q319
Q419
Q120
Q220
Q320
Q420
Office Retail
Source: URA, Q4 2020
Singapore Commercial Market
Property Price Index – Commercial (2014 – 2020)
Q4 20: 108.9
59
Price Decline(-10.7% YoY)
Slight drop in office price as compared to previous quarter
Price Decline(-4.5% YoY)
Slight drop in retail price as compared to
previous quarter
Q4 20: 123.3
0
50
100
150
200
250
Q114
Q214
Q314
Q414
Q115
Q215
Q315
Q415
Q116
Q216
Q316
Q416
Q117
Q217
Q317
Q417
Q118
Q218
Q318
Q418
Q119
Q219
Q319
Q419
Q120
Q220
Q320
Q420
Office Retail
Source: URA, Q4 2020
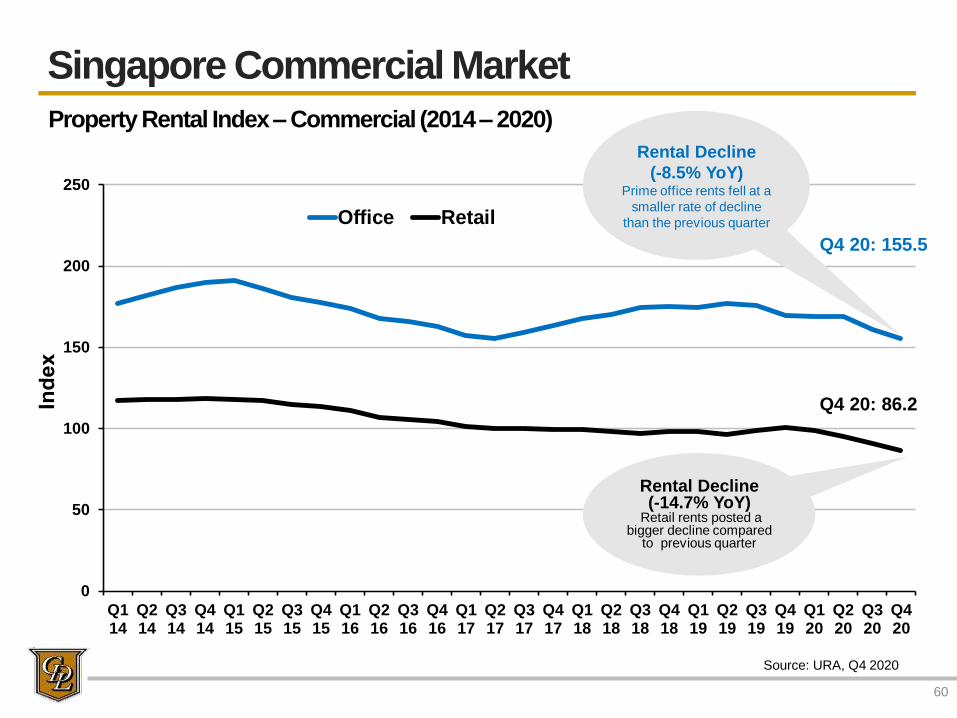
Singapore Commercial Market
Property Rental Index – Commercial (2014 – 2020)
Q4 20: 86.2
60
Rental Decline
(-8.5% YoY)Prime office rents fell at a
smaller rate of decline
than the previous quarter
Q4 20: 155.5
Rental Decline(-14.7% YoY)
Retail rents posted a bigger decline compared
to previous quarter

61
Singapore Commercial Portfolio
REPUBLIC PLAZA CITY SQUARE MALL
92.2%Committed Occupancy
1.7MM sq ftNet Lettable Area
Strong Committed Occupancy and Positive Rental Reversion for Office Portfolio
(As at 31 Dec 2020) (1)
92.2%Committed Occupancy
686,000 sq ftNet Lettable Area
Lease Expiry Profile
by % of NLA
▪ Active risk management by engaging tenants ahead of lease expiries.
▪ Review lease structure to adapt to current challenging market to defend occupancy.
(1) Includes all Singapore assets under management (including JV project South Beach) in accordance to CDL’s proportionate ownership.
(2) Excludes Fuji Xerox Towers, Central Mall Office Tower and Central Mall Conservation Unit which will be redeveloped.
Office11 properties
Retail8 properties
* Refers to expiring leases that have been renegotiated
20.6%
18.7%
14.6%
6.4%3.7%
6.8%8.9%
6.5% 6.3% 6.2%
0.8% 0.5%
2021 2022 2023 2024 2025 2026 & beyond
Office - Completed Retail - Completed Office Retail
2.3%*

62
Singapore Commercial Portfolio
Trade Mix of Office & Retail Space by % of Total Gross Rental Income
(As at 31 Dec 2020)*
Office Retail
* Includes all Singapore assets under management (including JV project South Beach) except for Fuji Xerox Towers, Central Mall Office Tower and Central Mall
Conservation Unit which will be redeveloped, in accordance to CDL’s proportionate ownership and excludes retail gross turnover rent.
• Diverse and well-spread tenant mix across both office and retail segments:➢ Office: Trade mix remains largely stable amid a challenging economic environment.
➢ Retail: Target support for tenants in challenged trade-mix requiring assistance to adapt to new retail norms.
Banking, Insurance &
Financial Services,
22.5%
Energy, Commodities, Maritime & Logistics,
8.8%
Government, 0.4%
Manufacturing & Distribution, 4.5%
Others, 2.0%
Professional Services,
21.8%
Real Estate, 17.2%
Retail Products & Services,
8.9%
Technology & ICT, 13.9%
Electrical, Electronics & Telecommunications, 1.6%
Fashion & Accessories, 9.0%
Food & Beverage,
38.9%
Health & Beauty, 11.2%
Home, Lifestyle & Gifts, 5.1%
Jewellery, Optical & Watches, 1.9%
Kids & Education, 5.9%
Leisure & Entertainment, 4.8%
Medical & General Services, 8.6%
Others, 3.5%
Sporting Goods, 3.2%
Supermarkets & Value Store,
6.3%

Grade A office rental declined for its fourth consecutive quarter to $10.40 psf per month in
Q4 2020. This represented a full year decline of 10% in Grade A office rents. Nonetheless,
on the back of vaccine rollout, economic activity and business sentiments are expected to
improve rent growth in 2021 / 2022.
63
Singapore Office Market Outlook
Source: CBRE Research

Average prime island-wide retail rents declined by 8.6% for 2020. The retail sector
remained challenged with continued social distancing measures and closure of tourism
borders. Nonetheless, consumer demand and retailers’ confidence are expected to recover
in 2021 with positive news of stabilising economy, increase in permitted social group sizes,
relaxation of rules and barring an escalation of the COVID-19 situation in Singapore.
64
Singapore Retail Market Outlook
Source: CBRE Q4 2020 Prime Retail Rents

International Operations

Focus on Developments Across Eastern Seaboard of Australia
66
Waterbrook Bowral
➢ Waterbrook Bowral, a 135-unit
retirement housing project, has
received reservations on 74% of 77
units launched. Project is targeted
to begin construction in 1H 2021.
International Operations – Australia
Artist’s Impression➢ Launching officially for pre-sales in 1H 2021
222-unit development consisting of apartments and
townhouses located in the prestigious Alderley suburb in
North Brisbane.
Brickworks Park (Residential)
Project on Fitzroy (Mixed Use) The Marker (Mixed Use) Arco (Mixed Use)
➢ The Marker has exchanged contracts on 77% of 198 units available, early works construction has commenced in 1H
2020.
Artist’s Impression
Artist’s Impression
Artist’s ImpressionArtist’s Impression Artist’s Impression
Victoria
New South WalesQueensland

67
Artist’s Impression
For Illustration Only
Good Uptake post-COVID:65 villas sold todate*➢ Sales value of RMB 1.48B
Chongqing(重庆)
Hongqiao Royal Lake (御湖)
Emerald (翡翠都会)
Artist’s Impression
Continued Sales Momentum:Total sales of RMB 4.03B generated
for 92% of 1,813 units todate*^➢ Phase 1 – 99% sold
➢ Phase 2 – 67% sold
➢ 32,101 sqm Grade A office tower is 75%
occupied and operational since June
2019
➢ HLCC mall is 89% occupied
➢ Hotel expected to open in Q1 2022
Stable income
stream:➢ Comprises 5 office
towers with 2 levels
of basement carpark
with GFA of 32,182
sqm
➢ Office towers are
fully leased out as
serviced apartment,
postnatal
confinement centre
and aesthetic clinic
Relaunched in May 2018:Sold 105 units to date*➢ Sales value of RMB 643MM
Eling Palace (鹅岭峯)
Yaojiang International
(耀江国际)
Asset
enhancement:➢ Operational since
Jan 2019
➢ Exterior works has been
completed in Q3 2020
International Operations – China
Handover since end
2020:Sold 868 units to date*➢ Sales value of RMB
2.52B
➢ Remaining retail units
will launch in Feb 2021
Hong Leong City Center (丰隆城市中心)
Suzhou (苏州)
Hong Leong Plaza Hongqiao
(虹桥丰隆广场)
Asset rebranding
completed:➢ Renamed as Hong Leong
Hongqiao Centre – formerly
known as Shanghai Hongqiao
Sincere Centre (Phase 2)
➢ Occupancy for office and
serviced apartments remain
stable at around 50% and
70% respectivelyShanghai ( 上海)
Focus on Tier 1 and Tier 2 Cities
^ Excludes 143 units transferred to CDL’s wholly-owned subsidiary for investment purpose.* As of 21 Feb 2021

International Operations – Japan
Freehold site in Shirokane
Development Site:➢ Prime 180,995 sq ft freehold
site acquired in Oct 2014
Park Court Aoyama The Tower*
Japan PRS Sector Continues to Display Resilience
Freehold residential asset consisting of 29
residential units and 5 retail units across 14-storeys
Horie Lux, Osaka
Freehold residential assets consisting of 130 units across 3
properties in Osaka
Completed in Q1 2018:➢ 160-unit freehold joint venture
residential project launched in Oct 2016
B-Proud Tenmabashi Pregio Joto Chuo Pregio Miyakojima Hondori
68* As of 31 December 2020
Freehold residential asset consisting of 78 units
Artist’s ImpressionCity Lux Yokohama

Knightsbridge Stag Brewery
Ransomes Wharf
Monk Bridge, Leeds
International Operations – UK Residential
Strengthening our Presence
28 Pavilion Road
Artist’s Impression
69
Artist’s Impression
Artist’s Impression
Planning in progress
Planning in progress
100 Sydney Street
31 & 33 Chesham Street
Teddington Riverside
Marketing in progress
* As of 15 January 2021
Artist’s Impression
Fully sold
Knightsbridge

UK – Recurring Income Projects
Artist’s Impression
Strengthening our Presence in London
Aldgate House
70
125 Old Broad Street
NLA 328,806
Tenants 25
Occupancy 94.6%
WALE^ 4.83 years
Income £19.0MM
Yield 4.9%
CDL’s
Acquisition£385MM
NLA 209,840
Tenants 4
Occupancy 86.8%
WALE^ 5.78 years
Income £8.3MM
Yield 4.7%
CDL’s
Acquisition£183MM
Development House
Planning in progress
Artist’s Impression
^ WALE to expiry based on NLA
As of 31 Dec 2020

Hospitality

Hotel Operations
72
Group RevPAR : ↓ 64.5% in FY 2020 (constant currency)
↓ 63.5% in FY 2020 (reported currency)
YTD 2020
$MM
YTD 2019
$MM
Change
%
Revenue 640.4 1,705.0 (62.4)
Profit Before Tax (PBT) (573.4) (6.6) NM*
EBITDA (395.1) 178.3 NM*
Trading Performance
*NM: Not meaningful
Revenue, PBT and EBITDA decreased mainly due to:
• Lockdown measures being reimposed in major destinations such as Japan, Germany, Italy, US and UK, in
response to COVID resurgence threat, limiting international demand and encouraging event
deferment/cancellations.
• A sustainable and meaningful recovery of international travel is dependent on the availability of a viable
medical solution for the masses and consequently the containment of the pandemic globally. Vaccination
efforts are ongoing but expected to extend beyond 2021.
Studio M Hotel Singapore

Hotel Operations (2H 2020 vs 2H 2019)
Hotel Occupancy, Average Room Rate, and RevPAR by Region for CDL Group
* For comparability, 2H 2019 Average Room Rate and RevPAR have been translated at constant exchange rates (31 Dec 2020).
2H 2H Incr / 2H 2H Incr / 2H 2H Incr /
2020 2019 (Decr) 2020 2019 * (Decr) 2020 2019 * (Decr)
% % % pts S$ S$ % S$ S$ %
Singapore 89.8 89.1 0.7 97.1 203.2 (52.2) 87.2 181.2 (51.9)
Rest of Asia 31.8 75.3 (43.5) 114.0 154.6 (26.3) 36.3 116.3 (68.8)
Total Asia 53.1 80.7 (27.6) 103.5 175.5 (41.0) 55.0 141.6 (61.2)
Australasia 45.5 80.8 (35.3) 154.3 161.6 (4.5) 70.3 130.6 (46.2)
London 10.7 80.0 (69.3) 129.3 264.8 (51.2) 13.9 211.8 (93.4)
Rest of Europe 19.7 72.7 (53.0) 135.7 157.8 (14.0) 26.7 114.8 (76.7)
Total Europe 15.5 76.1 (60.6) 133.6 209.5 (36.2) 20.7 159.3 (87.0)
New York 32.9 90.8 (57.9) 142.2 370.3 (61.6) 46.7 336.1 (86.1)
Regional US 34.5 59.7 (25.2) 116.0 188.5 (38.5) 40.0 112.5 (64.4)
Total US 34.0 70.0 (36.0) 124.2 266.5 (53.4) 42.2 186.4 (77.4)
Total Group 37.8 76.4 (38.6) 118.6 207.0 (42.7) 44.8 158.1 (71.7)
RevPARRoom Occupancy Average Room Rate
73

Hotel Operations (FY 2020 vs FY 2019)
Hotel Occupancy, Average Room Rate, and RevPAR by Region for CDL Group
* For comparability, FY 2019 Average Room Rate and RevPAR have been translated at constant exchange rates (31 Dec 2020).
FY FY Incr / FY FY Incr / FY FY Incr /
2020 2019 (Decr) 2020 2019 * (Decr) 2020 2019 * (Decr)
% % % pts S$ S$ % S$ S$ %
Singapore 76.7 86.9 (10.2) 110.7 195.1 (43.3) 84.9 169.6 (49.9)
Rest of Asia 30.6 71.4 (40.8) 121.5 158.3 (23.2) 37.2 113.0 (67.1)
Total Asia 48.2 77.5 (29.3) 114.9 174.4 (34.1) 55.4 135.1 (59.0)
Australasia 45.7 82.4 (36.7) 159.4 157.0 1.5 72.9 129.4 (43.7)
London 17.6 79.1 (61.5) 194.2 243.9 (20.4) 34.2 192.8 (82.3)
Rest of Europe 23.8 71.3 (47.5) 135.4 156.3 (13.4) 32.2 111.4 (71.1)
Total Europe 20.9 74.8 (53.9) 158.9 197.9 (19.7) 33.1 147.9 (77.6)
New York 44.2 86.6 (42.4) 185.4 349.3 (46.9) 82.0 302.7 (72.9)
Regional US 34.7 58.0 (23.3) 132.5 188.9 (29.9) 46.0 109.7 (58.1)
Total US 38.1 67.5 (29.4) 154.2 257.0 (40.0) 58.7 173.5 (66.2)
Total Group 38.6 74.3 (35.7) 137.2 200.6 (31.6) 52.9 149.1 (64.5)
RevPARRoom Occupancy Average Room Rate
74

Hotel Divestments in FY 2020
75
1 In 2013, M&C entered into a compulsory purchase order
agreement with Paradise Circus Limited Partnership
(“PCLP”) - a joint venture comprising developer Argent LLP
and Birmingham City Council - regarding Paradise
Birmingham. The agreements include put and call options
that provide for the Group to acquire an alternate
development site and sale of the existing hotel to PCLP for
£17.2MM (~$30.8MM).
Divestment of three non-core hotel assets resulted in a combined sales value of $104.8MM and pre-tax divestment gains for CDL of $49.9MM, of which $23.9MM will be recognised in 2021.
Non-Core Hotel Divestments held by M&C
Other Hotel Divestments
Millennium Cincinnati. United States
Hotel was closed on 31 December
2019 and sold on 14 February 2020
for US$36MM (~$49MM) with a
disposal gain of $26.0MM.
Millennium Cincinnati
Copthorne Hotel Birmingham, United Kingdom
Copthorne Hotel Birmingham
Option to acquire alternative site under
the agreement1 was not exercised and
terminated in April 2020. Exercised the
put option1 to sell the existing hotel.
Target completion Q3 2021.
Entered a Sale and Purchase Agreement to
sell Penang hotel to Bursa Malaysia-listed
Ivory Properties Group Berhad for RM 75MM
(~$25MM), with a pre-tax gain of $9.2MM.
Copthorne Orchid Hotel & Resort
Penang
Sale of W Hotel to CDL Hospitality
Trusts for $324MM was completed on
16 July 2020. Estimated Net Book
Value at CDL Group level is
$319.5MM.
W Singapore
Copthorne Orchid Hotel & Resort Penang
W Singapore – Sentosa Cove

CDL Hospitality Trusts
76
FY 2020
$MM
FY 2019
$MM
Change
%
Gross Revenue 117.56 196.87 (40.3)
Net Property Income
(NPI)69.33 141.16 (50.9)
The COVID-19 pandemic severely impacted hospitality and
conference businesses globally, affecting CDLHT’s overall
performance due to occupancy declines and hotel closures.
Substantive contributions from SG, NZ and AU hotels partially
insulated the group from the pandemic’s severe impacts.
However, lack of NPI contribution from divested hotels (Novotel
Clarke Quay and Novotel Brisbane) exceeded inorganic NPI
contribution from W Hotel.
CDLHT continues to work with operators and lessees to secure
alternative revenue channels and tighten cost control measures.
Grand Millennium Auckland, New Zealand
Orchard Hotel, Singapore
Trading Performance

CDL Hospitality Trusts
77
CountryYoY change in
RevPAR (%)Remarks
Singapore1 (51.4)
Occupancy supported by continued demand for dedicated isolation
facilities and from foreign workers affected by border closures, but at much
lower RevPAR. Postponement/cancellation of MICE events continues to
weigh on performance. Government working towards border reopening.
Maldives (54.1)
Total tourist arrivals declined 67.4% YTD December 2020. Accordingly,
Raffles Maldives Meradhoo remains closed since 1 April 2020 to contain
costs, while Angsana Velavaru is operating at reduced staffing levels.
New
Zealand(19.2)
Managed isolation business from the government expected to continue
supporting occupancy through 1Q 2021.
Germany (75.5)Adverse impact from absence of major trade fairs, as well as lockdown
measures. Impairment recognized against rental receivables due.
Italy (85.5)Closure of Hotel Cerretani Firenze for 7 of 12 months in the year weighed
on RevPAR. Rental arrangement with Italy Hotel lessee was restructured.
Japan (63.0)Limited international visitor arrivals continued to weigh on demand.
December spike in COVID-19 cases resulted in second state of emergency.
United
Kingdom(68.5)
Fast-changing government restrictions and a new fast-spreading
coronavirus variant curtailed demand in Q4 2020. Government furlough
scheme helped to contain operating costs.
Trading Performance
16 SG Hotels (including W Hotel)

Disclaimer:
This document may contain forward-looking statements that involve
assumptions, risks and uncertainties. Actual future performance, outcomes
and results may differ materially from those expressed in forward-looking
statements as a result of a number of risks, uncertainties and assumptions.
Representative examples of these factors include (without limitation) general
industry and economic conditions, interest rate trends, cost of capital and
capital availability, availability of real estate properties, competition from other
developments or companies, shifts in customer demands, customers and
partners, expected levels of occupancy rate, property rental income, charge
out collections, changes in operating expenses (including employee wages,
benefits and training costs), governmental and public policy changes and the
continued availability of financing in the amounts and the terms necessary to
support future business. You are cautioned not to place undue reliance on
these forward-looking statements, which are based on the current view of
management on future events. Numbers in tables and charts may not add up
due to rounding.

www.cdl.com.sgBOULEVARD 88 I SINGAPORE
Artist’s Impression

Appendix

Diversified Land Bank
Land Area (as at 31 Dec 2020) – CDL’s Attributable Share
81
Type of Development Land Area (sq ft)
Singapore International Total %
Residential 445,642 2,691,016 3,136,658 89
Commercial / Hotel 87,990 296,552 384,542 11
Total 533,632 2,987,568 3,521,200 100
Others*
15%
* Includes Japan, Korea and Malaysia1 Including M&C and its subsidiaries, exclude CDL New Zealand
Total Land Area1 – 3.5MM sq ft
Composition By Segment
Residential
89%
Commercial /
Hotel
11%
Singapore
15%
UK
34%
Composition By Region
Australia
15%
US
21%