Embed Size (px)
Citation preview

MOBILE COMMERCE INDEX
MARCH 2015
BRANDING BRAND
brandingbrand.com
2VISITSIn March 2015, mobile devices generated 54% of all online visits, a 13% increase from March 2014.
MAR2014 30%
48%
18%
Mobile
TabletSmartphoneTotal Visits: 137,638,298
52%
Desktop
39%
54%
15%
Mobile
TabletSmartphoneTotal Visits: 142,082,669
MAR2015
46%
Desktop
Compared to March 2014, desktop’s share of total online visits decreased 12%; smartphone’s share increased 30%.
YEAR-OVER-YEAR CHANGE IN MARKET SHARE
Data Used50 U.S. Mobile Sites on Branding Brand’s Platform; March 1 - 31, 2014 & 2015
Desktop
12%Tablet
17%Smartphone
30%
brandingbrand.com
brandingbrand.com
REVENUE 3
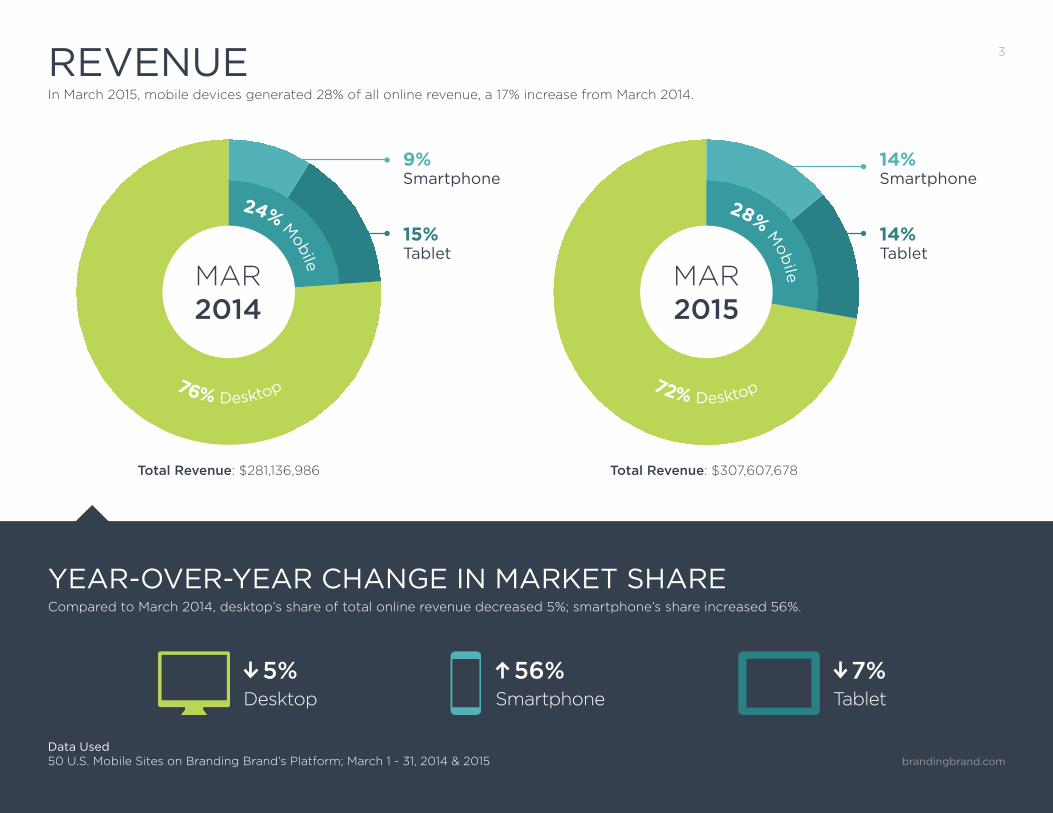
In March 2015, mobile devices generated 28% of all online revenue, a 17% increase from March 2014.
Compared to March 2014, desktop’s share of total online revenue decreased 5%; smartphone’s share increased 56%.
YEAR-OVER-YEAR CHANGE IN MARKET SHARE
Desktop
5%Tablet
7%Smartphone
56%
Total Revenue: $281,136,986
76% Desktop
24% M
obile
MAR2014
9%Smartphone
Total Revenue: $307,607,678
72% Desktop
28%
Mob
ileMAR2015
14%Smartphone
Tablet14%
Tablet15%
Data Used50 U.S. Mobile Sites on Branding Brand’s Platform; March 1 - 31, 2014 & 2015 brandingbrand.com
4
YEAR-OVER-YEAR CHANGE IN GROWTH RATE
Desktop
3%Tablet
7%Smartphone
32%
CONVERSION
MARCH 2014 MARCH 2015
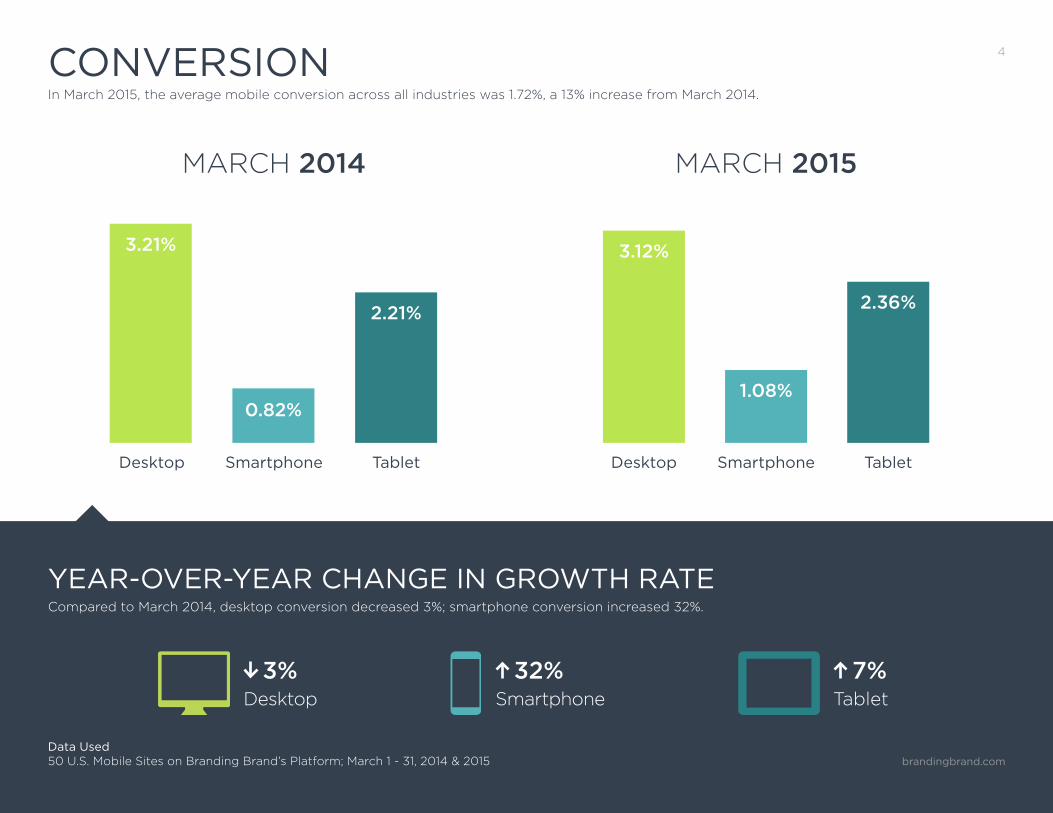
3.21%
Desktop DesktopSmartphone SmartphoneTablet Tablet
3.12%
1.08%
2.36%
0.82%
2.21%
In March 2015, the average mobile conversion across all industries was 1.72%, a 13% increase from March 2014.
Compared to March 2014, desktop conversion decreased 3%; smartphone conversion increased 32%.
Data Used50 U.S. Mobile Sites on Branding Brand’s Platform; March 1 - 31, 2014 & 2015 brandingbrand.com
5
brandingbrand.com
bootolive
jacketblue
sweatercargo
foresttee
buttonflannel
military sleeve
blackcoat
cardigan
blouse
vest
patricks
bright
bathing
lime
hoodie
clothe
s
dress
jeans
short
sarm
y
jogge
rs pant
dark me
n
jeggin
gs
vintag
egir
ls
brown
stripe
d bra
bikini
emera
ld
long
lucky
TRENDING SEARCH
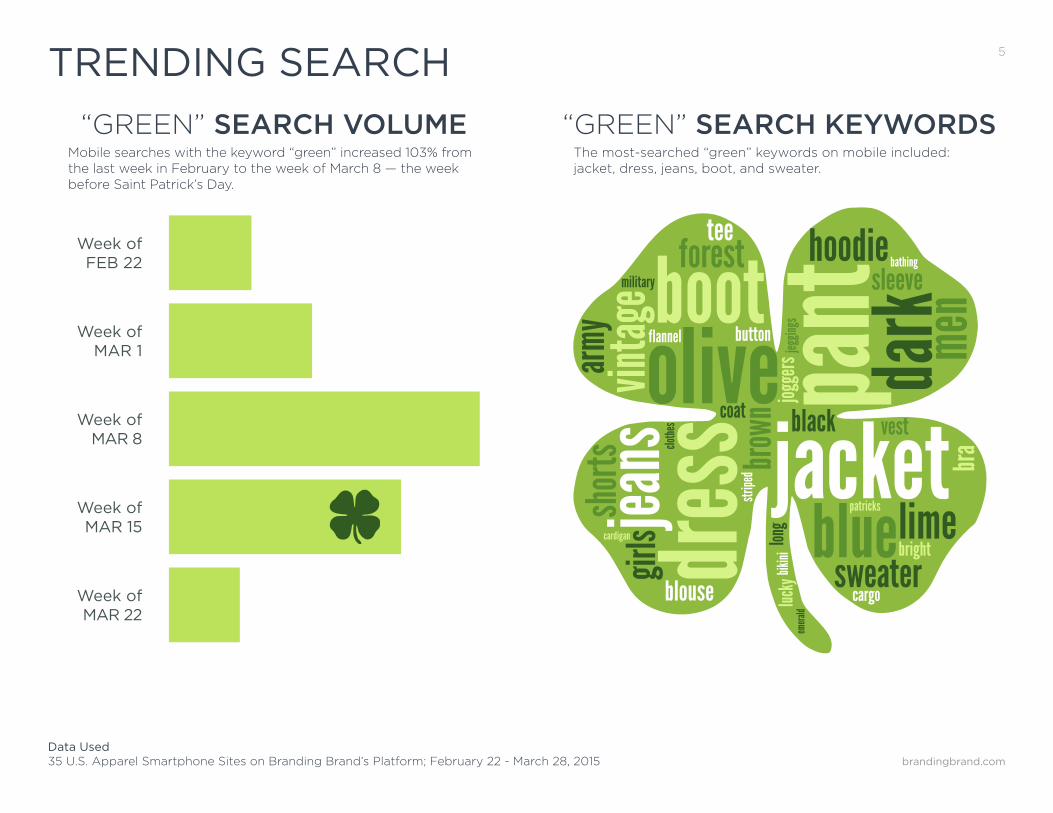
The most-searched “green” keywords on mobile included: jacket, dress, jeans, boot, and sweater.
Mobile searches with the keyword “green” increased 103% from the last week in February to the week of March 8 — the week before Saint Patrick’s Day.
“GREEN” SEARCH VOLUME “GREEN” SEARCH KEYWORDS
Data Used35 U.S. Apparel Smartphone Sites on Branding Brand’s Platform; February 22 - March 28, 2015
Week ofMAR 1
Week ofFEB 22
Week ofMAR 8
Week ofMAR 15
Week ofMAR 22
6QUICK HIGHLIGHTS
ABOUT THE MOBILE COMMERCE INDEX
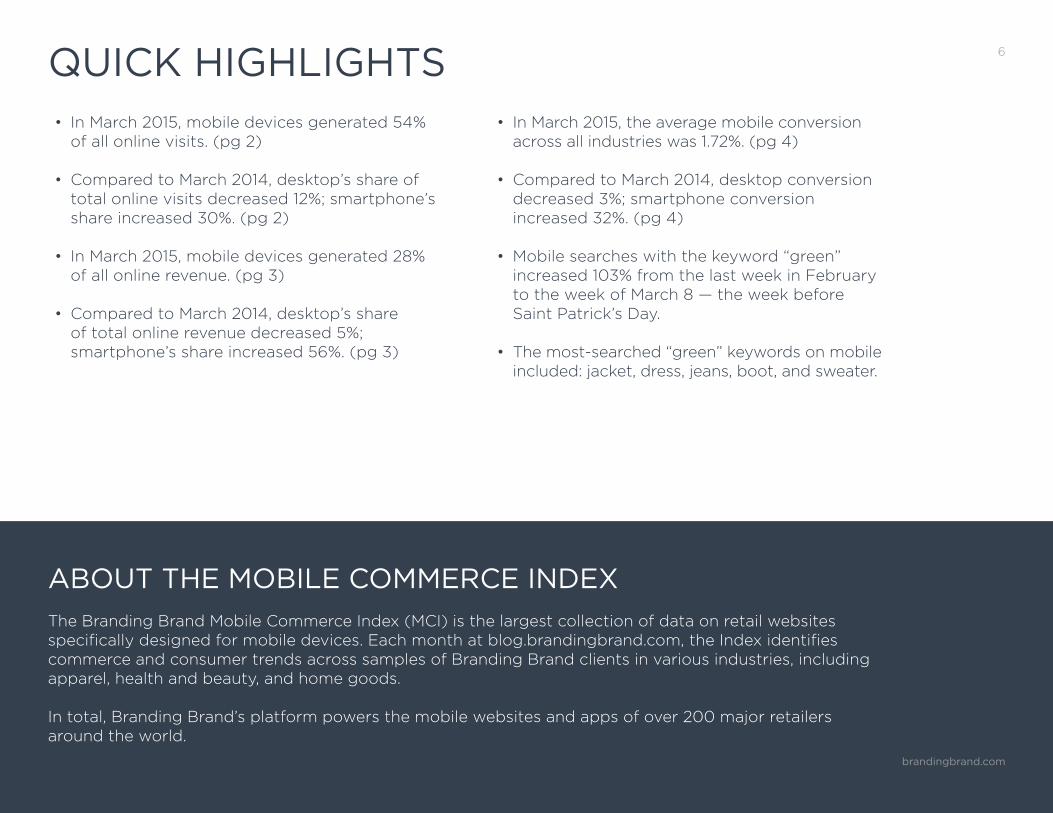
The Branding Brand Mobile Commerce Index (MCI) is the largest collection of data on retail websites specifically designed for mobile devices. Each month at blog.brandingbrand.com, the Index identifies commerce and consumer trends across samples of Branding Brand clients in various industries, including apparel, health and beauty, and home goods.
In total, Branding Brand’s platform powers the mobile websites and apps of over 200 major retailers around the world.
• In March 2015, mobile devices generated 54% of all online visits. (pg 2)
• In March 2015, mobile devices generated 28% of all online revenue. (pg 3)
• Compared to March 2014, desktop conversion decreased 3%; smartphone conversion increased 32%. (pg 4)
• Compared to March 2014, desktop’s share of total online visits decreased 12%; smartphone’s share increased 30%. (pg 2)
• Compared to March 2014, desktop’s share of total online revenue decreased 5%; smartphone’s share increased 56%. (pg 3)
• Mobile searches with the keyword “green” increased 103% from the last week in February to the week of March 8 — the week before Saint Patrick’s Day.
• The most-searched “green” keywords on mobile included: jacket, dress, jeans, boot, and sweater.
• In March 2015, the average mobile conversion across all industries was 1.72%. (pg 4)
brandingbrand.com