Embed Size (px)
Citation preview
JULY 2015
Branding Brand
MOBILE COMMERCE INDEX
Mobile Commerce Index: July 2015 | Branding Brand
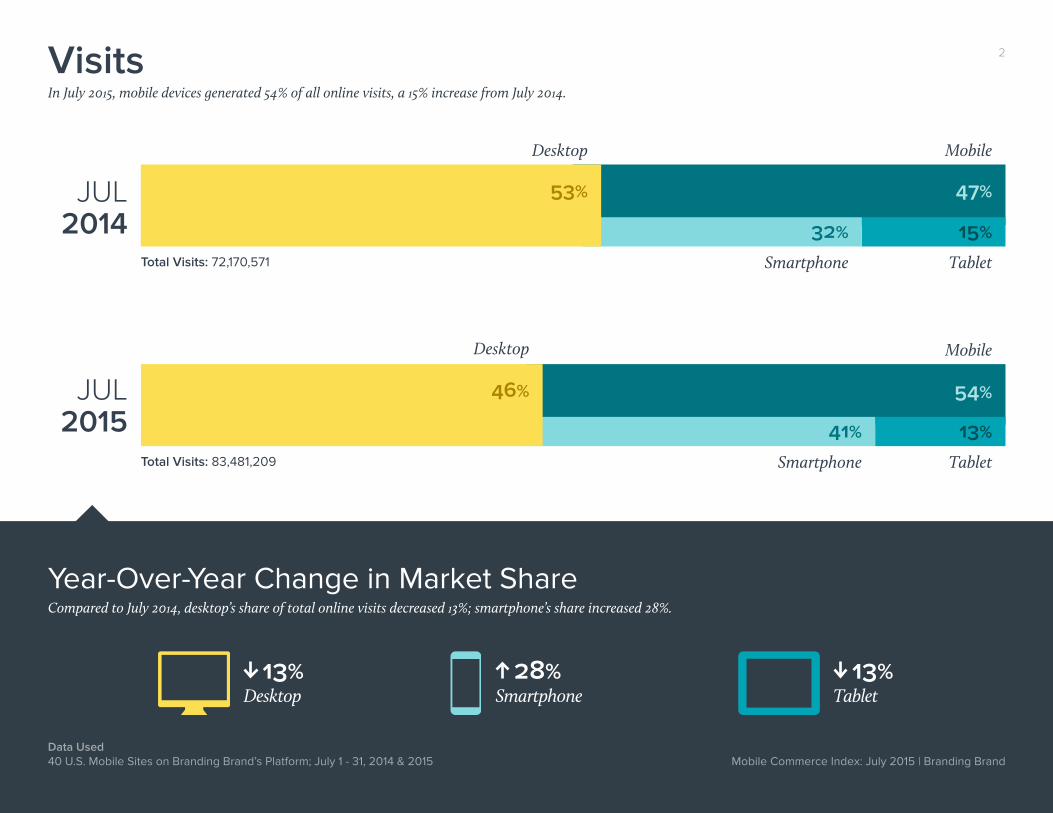
Visits
JUL2014 32%
47%
15%
Mobile
TabletSmartphoneTotal Visits: 72,170,571
53%
Desktop
41%
54%
13%
Mobile
TabletSmartphoneTotal Visits: 83,481,209
JUL2015
46%
Desktop
In July 2015, mobile devices generated 54% of all online visits, a 15% increase from July 2014.
Compared to July 2014, desktop’s share of total online visits decreased 13%; smartphone’s share increased 28%.
Year-Over-Year Change in Market Share
Desktop13%
Tablet13%
Smartphone28%
Data Used40 U.S. Mobile Sites on Branding Brand’s Platform; July 1 - 31, 2014 & 2015 Mobile Commerce Index: July 2015 | Branding Brand
2
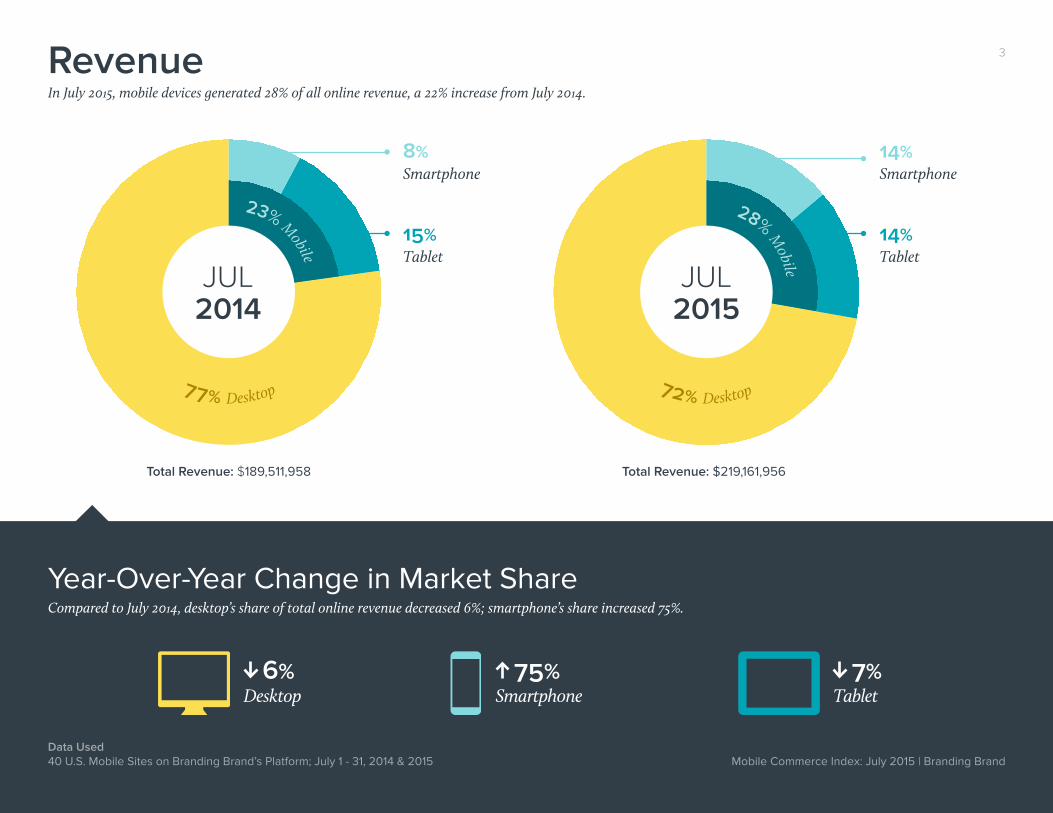
In July 2015, mobile devices generated 28% of all online revenue, a 22% increase from July 2014.
Compared to July 2014, desktop’s share of total online revenue decreased 6%; smartphone’s share increased 75%.
Year-Over-Year Change in Market Share
Total Revenue: $189,511,958
77% Desktop
23% M
obile
8%Smartphone
Total Revenue: $219,161,956
72% Desktop
28% MobileJUL
2015JUL2014
14%Smartphone
Tablet14%
Tablet15%
Revenue
Desktop6%
TabletSmartphone75%
Data Used40 U.S. Mobile Sites on Branding Brand’s Platform; July 1 - 31, 2014 & 2015 Mobile Commerce Index: July 2015 | Branding Brand
3
7%
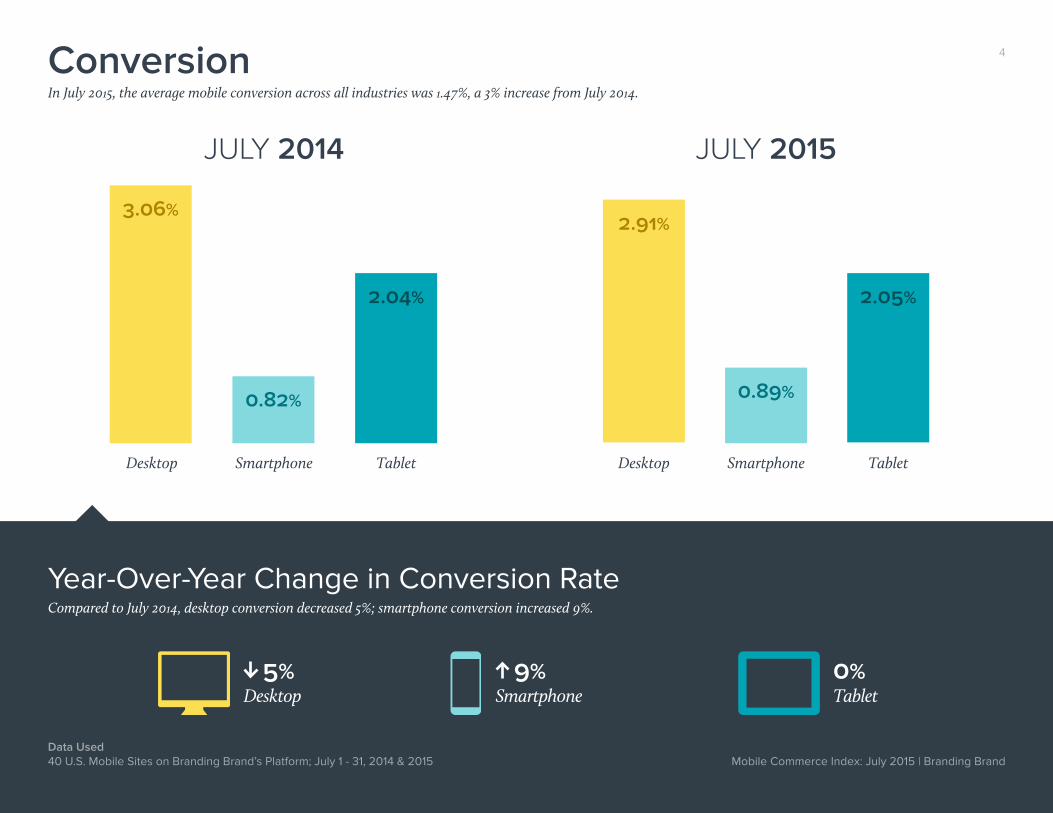
JULY 2014 JULY 2015
3.06%
Desktop DesktopSmartphone SmartphoneTablet Tablet
2.91%
0.89%
2.05%
0.82%
2.04%
ConversionIn July 2015, the average mobile conversion across all industries was 1.47%, a 3% increase from July 2014.
Compared to July 2014, desktop conversion decreased 5%; smartphone conversion increased 9%.
Year-Over-Year Change in Conversion Rate
Desktop5%
Tablet0%
Smartphone9%
Data Used40 U.S. Mobile Sites on Branding Brand’s Platform; July 1 - 31, 2014 & 2015 Mobile Commerce Index: July 2015 | Branding Brand
4
Quick Highlights
About the Mobile Commerce Index
• In July 2015, mobile devices generated 54% of all online visits, a 15% increase from July 2014. (pg 2)
• In July 2015, mobile devices generated 28% of all online revenue, a 22% increase from July 2014. (pg 3) • Compared to July 2014, desktop conversion
decreased 5%; smartphone conversion increased 9%. (pg 4)
• Compared to July 2014, desktop’s share of total online visits decreased 13%; smartphone’s share increased 28%. (pg 2)
• Compared to July 2014, desktop’s share of total online revenue decreased 6%; smartphone’s share increased 75%. (pg 3)
• In July 2015, the average mobile conversion across all industries was 1.47%, a 3% increase from July 2014. (pg 4)
The Branding Brand Mobile Commerce Index (MCI) is the largest collection of data on retail websites specifically designed for mobile devices. Each month at blog.brandingbrand.com, the Index identifies commerce and consumer trends across samples of Branding Brand clients in various industries, including apparel, health and beauty, and home goods.
In total, Branding Brand’s platform powers the mobile websites and apps of over 200 major retailers around the world. Mobile Commerce Index: July 2015 | Branding Brand
5