Embed Size (px)
Citation preview
THE IMPACT OF CROSS-CULTURAL DIFFERENCES ON PURCHASING
HABITS OF RUSSIAN AND DUTCH CONSUMERS
By
Natalja Judina
A DISSERTATION
Submitted to
The University of Liverpool
In partial fulfillment of the requirements for the degree of
MASTER OF SCIENCE IN GLOBAL MARKETING
2011
A Dissertation entitled THE IMPACT OF CROSS-CULTURAL DIFFERENCES ON PURCHASING HABITS OF
RUSSIAN AND DUTCH CONSUMERS By Natalja Judina
We hereby certify that this Dissertation submitted by Natalja Judina conforms to acceptable standards, and as such is fully adequate in scope and quality. It is therefore approved as the fulfillment of the Dissertation requirements for the degree of Master of Science in Global Marketing.
Approved:
Dissertation Advisor Date Roger Davies
The University of Liverpool 2011
CERTIFICATION STATEMENT I hereby certify that this paper constitutes my own product, that where the language of others is set forth, quotation marks so indicate, and that appropriate credit is given where I have used the language, ideas, expressions or writings of another.
Signed Natalja Judina
i
ABSTRACT
THE IMPACT OF CROSS-CULTURAL DIFFERENCES ON
PURCHASING HABITS OF RUSSIAN AND DUTCH CONSUMERS
by
Natalja Judina The current study examined how cultural differences between Dutch and Russian consumers
resulted in differentiated purchasing behavior of personal care products. The objective of the study
was to demonstrate that marketing strategies have to be tailored to various cultural groups in order
to maximize purchasing power. Methodologically, the data for this research was gathered in
Russia and the Netherlands. Specifically, Dutch and Russian consumers were recruited through a
combination of social networks, forums and personal contacts. Consumers were given a detailed
questionnaire on their purchasing habits and attitude towards personal care products. The results
from each cultural group were compared using a paired t-test. Results demonstrated the existence
of great cultural differences in consumer purchasing behavior between Russia and the
Netherlands. Similar to other studies conducted in this area, the current study revealed a need for
investigation of cultural based specific needs, preferences, demands and desires before
approaching a target groups in a foreign market. It is important to examine the validity of a
developed marketing approach with regards to cultural values to guarantee an effect within a
foreign market since culture plays a highly important role in international business.
The results from the current study demonstrated that one of the aspects that can provide cross-
cultural researchers with a specific knowledge is an investigation of consumer decision-making
style. Identification of basic characteristics in consumer decision-making style allows analyzing of
cross-cultural differences in a more specific field. It also helps to make an individual profile of
consumer’s style of investigated countries.
ii
The results from data investigation showed, on the one side, that culture does have an impact on
consumers’ use, preferences and needs towards personal care products. On the other side,
international organizations seemed to approach a foreign market and developing of marketing
communication for a product in a way that probably does not take into account all cultural factors
and specific preferences of targeted group in unknown market. The latter can lead at the end of a
process to lack of understanding by consumers of product purposes and weak consumer – product
relationship, which will resulted in negative selling outcomes.
Practically, this study contributes to better understanding to conducting of cross-cultural research
aimed to uncover consumer behavior differences towards a particular product in unknown
markets. It also provides few suggestions and tips to international marketing approach on an
operational level.
iii
ACKNOWLEDGEMENTS
First of all, I would like to thank my advisor Roger Davies for his support and guidance during
this difficult period of time: writing the dissertation. Furthermore, I would like to thank very much
my dear friend Aldemar Degroot for his constant encouragement, advice and comments with
regards to writing of my dissertation. Without his help, it would be very tough for me to get to the
finish. I also would like to thank my friends, Elena Kalugina, Choro and Elona Boellaard for their
friendship and support throughout this period of my life. Last, but not least, I thank my mother for
her unconditional love and faith in me.
I thank you all from all my heart!
iv
Table of contents
ABSTRACT .................................................................................................................................................... I!
ACKNOWLEDGEMENTS ........................................................................................................................ III!
LIST OF TABLES ...................................................................................................................................... VI!
LIST OF FIGURES ................................................................................................................................... VII
CHAPTER 1! INTRODUCTION ........................................................................................................... 1!
1.1! Background ................................................................................................................................ 1!
1.2! Problem statement ...................................................................................................................... 1!
1.3! Research area ............................................................................................................................. 3!
1.4! Research questions ..................................................................................................................... 4!
1.5! Purpose ....................................................................................................................................... 4!
1.6! Research approach ..................................................................................................................... 5!
1.7! Synopsis ..................................................................................................................................... 5!
CHAPTER 2! LITERATURE REVIEW .............................................................................................. 7!
2.1! Beauty and Personal care market ................................................................................................ 7!
2.1.1! Beauty and Personal care market: Russia .................................................................................. 9!
2.1.2! Beauty and Personal care market: the Netherlands .................................................................. 10!
2.2! Issues in international marketing .............................................................................................. 11!
2.2.1! Standardization versus adaptation ............................................................................................ 11!
2.2.2! Country specifics: Russia ......................................................................................................... 13!
2.2.3! Country specifics: the Netherlands .......................................................................................... 15!
2.3! Culture ....................................................................................................................................... 16!
2.3.1! Defining culture ....................................................................................................................... 16!
2.3.2! Measuring culture ..................................................................................................................... 17!
2.4! Summary .................................................................................................................................. 19!
CHAPTER 3! METHODOLOGY ....................................................................................................... 21!
3.1! Research strategy ..................................................................................................................... 21!
3.2! Research method ...................................................................................................................... 22!
3.3! Research design ........................................................................................................................ 22!
3.3.1! Secondary data: Dove .............................................................................................................. 23!
3.3.2! Primary data: survey design ..................................................................................................... 23!
3.3.2.1! The Modified CSI Model .................................................................................................... 24!
3.3.3! Other measurements ................................................................................................................. 26!
3.3.4! Survey distribution ................................................................................................................... 27!
3.4! Data analysis ............................................................................................................................ 28!
v
3.5! Evaluation of method ............................................................................................................... 29!
CHAPTER 4! PRESENTATION AND ANALYSIS .......................................................................... 31!
4.1! Secondary data collection: case Dove ...................................................................................... 31!
4.2! Primary data collection and sample characteristics ................................................................. 33!
4.3! Analysis of sample questions ................................................................................................... 36!
4.3.1! Perfectionistic, high quality conscious consumer .................................................................... 36!
4.3.2! Brand conscious consumer ....................................................................................................... 38!
4.3.3! Innovation conscious/variety seeking consumer ...................................................................... 40!
4.3.4! Recreation and hedonistic shopping consciousness ................................................................. 41!
4.3.5! Price conscious consumer ........................................................................................................ 43!
4.3.6! Impulsive, careless consumer ................................................................................................... 44!
4.3.7! Confused by overchoice consumer .......................................................................................... 45!
4.3.8! Habitual, brand-loyal consumer ............................................................................................... 47!
4.4! Analysis of actual experience questions .................................................................................. 48!
4.4.1!Analysis of questions regarding Dove products ........................................................................ 49!
4.4.2! Analysis of attitude towards the brand Dove ........................................................................... 55!
CHAPTER 5! CONCLUSIONS AND DISCUSSIONS ...................................................................... 57!
5.1! Cultural dimensions of Hofstede .............................................................................................. 57!
5.2! High-Low context cultures of Hall .......................................................................................... 62!
5.3! Overview of the key differences .............................................................................................. 62!
5.3.1! CSI and Hofstede’s cultural dimensions .................................................................................. 64!
5.3.1.1! Power distance .................................................................................................................... 64!
5.3.1.2! Individualism/Collectivism ................................................................................................. 65!
5.3.1.3! Masculinity/Femininity ....................................................................................................... 66!
5.3.1.4! Uncertainty avoidance ......................................................................................................... 67!
5.3.2! Differences related to brand Dove ........................................................................................... 68!
5.4! Conclusions .............................................................................................................................. 69!
5.5! Recommendations .................................................................................................................... 71!
5.6! Limitations of the present study ............................................................................................... 73!
5.7! Suggestions for future research ................................................................................................ 75!
BIBLIOGRAPHY ........................................................................................................................................ 77!
APPENDIX I ................................................................................................................................................. 84!
APPENDIX II ............................................................................................................................................... 89!
APPENDIX III ............................................................................................................................................. 94!
APPENDIX IV .............................................................................................................................................. 95!
vi
LIST OF TABLES Table 3.1 Scores on Hofstede’s Dimensions for Russia and the Netherlands…………..28
Table 4.1 Respondent profiles by country……………………………………………….34
Table 4.2 T-Test: High quality conscious consumer…………………………………….36
Table 4.3 Pearson Correlation: age range and high-low quality dimensions……………37
Table 4.4 T-test: Brand conscious dimensions…………………………………………..38
Table 4.5 Pearson Correlation: age range and brand conscious dimensions…………….38
Table 4.6 T-test: Innovation/variety conscious consumer……………………………….39
Table 4.7 Pearson Correlation: Age range and innovation/variety seeking consumer…..40
Table 4.8 T-test: Recreation conscious consumer……………………………………….41
Table 4.9 Pearson Correlation: Age range and recreation conscious consumer…………41
Table 4.10 T-test: Price conscious consumer……………………………………………...42
Table 4.11 Pearson Correlation: Age range and price conscious consumer………………43
Table 4.12 T-test: Impulsive and careless consumer………………………………………43
Table 4.13 Pearson Correlation: Age range and impulsive consumer…………………….44
Table 4.14 T-test: Confused by overchoice consumer…………………………………….44
Table 4.15 Pearson Correlation: Age range and impulsive consumer…………………….45
Table 4.16 T-test: Brand- loyal consumer…………………………………………………45
Table 4.17 Pearson Correlation: Age range and brand- loyal consumer………………….46
Table 4.18 Familiarity with brand Dove………………………………………………….47
Table 4.19 How often products of Dove were bought by respondents in both groups?......48
Table 4.20 Opinion regarding use the products of Dove………………………………….49
Table 4.21 Satisfaction factor towards Dove products……………………………………50
Table 4.22 Attitude towards communication activities of Dove………………………….51
Table 4.23 Pearson Correlation: Influence of communication activities …………………52
Table 4.24 Pearson Correlation: Brand perception………………………………………..53

vii
LIST OF FIGURES Figure 3.1 Scores on Hofstede’s Dimensions for Russia and the Netherlands……………29
1
Chapter 1 Introduction
1.1 Background
The emergence of globalization is reshaping the world. It has brought many advantages to
companies around the world, such as the possibility of market share expansion, increasing
economy of scale, attracting more consumers from around the world and consequently enhancing
overall organizational profitability. Globalization opens up lots of opportunities for each and
everyone on many levels, but is also met with some obstacles. There are many issues faced by an
organization that intends to sell its products internationally. Various problems are incurred when
an organization expands internationally and needs to implement the correct marketing approach to
be successful in foreign countries. Some of these problems are: foreign language, differences in
product needs and product preferences and differences in perceptions that consumers have in the
various geographical locations (Firoz & Ramin, 2004). In addition, there are also cultural
differences that influence consumers’ choices and have an effect on how consumers make their
buying decisions and understand newly offered products on the market.
Culture plays an important part in our lives with regards to forming and shaping our individuality.
Culture encompasses different elements such as history, customs, beliefs, habits and values that
altogether determine the way individuals think and react to the world around them. Hence, cultural
influences should have a big impact on consumers’ choices and how consumers make their buying
decisions. Therefore, the ability of an organization to understand how to approach the consumers
in a new market is equal to the success of that organization in that market.
1.2 Problem statement
2
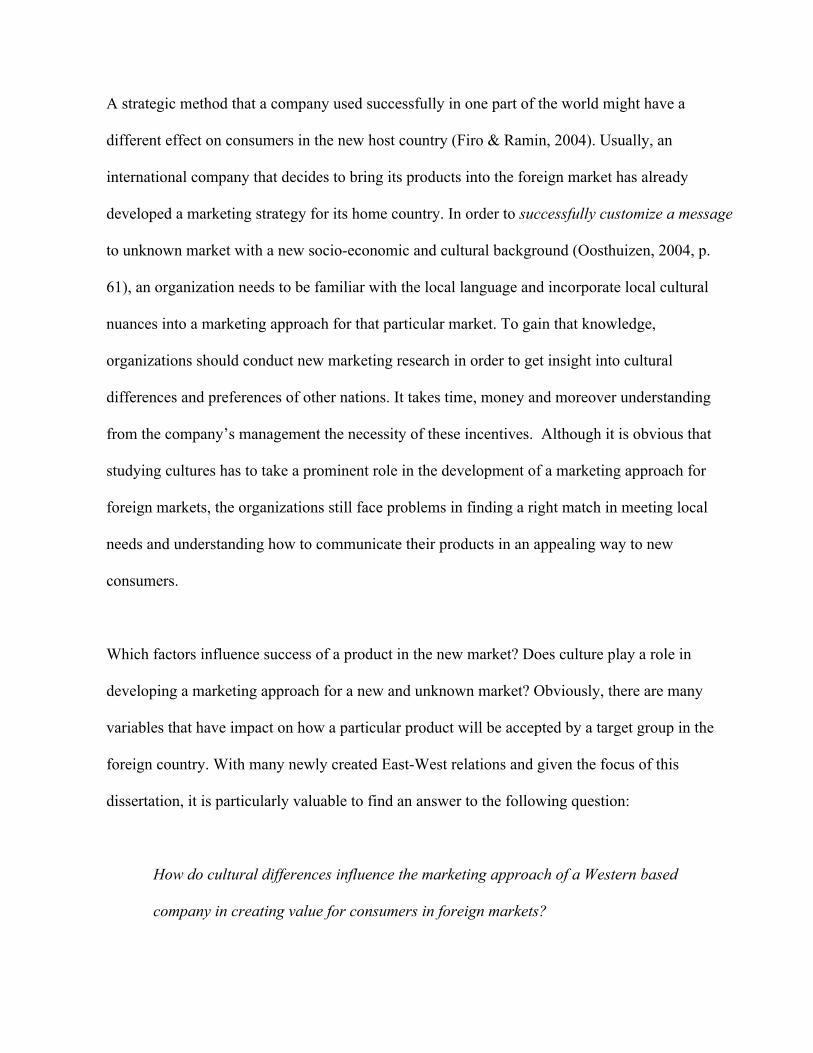
A strategic method that a company used successfully in one part of the world might have a
different effect on consumers in the new host country (Firo & Ramin, 2004). Usually, an
international company that decides to bring its products into the foreign market has already
developed a marketing strategy for its home country. In order to successfully customize a message
to unknown market with a new socio-economic and cultural background (Oosthuizen, 2004, p.
61), an organization needs to be familiar with the local language and incorporate local cultural
nuances into a marketing approach for that particular market. To gain that knowledge,
organizations should conduct new marketing research in order to get insight into cultural
differences and preferences of other nations. It takes time, money and moreover understanding
from the company’s management the necessity of these incentives. Although it is obvious that
studying cultures has to take a prominent role in the development of a marketing approach for
foreign markets, the organizations still face problems in finding a right match in meeting local
needs and understanding how to communicate their products in an appealing way to new
consumers.
Which factors influence success of a product in the new market? Does culture play a role in
developing a marketing approach for a new and unknown market? Obviously, there are many
variables that have impact on how a particular product will be accepted by a target group in the
foreign country. With many newly created East-West relations and given the focus of this
dissertation, it is particularly valuable to find an answer to the following question:
How do cultural differences influence the marketing approach of a Western based
company in creating value for consumers in foreign markets?
3
In order to analyze the influence of cultural differences, we need to investigate how consumers in
different countries use, wish to use, understand or desire a particular product. The profound
research into cultural differences, preferences and traditions of targeted groups from different
markets will help to gain required knowledge and to understand the market differences. The
consideration of those differences help to create a framework for developing a marketing approach
aimed to reach a target group of unknown markets in a more appealing way.
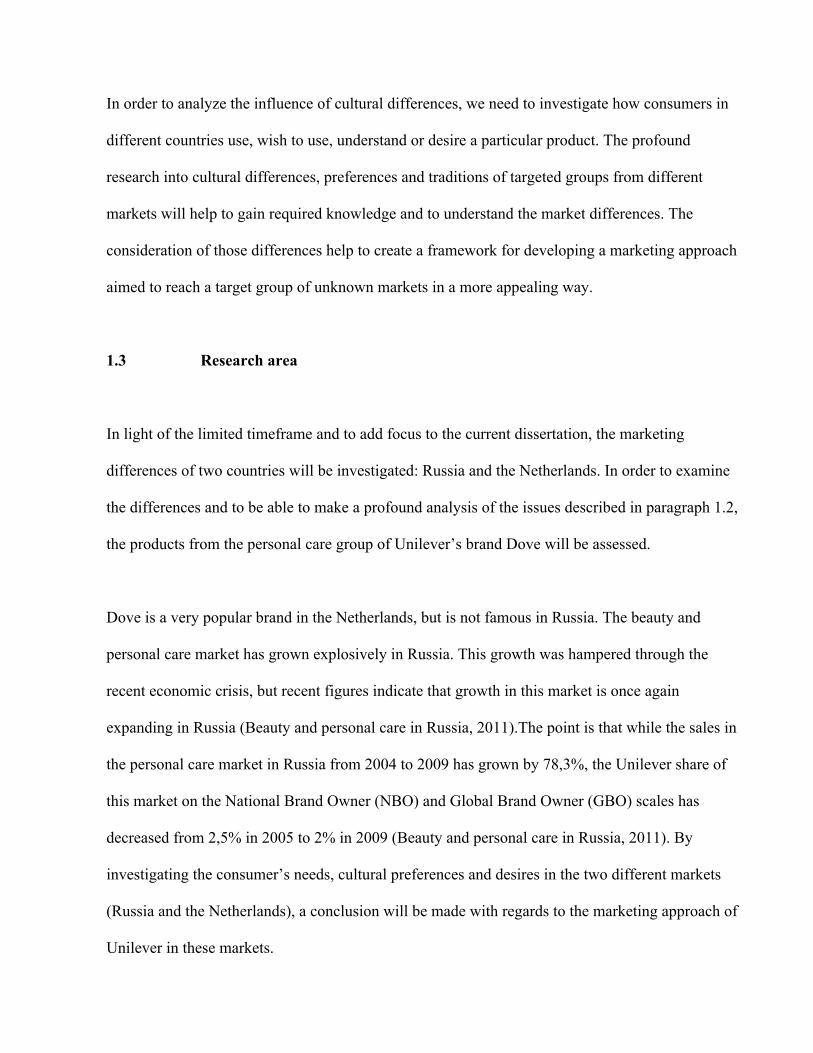
1.3 Research area
In light of the limited timeframe and to add focus to the current dissertation, the marketing
differences of two countries will be investigated: Russia and the Netherlands. In order to examine
the differences and to be able to make a profound analysis of the issues described in paragraph 1.2,
the products from the personal care group of Unilever’s brand Dove will be assessed.
Dove is a very popular brand in the Netherlands, but is not famous in Russia. The beauty and
personal care market has grown explosively in Russia. This growth was hampered through the
recent economic crisis, but recent figures indicate that growth in this market is once again
expanding in Russia (Beauty and personal care in Russia, 2011).The point is that while the sales in
the personal care market in Russia from 2004 to 2009 has grown by 78,3%, the Unilever share of
this market on the National Brand Owner (NBO) and Global Brand Owner (GBO) scales has
decreased from 2,5% in 2005 to 2% in 2009 (Beauty and personal care in Russia, 2011). By
investigating the consumer’s needs, cultural preferences and desires in the two different markets
(Russia and the Netherlands), a conclusion will be made with regards to the marketing approach of
Unilever in these markets.
4
The aim of this dissertation is, therefore, to increase the understanding of the impact that cultural
differences have on developing marketing approach for establishing products or brand(s) in
foreign markets. The investigation of the cultural preferences of Russian and Dutch consumers
and the consideration of the factors that have an impact on the marketing approach developed for
those different markets will help to gain a better understanding of the factors influencing success
of marketing a product in Russia and in the Netherlands.
1.4 Research questions
This dissertation aims to examine the impact of cultural differences on preferences in use, needs
and demands towards a product in two countries and how a marketing approach developed for
these markets appeals in reality to consumers of those markets. Specifically, the objective of the
dissertation is to address the following questions:
1) How does culture impact consumers’ use of personal care products?
2) Which aspects of personal care products are most and least important to consumers in
different cultures?
3) How does the marketing approach developed for those markets in actual context appeals to
the targeted groups in terms of the differences in their cultural backgrounds, norms,
traditions, values, symbols and other elements of culture that consumers of those markets
have?
1.5 Purpose
5
In short, this dissertation will examine if a company takes into account cultural differences to
develop a marketing strategy and if this developed strategy actually corresponds to the demand
and needs of the consumers. It is hypothesized that there is no complete correspondence between
the marketing approach and the foreign consumers’ demands and needs and this dissertation will
seek to examine the differences. Once these differences have been identified, the observed
discrepancies can be used to give organizations new insights and support in developing a more
successful strategy in the future.
1.6 Research approach
To fulfill the purpose described above and to investigate the cultural differences of the consumers,
a quantitative measure will be applied. An on line as opposed to paper format will allow for the
assessment of a larger consumer base. The same questionnaire will be distributed in Russia as well
as in the Netherlands. The responses of the questionnaire will provide insight into the consumer’s
perception of the product, their overall demands, and preferences in use, needs, wishes and
desires. But the nature of the answers will also highlight cultural differences between the different
consumer groups and understand how a company applies these differences into a marketing
approach.
1.7 Synopsis
The first chapter explained the purpose of this dissertation, the research problem and the research
approach that is going to be used for the research. Chapter two outlines the theoretical
background, discusses literature that provides further insight into the strategy related to
globalization and highlights the effects that cultural differences have on consumer choice. This
6
information will be used as a basis for developing a framework for research and explanation of the
results of the research. Chapter three explains in detail the research design of the study. Next, in
chapter four, the data from the research results will be presented and analyzed. Finally, in chapter
five, conclusions will be drawn and a recommendation for managers working for international
organizations will be given. Also limitations of this study and suggestions for future research will
be provided in this chapter.
7
Chapter 2 Literature Review
In order to understand how a company’s marketing approach in real life corresponds with local
preferences and needs of consumers in different countries, the consumers’ behavior, attitude and
perceptions towards personal care products need to be examined. Furthermore, their expectations
and desires have to be reviewed. Also the beauty and personal care market will be described and
analyzed. Lastly, culture, its definition and its influence on consumer purchase behavior will be
discussed and analyzed.
2.1 Beauty and Personal care market
This paragraph is devoted to examining the beauty and personal care industry to identify the
general situation of the market and to understand the profile of consumers in this market. Also, the
market situation in both Russia and the Netherlands is described and analyzed.
The sector of beauty and personal care products is one of the fastest growing markets in the world.
For instance, between the years 2005-2009, the beauty and care product market increased by 2.9%
(Personal Products Industry Profile: Europe, 2010). The market analysts forecasted the increase of
market value by 15.4% by the year 2014 (Personal Products Industry Profile: Europe, 2010). It is
also confirmed both by recent market research and through analyses published by Euromonitor
International in “Looking for Growth: non-stop opportunities within Beauty and Personal Care”
(2010) that beauty and personal care products will see the most potential in global growth by the
year of 2014. These are quite impressive figures that immediately make one wonder what an
organization that is active in this market should do in order to be a part of the expanding beauty
market.
8
The increased demand in this sector opens up lots of opportunities worldwide for organizations to
grow, but also creates a highly competitive environment. Tough competition demands from
organizations to continuously come up with new and innovative products in order to keep its
products on the shelves. This trend can also result in an oversaturation in this market in some
developed countries (Renfrow, 2008).
There is, however, no reason for surprise about such growth in beauty and personal care. First, the
expanding research and development in this area supported the production of many innovative
products. Hence, when people realize a good effect of those products, they definitely want to
spend money on products that make them feel good and make them look better.
Second, a high improvement of healthcare, especially in developed countries, has raised life
expectancy of people and given birth to an ageing population. This is a category of people, who
has more disposable income to buy the products they desire, lead a healthier life and above that is
highly concerned about their personal appearance. Therefore, people’s expectations regarding
their look have also created more users of beauty and personal care products.
Finally, the demographics of this market expand dramatically as organizations see the new
opportunities and want to cover not only women beyond their usual target group of 18-34, but also
men. New target groups, ranging from pre-teens to baby boomers, and even existing target groups
demand different personal care products and customization of those products to different ages,
various skin types and colors (Renfrow, 2008). As a consequence, a future growth in this sector
will be driven by more detailed product segmentation and further innovations in the area of
treatments of acne, loss of hair and anti-aging products (Personal Products Industry Profile:
Europe, 2010).
9
From the above description it is obvious that organizations in the beauty and personal care
category have to get a really good and profound understanding of the market, including its
segmentation variety in order to choose the right target group(s) for their products and a right
approach for marketing those products.
2.1.1 Beauty and Personal care market: Russia
The Russian market of beauty and personal care products is very dynamic. Even the recent
economic crisis, which slowed down the previous rapid growth, did not have the expected effect
on the consumption of beauty and personal care products. This results from an enormous demand
in this market. Furthermore, in comparison with the European market of this category, the
products offered in Russia are far from saturated (Beauty and personal care in Russia, 2011). The
other reason is high spending on personal care products that increased rapidly in the early years
thanks to the growing income of Russian people and a subsequent ability to afford non-essential
(i.e. luxury) products (Consumer lifestyle in Russia, 2011).
Russian consumers, especially women, are well known for their emphasis on external appearance.
As such, personal grooming and appearance have a high priority for them. Since the majority of
people in Russia has no concerns in spending money on their appearance and has an increasing
amount of disposable income, this creates a lot of potential for organizations. Most of Russian
people spend lots of time by grooming and dressing before going out or going to work. It is, for
instance, no done for Russian women to appear without proper make-up on their face. It is quite
different from Dutch standards. In part fueled by an increasing middle class, the beauty and
personal care market in Russia will continue to grow. The sales will especially remain active in
large industrial cities. The tendency towards organic and natural beauty and personal care products

10
will further develop that will lead to production of new innovative alternatives consisting of more
natural ingredients (Zaretskaya, 2006).
2.1.2 Beauty and Personal care market: the Netherlands The Dutch market of beauty and personal care products is mature and has a high penetration.
Despite the oversaturation of this market plus difficult environment of economic uncertainty and
slowdown, it has managed to achieve healthy growth in 2009. The growth, however, was mostly
driven by mass products as Dutch people try to limit their spenditure on more expensive products
(Consumer lifestyle in the Netherlands, 2009). Furthermore, Dutch consumers begin slowly to
change their outlook and view on their image and look, which have traditionally focused on
health. The main trend is driven by the desire of Dutch women and men, from teenagers to
seniors, to achieve the great body image that is sold to them via different media channels ranging
from print to television and Internet (Consumer lifestyle in the Netherlands, 2009).
The present generation of Dutch people is starting to consider that the products offered by the
beauty and personal care market may be essential for improving overall quality of life. It has also
been demonstrated that there is a shift in consumers’ needs towards products with natural
ingredients and products that are more tailored to specific needs.
For future developments in the beauty and personal care market in the Netherlands, innovation is
seen as the most important element to success. It asks from organizations to invest in the creation
of new, more value added and tailored to specific needs products. In addition, the products that
can improve image will be very popular in the near future. Furthermore, there is an increased shift
in the market towards skin ageing products as ageing population continue to grow and there is
11
strong interest in anti-aging products in general (Knaggs, 2009). However, one of the main
challenges for organizations is to build a closer relation with consumers to ensure brand loyalty.
2.2 Issues in international marketing
This section is aimed to discuss the main issues that international organizations face by
approaching a foreign market. In order to stay competitive, many organizations seek out new
markets that offer them global growth and overall profitability. International expansion opens for
organizations possibilities to build global brand recognition. To gain success on this terrain, the
organizations face many issues. These issues include developing marketing strategy for foreign
country. A complete new environment has to be first assessed from different angels in order to
create a marketing approach that will be applicable, competitive and help to maintain a global
success of organization in general.
2.2.1 Standardization versus adaptation One of the main decisions that has to be made and which continually keep busy the minds of
scientists and practitioners, is whether to adapt or standardize a marketing communication
approach for a new country. The debate about standardization or adaptation of marketing - and
brand strategy and advertising campaign is a discussion point of many studies that bring up
different opinions and perspectives with regards to this subject (Krolikowska & Kuenzel, 2008;
Medina & Duffy, 1998; Solberg, 2002).
To gain a better understanding of this discussion point, the definition of both, standardization and
adaptation has to be first clearly identified. The concept of standardization is described as the
process of extending and effectively applying domestic target-market- dictated product standards
12
to markets in foreign environments (Median & Duffy, 1998, p. 229). In other words, international
organizations approach a new market uniformly with the marketing mix and activities developed
for its domestic market. The concept of adaptation is described as the mandatory modification of
domestic target-market-dictated products standards as to make the product suitable to foreign
environmental conditions (Median & Duffy, 1998, p. 231). It refers to that international
organizations decided to market its products according to local needs and environmental
conditions.
Solberg (2002) investigated the adaptation and standardization approaches applied by international
firms from an organizational perspective and found that better knowledge of the local market leads
to a more standardized marketing approach by organizations. On the other hand, Solberg (2002)
advocated that the lack of market knowledge gives more freedom to the local representatives,
which results in the application of the adaptation approach. According to another study, the
standardization of an international communication strategy seems more likely to be applied in
markets that are similar to the domestic market and that have similarities in consumer’s demands
and needs (Samiee at all, 2001). In contrast to this source, Gabrielsson, Gabrielsson &
Gabrielsson (2008) advocated that the internationalization process within the home continent leads
organizations to adaptation and not standardization of advertising campaigns. The extension to
other continents, on the other hand, results in organizations applying a standardization approach.
These differences in opinions lead to assumption that there is no adequate global language (de
Mooij, 2010, p. 19) to develop one standard approach for reaching consumers in different
countries. No doubt, this modern, highly-competitive and fast-moving business environment
creates many challenges for organizations. However, the main issue that arises from debates and
studies regarding adaptation or standardization strategy is still the same: which strategy assures a
13
success in a particular foreign market? How should the organization manage its unique corporate
image within the global arena?
Every country has it specific features in terms of economical, political, environmental and cultural
factors. It is difficult to define, which marketing strategy is best for entering a foreign market,
because of those different factors that are unique for each country. Therefore, a good
understanding of those factors will open the road to success for an organization. It will also help to
overcome a main challenge within an international environment: to build a deep and close relation
with new consumers and to connect with them on the level that will create a loyalty towards not
only the organization, but also its products.
2.2.2 Country specifics: Russia
There is a famous expression written by Fedor Tiutchev in 1886 about Russia:
Russia cannot be understood with the mind,
Nor can she be measured with the ordinary yardstick.
There is in her a special stature:
You can only believe in Russia.
Those words give a very interesting source for thought. No doubts that Russia is a very mysterious
country, full of contradictions and contrasts. To successfully market products in the Russian
market, it is very important for organizations to understand these contrasts and its cultural,
historical and/or economical background. It will help to uncover real local needs and its reasons,
to understand their interconnection and chose a right approach in the marketing of products.
14
On the one hand, for instance, Russia has beautiful buildings, lots of museums, great literature and
exciting history. On the other hand, one will be astonished by lots of weird and ridiculous things
occurring in Russia. For instance, there is a big difference between wealth of big cities and
poverty of small towns. People of small towns can even experience problems with tap water and
electricity, while a big city like Moscow, is one of the most expensive cities in the world.
From the thirteen to fifteen centuries, the Tatar-Mongol invasion had dominated Russia. After
that, for centuries, Russia was ruled by a Tsar (Vul’fson, 2010). Under the Tsar’s regime, people
had to obey to his/her orders and were dependent on the Tsars’ generosity. The Russian Tsars had
fully autocratic rule over their nobles. This power was gained by granting the nobles autocratic
power over their serfs and was in a state closer to slavery that remained in Russia until 1861
(Cancelling of the selfdom, n.d., own translation from Russian text). Therefore, while Europe
enjoyed democracy for hundreds of years, Russia only lived without slavery for hundred and fifty
years and is still underdeveloped in many ways. After the revolution in 1917, communists took
over power. The Russian economy and political environment made huge transformations. But the
Russian nation was controlled and repressed by communists’ regime. People were scared. The
freedom of mind was out of the question and the political situation was far from democracy.
Today, the situation in the country is very different. Life has improved; people can freely speak
their mind and travel abroad. But unfortunately, many elements of the country’s systems are still
underdeveloped. For instance, supportive institutions and corporate governance are far from
working properly. The bureaucracy and government are the main part of this problem, because of
bribery practices and lack of rules and regulations (McCarthy & Puffer, 2008). Corruption slows
down developments that a country needs to undertake for further growth as well as for doing
business within the country. In addition, corruption creates inequality and complicity in doing any
15
business in Russia. Therefore, the cost of doing business there manifests itself in higher prices that
consumers have to pay for products (McCarthy & Puffer, 2008, p. 238).
This historical background has a huge influence on peoples’ behaviour, actions, attitude, their
mind, soul, style of living and has a big impact on the consumer purchase decision.
2.2.3 Country specifics: the Netherlands
The Netherlands is a democratic country and is a member of European Union. Since 1815, it has
had a constitutional monarchy and since 1848, it has had a parliamentary democracy (Netherlands,
n.d.). The Dutch political system and Dutch government are focused on solving the most
important issues and problems that the country experiences and tries to achieve general consensus
in making decisions to solve them. The country has a very good infrastructure and effective
institutional system. The Netherlands has a strong, market-based economy and placed as 22nd
among the largest economies in the world (The Netherlands, n.d.). It ranks as 15th of 179 countries
in the Index of Economic Freedom (Aridas, 2010) and one of the leading exporting countries
worldwide.
Today, the Netherlands, similar to many other countries, experiences economical downturn after
the financial crisis. At the end of 2008, the country reached a decline in exports that led to
decreased production rates and as a result to cutting additional costs such as (temporary) stuff. The
stagnating economy shows its consequences on consumers’ spending and economic pessimism
overtook general optimism that Dutch consumers still displayed at the beginning of 2008
(Consumer lifestyle in the Netherlands, 2009).
16
Furthermore, the most impactful factor in the Netherlands as in the other countries in Europe is
demographic trend. Innovations in medical services and good health care are the reasons for an
ageing population. People live longer, the birth rate declines and by 2015, 24% are forecasted to
be at the age of 60 or older. This will have a significant impact on social and economical
developments in the country and overall consumption patterns (Netherlands: Country Pulse,
2011).
2.3 Culture
In order to investigate the impact of cultural differences on consumers’ behavior and attitude, the
concept of culture has first to be examined. Analysis of culture definitions and different aspects of
culture will help to narrow this broad topic.
2.3.1 Defining culture
Culture takes a prominent role in forming a background of peoples’ behavior, their motivations
and attitude towards different situations around them. It has its broadest impact on human life
style on many levels. Therefore, identifying what is meant by the word “culture” is absolutely
essential before any other discussion can take place.
Although, there are many definitions of culture and lots of different opinions about its influence
on consumers, culture is an elusive concept that is difficult to standardize in one simple definition
(Peter & Olson, 2010; Soares, Farhangmehr & Shoham, 2006). Peter and Olson (2010, p. 278)
defined culture as the mental frames and meaning that people of one social group shared with each
other. De Mooij (2010, p. 48) identified culture as the glue that binds groups together and defines
17
a human community, its individuals, and social organizations. The most remarkable definition of
culture is made by Hofstede (2005, pp. 3-4) who defined it as software of mind and mental,
collective programming that divides the members of one group from others.
Cultural values and traditions go from generation to generation and are deep-rooted. It influences
attitude and behavior of individuals, and those have eventually an effect on their choices.
Obviously, culture plays a major role in forming people’s behavior, attitude, thoughts and
perceptions on many levels and therefore has a great impact on how consumers in a different
country react to marketing actions.
2.3.2 Measuring culture
Culture and cultural differences can be measured, compared and described in different ways (de
Mooij, 2010). The content of culture includes the beliefs, goals, values and shared meanings
among members of a society regarding the most significant elements of their social and physical
environment (Peter & Olson, 2010). Therefore, the main goal of cross-cultural analyses is to
uncover and to understand those shared meanings, beliefs, rules, norms and customs that most
people in a society follow and then to identify the differences (Peter & Olson, 2010).
The most well known research model of culture and cultural differences was developed by Geert
Hofstede in 1980. He first developed four dimensions of measuring a national culture. These
dimensions represent the basic problem areas that are common in all human societies and include
power distance, collectivism versus individualism, femininity versus masculinity, and uncertainty
avoidance (Hofstede & Hofstede, 2005, p. 23). The fifth dimension, long-term versus short-term
orientation, was added later, after additional research (Hofstede & Hofstede, 2005, p. 31).
18
Power distance is the extent to which the less powerful individuals of a society expect and accept
that power is distributed unequally (Hofstede & Hofstede, 2005, p. 46).
Individualism/collectivism identified individuals as self-oriented and accepted to look after
themselves and their immediate families only, versus individuals, which are group-oriented and
responsible for each other in tight social framework (Hofstede & Hofstede, 2005).
Masculinity/Femininity is the extent to which the common values in a society are more masculine
such as achievement and success, versus the common values in a society are more feminine such
as concerned with the quality of life and caring for others (Hofstede & Hofstede, 2005).
Uncertainty Avoidance is defined as the extent to which members of a society feel threatened by
uncomfortable and ambiguous situations and tries to avoid those (Hofstede & Hofstede, 2005).
Long-/Short-Term Orientation stays for the extent of virtues to which a society oriented towards
future rewards associated with perseverance and thrift instead of supporting virtues oriented on
past and present associated with respect for tradition, personal steadiness and fulfilling social
obligations (Hofstede & Hofstede, 2005; de Mooij, 2010). Although Hofstede’s work was
originally used in a work-related context and at the end of the nineteenth seventy, the relevance of
cultural dimensions is obvious as it is broadly used in business and many marketing studies today
(de Mooij, 2010; Soares, Kirkman, Lowe & Gibson, 2006; Farhangmehr & Shoham, 2006).
The communication of the developed marketing approach has a huge impact on how consumers
will understand offered products. Therefore, it is important to investigate how communication in
two researched countries in reality appeals to consumers. Hall (1976 in Mead & Andrews, 2009)
developed a model that distinguishes culture in high-context and low-context degree. It refers to
shared members’ experiences and interpretation of its context according to common cultural
values of the cultural group that link them to common understanding of given context. High-
19
context communication is implicit, economical, fast and efficient. In communication, high-
context nations use indirect style and lots of non-verbal gestures. Low-context cultures
communicate in explicit and verbal way. The way of communication is direct, with use of
arguments and rhetoric (de Mooij, 2010).
The aim of the current study is to examine a cross-cultural impact on consumers’ use, preferences
and purchase decisions regarding personal care products in Russia and in the Netherlands. Also
the relevance between identified factors and present marketing approaches in those countries. Fife
dimensions of Hofstede will provide an important framework for analyzing and comparing culture
of these two different nations. Hall’s model will help to understand how identified cultural
differences in a reality correlate with marketing approach used by a particular organization in each
country investigated.
2.4 Summary
The beauty and personal care product industry is dynamic and offers lots of potential for future
growth, especially in Russia. Those opportunities also mean a great competition as every
organization active in that market will try to take a share from that growth. However, to
successfully market products in a new market that differs tremendously from its own, an
organization needs to conduct additional research to investigate cultural differences between the
home and foreign country in order to choose the right marketing approach for its new target group.
Although the cultural understanding is very important for success in a new market, the hypothesis
is that most organizations choose to rely on superficial analyses and unfocused research, neither of
which provides an organization with profound and necessary information.
20
The two markets in the current study, Russia and the Netherlands, differ from each other in many
ways with regards to economical developments, social environment, culture, and politics. Also on
Hofstede’s dimensions, these countries are completely different as will be described in chapter 5.
The model of five dimensions of Hofstede and the model of high-and low-context of Hall will
help to analyze cultural preferences, beliefs, attitudes and a way of communication and to find
cultural differences between those two countries. These differences will further lead to
identification of the discrepancies in marketing approach and help to formulate an advice for
future strategy.
21
Chapter 3 Methodology
In this chapter the methodology and research design are explained. Specifically, the details of
research method and design are discussed, including data collection, data analysis and survey
method.
3.1 Research strategy
After living for many years in both Russia and the Netherlands, the author of the current study
became aware of certain unique characteristics/differences of each culture. Culture affects each
and every level of any nation and therefore, the existence of cultural differences between counties
is unavoidable. Although the evidence of those differences is unquestionable, it was noticed by the
author that a general marketing approach of many foreign companies was only slightly adapted to
the specifics of Russian consumers in comparison with the Netherlands. This discovery led to the
reasonable question aimed to understand if foreign organizations did seriously take into account
the unique characteristics of Russia in terms of its values, customs, jokes, symbols and other
important cultural elements (Firoz & Ramin, 2004). From information mentioned in the paragraph
2.4., these cultural elements have an obvious effect on consumer attitude, preferences and
behavior towards their decision to purchase one or another product or services offered on the
market.
The aim of this study is to clarify the impact of culture on the marketing approach applied by an
organization in two different countries, Russia and the Netherlands. It is important to determine
whether or not consumers’ attitude, preferences and behavior towards an organization’s products
differ enough across cultures to question the effectiveness of the current marketing approach. To
fulfill this aim, a deductive research strategy was chosen to support a quantitative research
22
method. The theoretical framework is based on Hofstede’s dimensions of culture. Although the
work of Hofstede was criticized for its outdated figures and only work-related measurement
values, many researches successfully tested his theory in different studies and applied his model to
consumption-related issues (de Mooij, 2010). The studies that did use Hofstede’s dimensions
showed that the proposed method was the most popular model for investigating and understanding
cultural differences (de Mooij & Hofstede, 2010).
3.2 Research method
Research method indicates a technique for collecting data. There are two general methods of
research based on different schools of thoughts: qualitative and quantitative methods (White,
2000). The main difference between them is that quantitative research uses numerical values for
collected data to evaluate the results. While qualitative research approach collects data in the form
of description and evaluates them by non-mathematical procedures (White, 2000).
A quantitative method was used to analyze the collected data. Given its numerical content and
descriptive nature it was the best choice for comparing the differences between variables.
Furthermore, an objective method will help to avoid the biases in generalizations of founded
cultural differences and to support a cultural analysis of this study in general. Also the inability to
travel and to stay in Russia for couple of weeks in order to conduct qualitative interviews and time
constraints played a role in the designing of the research for current study. In addition,
quantitative method allowed statistical analysis of the results in order to make a general overview.
3.3 Research design
23
In order to conduct a thorough research and to make a valid conclusion, both primary and
secondary data were collected as described below.
3.3.1 Secondary data: Dove
For collecting secondary data, multiple methods were used, including electronic databases,
internal documents and an internet search. In this study, the brand Dove of multinational
organization Unilever was used to identify the differences in use, preferences and demands
between Russian and Dutch consumers. Investigation of case in this research was needed in order
to get specific knowledge that could be generalized across the studied category (White, 2000). To
fulfill this purpose brand Dove was chosen as an exceptional example that has an outrageous and
long time success in the Netherlands and is an average popularity in Russia. In the next chapter,
the secondary data collection is described in more details.
3.3.2 Primary data: survey design
For conducting quantitative research, an online survey questionnaire was used. The survey design
was based on the methods that employ two different measurement techniques: a Consumer Styles
Inventory (CSI) and a Profile of Consumer Style (PCS) that both represent measuring elements of
consumer decision-making styles (Sproles & Kendall, 1986, p. 268). Consumer decision-making
style is a state of mental condition that consumers have in purchasing of products and making their
choices (Leo, Bennett & Hartel, 2005). Hence, if it is known how consumers make their choices
within particular category of products, it would be easier to adapt a marketing approach
accordingly to those specific needs. The CSI has been already used in cross-cultural study where
24
consumer decision-making styles were compared between Singaporeans and Australians (Leo,
Bennett & Hartel, 2005).
In the current study CSI model was modified to be able to measure a specific terrain devoted to
the personal care products category. It was important to narrow down the measurement values in
order to get a correct answer to research questions.
3.3.2.1 The Modified CSI Model
The CSI model formed a basis for designing the research questionnaires for this study. This model
was developed by Sproles and Kendall (1986) and based on the thought that consumers’ purchase
behavior has certain basic characteristics regarding their decision-making styles. These decision-
making styles define the general approach of consumers towards choices they made in buying
goods or services. Therefore, knowledge of specific elements with regards to decision-making
styles, which are unique for particular consumer group, allows an organization to develop a better
marketing approach.
In this study, the CSI model was not only modified, but also redefined in order to integrate
specific demographic variable such as gender, age, income and education and product-related
variables to examine specific factors towards investigated in this study case. The CSI model has
eight consumer characteristics. These characteristics are:
1) Perfectionistic, high-quality conscious consumer
25
This kind of consumer searches for the best quality products and expected to shop by comparison,
systematically and carefully (Sproles & Kendall, 1986). They prefer to look further than be
satisfied with “good enough”.
2) Brand conscious consumer
This item measures a consumers’ orientations toward the purchase the more expensive and well-
known brands. It is expected that high scored consumers shop preferably at special stores that sell
big brands names for high prices (Sproles & Kendall, 1986).
3) Innovation conscious consumer
This measurement refers to consumers that gain pleasure from seeking for variety in their
purchases. Be up-to-date with new things and styles excite them enormously (Sproles & Kendall,
1986).
4) Recreation and hedonistic shopping consciousness
This characteristic measures the extent to which consumers find it pleasant to shop and just do it
for fun (Sproles & Kendall, 1986).
5) Price conscious consumer
This score refers to consumers that look for products on sales or for lower price and conscious
about getting “value for their money” for the products they buy (Sproles & Kendall, 1986).
6) Impulsive, careless consumer
This item measures the consumers who do not plan their shopping activities and even careless
regarding amount of their spending and if their purchases were the best (Sproles & Kendall, 1986).
26
7) Confused by overchoice consumer
This consumer has difficulty with making a choice from great amount of brands and stores he/she
visits. Also information overload does not make it easy for them to make a choice quicker (Sproles
& Kendall, 1986).
8) Habitual, brand-loyal consumer
This characteristic refers to consumers that form their habits in choosing things and stick with
their favorite brands for long time (Sproles & Kendall, 1986).
The original CSI model was aimed to measure consumers’ decision-making style in general. This
study is concentrated among the personal care products and includes one brand name in particular:
Dove. Therefore the original CSI questionnaires were adjusted to this product category. Also extra
questions were added related to personal care products in general and Dove in particular.
Each of eight consumer characteristics had a range of items which respondents could answer
using the Likert - scale five-point system ranging from strongly disagree (1) to strongly agree (5)
level. The higher score refers to the higher score of the respondent on that factor. It is expected to
measure the differences in use preferences, information needs, shopping frequencies and other
aspects important for this study.
3.3.3 Other measurements
The survey was also designed to collect additional information that could provide with more
details regarding the investigated brand Dove. In the first set of questions, the demographic
parameters were asked regarding the respondents’ age, gender, and country of residence, annual
27
income and educational level. It is interesting to research how all these parameters correlate with
the rest of the questions.
The last set of questions was meant to examine factors related to brand Dove. The parameters such
as familiarity with the Dove products, its use and Dove advertising campaign were been measured
to understand how this brand appeals in different countries. To get a more detail information
regarding brand Dove, brand affect, brand identification, brand loyalty and brand trust were been
measured using the questions developed by Um (2008).
3.3.4 Survey distribution
An online survey was designed for this study, because of practical reason mentioned before. To
design a survey, a website of surveymonkey.com was used, where two links were created, for
Russian and Dutch respondents. The survey was open to responses for two weeks in order to get
as much as possible reactions. The respondents had been approach through different channels
included forums, Facebook, LinkedIn and other available online channels to get so much attention
for this study as possible.
The population was chosen accordingly the main target audience of brand Dove. Dove aimed to
reach: all women, all ages and all sizes (Brodbeck & Evans, 2008). But also men were included in
this survey for few reasons. In the last years, there have been given lot of attention to production
of products in personal care category for men and the examination of the use of these products in
investigated countries will show how the organizational incentives meet the consumers’ needs.
Furthermore, this subject is an interesting addition to this study.
28
3.4 Data analysis
The analyses of data were conducted using three different approaches:
• (1) CSI model described above,
• (2) The cultural dimensions of Hofstede and
• (3) The method of Hall.
These three methods all together form a valuable addition to each other and were used in
examining quantitative data.
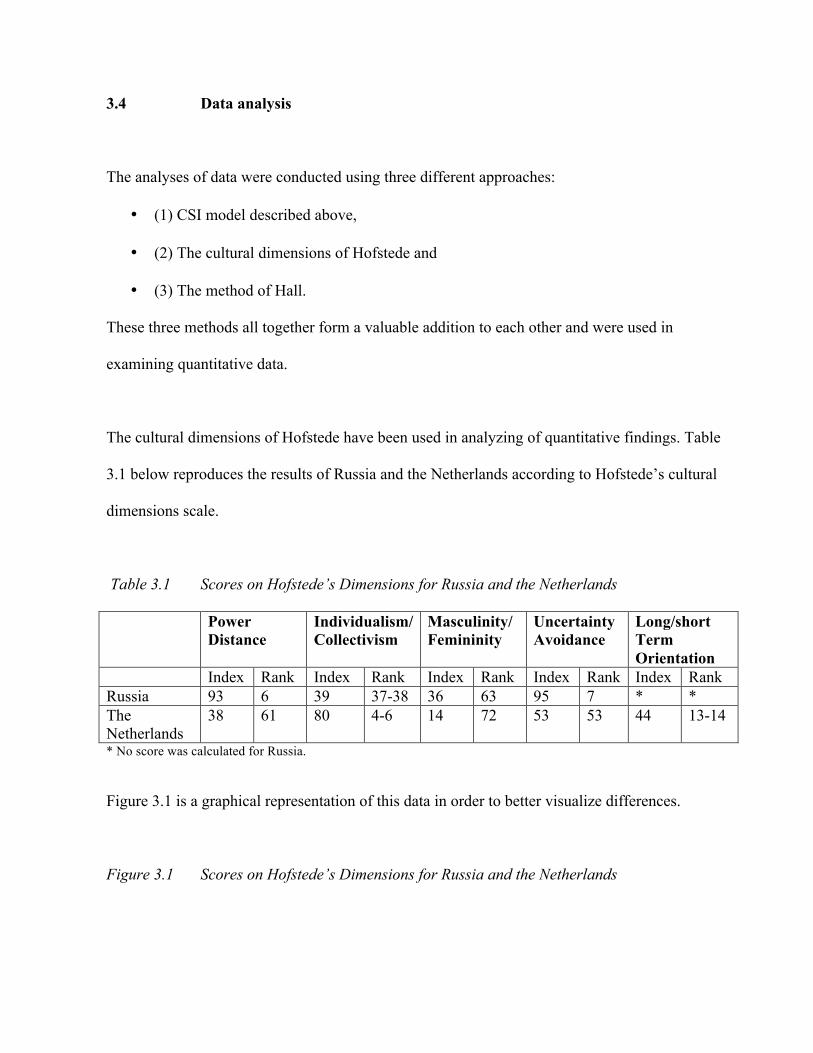
The cultural dimensions of Hofstede have been used in analyzing of quantitative findings. Table
3.1 below reproduces the results of Russia and the Netherlands according to Hofstede’s cultural
dimensions scale.
Table 3.1 Scores on Hofstede’s Dimensions for Russia and the Netherlands
Power Distance
Individualism/ Collectivism
Masculinity/ Femininity
Uncertainty Avoidance
Long/short Term Orientation
Index Rank Index Rank Index Rank Index Rank Index Rank Russia 93 6 39 37-38 36 63 95 7 * * The Netherlands
38 61 80 4-6 14 72 53 53 44 13-14
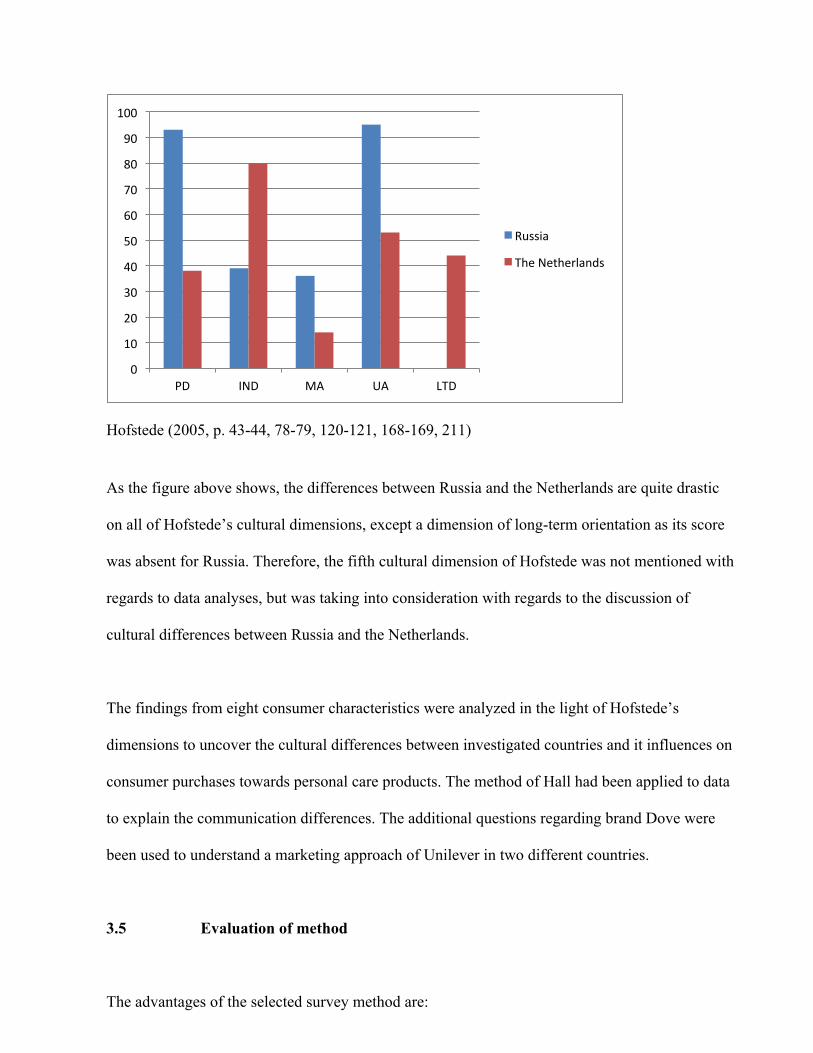
* No score was calculated for Russia. Figure 3.1 is a graphical representation of this data in order to better visualize differences.
Figure 3.1 Scores on Hofstede’s Dimensions for Russia and the Netherlands
29
Hofstede (2005, p. 43-44, 78-79, 120-121, 168-169, 211)
As the figure above shows, the differences between Russia and the Netherlands are quite drastic
on all of Hofstede’s cultural dimensions, except a dimension of long-term orientation as its score
was absent for Russia. Therefore, the fifth cultural dimension of Hofstede was not mentioned with
regards to data analyses, but was taking into consideration with regards to the discussion of
cultural differences between Russia and the Netherlands.
The findings from eight consumer characteristics were analyzed in the light of Hofstede’s
dimensions to uncover the cultural differences between investigated countries and it influences on
consumer purchases towards personal care products. The method of Hall had been applied to data
to explain the communication differences. The additional questions regarding brand Dove were
been used to understand a marketing approach of Unilever in two different countries.
3.5 Evaluation of method
The advantages of the selected survey method are:
0!
10!
20!
30!
40!
50!
60!
70!
80!
90!
100!
PD! IND! MA! UA! LTD!
Russia!
The!Netherlands!
30
• the relatively short period of time for data collection,
• the fact that the questionnaire is simple to administer and
• that consistent data is collected as the respondents are limited in their answers, since the
answers are already filled (Malhotra & Birks, 2006).
According to Malhotra and Birks (2006, p. 266), the questions with the fixed alternatives in the
answers reduce the variability in the results.
The main disadvantage of the survey is non-response. The consumers are overwhelmed with the
different kind of surveys, questionnaires and other forms of research. It could create unwillingness
to provide the accurate information (Malhotra & Birks, 2006, p. 266) or do not answer all
questions from questionnaire.
To cover these possible disadvantages, first of all Pilot-testing was conducted to identify potential
inefficiencies in questionnaire. Secondly various actions were used to promote the questionnaire
among different kind of audience and through different channels in order to get desired responses.
Despite the limitations described above, the survey is the most used method for collection of data
in marketing research, because of its cost effectiveness and quick response rate.
31
Chapter 4 Presentation and Analysis
After the survey distribution to both Russian and Dutch consumers, the data has been analyzed by
using different kind of methods aimed to examine the various levels of consumers’ use and
preferences towards personal care products in two investigated countries. The collection of
secondary data is examined first, followed by presentation and analysis of survey results from
primary data.
4.1 Secondary data collection: case Dove
Dove is a brand that is in its sixteenth year of existence. The brand encompasses a range of all
sorts of hair and skin products. Traditionally, the target market of Dove was always female, but in
the last few years, Dove also started targeting men by introducing a new range of products for men
in the market. In 2004, Dove’s sales declined dramatically as a result of tough competition and
oversaturation in the market (Brodbeck & Evans, 2007). To solve this issue, Unilever and its PR
agency, Edelman, united together to find a unique solution that could change the course of brand
and boost sales.
After profound research aimed to indentify the real needs of the target group, they discovered that
women had a need in some moral boost to feel beautiful regardless of their age and size (Brodbeck
& Evans, 2007). A new campaign was born and its focus was not on the product itself, but on
“Real Beauty” that every woman should feel regardless how she looks or which size she has. New
advertising campaign was supported by PR, promotional techniques, TV-commercial and new
website that allows the visitors to get lots of different information about beauty and health topics.
This campaign was very successful and in 2005 was introduced in United States and Canada. The
campaign got there lot of attention and was a subject of many discussions both in newspapers and
32
in television programs. The main goal of the campaign was to inspire women to feel more
beautiful by challenging today’s stereotypical view of beauty (Dove's Campaign for Real Beauty,
n.d.). Dove was also aimed to change the stereotype of the beauty market by using models in
different sizes.
The results of the campaign in the first two month were already overwhelmed, the sales of the
products increased by 600 percent. Furthermore, by June of 2005 more than 1 million people
visited www.campaignforrealbeauty.com where they shared their thoughts about this subject and
the campaign in general (Brodbeck & Evans, 2007). The campaign “Dove for real beauty” was
also successful in the other parts of Europe, including the Netherlands. Besides the prestigious
award “EFFE” for best advertising campaign of the year, Dove won in the Netherlands a public
award for “women friendly advertising that shows women’s image from different angel”
(Ketelaar, 2006, own translation from the Dutch article).
In Russia, this campaign had unexpectedly different outcome. The ‘campaign for real beauty’ did
have lots of potential for equal success in Russia, but the adaptation strategy that organization had
chosen, did not appeal to taste of Russian woman at all. According to Natalya Stepanjuk (Kuprina,
2009, own translation from the Russian text), general director of IQ marketing agency (the only
agency in Russia twice prized with the Cannes Lions), Unilever killed all idea of “Campaign for
real beauty” for Russian audience by assuming that Russian woman would not understand its
concept. The organization adapted a marketing approach by making it too indirect and too soft
(Stepanjuk, 2009 in Kuprina, 2009, own translation from the Russian text).
For example, in the West, the consumers see a nice woman with a few more pounds and a
question: “Is she oversized or may be outstanding?” The reaction is usually ‘outstanding’. In
Russian advertisement, on the other hand, Unilever approached a consumer with different
question: “Is it really true that a beautiful figure should be only in proportion of 90-60-90?” A
33
reaction to this question by all Russian women is opposite to what company had expected. It is
“Of course yes, 90-60-90 is the figure I dream of” instead of “No, my figure is good as it is”,
because women in Russia desire to look the best and 90-60-90 is the size they look at to be
inspired by it (Dostupnaja, 2008, own translation from the Russian text).
In the other article, Kudashkin, from the advertising agency Leo Burnett Moscow (Interview: We
haven’t reached yet a high position in an advertisement world, 2008, own translation from the
Russian text), assured that mentality of Russian women is quite different from mentality of
Western women. Russian women still refuse to accept their own mirror image and prefer to
imagine themselves as the models from magazines such as Vogue or Cosmopolitan.
Factors described above are some of the few reasons why ‘campaign for real beauty’ did not get in
Russia the popularity such as had been reached in the other countries.
4.2 Primary data collection and sample characteristics
A randomly ordered and self-administered online questionnaire survey was adopted for this study.
The survey was conducted in both Dutch and Russian for consumers of Dutch origin that live in
Holland and Russian consumer that reside in Russia, respectively. Actual consumers of the
product were used in order to ensure a “real life” picture of a comparison of the cultural
differences between consumers in Holland and Russia. It was also important to investigate the
influence of culture on consumers’ use and preferences towards products in the personal care
category. In addition, the use of people that have a full time job instead of students increases the
validity of the findings, because the results represent a reflection of real life factors (Ulijn, 2000 in
Leo, Bennett & Hartel, 2005).
34
A pilot test was conducted before the actual survey was carried out in order to identify and
eliminate potential problems in questionnaire design (Malholtra & Birks, 2007, p. 391). A total of
10 participants from each country answered and reviewed the pre-test questionnaire. The
modification of the questionnaire items was made after getting feedback. It was based on
participants’ advice with regards to various levels of deficiencies in the wording and clarification
of the overall meaning of each sentence. These changes mostly occurred in the Russian version of
the survey. Also several statements in few CSI (Consumer Style Index) dimensions seemed to
have similar meaning and therefore, it had been eliminated to avoid frustration and to increase the
number of subjects that completed the entire survey.
As mentioned earlier, links to the survey were sent to different groups of people through popular
social networks sites such as LinkedIn, Facebook and Twitter. Furthermore, survey links were
posted on various female forums both in the Netherlands and Russia.
Out of the web-based survey questionnaire conducted in Russia, hundred and eighty eight (188)
respondents had started to answer the questionnaire, but only hundred and twelve (112)
respondents completed it. The Russian respondents were mostly female, while male were
represented by only 5.4 %. The age of respondents varied and ranged from young adults (defined
as 18-29, and comprising 50% of all respondents), followed by respondents between thirty and
thirty nine (25 %), respondents between forty and forty-nine (17 %) and respondents above the
age of fifty (8%).
Out of the survey questionnaire conducted in the Netherlands, two hundred and forty four
respondents (244) started to answer the questionnaire and hundred and eleven (111) completed it.
The Dutch respondents were also predominantly female (79. 5 %), although Dutch men who
35
answered the questions were represented by a greater percentage than their Russian counterparts,
namely by 19. 6%. The age of respondents divided almost equally along all categories with 28.6%,
for respondents between eighteen and twenty-nine, 25. 0%, for respondents between thirty and
thirty nine, 20. 5, % for respondents between forty and forty-nine and 25 % for respondents above
fifty.
In terms of monthly income, there are 43. 8 % of the Russian participants had a monthly income
less than 21.000 Rubles (€520,-, based on the exchange rate at 15th of July in 2011), while 32.1%
of Dutch participants had a minimum monthly income less than €2.100,-.
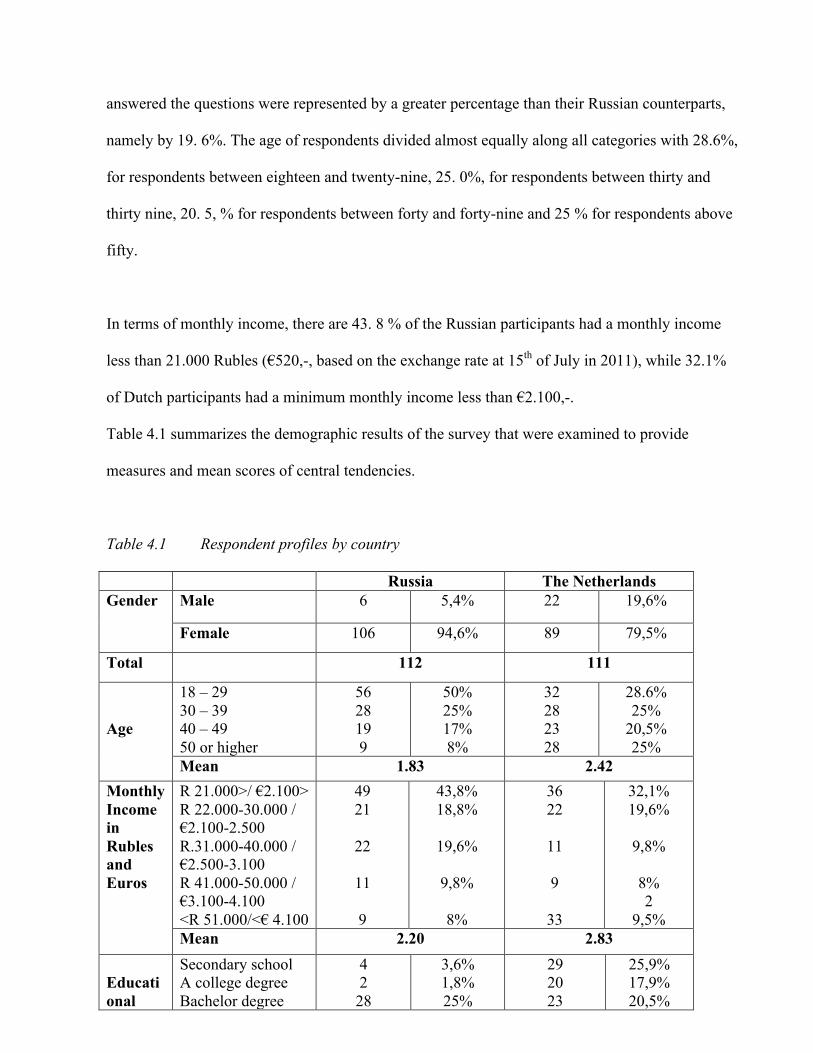
Table 4.1 summarizes the demographic results of the survey that were examined to provide
measures and mean scores of central tendencies.
Table 4.1 Respondent profiles by country
Russia The Netherlands Gender Male 6 5,4% 22 19,6%
Female 106 94,6% 89 79,5%
Total 112 111
Age
18 – 29 30 – 39 40 – 49 50 or higher
56 28 19 9
50% 25% 17% 8%
32 28 23 28
28.6% 25%
20,5% 25%
Mean 1.83 2.42 Monthly Income in Rubles and Euros
R 21.000>/ €2.100> R 22.000-30.000 / €2.100-2.500 R.31.000-40.000 / €2.500-3.100 R 41.000-50.000 / €3.100-4.100 <R 51.000/<€ 4.100
49 21
22
11 9
43,8% 18,8%
19,6%
9,8%
8%
36 22
11 9
33
32,1% 19,6%
9,8%
8% 2
9,5% Mean 2.20 2.83
Educational
Secondary school A college degree Bachelor degree
4 2 28
3,6% 1,8% 25%
29 20 23
25,9% 17,9% 20,5%
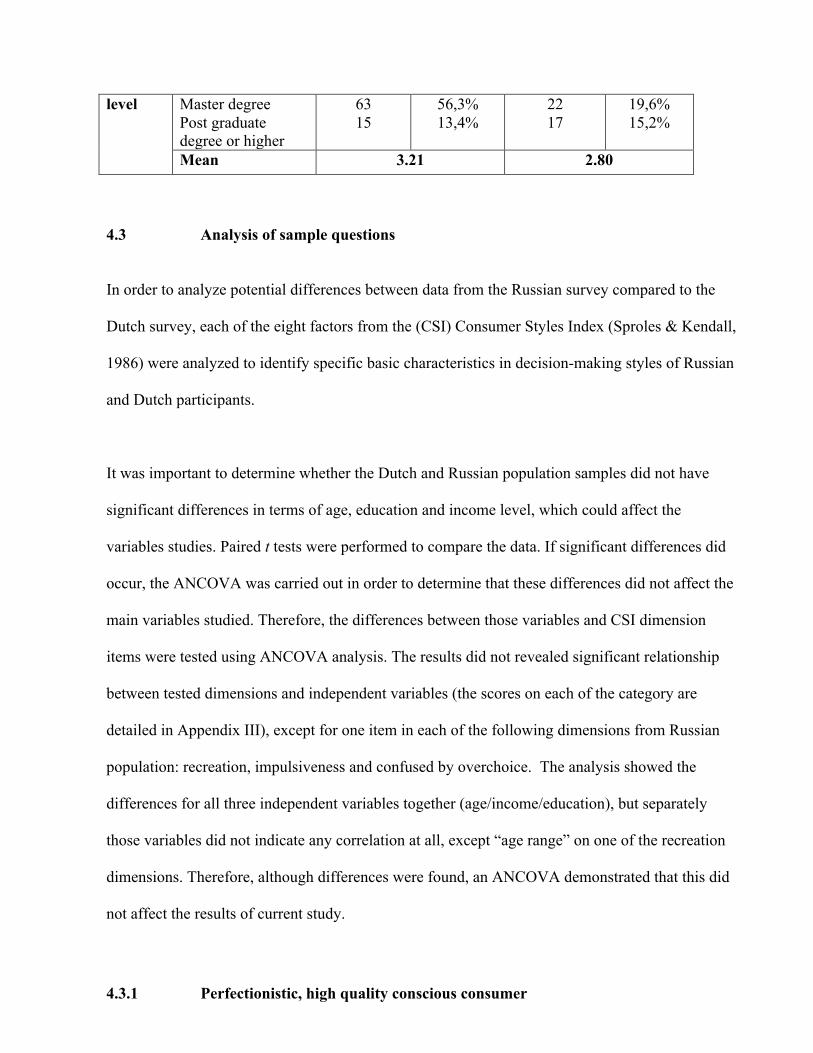
36
level Master degree Post graduate degree or higher
63 15
56,3% 13,4%
22 17
19,6% 15,2%
Mean 3.21 2.80
4.3 Analysis of sample questions
In order to analyze potential differences between data from the Russian survey compared to the
Dutch survey, each of the eight factors from the (CSI) Consumer Styles Index (Sproles & Kendall,
1986) were analyzed to identify specific basic characteristics in decision-making styles of Russian
and Dutch participants.
It was important to determine whether the Dutch and Russian population samples did not have
significant differences in terms of age, education and income level, which could affect the
variables studies. Paired t tests were performed to compare the data. If significant differences did
occur, the ANCOVA was carried out in order to determine that these differences did not affect the
main variables studied. Therefore, the differences between those variables and CSI dimension
items were tested using ANCOVA analysis. The results did not revealed significant relationship
between tested dimensions and independent variables (the scores on each of the category are
detailed in Appendix III), except for one item in each of the following dimensions from Russian
population: recreation, impulsiveness and confused by overchoice. The analysis showed the
differences for all three independent variables together (age/income/education), but separately
those variables did not indicate any correlation at all, except “age range” on one of the recreation
dimensions. Therefore, although differences were found, an ANCOVA demonstrated that this did
not affect the results of current study.
4.3.1 Perfectionistic, high quality conscious consumer
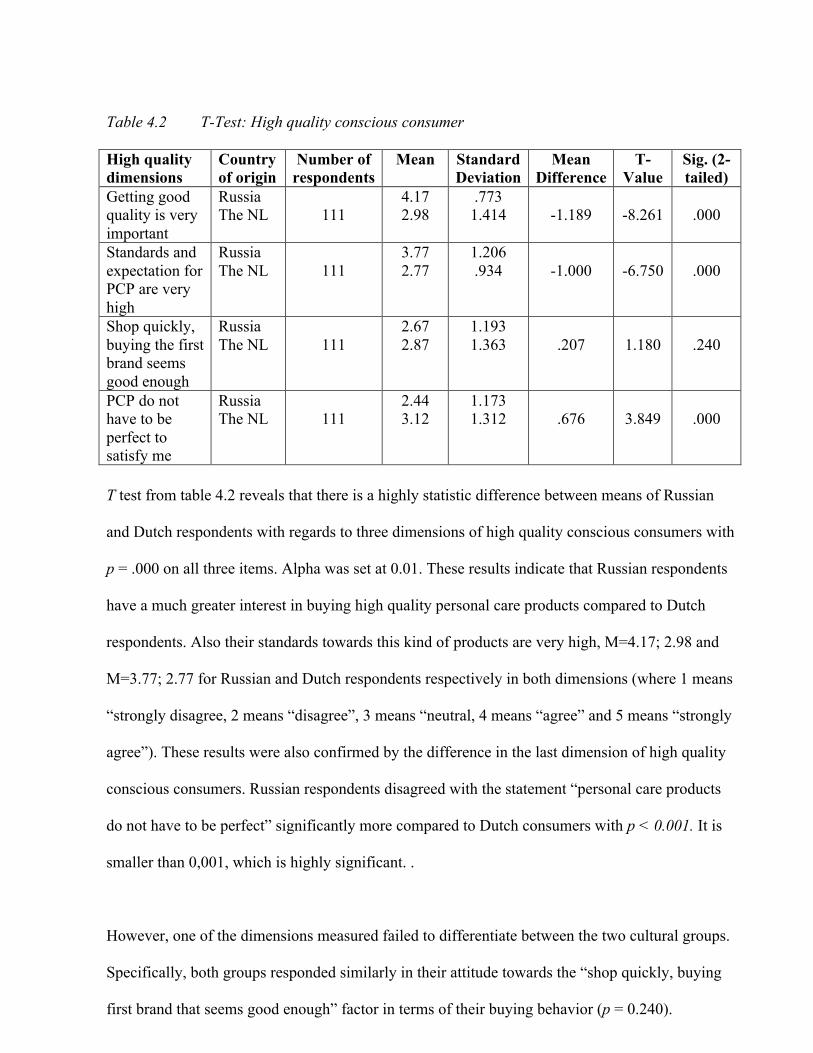
37
Table 4.2 T-Test: High quality conscious consumer High quality dimensions
Country of origin
Number of respondents
Mean Standard Deviation
Mean Difference
T-Value
Sig. (2-tailed)
Getting good quality is very important
Russia The NL
111
4.17 2.98
.773 1.414
-1.189
-8.261
.000
Standards and expectation for PCP are very high
Russia The NL
111
3.77 2.77
1.206 .934
-1.000
-6.750
.000
Shop quickly, buying the first brand seems good enough
Russia The NL
111
2.67 2.87
1.193 1.363
.207
1.180
.240
PCP do not have to be perfect to satisfy me
Russia The NL
111
2.44 3.12
1.173 1.312
.676
3.849
.000
T test from table 4.2 reveals that there is a highly statistic difference between means of Russian
and Dutch respondents with regards to three dimensions of high quality conscious consumers with
p = .000 on all three items. Alpha was set at 0.01. These results indicate that Russian respondents
have a much greater interest in buying high quality personal care products compared to Dutch
respondents. Also their standards towards this kind of products are very high, M=4.17; 2.98 and
M=3.77; 2.77 for Russian and Dutch respondents respectively in both dimensions (where 1 means
“strongly disagree, 2 means “disagree”, 3 means “neutral, 4 means “agree” and 5 means “strongly
agree”). These results were also confirmed by the difference in the last dimension of high quality
conscious consumers. Russian respondents disagreed with the statement “personal care products
do not have to be perfect” significantly more compared to Dutch consumers with p < 0.001. It is
smaller than 0,001, which is highly significant. .
However, one of the dimensions measured failed to differentiate between the two cultural groups.
Specifically, both groups responded similarly in their attitude towards the “shop quickly, buying
first brand that seems good enough” factor in terms of their buying behavior (p = 0.240).
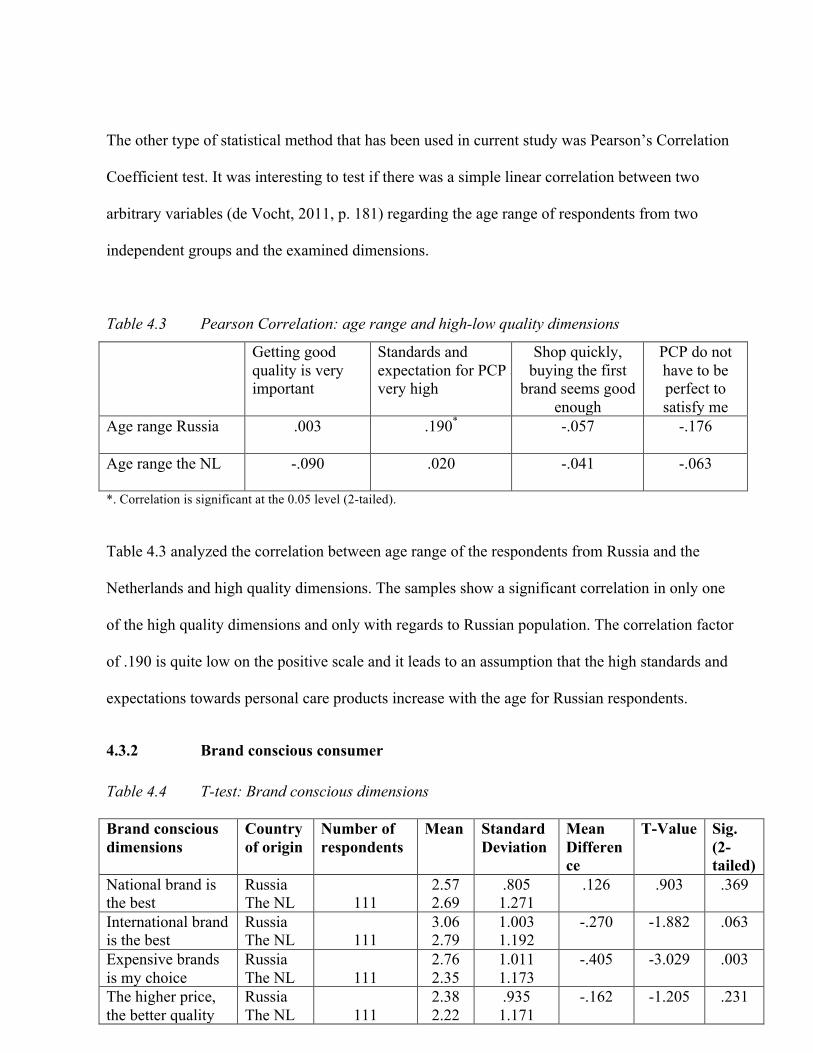
38
The other type of statistical method that has been used in current study was Pearson’s Correlation
Coefficient test. It was interesting to test if there was a simple linear correlation between two
arbitrary variables (de Vocht, 2011, p. 181) regarding the age range of respondents from two
independent groups and the examined dimensions.
Table 4.3 Pearson Correlation: age range and high-low quality dimensions
Getting good quality is very important
Standards and expectation for PCP are very high
Shop quickly, buying the first
brand seems good enough
PCP do not have to be perfect to satisfy me
Age range Russia
.003 .190* -.057 -.176
Age range the NL
-.090 .020 -.041 -.063
*. Correlation is significant at the 0.05 level (2-tailed).
Table 4.3 analyzed the correlation between age range of the respondents from Russia and the
Netherlands and high quality dimensions. The samples show a significant correlation in only one
of the high quality dimensions and only with regards to Russian population. The correlation factor
of .190 is quite low on the positive scale and it leads to an assumption that the high standards and
expectations towards personal care products increase with the age for Russian respondents.
4.3.2 Brand conscious consumer Table 4.4 T-test: Brand conscious dimensions Brand conscious dimensions
Country of origin
Number of respondents
Mean Standard Deviation
Mean Difference
T-Value Sig. (2-tailed)
National brand is the best
Russia The NL
111
2.57 2.69
.805 1.271
.126 .903 .369
International brand is the best
Russia The NL
111
3.06 2.79
1.003 1.192
-.270 -1.882 .063
Expensive brands is my choice
Russia The NL
111
2.76 2.35
1.011 1.173
-.405 -3.029 .003
The higher price, the better quality
Russia The NL
111
2.38 2.22
.935 1.171
-.162 -1.205 .231
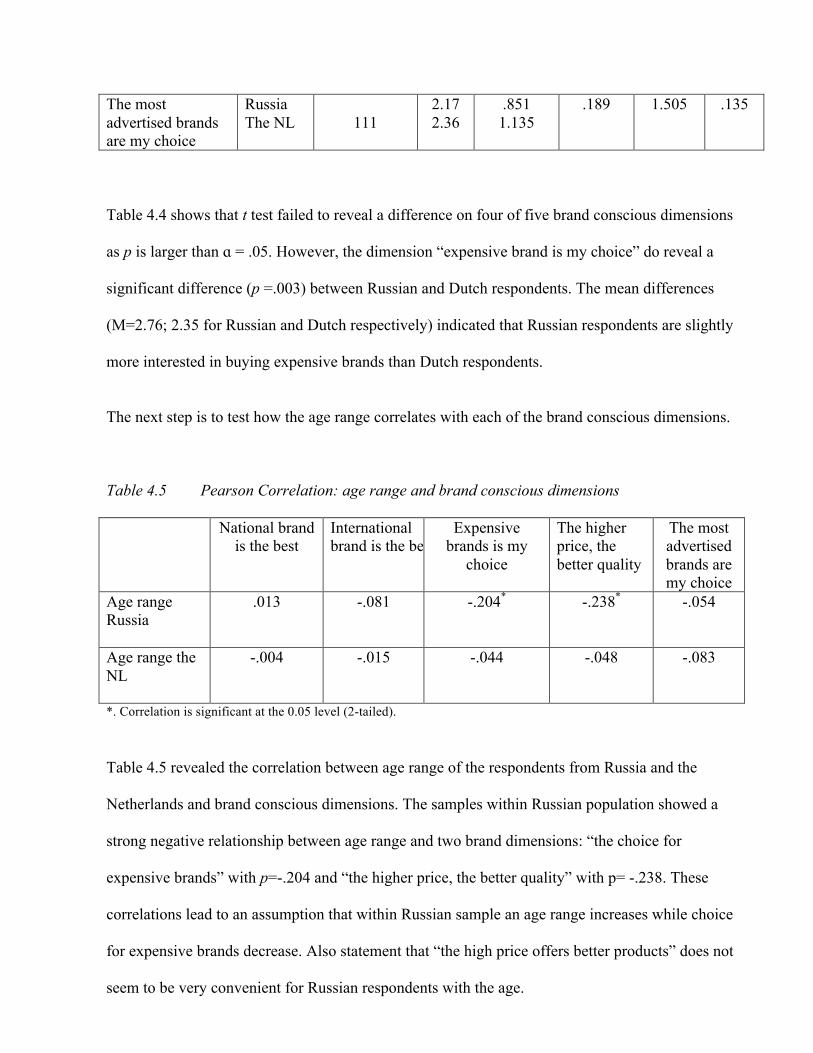
39
The most advertised brands are my choice
Russia The NL
111
2.17 2.36
.851 1.135
.189 1.505 .135
Table 4.4 shows that t test failed to reveal a difference on four of five brand conscious dimensions
as p is larger than ɑ = .05. However, the dimension “expensive brand is my choice” do reveal a
significant difference (p =.003) between Russian and Dutch respondents. The mean differences
(M=2.76; 2.35 for Russian and Dutch respectively) indicated that Russian respondents are slightly
more interested in buying expensive brands than Dutch respondents.
The next step is to test how the age range correlates with each of the brand conscious dimensions.
Table 4.5 Pearson Correlation: age range and brand conscious dimensions
National brand is the best
International brand is the best
Expensive brands is my
choice
The higher price, the better quality
The most advertised brands are my choice
Age range Russia
.013 -.081 -.204* -.238* -.054
Age range the NL
-.004 -.015 -.044 -.048 -.083
*. Correlation is significant at the 0.05 level (2-tailed).
Table 4.5 revealed the correlation between age range of the respondents from Russia and the
Netherlands and brand conscious dimensions. The samples within Russian population showed a
strong negative relationship between age range and two brand dimensions: “the choice for
expensive brands” with p=-.204 and “the higher price, the better quality” with p= -.238. These
correlations lead to an assumption that within Russian sample an age range increases while choice
for expensive brands decrease. Also statement that “the high price offers better products” does not
seem to be very convenient for Russian respondents with the age.
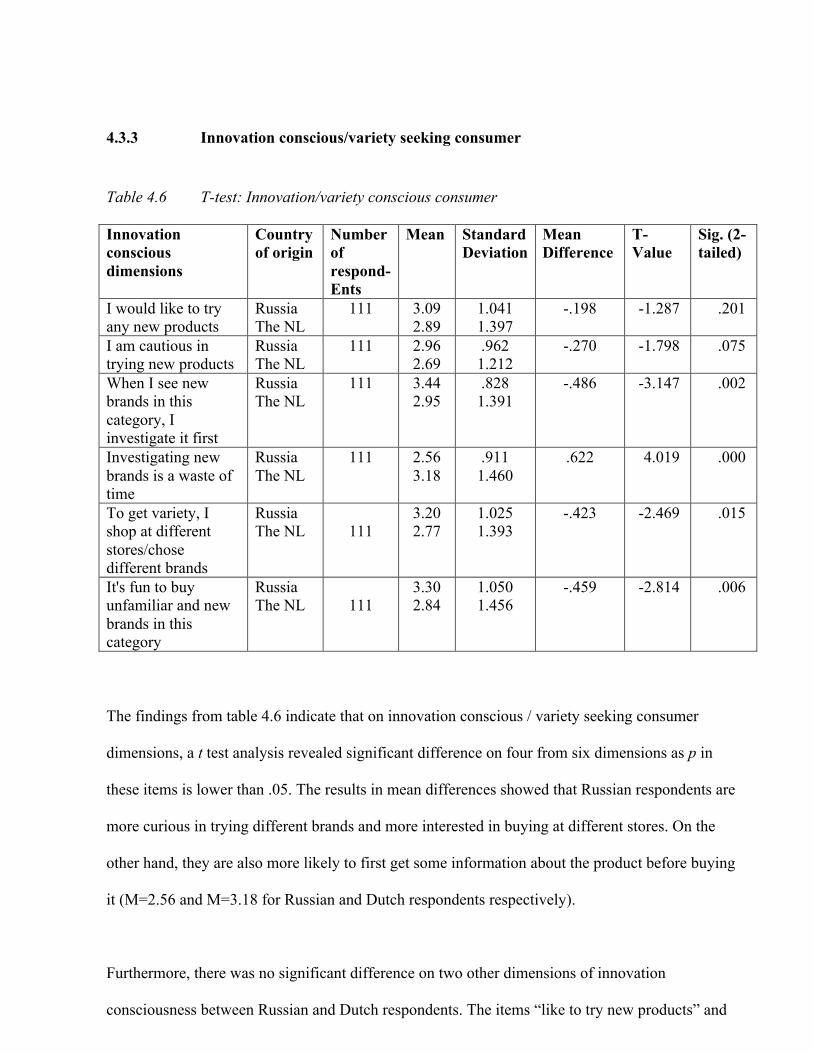
40
4.3.3 Innovation conscious/variety seeking consumer Table 4.6 T-test: Innovation/variety conscious consumer Innovation conscious dimensions
Country of origin
Number of respond- Ents
Mean Standard Deviation
Mean Difference
T-Value
Sig. (2-tailed)
I would like to try any new products
Russia The NL
111 3.09 2.89
1.041 1.397
-.198 -1.287 .201
I am cautious in trying new products
Russia The NL
111 2.96 2.69
.962 1.212
-.270 -1.798 .075
When I see new brands in this category, I investigate it first
Russia The NL
111 3.44 2.95
.828 1.391
-.486 -3.147 .002
Investigating new brands is a waste of time
Russia The NL
111 2.56 3.18
.911 1.460
.622 4.019 .000
To get variety, I shop at different stores/chose different brands
Russia The NL
111
3.20 2.77
1.025 1.393
-.423 -2.469 .015
It's fun to buy unfamiliar and new brands in this category
Russia The NL
111
3.30 2.84
1.050 1.456
-.459 -2.814 .006
The findings from table 4.6 indicate that on innovation conscious / variety seeking consumer
dimensions, a t test analysis revealed significant difference on four from six dimensions as p in
these items is lower than .05. The results in mean differences showed that Russian respondents are
more curious in trying different brands and more interested in buying at different stores. On the
other hand, they are also more likely to first get some information about the product before buying
it (M=2.56 and M=3.18 for Russian and Dutch respondents respectively).
Furthermore, there was no significant difference on two other dimensions of innovation
consciousness between Russian and Dutch respondents. The items “like to try new products” and
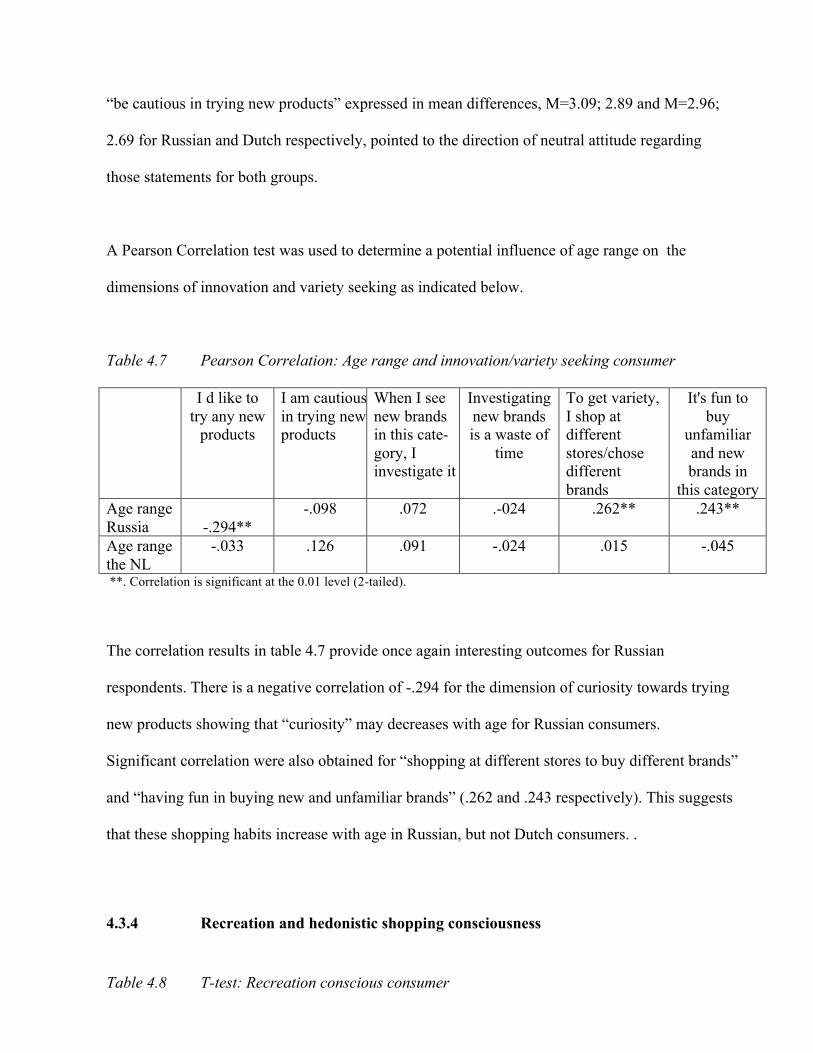
41
“be cautious in trying new products” expressed in mean differences, M=3.09; 2.89 and M=2.96;
2.69 for Russian and Dutch respectively, pointed to the direction of neutral attitude regarding
those statements for both groups.
A Pearson Correlation test was used to determine a potential influence of age range on the
dimensions of innovation and variety seeking as indicated below.
Table 4.7 Pearson Correlation: Age range and innovation/variety seeking consumer
I d like to try any new
products
I am cautious in trying new products
When I see new brands in this cate- gory, I investigate it first
Investigating new brands is a waste of
time
To get variety, I shop at different stores/chose different brands
It's fun to buy
unfamiliar and new brands in
this category Age range Russia
-.294**
-.098 .072 .-024 .262** .243**
Age range the NL
-.033 .126 .091 -.024 .015 -.045
**. Correlation is significant at the 0.01 level (2-tailed).
The correlation results in table 4.7 provide once again interesting outcomes for Russian
respondents. There is a negative correlation of -.294 for the dimension of curiosity towards trying
new products showing that “curiosity” may decreases with age for Russian consumers.
Significant correlation were also obtained for “shopping at different stores to buy different brands”
and “having fun in buying new and unfamiliar brands” (.262 and .243 respectively). This suggests
that these shopping habits increase with age in Russian, but not Dutch consumers. .
4.3.4 Recreation and hedonistic shopping consciousness Table 4.8 T-test: Recreation conscious consumer
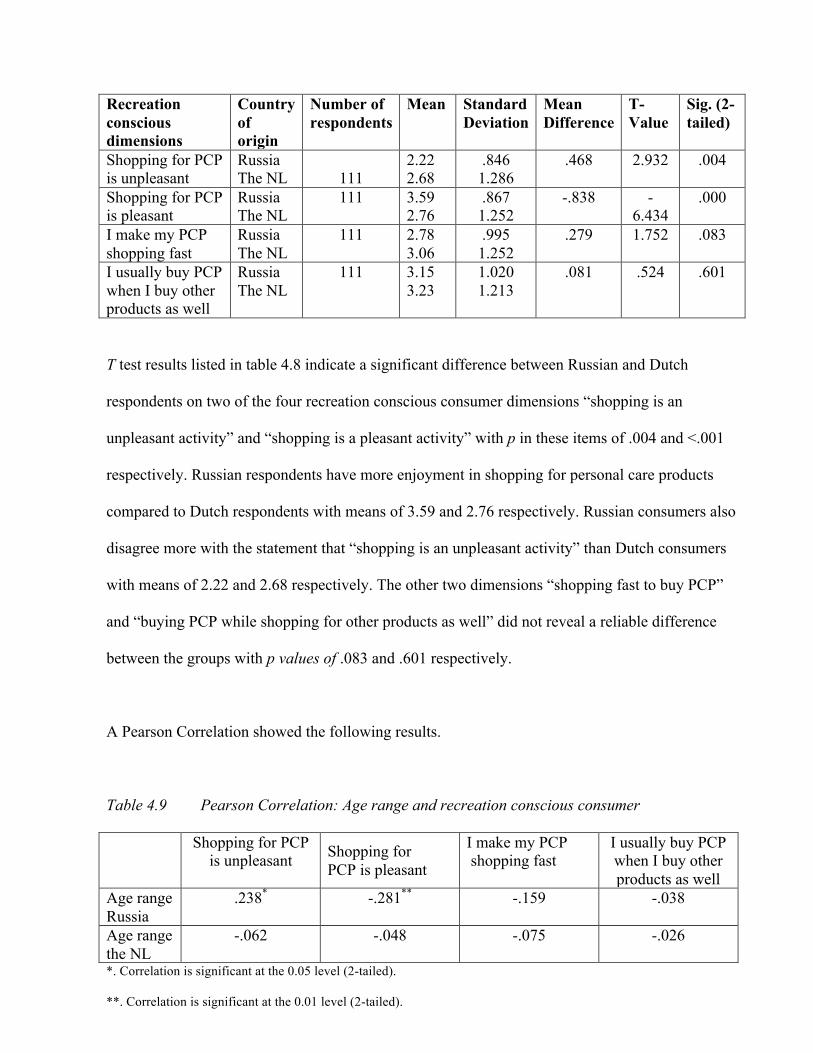
42
Recreation conscious dimensions
Country of origin
Number of respondents
Mean Standard Deviation
Mean Difference
T-Value
Sig. (2-tailed)
Shopping for PCP is unpleasant
Russia The NL
111
2.22 2.68
.846 1.286
.468 2.932 .004
Shopping for PCP is pleasant
Russia The NL
111 3.59 2.76
.867 1.252
-.838 -6.434
.000
I make my PCP shopping fast
Russia The NL
111 2.78 3.06
.995 1.252
.279 1.752 .083
I usually buy PCP when I buy other products as well
Russia The NL
111 3.15 3.23
1.020 1.213
.081 .524 .601
T test results listed in table 4.8 indicate a significant difference between Russian and Dutch
respondents on two of the four recreation conscious consumer dimensions “shopping is an
unpleasant activity” and “shopping is a pleasant activity” with p in these items of .004 and <.001
respectively. Russian respondents have more enjoyment in shopping for personal care products
compared to Dutch respondents with means of 3.59 and 2.76 respectively. Russian consumers also
disagree more with the statement that “shopping is an unpleasant activity” than Dutch consumers
with means of 2.22 and 2.68 respectively. The other two dimensions “shopping fast to buy PCP”
and “buying PCP while shopping for other products as well” did not reveal a reliable difference
between the groups with p values of .083 and .601 respectively.
A Pearson Correlation showed the following results.
Table 4.9 Pearson Correlation: Age range and recreation conscious consumer
Shopping for PCP is unpleasant Shopping for
PCP is pleasant
I make my PCP shopping fast
I usually buy PCP when I buy other products as well
Age range Russia
.238* -.281** -.159 -.038
Age range the NL
-.062 -.048 -.075 -.026
*. Correlation is significant at the 0.05 level (2-tailed).
**. Correlation is significant at the 0.01 level (2-tailed).
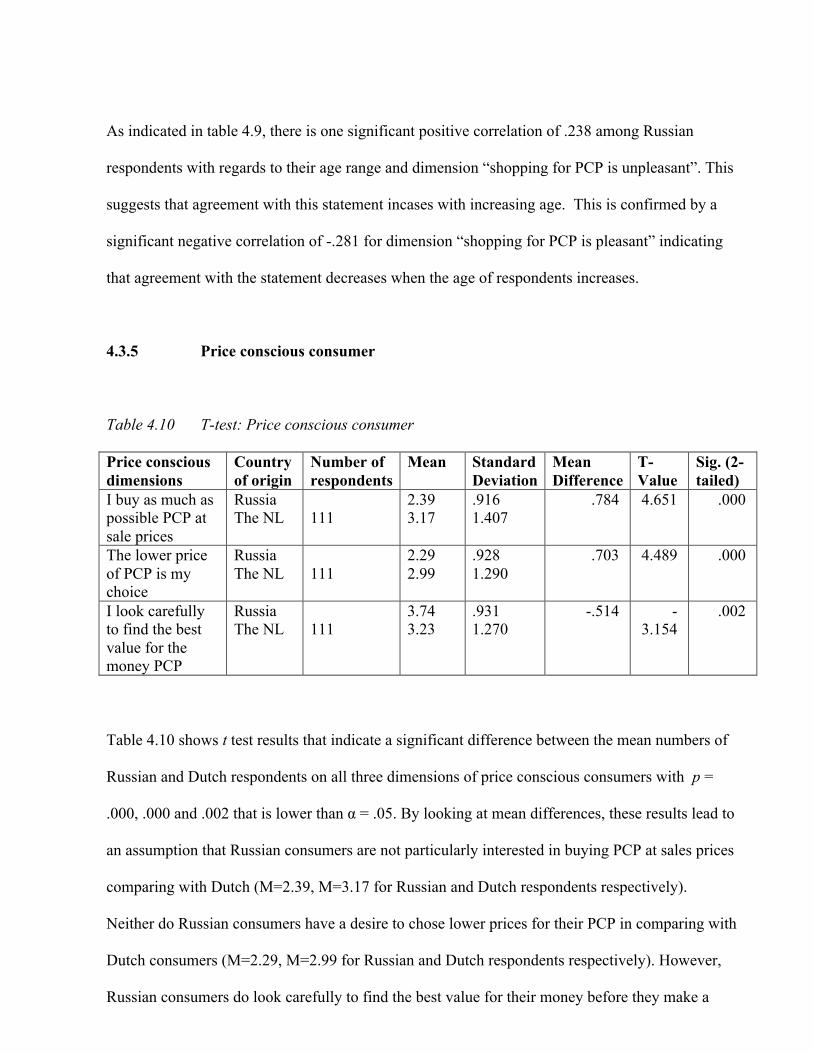
43
As indicated in table 4.9, there is one significant positive correlation of .238 among Russian
respondents with regards to their age range and dimension “shopping for PCP is unpleasant”. This
suggests that agreement with this statement incases with increasing age. This is confirmed by a
significant negative correlation of -.281 for dimension “shopping for PCP is pleasant” indicating
that agreement with the statement decreases when the age of respondents increases.
4.3.5 Price conscious consumer
Table 4.10 T-test: Price conscious consumer
Price conscious dimensions
Country of origin
Number of respondents
Mean Standard Deviation
Mean Difference
T-Value
Sig. (2-tailed)
I buy as much as possible PCP at sale prices
Russia The NL
111
2.39 3.17
.916 1.407
.784 4.651 .000
The lower price of PCP is my choice
Russia The NL
111
2.29 2.99
.928 1.290
.703 4.489 .000
I look carefully to find the best value for the money PCP
Russia The NL
111
3.74 3.23
.931 1.270
-.514 -3.154
.002
Table 4.10 shows t test results that indicate a significant difference between the mean numbers of
Russian and Dutch respondents on all three dimensions of price conscious consumers with p =
.000, .000 and .002 that is lower than α = .05. By looking at mean differences, these results lead to
an assumption that Russian consumers are not particularly interested in buying PCP at sales prices
comparing with Dutch (M=2.39, M=3.17 for Russian and Dutch respondents respectively).
Neither do Russian consumers have a desire to chose lower prices for their PCP in comparing with
Dutch consumers (M=2.29, M=2.99 for Russian and Dutch respondents respectively). However,
Russian consumers do look carefully to find the best value for their money before they make a
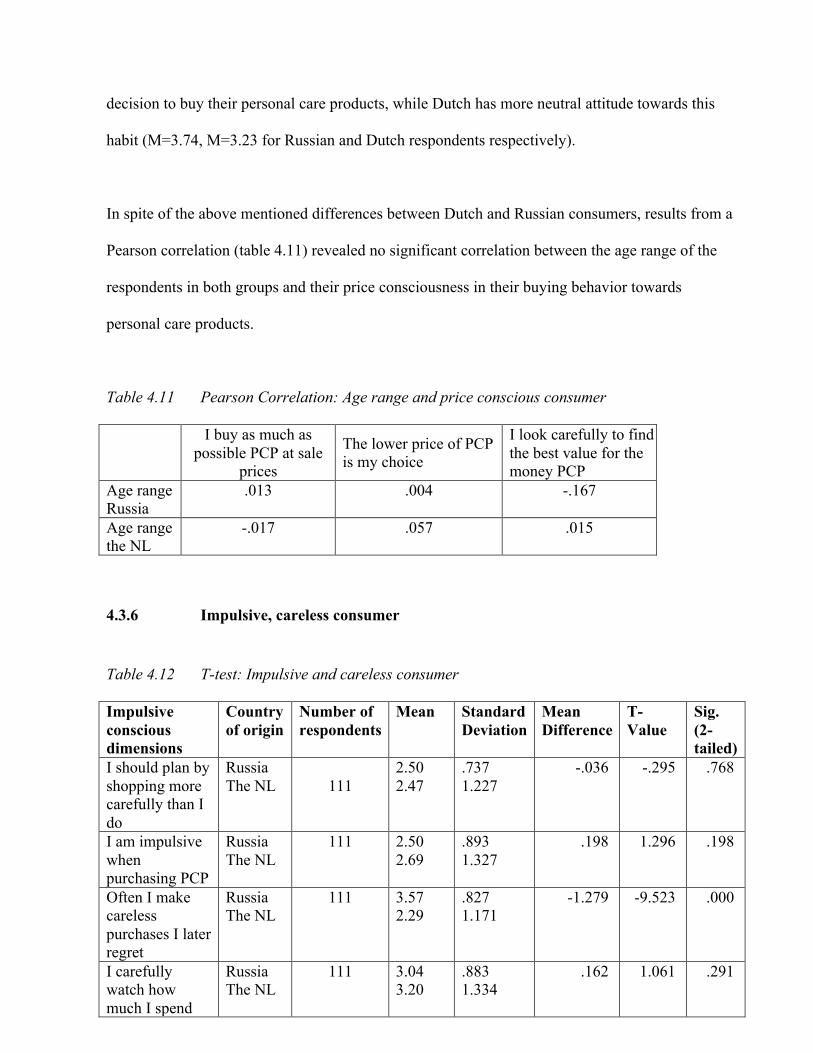
44
decision to buy their personal care products, while Dutch has more neutral attitude towards this
habit (M=3.74, M=3.23 for Russian and Dutch respondents respectively).
In spite of the above mentioned differences between Dutch and Russian consumers, results from a
Pearson correlation (table 4.11) revealed no significant correlation between the age range of the
respondents in both groups and their price consciousness in their buying behavior towards
personal care products.
Table 4.11 Pearson Correlation: Age range and price conscious consumer
I buy as much as possible PCP at sale
prices
The lower price of PCP is my choice
I look carefully to find the best value for the money PCP
Age range Russia
.013 .004 -.167
Age range the NL
-.017 .057 .015
4.3.6 Impulsive, careless consumer Table 4.12 T-test: Impulsive and careless consumer Impulsive conscious dimensions
Country of origin
Number of respondents
Mean Standard Deviation
Mean Difference
T-Value
Sig. (2-tailed)
I should plan by shopping more carefully than I do
Russia The NL
111
2.50 2.47
.737 1.227
-.036 -.295 .768
I am impulsive when purchasing PCP
Russia The NL
111 2.50 2.69
.893 1.327
.198 1.296 .198
Often I make careless purchases I later regret
Russia The NL
111 3.57 2.29
.827 1.171
-1.279 -9.523 .000
I carefully watch how much I spend
Russia The NL
111 3.04 3.20
.883 1.334
.162 1.061 .291
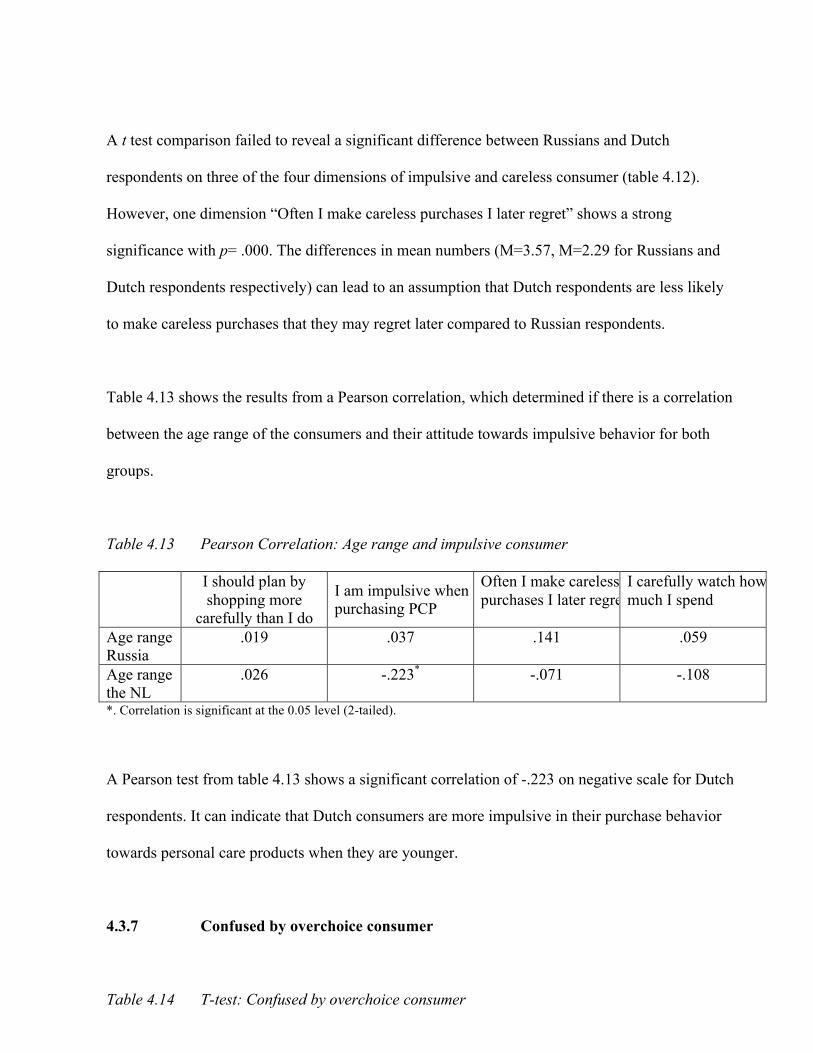
45
A t test comparison failed to reveal a significant difference between Russians and Dutch
respondents on three of the four dimensions of impulsive and careless consumer (table 4.12).
However, one dimension “Often I make careless purchases I later regret” shows a strong
significance with p= .000. The differences in mean numbers (M=3.57, M=2.29 for Russians and
Dutch respondents respectively) can lead to an assumption that Dutch respondents are less likely
to make careless purchases that they may regret later compared to Russian respondents.
Table 4.13 shows the results from a Pearson correlation, which determined if there is a correlation
between the age range of the consumers and their attitude towards impulsive behavior for both
groups.
Table 4.13 Pearson Correlation: Age range and impulsive consumer
I should plan by shopping more
carefully than I do
I am impulsive when purchasing PCP
Often I make careless purchases I later regret
I carefully watch how much I spend
Age range Russia
.019 .037 .141 .059
Age range the NL
.026 -.223* -.071 -.108
*. Correlation is significant at the 0.05 level (2-tailed).
A Pearson test from table 4.13 shows a significant correlation of -.223 on negative scale for Dutch
respondents. It can indicate that Dutch consumers are more impulsive in their purchase behavior
towards personal care products when they are younger.
4.3.7 Confused by overchoice consumer
Table 4.14 T-test: Confused by overchoice consumer
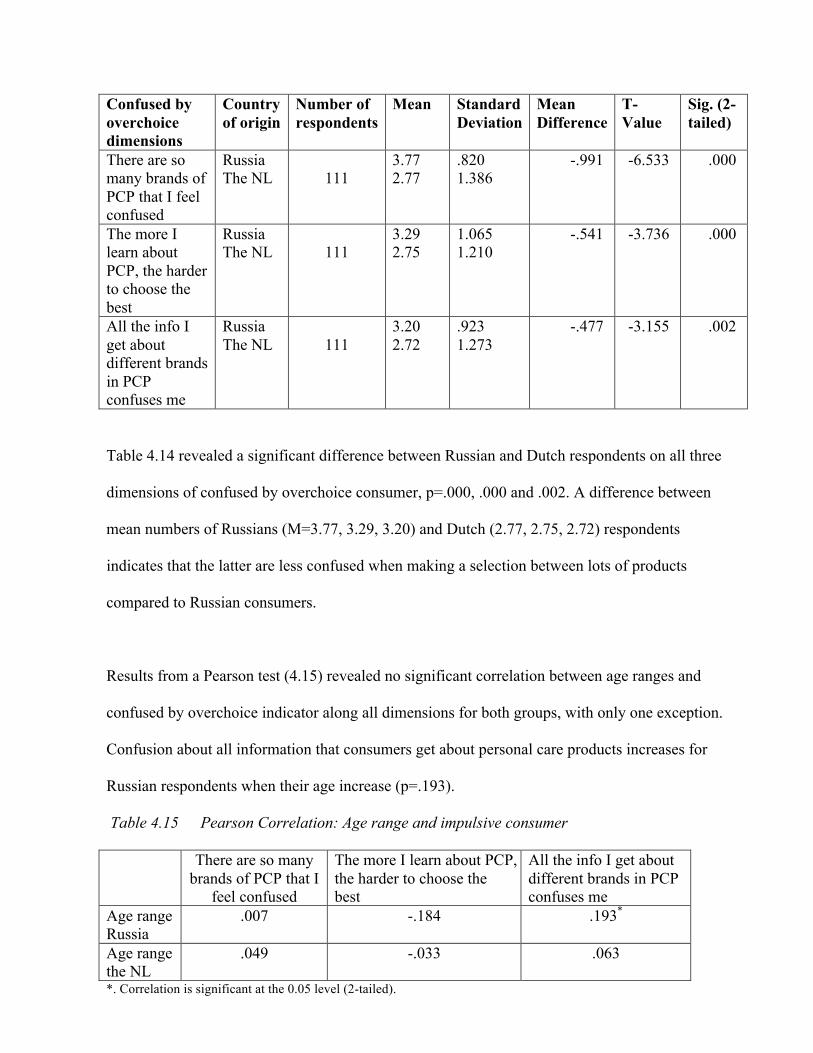
46
Confused by overchoice dimensions
Country of origin
Number of respondents
Mean Standard Deviation
Mean Difference
T-Value
Sig. (2-tailed)
There are so many brands of PCP that I feel confused
Russia The NL
111
3.77 2.77
.820 1.386
-.991 -6.533 .000
The more I learn about PCP, the harder to choose the best
Russia The NL
111
3.29 2.75
1.065 1.210
-.541 -3.736 .000
All the info I get about different brands in PCP confuses me
Russia The NL
111
3.20 2.72
.923 1.273
-.477 -3.155 .002
Table 4.14 revealed a significant difference between Russian and Dutch respondents on all three
dimensions of confused by overchoice consumer, p=.000, .000 and .002. A difference between
mean numbers of Russians (M=3.77, 3.29, 3.20) and Dutch (2.77, 2.75, 2.72) respondents
indicates that the latter are less confused when making a selection between lots of products
compared to Russian consumers.
Results from a Pearson test (4.15) revealed no significant correlation between age ranges and
confused by overchoice indicator along all dimensions for both groups, with only one exception.
Confusion about all information that consumers get about personal care products increases for
Russian respondents when their age increase (p=.193).
Table 4.15 Pearson Correlation: Age range and impulsive consumer
There are so many brands of PCP that I
feel confused
The more I learn about PCP, the harder to choose the best
All the info I get about different brands in PCP confuses me
Age range Russia
.007 -.184 .193*
Age range the NL
.049 -.033 .063
*. Correlation is significant at the 0.05 level (2-tailed).
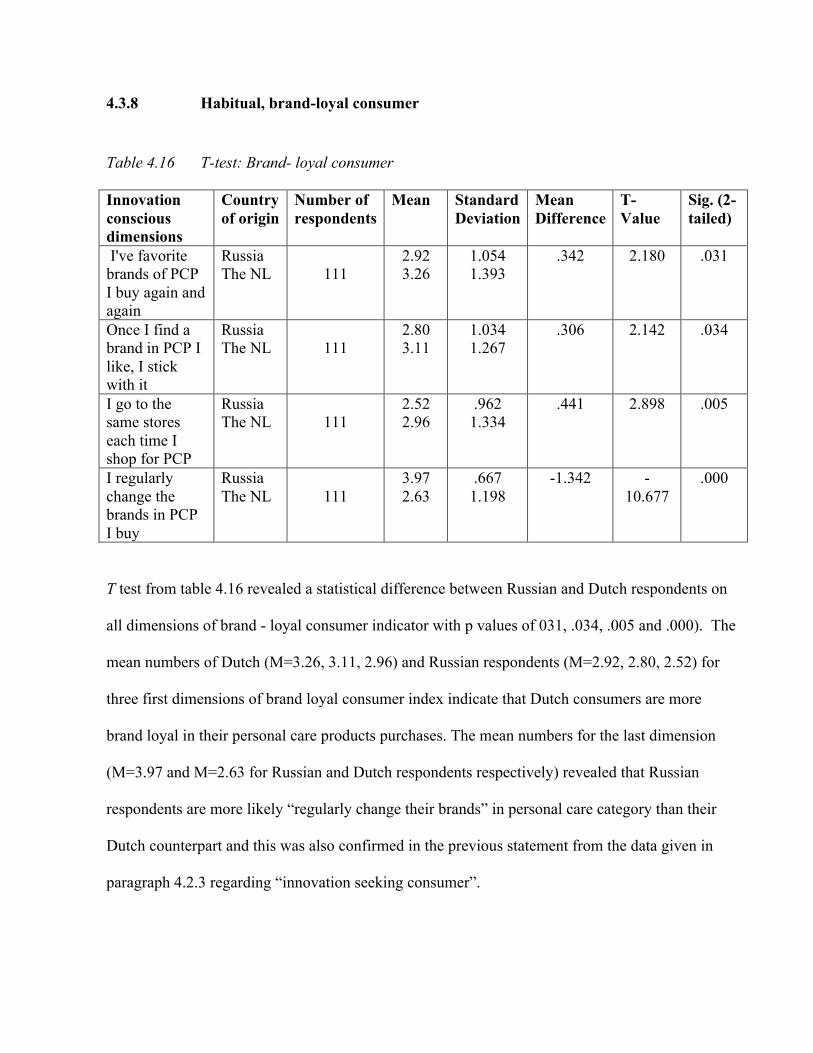
47
4.3.8 Habitual, brand-loyal consumer Table 4.16 T-test: Brand- loyal consumer Innovation conscious dimensions
Country of origin
Number of respondents
Mean Standard Deviation
Mean Difference
T-Value
Sig. (2-tailed)
I've favorite brands of PCP I buy again and again
Russia The NL
111
2.92 3.26
1.054 1.393
.342 2.180 .031
Once I find a brand in PCP I like, I stick with it
Russia The NL
111
2.80 3.11
1.034 1.267
.306 2.142 .034
I go to the same stores each time I shop for PCP
Russia The NL
111
2.52 2.96
.962 1.334
.441 2.898 .005
I regularly change the brands in PCP I buy
Russia The NL
111
3.97 2.63
.667 1.198
-1.342 -10.677
.000
T test from table 4.16 revealed a statistical difference between Russian and Dutch respondents on
all dimensions of brand - loyal consumer indicator with p values of 031, .034, .005 and .000). The
mean numbers of Dutch (M=3.26, 3.11, 2.96) and Russian respondents (M=2.92, 2.80, 2.52) for
three first dimensions of brand loyal consumer index indicate that Dutch consumers are more
brand loyal in their personal care products purchases. The mean numbers for the last dimension
(M=3.97 and M=2.63 for Russian and Dutch respondents respectively) revealed that Russian
respondents are more likely “regularly change their brands” in personal care category than their
Dutch counterpart and this was also confirmed in the previous statement from the data given in
paragraph 4.2.3 regarding “innovation seeking consumer”.
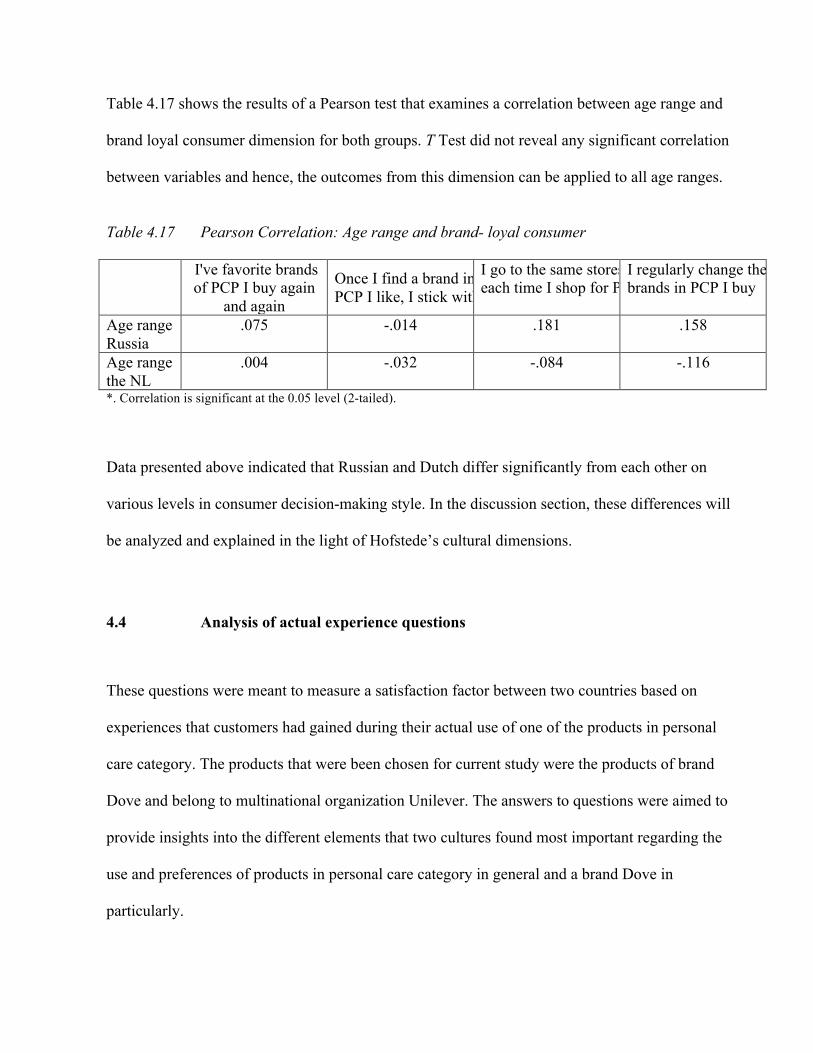
48
Table 4.17 shows the results of a Pearson test that examines a correlation between age range and
brand loyal consumer dimension for both groups. T Test did not reveal any significant correlation
between variables and hence, the outcomes from this dimension can be applied to all age ranges.
Table 4.17 Pearson Correlation: Age range and brand- loyal consumer
I've favorite brands of PCP I buy again
and again
Once I find a brand in PCP I like, I stick with it
I go to the same stores each time I shop for PCP
I regularly change the brands in PCP I buy
Age range Russia
.075 -.014 .181 .158
Age range the NL
.004 -.032 -.084 -.116
*. Correlation is significant at the 0.05 level (2-tailed).
Data presented above indicated that Russian and Dutch differ significantly from each other on
various levels in consumer decision-making style. In the discussion section, these differences will
be analyzed and explained in the light of Hofstede’s cultural dimensions.
4.4 Analysis of actual experience questions
These questions were meant to measure a satisfaction factor between two countries based on
experiences that customers had gained during their actual use of one of the products in personal
care category. The products that were been chosen for current study were the products of brand
Dove and belong to multinational organization Unilever. The answers to questions were aimed to
provide insights into the different elements that two cultures found most important regarding the
use and preferences of products in personal care category in general and a brand Dove in
particularly.
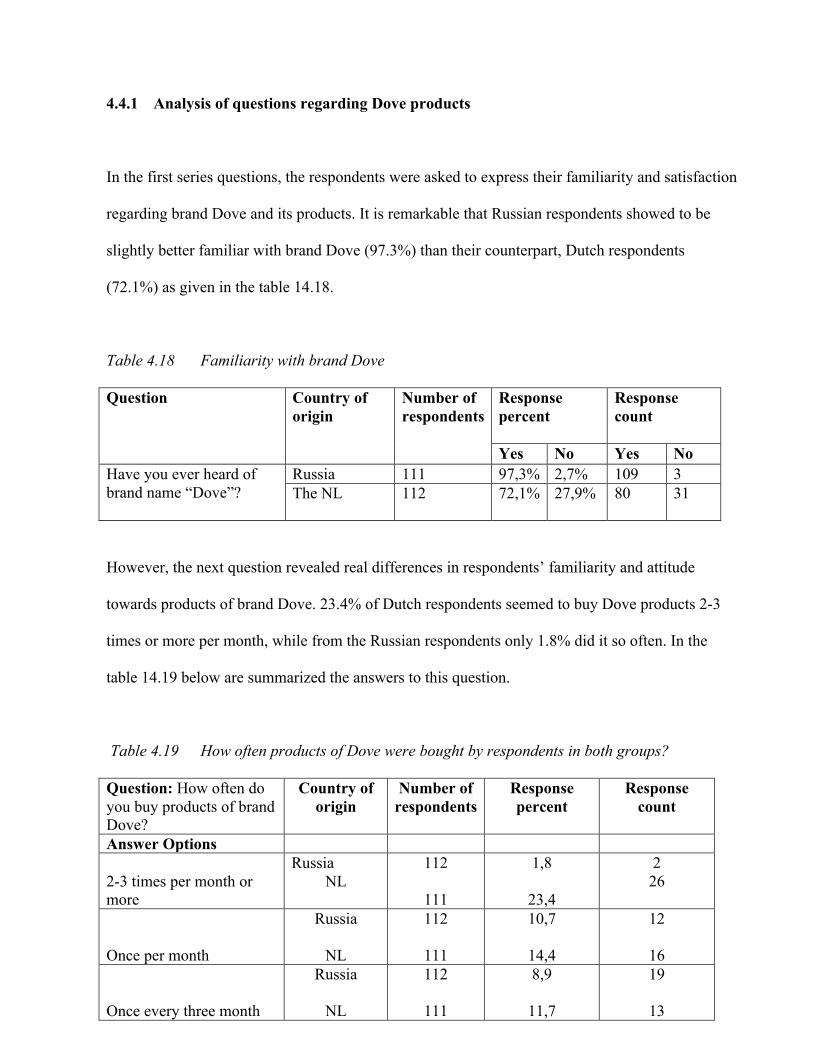
49
4.4.1 Analysis of questions regarding Dove products
In the first series questions, the respondents were asked to express their familiarity and satisfaction
regarding brand Dove and its products. It is remarkable that Russian respondents showed to be
slightly better familiar with brand Dove (97.3%) than their counterpart, Dutch respondents
(72.1%) as given in the table 14.18.
Table 4.18 Familiarity with brand Dove
Question Country of origin
Number of respondents
Response percent
Response count
Yes No Yes No Have you ever heard of brand name “Dove”?
Russia 111 97,3% 2,7% 109 3 The NL 112 72,1%
27,9% 80 31
However, the next question revealed real differences in respondents’ familiarity and attitude
towards products of brand Dove. 23.4% of Dutch respondents seemed to buy Dove products 2-3
times or more per month, while from the Russian respondents only 1.8% did it so often. In the
table 14.19 below are summarized the answers to this question.
Table 4.19 How often products of Dove were bought by respondents in both groups?
Question: How often do you buy products of brand Dove?
Country of origin
Number of respondents
Response percent
Response count
Answer Options
2-3 times per month or more
Russia NL
112
111
1,8
23,4
2 26
Once per month
Russia
NL
112
111
10,7
14,4
12
16
Once every three month
Russia
NL
112
111
8,9
11,7
19
13
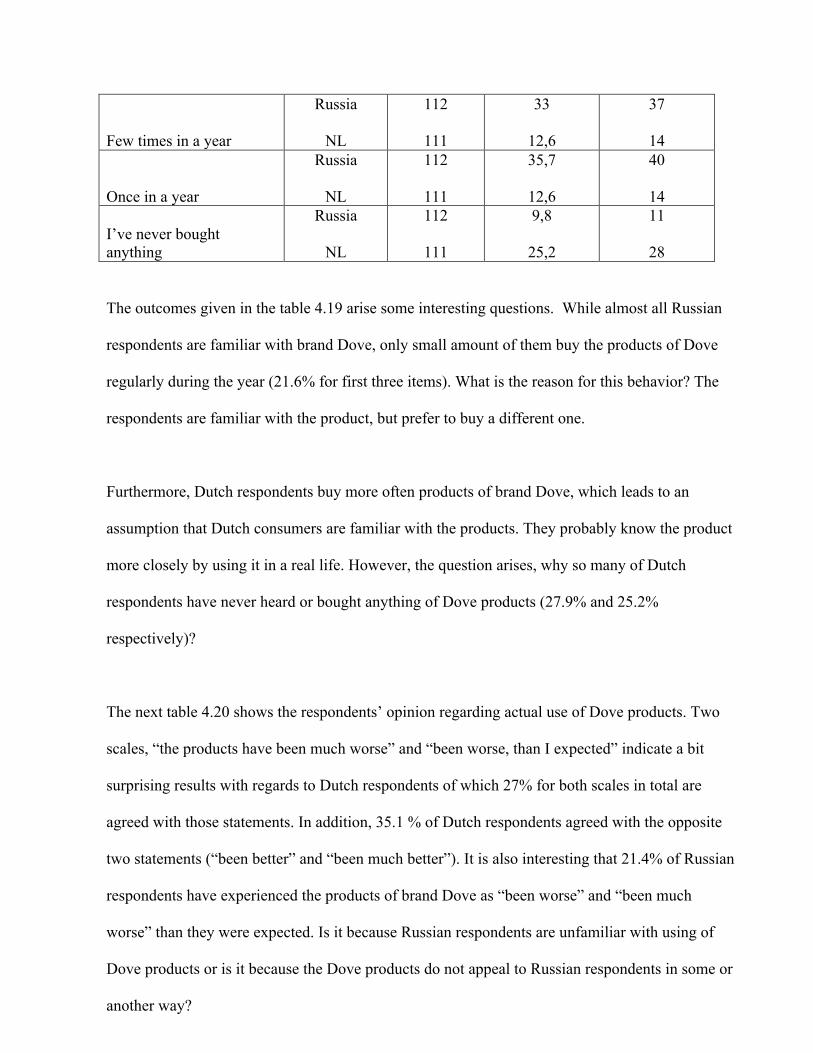
50
Few times in a year
Russia
NL
112
111
33
12,6
37
14
Once in a year
Russia
NL
112
111
35,7
12,6
40
14
I’ve never bought anything
Russia
NL
112
111
9,8
25,2
11
28
The outcomes given in the table 4.19 arise some interesting questions. While almost all Russian
respondents are familiar with brand Dove, only small amount of them buy the products of Dove
regularly during the year (21.6% for first three items). What is the reason for this behavior? The
respondents are familiar with the product, but prefer to buy a different one.
Furthermore, Dutch respondents buy more often products of brand Dove, which leads to an
assumption that Dutch consumers are familiar with the products. They probably know the product
more closely by using it in a real life. However, the question arises, why so many of Dutch
respondents have never heard or bought anything of Dove products (27.9% and 25.2%
respectively)?
The next table 4.20 shows the respondents’ opinion regarding actual use of Dove products. Two
scales, “the products have been much worse” and “been worse, than I expected” indicate a bit
surprising results with regards to Dutch respondents of which 27% for both scales in total are
agreed with those statements. In addition, 35.1 % of Dutch respondents agreed with the opposite
two statements (“been better” and “been much better”). It is also interesting that 21.4% of Russian
respondents have experienced the products of brand Dove as “been worse” and “been much
worse” than they were expected. Is it because Russian respondents are unfamiliar with using of
Dove products or is it because the Dove products do not appeal to Russian respondents in some or
another way?
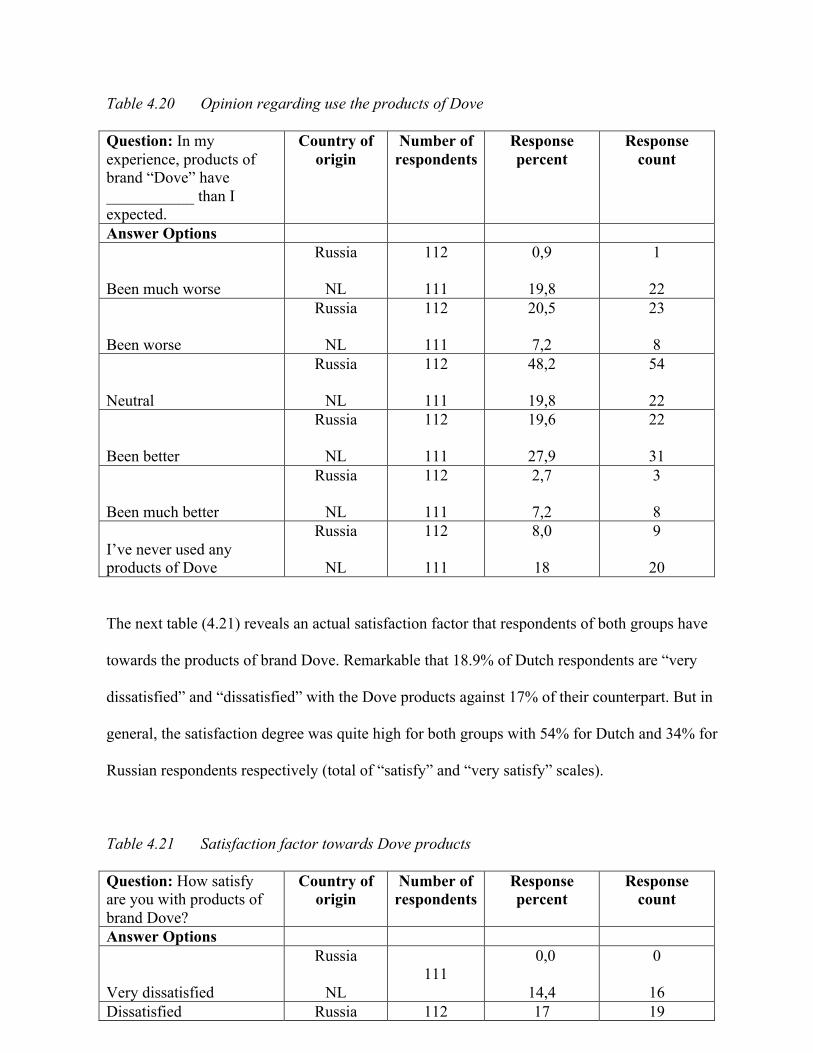
51
Table 4.20 Opinion regarding use the products of Dove
Question: In my experience, products of brand “Dove” have ___________ than I expected.
Country of origin
Number of respondents
Response percent
Response count
Answer Options
Been much worse
Russia
NL
112
111
0,9
19,8
1
22
Been worse
Russia
NL
112
111
20,5
7,2
23 8
Neutral
Russia
NL
112
111
48,2
19,8
54
22
Been better
Russia
NL
112
111
19,6
27,9
22
31
Been much better
Russia
NL
112
111
2,7
7,2
3 8
I’ve never used any products of Dove
Russia
NL
112
111
8,0
18
9
20
The next table (4.21) reveals an actual satisfaction factor that respondents of both groups have
towards the products of brand Dove. Remarkable that 18.9% of Dutch respondents are “very
dissatisfied” and “dissatisfied” with the Dove products against 17% of their counterpart. But in
general, the satisfaction degree was quite high for both groups with 54% for Dutch and 34% for
Russian respondents respectively (total of “satisfy” and “very satisfy” scales).
Table 4.21 Satisfaction factor towards Dove products
Question: How satisfy are you with products of brand Dove?
Country of origin
Number of respondents
Response percent
Response count
Answer Options
Very dissatisfied
Russia
NL
111
0,0
14,4
0
16 Dissatisfied Russia 112 17 19
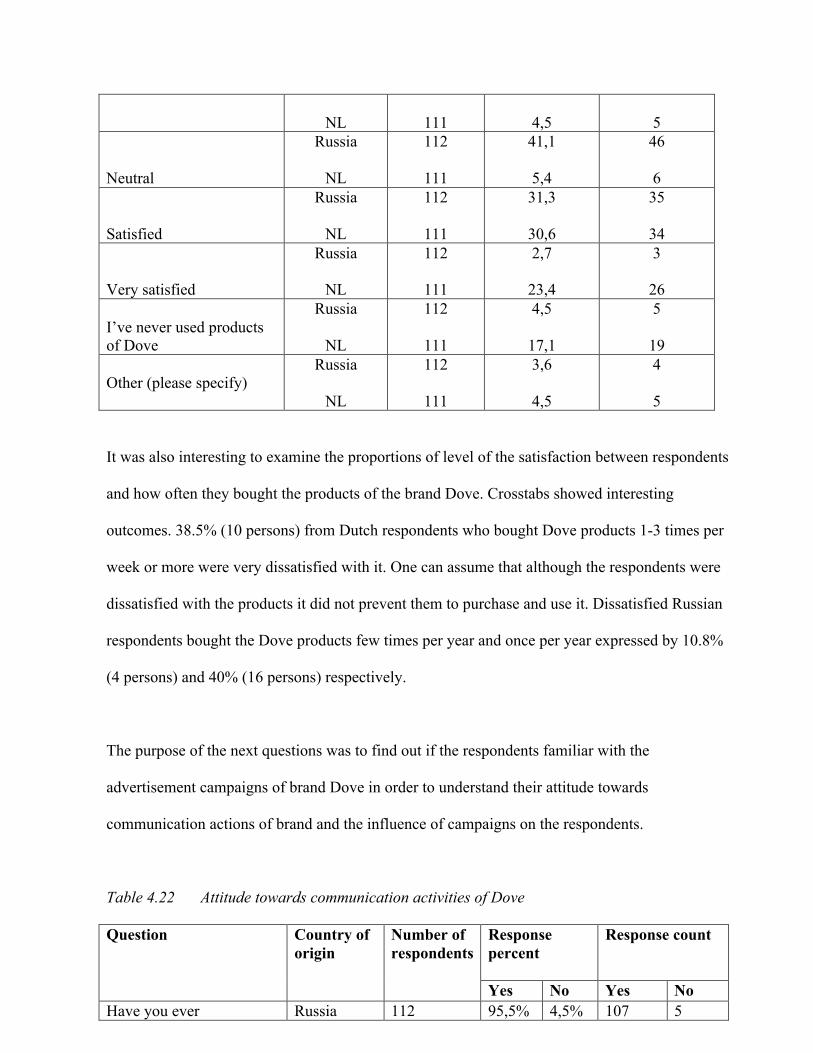
52
NL
111
4,5
5
Neutral
Russia
NL
112
111
41,1
5,4
46 6
Satisfied
Russia
NL
112
111
31,3
30,6
35
34
Very satisfied
Russia
NL
112
111
2,7
23,4
3
26
I’ve never used products of Dove
Russia
NL
112
111
4,5
17,1
5
19
Other (please specify)
Russia
NL
112
111
3,6
4,5
4 5
It was also interesting to examine the proportions of level of the satisfaction between respondents
and how often they bought the products of the brand Dove. Crosstabs showed interesting
outcomes. 38.5% (10 persons) from Dutch respondents who bought Dove products 1-3 times per
week or more were very dissatisfied with it. One can assume that although the respondents were
dissatisfied with the products it did not prevent them to purchase and use it. Dissatisfied Russian
respondents bought the Dove products few times per year and once per year expressed by 10.8%
(4 persons) and 40% (16 persons) respectively.
The purpose of the next questions was to find out if the respondents familiar with the
advertisement campaigns of brand Dove in order to understand their attitude towards
communication actions of brand and the influence of campaigns on the respondents.
Table 4.22 Attitude towards communication activities of Dove
Question Country of origin
Number of respondents
Response percent
Response count
Yes No Yes No Have you ever Russia 112 95,5% 4,5% 107 5
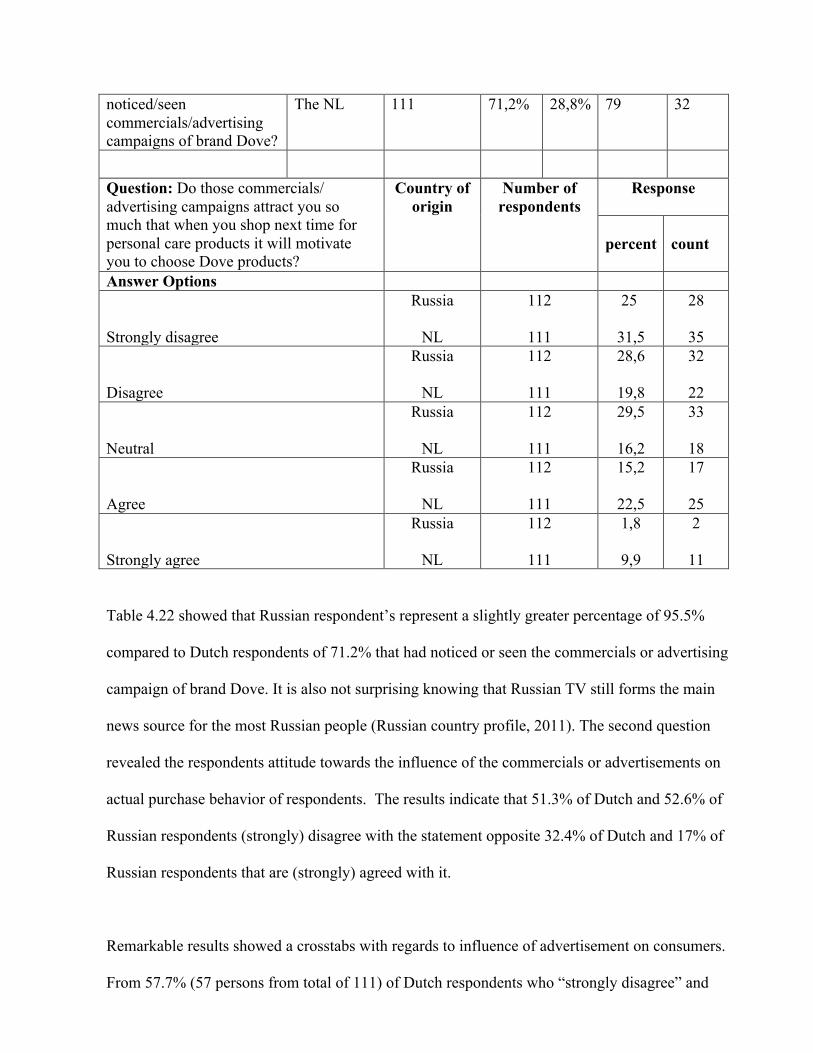
53
noticed/seen commercials/advertising campaigns of brand Dove?
The NL 111 71,2%
28,8% 79 32
Question: Do those commercials/ advertising campaigns attract you so much that when you shop next time for personal care products it will motivate you to choose Dove products?
Country of origin
Number of respondents
Response
percent
count
Answer Options
Strongly disagree
Russia
NL
112
111
25
31,5
28
35
Disagree
Russia
NL
112
111
28,6
19,8
32
22
Neutral
Russia
NL
112
111
29,5
16,2
33
18
Agree
Russia
NL
112
111
15,2
22,5
17
25
Strongly agree
Russia
NL
112
111
1,8
9,9
2
11
Table 4.22 showed that Russian respondent’s represent a slightly greater percentage of 95.5%
compared to Dutch respondents of 71.2% that had noticed or seen the commercials or advertising
campaign of brand Dove. It is also not surprising knowing that Russian TV still forms the main
news source for the most Russian people (Russian country profile, 2011). The second question
revealed the respondents attitude towards the influence of the commercials or advertisements on
actual purchase behavior of respondents. The results indicate that 51.3% of Dutch and 52.6% of
Russian respondents (strongly) disagree with the statement opposite 32.4% of Dutch and 17% of
Russian respondents that are (strongly) agreed with it.
Remarkable results showed a crosstabs with regards to influence of advertisement on consumers.
From 57.7% (57 persons from total of 111) of Dutch respondents who “strongly disagree” and
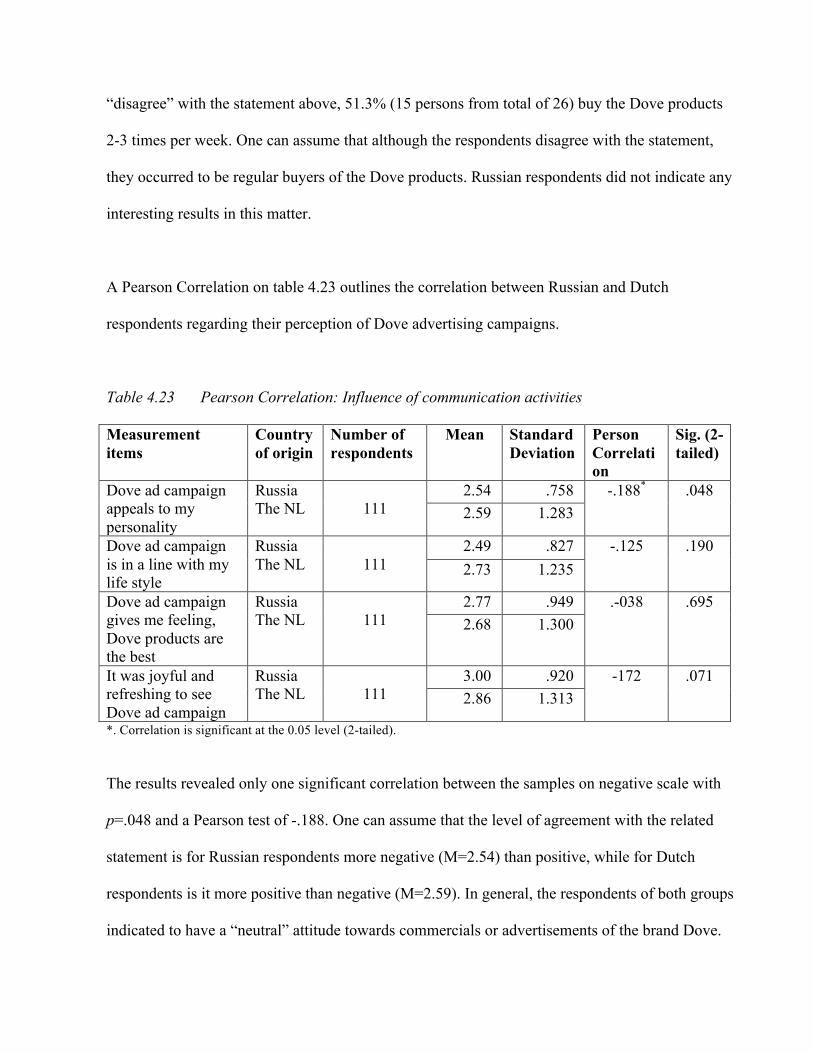
54
“disagree” with the statement above, 51.3% (15 persons from total of 26) buy the Dove products
2-3 times per week. One can assume that although the respondents disagree with the statement,
they occurred to be regular buyers of the Dove products. Russian respondents did not indicate any
interesting results in this matter.
A Pearson Correlation on table 4.23 outlines the correlation between Russian and Dutch
respondents regarding their perception of Dove advertising campaigns.
Table 4.23 Pearson Correlation: Influence of communication activities
Measurement items
Country of origin
Number of respondents
Mean Standard Deviation
Person Correlation
Sig. (2-tailed)
Dove ad campaign appeals to my personality
Russia The NL
111
2.54 .758 -.188* .048 2.59 1.283
Dove ad campaign is in a line with my life style
Russia The NL
111
2.49 .827 -.125 .190 2.73 1.235
Dove ad campaign gives me feeling, Dove products are the best
Russia The NL
111
2.77 .949 .-038 .695 2.68 1.300
It was joyful and refreshing to see Dove ad campaign
Russia The NL
111
3.00 .920 -172 .071 2.86 1.313
*. Correlation is significant at the 0.05 level (2-tailed).
The results revealed only one significant correlation between the samples on negative scale with
p=.048 and a Pearson test of -.188. One can assume that the level of agreement with the related
statement is for Russian respondents more negative (M=2.54) than positive, while for Dutch
respondents is it more positive than negative (M=2.59). In general, the respondents of both groups
indicated to have a “neutral” attitude towards commercials or advertisements of the brand Dove.
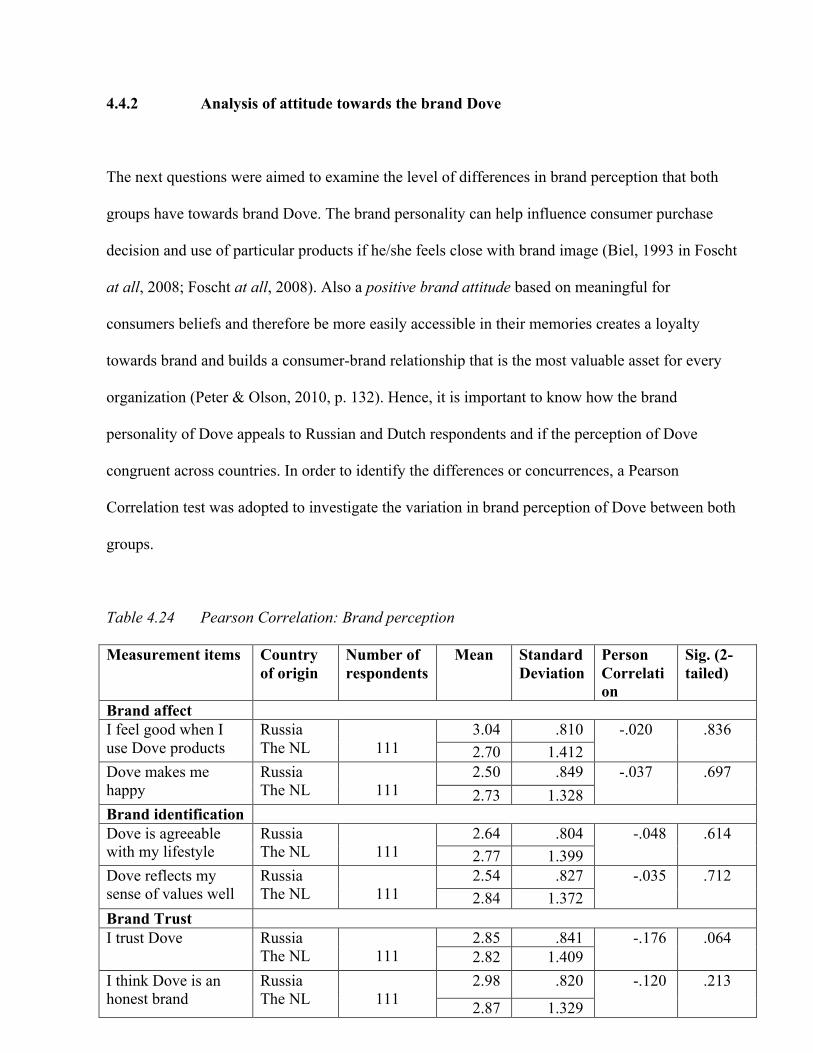
55
4.4.2 Analysis of attitude towards the brand Dove
The next questions were aimed to examine the level of differences in brand perception that both
groups have towards brand Dove. The brand personality can help influence consumer purchase
decision and use of particular products if he/she feels close with brand image (Biel, 1993 in Foscht
at all, 2008; Foscht at all, 2008). Also a positive brand attitude based on meaningful for
consumers beliefs and therefore be more easily accessible in their memories creates a loyalty
towards brand and builds a consumer-brand relationship that is the most valuable asset for every
organization (Peter & Olson, 2010, p. 132). Hence, it is important to know how the brand
personality of Dove appeals to Russian and Dutch respondents and if the perception of Dove
congruent across countries. In order to identify the differences or concurrences, a Pearson
Correlation test was adopted to investigate the variation in brand perception of Dove between both
groups.
Table 4.24 Pearson Correlation: Brand perception
Measurement items Country of origin
Number of respondents
Mean Standard Deviation
Person Correlation
Sig. (2-tailed)
Brand affect I feel good when I use Dove products
Russia The NL
111
3.04 .810 -.020 .836 2.70 1.412
Dove makes me happy
Russia The NL
111
2.50 .849 -.037 .697 2.73 1.328
Brand identification Dove is agreeable with my lifestyle
Russia The NL
111
2.64 .804 -.048
.614 2.77 1.399
Dove reflects my sense of values well
Russia The NL
111
2.54 .827 -.035
.712 2.84 1.372
Brand Trust I trust Dove Russia
The NL
111 2.85 .841 -.176
.064
2.82 1.409 I think Dove is an honest brand
Russia The NL
111
2.98 .820 -.120
.213
2.87 1.329
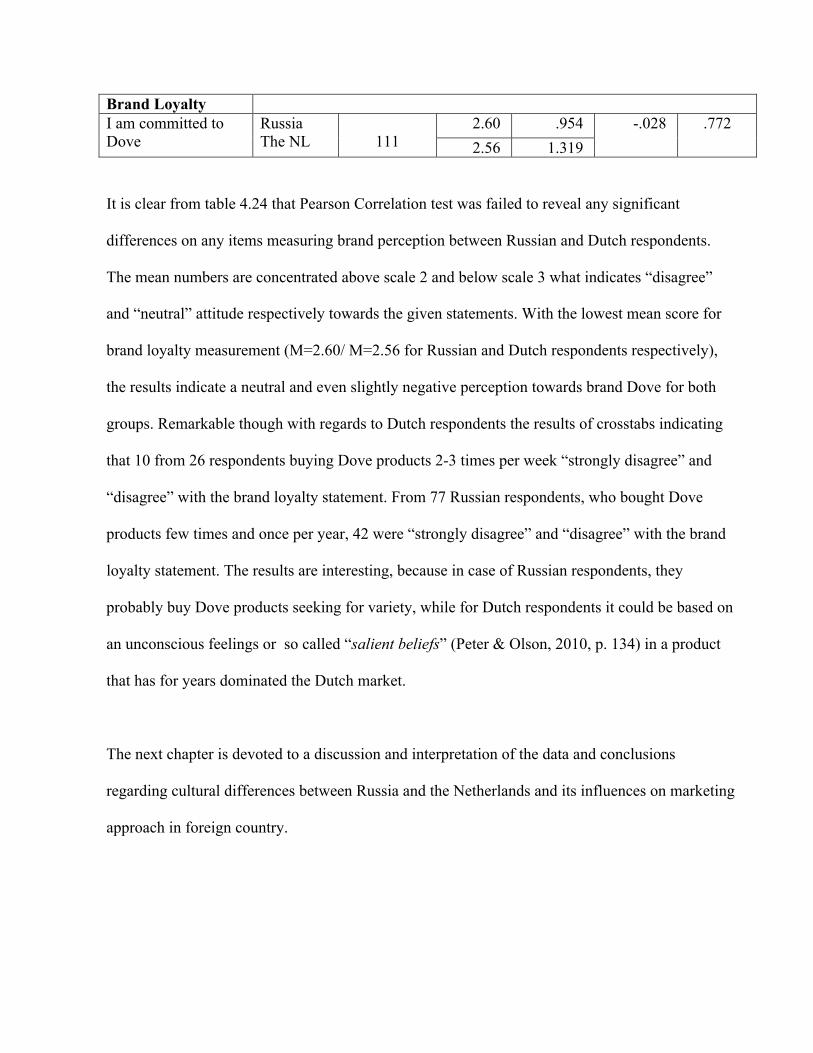
56
Brand Loyalty I am committed to Dove
Russia The NL
111
2.60 .954 -.028
.772 2.56 1.319
It is clear from table 4.24 that Pearson Correlation test was failed to reveal any significant
differences on any items measuring brand perception between Russian and Dutch respondents.
The mean numbers are concentrated above scale 2 and below scale 3 what indicates “disagree”
and “neutral” attitude respectively towards the given statements. With the lowest mean score for
brand loyalty measurement (M=2.60/ M=2.56 for Russian and Dutch respondents respectively),
the results indicate a neutral and even slightly negative perception towards brand Dove for both
groups. Remarkable though with regards to Dutch respondents the results of crosstabs indicating
that 10 from 26 respondents buying Dove products 2-3 times per week “strongly disagree” and
“disagree” with the brand loyalty statement. From 77 Russian respondents, who bought Dove
products few times and once per year, 42 were “strongly disagree” and “disagree” with the brand
loyalty statement. The results are interesting, because in case of Russian respondents, they
probably buy Dove products seeking for variety, while for Dutch respondents it could be based on
an unconscious feelings or so called “salient beliefs” (Peter & Olson, 2010, p. 134) in a product
that has for years dominated the Dutch market.
The next chapter is devoted to a discussion and interpretation of the data and conclusions
regarding cultural differences between Russia and the Netherlands and its influences on marketing
approach in foreign country.
57
CHAPTER 5 Conclusions and Discussions
In the previous chapter, the data were presented and investigated. The goal of this chapter is two-
fold. First, the research findings will be discussed using Hofstede’s cultural dimensions method
and Hall’s high-low measurement in order to explain the cultural differences between investigated
countries. Second, it will be described how the results of this dissertation can help to understand
the importance of investigating a cultural background of future target group for international
organizations.
One of the aims of the current study was to form an understanding of the impact of culture on
consumer’s use and preferences with regards to personal care products. To fulfill this purpose, the
cultural differences between Russian and Dutch consumers were examined. The other goal was to
investigate if the differences have an effect on developing a marketing approach in Russia and the
Netherlands. Results demonstrated that there are indeed vast differences between Russian and
Dutch consumers, which suggests that companies may want to tailor their marketing approach
according to difference cultures as will be explained in this chapter.
5.1 Cultural dimensions of Hofstede
In one of the previous paragraphs 3.5, the five dimensions of Hofstede were described and
explained. The current paragraph presents Hofstede’s dimensions of culture to explain cultural
differences between Russia and the Netherlands.
An overall picture of analyzed and investigated data given in chapter 4 confirmed a big difference
between Russian and Dutch consumers, which is in accordance with scores calculated by Hofstede
(2005) on his cultural dimensions index. For instance, Russian respondents showed significant
58
differences compared to Dutch respondents on 21 of 33 dimensions of consumer decision-making
style indicator (CSI).
Power distance
In the introduction, it was explained that the dimension of power distance is the extent to which
the less powerful members of a society accept that power is distributed unequally (Hofstede &
Hofstede, 2005, p. 46). In cultural values of a country with a high score on power distance
dimension, it is expressed by two factors, powerful people or people of authority on the one side
and less powerful people or people without authority on the other side. Everyone in a society has
his or her own place as a result of natural acceptance of these distinctions (de Mooij, 2010). On
the other hand, in cultures with lower power distance index, the focus lies on independence and
equality in rights. Therefore, in a large power distance culture, a social status of a person has to be
clear for the others to understand how to communicate with them (like with an equal or show a
higher respect), while is it of no importance in lower power distance culture, where signs of
inequality stands for inappropriate behavior.
In terms of communication, status symbol is frequently used by global brands in their marketing
approach in large power distance cultures to appeal to an element of prestige that is very important
for those countries (de Mooij, 2010). De Mooij (2010, p. 76) had further emphasized the
importance of being the “number one” brand in countries with large power distance culture.
Russia and the Netherlands differ significantly on the power distance dimension. The scores of 93
for Russia and 38 for the Netherlands indicate a big contrast between these two countries. Based
on this contrast it is reasonable to expect differences in these countries in terms of consumer
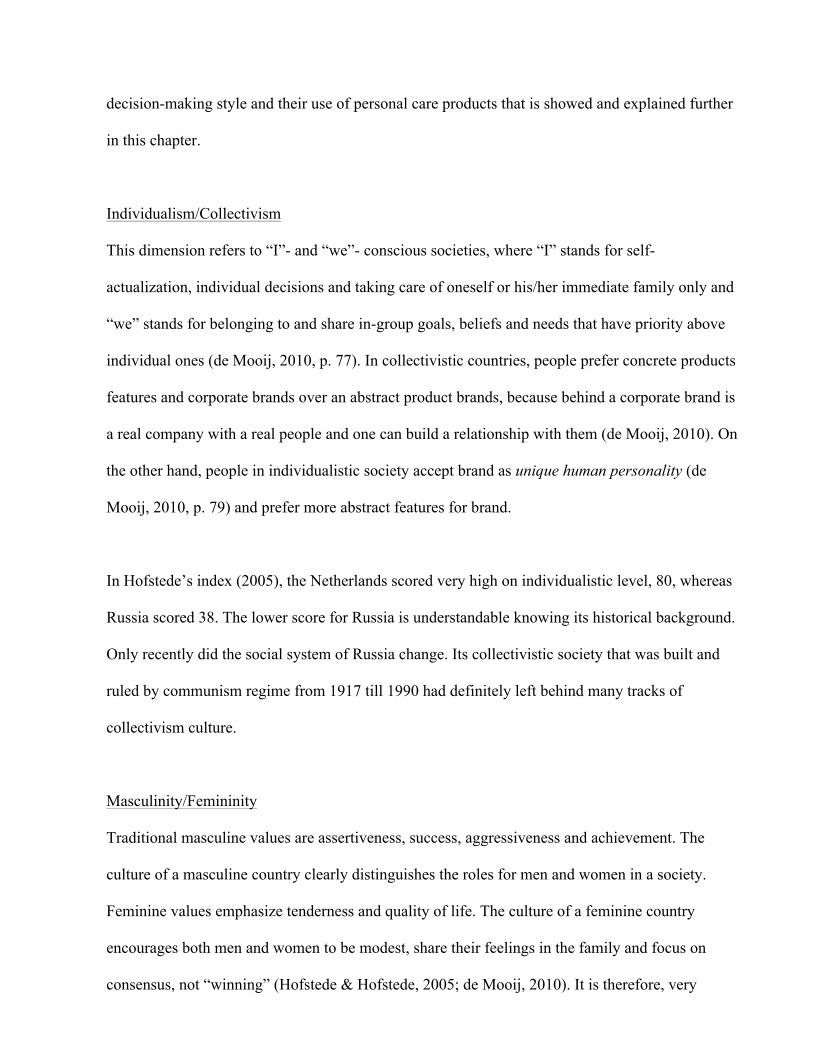
59
decision-making style and their use of personal care products that is showed and explained further
in this chapter.
Individualism/Collectivism
This dimension refers to “I”- and “we”- conscious societies, where “I” stands for self-
actualization, individual decisions and taking care of oneself or his/her immediate family only and
“we” stands for belonging to and share in-group goals, beliefs and needs that have priority above
individual ones (de Mooij, 2010, p. 77). In collectivistic countries, people prefer concrete products
features and corporate brands over an abstract product brands, because behind a corporate brand is
a real company with a real people and one can build a relationship with them (de Mooij, 2010). On
the other hand, people in individualistic society accept brand as unique human personality (de
Mooij, 2010, p. 79) and prefer more abstract features for brand.
In Hofstede’s index (2005), the Netherlands scored very high on individualistic level, 80, whereas
Russia scored 38. The lower score for Russia is understandable knowing its historical background.
Only recently did the social system of Russia change. Its collectivistic society that was built and
ruled by communism regime from 1917 till 1990 had definitely left behind many tracks of
collectivism culture.
Masculinity/Femininity
Traditional masculine values are assertiveness, success, aggressiveness and achievement. The
culture of a masculine country clearly distinguishes the roles for men and women in a society.
Feminine values emphasize tenderness and quality of life. The culture of a feminine country
encourages both men and women to be modest, share their feelings in the family and focus on
consensus, not “winning” (Hofstede & Hofstede, 2005; de Mooij, 2010). It is therefore, very
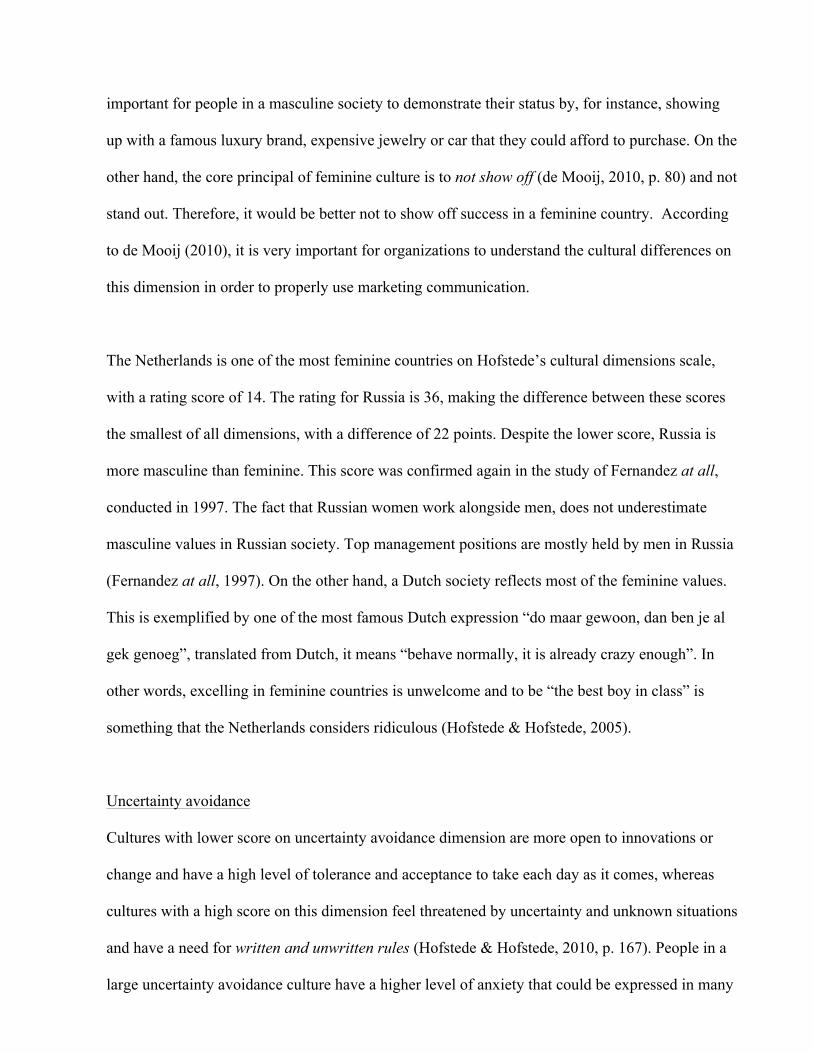
60
important for people in a masculine society to demonstrate their status by, for instance, showing
up with a famous luxury brand, expensive jewelry or car that they could afford to purchase. On the
other hand, the core principal of feminine culture is to not show off (de Mooij, 2010, p. 80) and not
stand out. Therefore, it would be better not to show off success in a feminine country. According
to de Mooij (2010), it is very important for organizations to understand the cultural differences on
this dimension in order to properly use marketing communication.
The Netherlands is one of the most feminine countries on Hofstede’s cultural dimensions scale,
with a rating score of 14. The rating for Russia is 36, making the difference between these scores
the smallest of all dimensions, with a difference of 22 points. Despite the lower score, Russia is
more masculine than feminine. This score was confirmed again in the study of Fernandez at all,
conducted in 1997. The fact that Russian women work alongside men, does not underestimate
masculine values in Russian society. Top management positions are mostly held by men in Russia
(Fernandez at all, 1997). On the other hand, a Dutch society reflects most of the feminine values.
This is exemplified by one of the most famous Dutch expression “do maar gewoon, dan ben je al
gek genoeg”, translated from Dutch, it means “behave normally, it is already crazy enough”. In
other words, excelling in feminine countries is unwelcome and to be “the best boy in class” is
something that the Netherlands considers ridiculous (Hofstede & Hofstede, 2005).
Uncertainty avoidance
Cultures with lower score on uncertainty avoidance dimension are more open to innovations or
change and have a high level of tolerance and acceptance to take each day as it comes, whereas
cultures with a high score on this dimension feel threatened by uncertainty and unknown situations
and have a need for written and unwritten rules (Hofstede & Hofstede, 2010, p. 167). People in a
large uncertainty avoidance culture have a higher level of anxiety that could be expressed in many
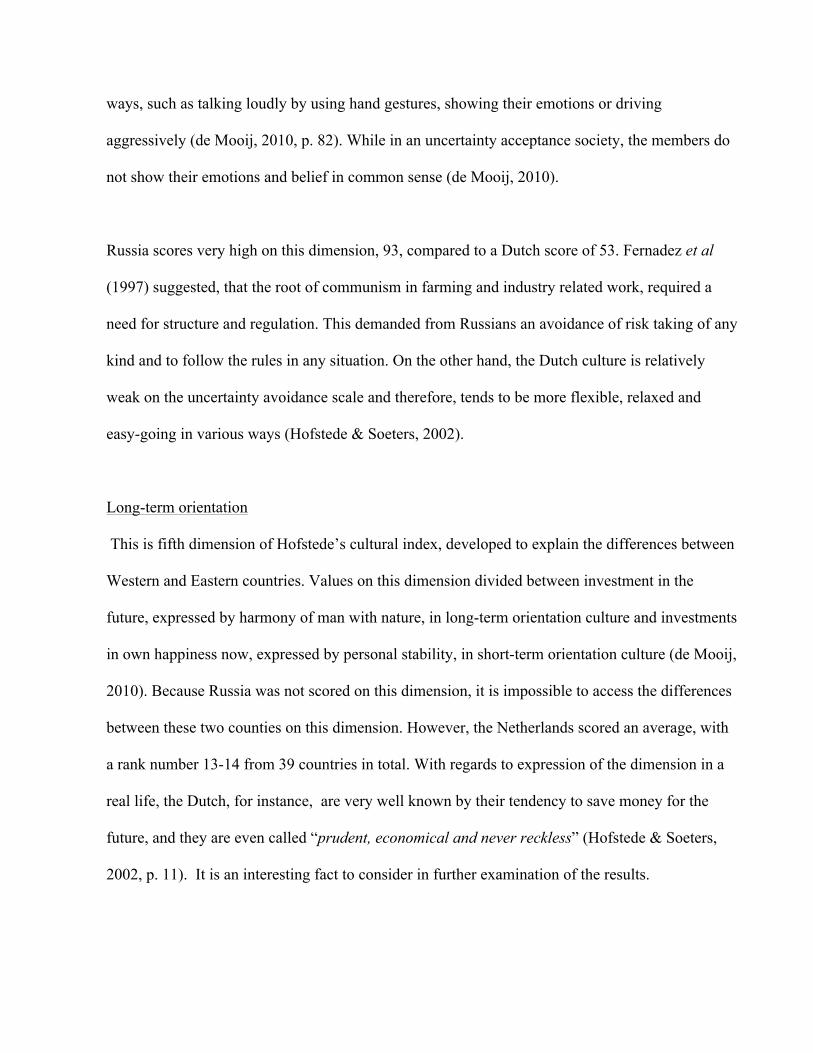
61
ways, such as talking loudly by using hand gestures, showing their emotions or driving
aggressively (de Mooij, 2010, p. 82). While in an uncertainty acceptance society, the members do
not show their emotions and belief in common sense (de Mooij, 2010).
Russia scores very high on this dimension, 93, compared to a Dutch score of 53. Fernadez et al
(1997) suggested, that the root of communism in farming and industry related work, required a
need for structure and regulation. This demanded from Russians an avoidance of risk taking of any
kind and to follow the rules in any situation. On the other hand, the Dutch culture is relatively
weak on the uncertainty avoidance scale and therefore, tends to be more flexible, relaxed and
easy-going in various ways (Hofstede & Soeters, 2002).
Long-term orientation
This is fifth dimension of Hofstede’s cultural index, developed to explain the differences between
Western and Eastern countries. Values on this dimension divided between investment in the
future, expressed by harmony of man with nature, in long-term orientation culture and investments
in own happiness now, expressed by personal stability, in short-term orientation culture (de Mooij,
2010). Because Russia was not scored on this dimension, it is impossible to access the differences
between these two counties on this dimension. However, the Netherlands scored an average, with
a rank number 13-14 from 39 countries in total. With regards to expression of the dimension in a
real life, the Dutch, for instance, are very well known by their tendency to save money for the
future, and they are even called “prudent, economical and never reckless” (Hofstede & Soeters,
2002, p. 11). It is an interesting fact to consider in further examination of the results.
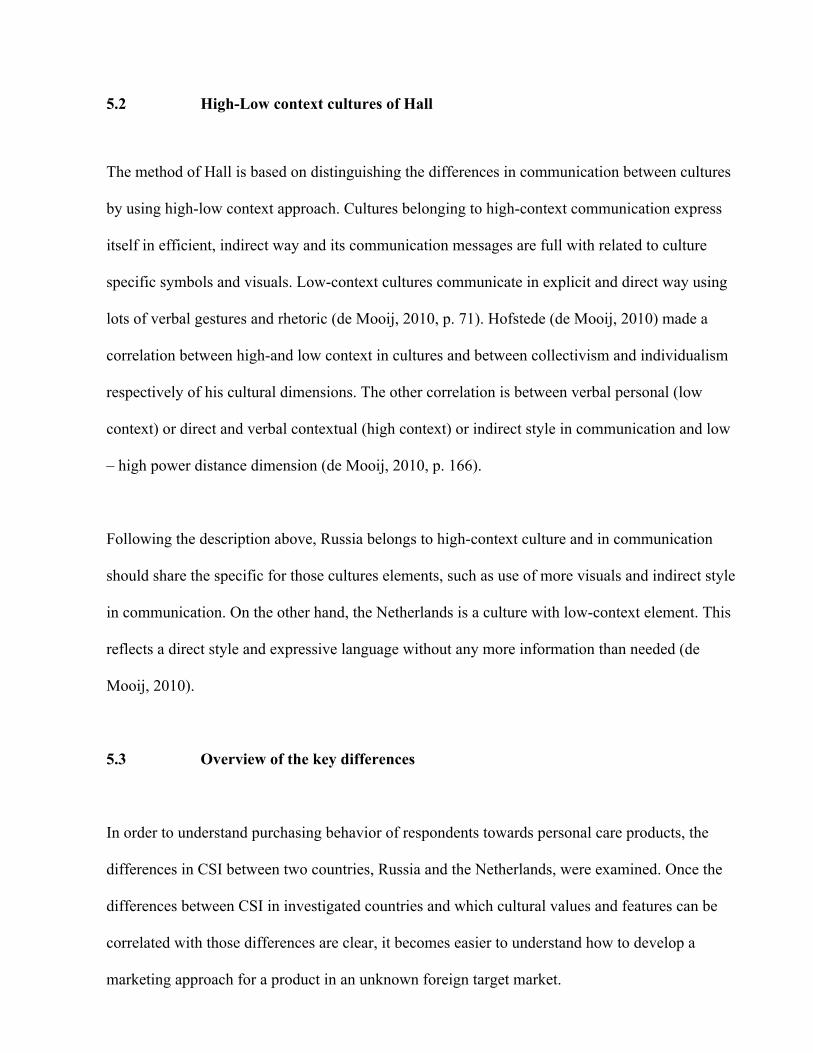
62
5.2 High-Low context cultures of Hall
The method of Hall is based on distinguishing the differences in communication between cultures
by using high-low context approach. Cultures belonging to high-context communication express
itself in efficient, indirect way and its communication messages are full with related to culture
specific symbols and visuals. Low-context cultures communicate in explicit and direct way using
lots of verbal gestures and rhetoric (de Mooij, 2010, p. 71). Hofstede (de Mooij, 2010) made a
correlation between high-and low context in cultures and between collectivism and individualism
respectively of his cultural dimensions. The other correlation is between verbal personal (low
context) or direct and verbal contextual (high context) or indirect style in communication and low
– high power distance dimension (de Mooij, 2010, p. 166).
Following the description above, Russia belongs to high-context culture and in communication
should share the specific for those cultures elements, such as use of more visuals and indirect style
in communication. On the other hand, the Netherlands is a culture with low-context element. This
reflects a direct style and expressive language without any more information than needed (de
Mooij, 2010).
5.3 Overview of the key differences
In order to understand purchasing behavior of respondents towards personal care products, the
differences in CSI between two countries, Russia and the Netherlands, were examined. Once the
differences between CSI in investigated countries and which cultural values and features can be
correlated with those differences are clear, it becomes easier to understand how to develop a
marketing approach for a product in an unknown foreign target market.
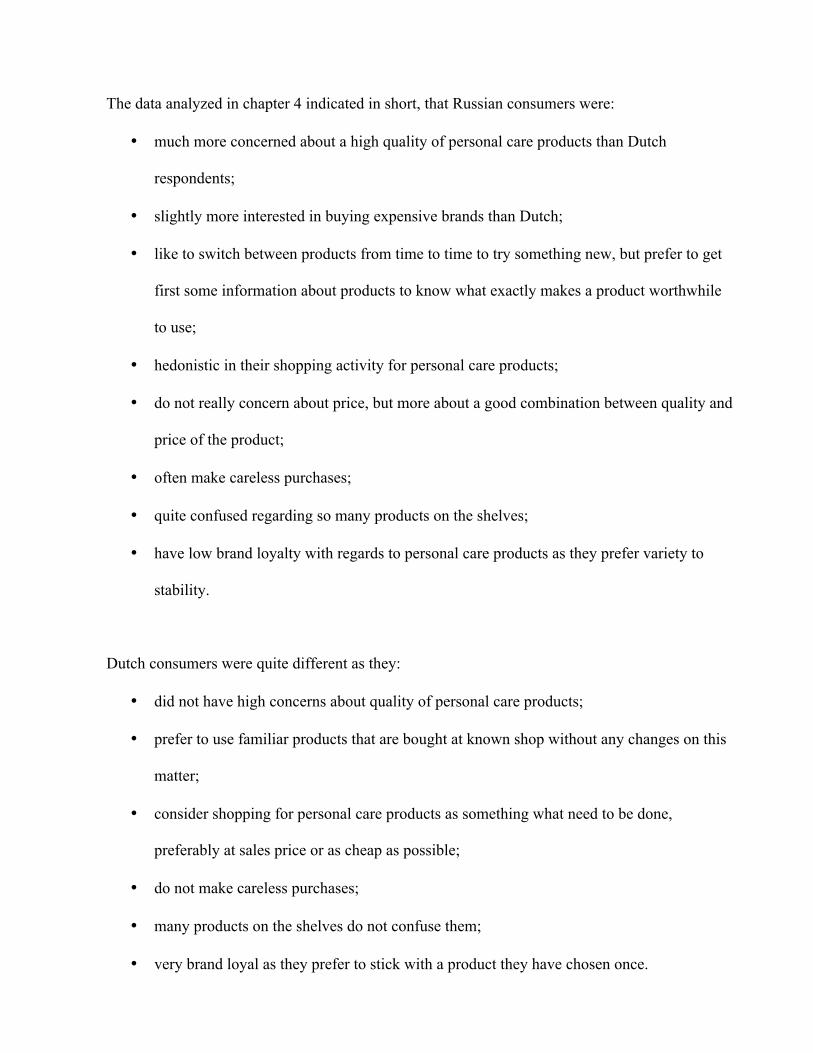
63
The data analyzed in chapter 4 indicated in short, that Russian consumers were:
• much more concerned about a high quality of personal care products than Dutch
respondents;
• slightly more interested in buying expensive brands than Dutch;
• like to switch between products from time to time to try something new, but prefer to get
first some information about products to know what exactly makes a product worthwhile
to use;
• hedonistic in their shopping activity for personal care products;
• do not really concern about price, but more about a good combination between quality and
price of the product;
• often make careless purchases;
• quite confused regarding so many products on the shelves;
• have low brand loyalty with regards to personal care products as they prefer variety to
stability.
Dutch consumers were quite different as they:
• did not have high concerns about quality of personal care products;
• prefer to use familiar products that are bought at known shop without any changes on this
matter;
• consider shopping for personal care products as something what need to be done,
preferably at sales price or as cheap as possible;
• do not make careless purchases;
• many products on the shelves do not confuse them;
• very brand loyal as they prefer to stick with a product they have chosen once.
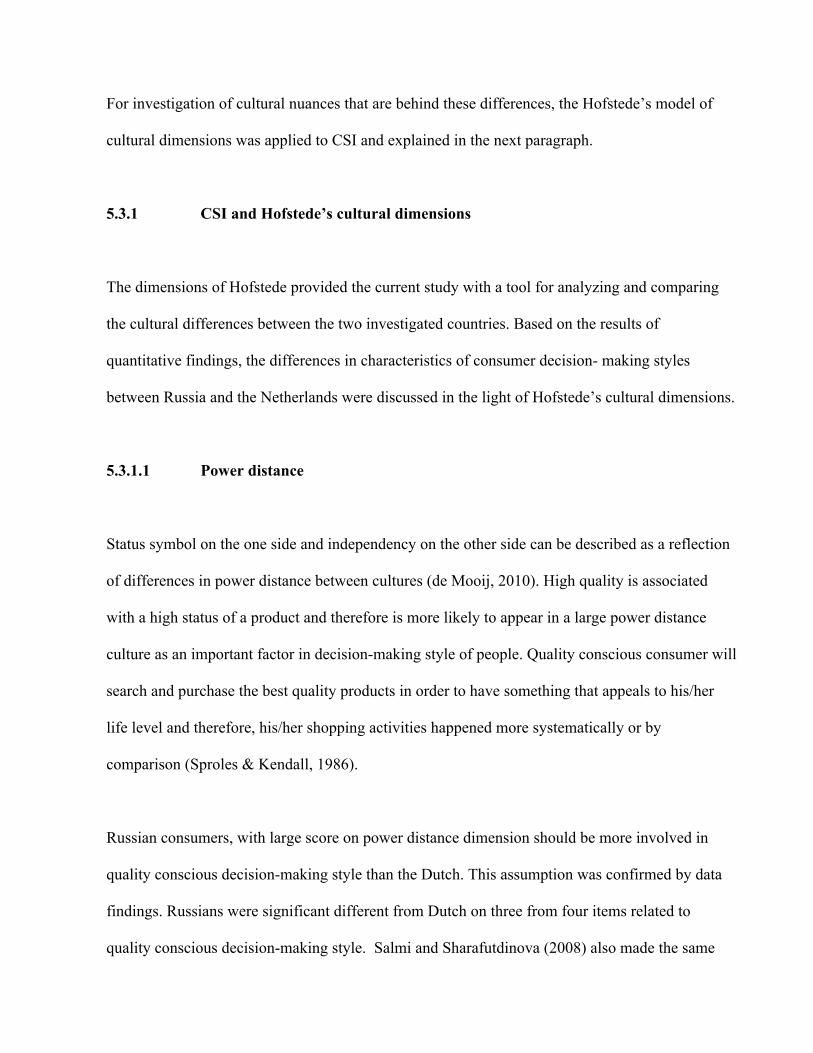
64
For investigation of cultural nuances that are behind these differences, the Hofstede’s model of
cultural dimensions was applied to CSI and explained in the next paragraph.
5.3.1 CSI and Hofstede’s cultural dimensions
The dimensions of Hofstede provided the current study with a tool for analyzing and comparing
the cultural differences between the two investigated countries. Based on the results of
quantitative findings, the differences in characteristics of consumer decision- making styles
between Russia and the Netherlands were discussed in the light of Hofstede’s cultural dimensions.
5.3.1.1 Power distance
Status symbol on the one side and independency on the other side can be described as a reflection
of differences in power distance between cultures (de Mooij, 2010). High quality is associated
with a high status of a product and therefore is more likely to appear in a large power distance
culture as an important factor in decision-making style of people. Quality conscious consumer will
search and purchase the best quality products in order to have something that appeals to his/her
life level and therefore, his/her shopping activities happened more systematically or by
comparison (Sproles & Kendall, 1986).
Russian consumers, with large score on power distance dimension should be more involved in
quality conscious decision-making style than the Dutch. This assumption was confirmed by data
findings. Russians were significant different from Dutch on three from four items related to
quality conscious decision-making style. Salmi and Sharafutdinova (2008) also made the same
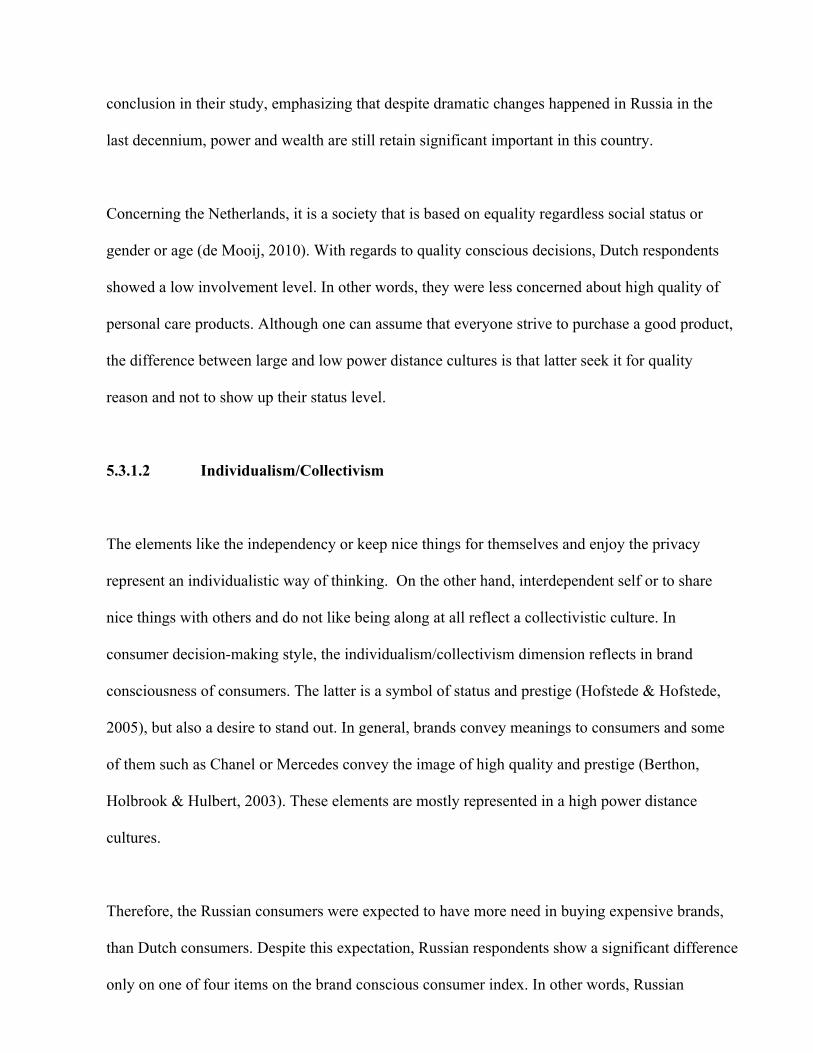
65
conclusion in their study, emphasizing that despite dramatic changes happened in Russia in the
last decennium, power and wealth are still retain significant important in this country.
Concerning the Netherlands, it is a society that is based on equality regardless social status or
gender or age (de Mooij, 2010). With regards to quality conscious decisions, Dutch respondents
showed a low involvement level. In other words, they were less concerned about high quality of
personal care products. Although one can assume that everyone strive to purchase a good product,
the difference between large and low power distance cultures is that latter seek it for quality
reason and not to show up their status level.
5.3.1.2 Individualism/Collectivism
The elements like the independency or keep nice things for themselves and enjoy the privacy
represent an individualistic way of thinking. On the other hand, interdependent self or to share
nice things with others and do not like being along at all reflect a collectivistic culture. In
consumer decision-making style, the individualism/collectivism dimension reflects in brand
consciousness of consumers. The latter is a symbol of status and prestige (Hofstede & Hofstede,
2005), but also a desire to stand out. In general, brands convey meanings to consumers and some
of them such as Chanel or Mercedes convey the image of high quality and prestige (Berthon,
Holbrook & Hulbert, 2003). These elements are mostly represented in a high power distance
cultures.
Therefore, the Russian consumers were expected to have more need in buying expensive brands,
than Dutch consumers. Despite this expectation, Russian respondents show a significant difference
only on one of four items on the brand conscious consumer index. In other words, Russian
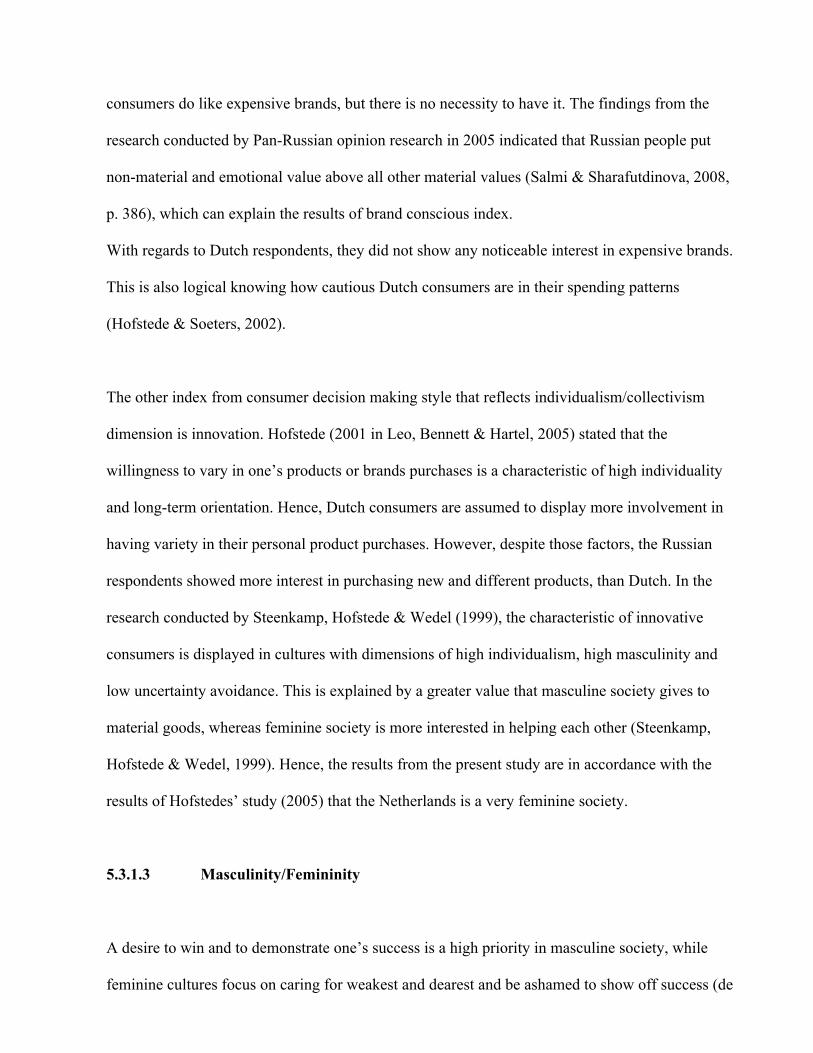
66
consumers do like expensive brands, but there is no necessity to have it. The findings from the
research conducted by Pan-Russian opinion research in 2005 indicated that Russian people put
non-material and emotional value above all other material values (Salmi & Sharafutdinova, 2008,
p. 386), which can explain the results of brand conscious index.
With regards to Dutch respondents, they did not show any noticeable interest in expensive brands.
This is also logical knowing how cautious Dutch consumers are in their spending patterns
(Hofstede & Soeters, 2002).
The other index from consumer decision making style that reflects individualism/collectivism
dimension is innovation. Hofstede (2001 in Leo, Bennett & Hartel, 2005) stated that the
willingness to vary in one’s products or brands purchases is a characteristic of high individuality
and long-term orientation. Hence, Dutch consumers are assumed to display more involvement in
having variety in their personal product purchases. However, despite those factors, the Russian
respondents showed more interest in purchasing new and different products, than Dutch. In the
research conducted by Steenkamp, Hofstede & Wedel (1999), the characteristic of innovative
consumers is displayed in cultures with dimensions of high individualism, high masculinity and
low uncertainty avoidance. This is explained by a greater value that masculine society gives to
material goods, whereas feminine society is more interested in helping each other (Steenkamp,
Hofstede & Wedel, 1999). Hence, the results from the present study are in accordance with the
results of Hofstedes’ study (2005) that the Netherlands is a very feminine society.
5.3.1.3 Masculinity/Femininity
A desire to win and to demonstrate one’s success is a high priority in masculine society, while
feminine cultures focus on caring for weakest and dearest and be ashamed to show off success (de
67
Mooij, 2010). Price conscious decision-making index indicates consumers searching for ‘value for
money’ products (Sproles & Kendall, 1986, p. 269) and products with low prices. The Netherlands
are very high on femininity dimension and therefore, Dutch consumers logically showed to be
more price conscious then Russians. On the other hand, Russian culture lies between masculinity
and femininity. Hence, the data indicated Russians to be conscious with regards to price-quality
correlation, but they seemed to be careless regarding an actual price that is paid for personal care
products.
5.3.1.4 Uncertainty avoidance
This dimension reflects in high uncertainty avoidance cultures a structure, need for scientific
proof, explanation, more information before purchasing and resistance to change on the one side,
and searching for innovation, seeking for variety and like to take more risk on the other side in low
uncertainty avoidance cultures. Impulsive buying decision-making index is about impulsive
purchases of consumers. Impulsive behavior is explanatory in its nature, involving risk and desire
for change (Sharma, Sivakumaran & Marshall, 2010, p. 476) and therefore is more prerogative of
the cultures ranking low in uncertainty avoidance.
Russia is a culture that scored high in uncertainty avoidance (95), while the Netherlands had low
score (53). However, Russian and Dutch respondents were not significantly different in their
impulsiveness towards buying decisions. Though, the Russian respondents were a bit more
careless towards purchasing personal care products as one item from CSI index revealed.
Knowing that Russians are variety and quality seeking consumers, but also showed to gained
pleasure from shopping activity, the impulsiveness seemed to be very understandable in their
buying behavior.
68
In addition, Dutch consumers were shown to be more brand loyal on CSI index. The latter is,
however, in the line with a risk reduction behavior that is a feature of high uncertainty avoidance
dimension. Therefore, the results of this data are in contradiction with the score of Hofstede
dimension. Dutch respondents tends to remain with their favorite brands or store (Sproles &
Kendall, 1986), while Russians that scored high on uncertainty avoidance dimension, like to
change brands to try different products in search for high quality and variety.
5.3.2 Differences related to brand Dove
Data presented in the chapter 4 demonstrated that Russian respondents are more familiar with the
brand name “Dove” (97.3%) compared to Dutch respondents (72. 1%). Russian respondents were
also more knowledgeable on advertising/commercial campaign of the brand as 95.5% of them had
noticed an advertisement/commercial compared to 71.2% of Dutch respondents. Despite those
facts, Russian respondents do not buy Dove products as many times as Dutch respondents.
Although 48.2% of Russian respondents spend 20% and 30% of their money on personal care
products, while 61% of Dutch respondents only spend 10% of their spending on personal care
products, Russian respondents prefer to purchase a different product instead of Dove. A logical
question arises. Why only small percent of Russians purchase the Dove products frequently, while
almost all Russian respondents indicated to be familiar with the name of brand Dove?
Furthermore, there is an interesting contradiction with the responses of Dutch consumers. They are
not really satisfied with the products of brand Dove, but still 48, 5% of them keep buying Dove
products. It is also interesting that almost 30% of them never heard the name of Dove and are
unfamiliar with its commercials and advertising campaign. A likely explanation is that Dove is a
Dutch product and Dutch consumers are aware of it, even if not all of them know its name. Brands
69
have its own life and carry associations that are full with meaning for consumers and all others
involved with the process (Berthon, Holbrook & Hulbert, 2003). Hence, to transfer the intended
brand image demands lots of time, but also a condition that it is expressed in the right way to
targeted group. As is mentioned in paragraph 4.2, the name of brand Dove has been in existence
in the Netherlands for sixteen years, while it is active on Russian market only since 1995.
5.4 Conclusions
The focus of this study was getting insight into the impact of cultural differences on consumer’s
use, needs and preferences towards personal care products and to understand its influences on
developing a marketing approach for establishing a product or brand in a foreign market. The
cultural differences between two countries, Russia and the Netherlands, were investigated to fulfill
this purpose.
This study provides evidence that Russian and Dutch consumers differ significantly in their
decision making styles as well as in their needs and using demands towards personal care
products. The application of Hofstede’s method and CSI to measure cultural differences revealed
an interesting mix of answers confirming few cultural dimensions scores of Hofstede, but making
questionable the others. According to Hofstede (Hofstede & Hofstede, 2010), the general
description characterizing Dutch culture, for instance, is that Dutch consumers are high on
individualism and low on uncertainty avoidance and therefore would expected to be searching for
variety in different shops and for innovative and new products, but also be less brand loyal as this
is a risk reduction behavior.
70
However, the results showed that Dutch consumers prefer to purchase the same products, do not
search for variation and like to stick to familiar brand. It was also confirmed by the data with
regards to Dove products. Although Dutch respondents were not completely satisfied with Dove
products, they did buy it frequently. The possible explanation could lie in a presence of another
dimension: femininity. The latter implies the underestimation of any kind of actions or deeds
made by an individual (Hofstede & Hofstede, 2010). In other words, searching for variety or
willingness to buy different brands could lead to a suggestion to acquiring something better than
what others have. The latter has a negative connotation in Dutch society. Hence, it is preferable to
stick with a product that is generally accepted by everyone.
In short, the most important aspects for Dutch consumers in personal care products seemed to be a
familiarity with product use (even more than familiarity with the name of product), low price,
availability in a shop and a small level of satisfaction.
The Russian consumers that are high in power distance, high on uncertainty avoidance and
relative high collectivism would be expected to be more brand conscious and brand loyal and less
innovation and variety seeking. Instead of this, Russian consumers turned out to be very curious in
trying new products or brands and did not like to stick to one particular product searching for the
best for themselves. The study about Russian value and character conducted by Folsom and
Strelsky (1944, p. 301) explained the core of Russian values as the world of human beings
themselves that is linked with attitudes of affection and interest. The previously discussed aspects
of Russian preferences towards purchasing the products could very well be explained by the
description of Folsom and Strelsky (1944).
71
Furthermore, the results with regards to Dove products confirmed the purchase behavior of
Russian consumers. The Dove name is known in Russia, its commercials are noticed, but the
attitude towards its products is neutral and buying frequency is very low. On the one hand, the
Russians are curious and ready to buy a new product just to try it, but on the other hand, they need
more to consider this product as the best choice for repeat purchase. In short, Russian consumers
have to become more interested in a product to willing to get more information about product and
to purchase it more frequently, if it has satisfied their desires.
Therefore, a marketing approach of brand Dove with regards to the famous campaign “Dove for
real beauty”, was quite unsuccessful in Russia. Firstly, in Russian culture that is high on power
distance and uncertainty avoidance, the women have strong opinion to be more valued by men by
being more physically attractive (de Mooij, 2010, p. 100). Secondly, Dove got an attention of
Russian consumers by using a marketing communication that was not in the line with the most
desirable needs for targeted group. In practice, it meant that a brand name was noticed, but
perception about products was wrong. It led to disappointed results with regards to actual sales
and the image about the brand. The data from this study confirmed that the name Dove is familiar
to Russian respondents, but it is not what they choose to buy frequently.
5.5 Recommendations
The importance of conducting cross-cultural research in order to gain success in foreign markets
continues to grow for all practitioners around the world (de Mooij, 2010; de Mooij & Hofstede,
2010). However, it is no easy task to fulfill due to various obstacles, such as different language
and time- and money consuming factors. The other factor is a culture that is in general difficult to
measure and to understand (Peter & Olson, 2010). No doubt that culture has great influence on
72
consumer’s buying decision process. Therefore, to examine a cultural background of the new
target group and its effect on purchase behavior can contribute to understanding of consumers in
foreign market.
Knowledge of consumer decision-making style can shed a light into decision how to market a
product to get an attention of desired target group. Consumer decision-making style index is a tool
that helps to get insights into this particular subject and therefore, an organization can make better
decision towards approaching a targeted market. The investigation of differences in consumer
decision making styles and analysis of the results in the light of cultural dimension of Hofstede
can provide the organizations with useful and profound information regarding foreign culture and
buying behavior of new consumers.
Furthermore, the identification of specific characteristics to picture a profile of consumer styles
(Sproles & Kendall, 1986, p. 268) will help to better understand how to trigger a consumer to get
his/her attention to a product or brand and eventually not only to buy it, but also to create a long-
term relationship with a consumer. In approaching a target group of foreign and unknown market,
it is a demand to conduct a needed cultural research to assure that a marketing approach developed
in a right direction to be able to achieve the settled goals of an organization. The findings form
current study suggest that both Hofstede dimensions and CSI variables should be examine in order
to get a full picture of a real cultural reason behind the choices consumers make in their buying
decision behavior.
The results of current study encourage international organizations to investigate consumer
decision-making style in the light of Hofstede’s dimensions in order to achieve the effectiveness
of marketing a product or brand in a foreign country. The investigation of these factors will open a
73
window for understanding the cultural habits, needs, demands of new nation. Above all it will play
a priority role in attracting new consumers to new offered products on the market. Finally, this
study also supports an argument of great importance of the cultural research in international
context. It is not a spending, but it is a valuable investment that leads to increasing of market share
in the long run term for every organization working on international arena.
5.6 Limitations of the present study
The current study has several limitations that may have affected the outcome of the results. First
and foremost, the large number of variables included raises the potential occurrence of a type 2
error. Since the alpha level for statistical significance was set at 0.05, one out of twenty variables
may have been significantly different between cultural groups due to chance. However, since the
variables of interest were highly significant with p values below 0.01, the chance of a type 2 error
was minimized in this study.
A second issue is a common issue in these types of studies, in that the questionnaire was presented
in two different languages to two different cultures. It can have an impact on the outcome of the
study. The author of the study tried to minimize the influence of language on interpretation by
modifying questions according to her own Dutch/Russian background.
A third limitation of the current study is also a common limitation of similar studies and involves
subject recruitment. Participants were recruited through specific means such as social media,
which would automatically exclude a demographic of the population. This could not be helped,
but measures were taken to use the same recruitment methods across cultures in order to minimize
a potential effect. Secondly, the survey was distributed to respondents in Russia that mostly live in
74
Moscow and St. - Petersburg. It is also because of better availability of computers and Internet
connections. The Russians living in those big cities slightly differ from Russians living in the rest
of the country with regards to cultural level (Salmi & Sharafutdinova, 2008). It could have an
influence on the actual findings.
Furthermore, differences were detected between variables such as age, education and income (not
sure if they were all different but quite sure income was different). In order to overcome this
limitation, an ANCOVA was used to analyze the variables of interest, setting age, education or
income as a covariate. An ANCOVA determined that differences in age, education and income did
not significantly affect the results.
Lastly, the methods used in the current study to analyze the findings (CSI and Hofstede’s cultural
dimensions) have not previously been used in the context proposed in this study. It is possible that
an application of these methods to a particular product as it was used in current research, is not
very effective because the respondents could answer the questions in general way and do not see
that the questions ask the answer with regards to a particular product. This limitation was
overcome by making specific reference to the product in the survey questionnaire.
In conclusion, although this study had several limitations, specific strategies were employed to
overcome these limitations and increase the validity of the research findings. Overall, the study
demonstrated that unique traits exist within each culture and that marketing strategies have to be
adapted accordingly.
75
5.7 Suggestions for future research
The research of the current study examined the impact of culture on consumer use, needs and
demands towards personal care products and determined how consumer attitude affects
developing a marketing approach in different markets. Future research could further investigate
this issue as outlined below.
In this study cultural differences were investigated by linking national culture to two individual
countries in general and consumer decision-making style in particular. Further research could
extend these findings by measuring variables at the regional level. Within each country, for
instance such big as Russia, there might occur different variations among regions and even cities.
Therefore, the examining of specific cultural needs at the regional level will increase achieving of
success in developing of effective marketing approach for a product in foreign market.
Secondly, the findings from current study can be generalized to some extent with regards to
consumer products that serve different purposes, other than personal care category. However, it
would be interesting to conduct an additional research to explore the results in different products
categories.
Furthermore, the data for this study were collected from two countries. Therefore, the application
of the model used in current research to larger amount of countries will be valuable in terms of the
generalization of the results.
Finally, the investigation of cultural differences could also be conducted by using a different
framework. A different investigation approach of cross-cultural study, that is using new methods,

76
has a potential to deepening a general understanding about cultural influences on consumer
preferences and needs. Looking on this subject form other perspective will provide useful
guidance to a better understanding how to create a value for consumers in foreign country.
77
Bibliography
Aridas, T. (2010) “Economic Freedom by Country – 2010 Ranking” [Online]. Available at:
http://www.gfmag.com/tools/global-database/economic-data/10292-economic-freedom-by-
country-2010-ranking.html#axzz1R8UkPGuv (Accessed: 4 July 2011)
BBC News (2011) “Russian country profile” [Online]. Available from:
http://news.bbc.co.uk/2/hi/europe/country_profiles/1102275.stm (Accessed: 29 July 2011)
Brodbeck, M. & Evans, E. (2007) “Dove Campaign for Real Beauty Case Study” [Online].
Available from: http://psucomm473.blogspot.com/2007/03/dove-campaign-for-real-beauty-
case.html (Accessed: 10 June 2011)
CIA - The World Factbook (2010) “The Nederlands” [Online]. Available from:
https://www.cia.gov/library/publications/the-world-factbook/geos/nl.html (Accessed: 2 July 2011)
Datamonitor (2010) “Personal Products Industry Profile: Europe”, [Online]. Available from:
http://ehis.ebscohost.com.ezproxy.liv.ac.uk/eds/pdfviewer/pdfviewer?vid=3&hid=6&sid=5c5c46a
a-0b3d-4f56-9523-2e72ee9b8388%40sessionmgr12 (Accessed: 13 June 2011)
Dostupnaja, S. (2008) “Dove: Campaign for Real Beauty”, [Online]. Available from:
http://www.netlore.ru/dove-kampaniya-za-realnuyu-krasotu (Accessed: 5 July 2011)
78
Euromonitor International (2011) “Beauty and personal care in Russia” [Online]. Available from:
http://www.portal.euromonitor.com.ezproxy.liv.ac.uk/Portal/Pages/Magazine/WelcomePage.aspx
(Accessed: 13 June 2011)
Euromonitor International (2011) “Consumer lifestyle in Russia” [Online]. Available from:
http://www.portal.euromonitor.com.ezproxy.liv.ac.uk/Portal/Pages/Magazine/WelcomePage.aspx
(Accessed: 13 June 2011)
Euromonitor International (2010) “Looking for Growth: non-stop opportunities within Beauty and
Personal Care” [Online]. Available from:
http://www.portal.euromonitor.com.ezproxy.liv.ac.uk/Portal/Handlers/accessPDF.ashx?c=83\PDF
\&f=F-175176-19677783.pdf&code=%2b5z9tPLQRa%2fOSjjpKUxAuLzwl94%3d (Accessed:
13 June 2011)
Euromonitor International (2009) “Consumer lifestyle in Netherlands” [Online]. Available from:
http://www.portal.euromonitor.com.ezproxy.liv.ac.uk/Portal/Pages/Magazine/WelcomePage.aspx
(Accessed: 13 June 2011)
Euromonitor International (2011) “Netherlands: Country Pulse” [Online]. Available from:
http://www.portal.euromonitor.com.ezproxy.liv.ac.uk/Portal/Pages/Magazine/WelcomePage.aspx
(Accessed: 13 June 2011)
Fernandez, D.R., Carlson, D.S., Stepina, L.P. & Nicholson, J.D. (1997) “Hofstede’s Country
Classification 25 years later”, The Journal of Social Psychology, 137 (1), pp. 43-54
79
Firoz, N.M.& Ramin, T. (2004) “Understanding Cultural Variables is Critical to Success in
International Business”, International Journal of Management, 21 (3), pp. 307-321
Folsom, J.K. & Strelsky, N. (1944) “Russian Values and Character--A Preliminary Exploration”,
American Sociological Review, 9 (3), pp. 296-307
Foscht, T, Maloles III, C., Swoboda, B., Morschett, D. & Sinha, I. (2008) “The impact of culture
on brand perceptions: a six-nation study”, Journal of Product & Brand Management, 17(3), pp.
131-142
Gabrielsson, P., Gabrielsson, M. & Gabrielsson, H. (2008) “ International advertising campaigns
in fast-moving consumer goods companies originating from a SMOPEC country”, International
Business Review, 17, pp. 714-728
Hofstede, G. (1980) Culture’s Consequences. Sage Publications, California, USA
Hofstede, G.H. & Hofstede, G. (2005) Cultures and organizations: software of mind. McGraw-
Hills books
Hofstede, G. & Soeters, J. (2002) “Consensus Societies with Their Own Character: National
Cultures in Japan and the Netherlands”, Comparative Sociology, 1 (1), pp. 1-16
IABC Russia (2008) Interview: We haven’t reached yet a high position in an advertisement world
[Online]. Available from: http://www.communicators.ru/interview/kudashkin_int (Accessed: 10
June 2011)
80
Infoplease (n.d.) Netherlands [Online]. Available from:
http://www.infoplease.com/ipa/A0107824.html?pageno=1 (Accessed: 5 July 2011)
Jameson, A. (n.d.) A short history of Holland, Belgium and Luxemburg [Online]. Available from:
http://aero-comlab.stanford.edu/jameson/world_history/A_Short_History_of_Holland.pdf
(Accessed: 5 July 2011)
Ketelaar, P. (2006) Your neighbor as an advertising model [Online]. Available from:
http://www.kennislink.nl/publicaties/de-buurvrouw-als-reclamemodel (Accessed: 28 June 2011)
Knaggs, H. (2009) “A new source of aging?” Journal of Cosmetic Dermatology 8, pp. 77-82
Krolikowska, E. & Kuenzel, S. (2008) “Models of advertising standardization and adaptation: it’s
time to move the debate forward”, The Marketing Review, 8 (4), pp. 383-394
Krolikowska, E. & Kuenzel, S. (2008) “Models of advertising standardization and adaptation: it’s
time to move the debate forward”, The Marketing Review, 8 (4), pp. 383-394
Kuprina, N. (2009) Advertisers in Russia are used to see the consumers like vegetables [Online].
Available at: http://www.adme.ru/interview/reklamodateli-privykli-schitat-potrebitelya-ovoschem-
iq-marketing-67151/ (Accessed: 26 June 2011)
Leo C., Bennett, R. & Hartel, C.E. J. (2005) “Cross-cultural differences in consumer decision-
making styles”, Cross Cultural Management, 12 (3), pp. 32-62
81
Mead, R. & Andrews, T. (2009) International Management. 4th ed. Chichester, England: John
Wiley & Sons
Media Awareness Network (n.d.) Dove’s Campaign for Real beauty [Online]. Available from:
http://www.media-
awareness.ca/english/resources/educational/teachable_moments/campaignrealbeauty.cfm
(Accessed: 2 July 2011)
Medina, J.F. & Duffy, M.F. (1998) "Standardization vs globalization: a new perspective of brand
strategies", Journal of Product & Brand Management, 7 (3), pp. 223 – 243
Mooij de, M. (2010) Global marketing and advertising: understanding cultural paradoxes. 3rd ed.
California: SAGE Publications, Inc
Mooij, M. & G. Hofstede, G. (2010) “The Hofstede model. Applications to global branding and
advertising strategy and research”, International Journal of Advertising, 29 (1), pp. 85-110
Oosthuizen, T. (2004) “In Marketing Across Cultures: Are you enlightening the World or are you
speaking in tongues?”, Design Issues, 20 (2), pp. 61–72
Peter, J.P., Olson, J.C. (2010) Consumer behavior & Marketing strategy. McGraw-Hill/Irwin
Puffer, S.P, & Shekshnia, S.V. (1996) “The fit between Russian Culture and compensation”, The
International Executive, 38 (2), pp. 217-24
82
Renfrow, J. (2008) I'll Have What She's Having, Response Magazine [Online]. Available from:
http://www.responsemagazine.com/response-magazine/i039ll-have-what-she039s-having-1176
(Accessed: 23 June 2011)
Rhystory (n.d.) “Cancelling of the selfdom” [Online]. Available from:
http://www.rhistory.ru/Reformyzem.html (Accessed: 5 July 2011)
Samiee, S., Jeong, I., Pae, J.H. & Tai, S. (2001) “Advertising standardization in multinational
corporations”, Journal of Business Research, 56, pp. 613-626
Salmi, A. & Sharafutdinova, E. (2008) “Culture and design in emerging markets: the case of
mobile phones in Russia”, Journal of Business & Industrial Marketing, 23(6), pp. 384-394
Sharma, P., Sivakumaran, B. & Marshall, R. (2010) “Exploring impulse buying and variety
seeking by retail shoppers: towards a common conceptual framework”, Journal of Marketing
Management, 26 (5-6), pp. 473-494
Soares, A.M., Farhangmehr, M. & Shoham, A. (2006) “Hofstede’s dimensions of culture in
international marketing studies”, Journal of Business Research, 60, pp. 277-284
Solberg, C.A. (2002) “The Perennial Issue of Adaptation or Standardization of International
Marketing Communication: Organizational Contingencies and Performance”, Journal of
International Marketing, 10 (3), pp. 1-21
83
Um, N.H. (2008) “Revisit Elaboration Likelihood Model: How Advertising Appeals Work on
Attitudinal and Behavioral Brand Loyalty Centering Around Low vs. High-Involvement Product”,
European Journal of Social Sciences, 7 (1)
Vocht de, A. (2011) Basic handbook SPSS 19, Bijleveld Press: Utrecht
Vul’fson, B.L. (2010) “Russia and Europe – The Fundamental Problem of Courses in the History
of Russia”, Russian Social Science Review, 51(6), pp. 4–18
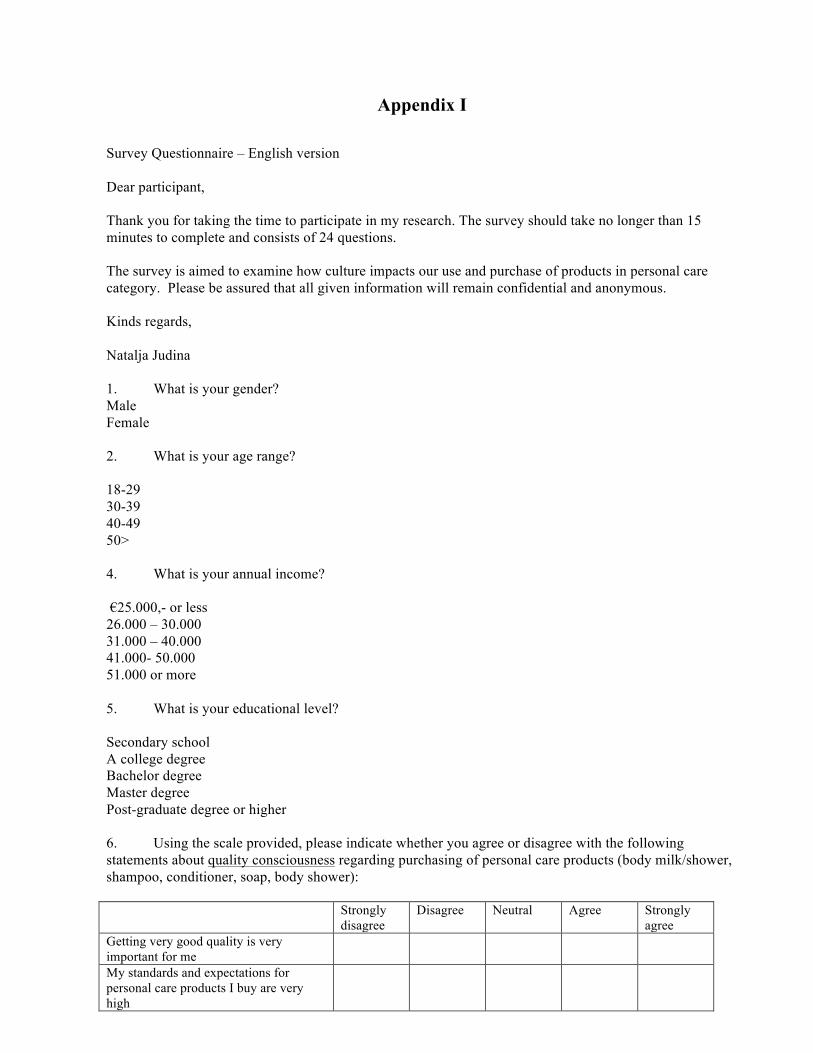
84
Appendix I Survey Questionnaire – English version Dear participant, Thank you for taking the time to participate in my research. The survey should take no longer than 15 minutes to complete and consists of 24 questions. The survey is aimed to examine how culture impacts our use and purchase of products in personal care category. Please be assured that all given information will remain confidential and anonymous. Kinds regards, Natalja Judina 1. What is your gender? Male Female 2. What is your age range? 18-29 30-39 40-49 50> 4. What is your annual income? €25.000,- or less 26.000 – 30.000 31.000 – 40.000 41.000- 50.000 51.000 or more 5. What is your educational level? Secondary school A college degree Bachelor degree Master degree Post-graduate degree or higher 6. Using the scale provided, please indicate whether you agree or disagree with the following statements about quality consciousness regarding purchasing of personal care products (body milk/shower, shampoo, conditioner, soap, body shower): Strongly
disagree Disagree Neutral Agree Strongly
agree Getting very good quality is very important for me
My standards and expectations for personal care products I buy are very high
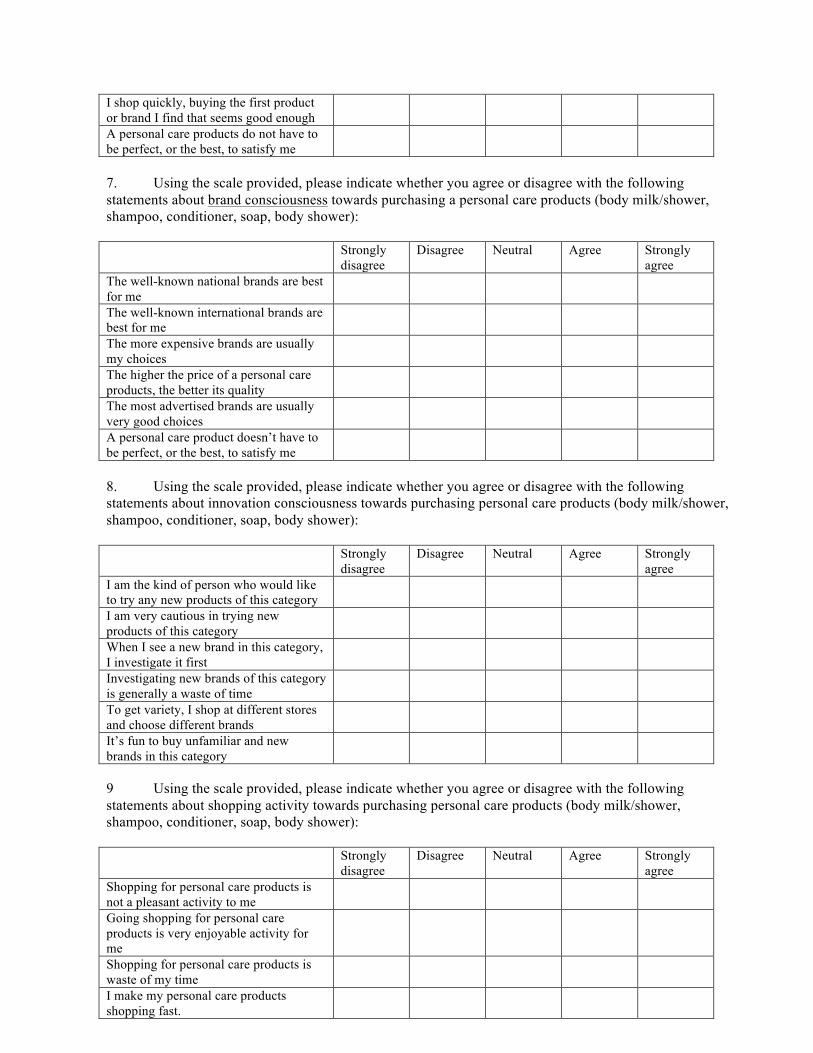
85
I shop quickly, buying the first product or brand I find that seems good enough
A personal care products do not have to be perfect, or the best, to satisfy me
7. Using the scale provided, please indicate whether you agree or disagree with the following statements about brand consciousness towards purchasing a personal care products (body milk/shower, shampoo, conditioner, soap, body shower): Strongly
disagree Disagree Neutral Agree Strongly
agree The well-known national brands are best for me
The well-known international brands are best for me
The more expensive brands are usually my choices
The higher the price of a personal care products, the better its quality
The most advertised brands are usually very good choices
A personal care product doesn’t have to be perfect, or the best, to satisfy me
8. Using the scale provided, please indicate whether you agree or disagree with the following statements about innovation consciousness towards purchasing personal care products (body milk/shower, shampoo, conditioner, soap, body shower): Strongly
disagree Disagree Neutral Agree Strongly
agree I am the kind of person who would like to try any new products of this category
I am very cautious in trying new products of this category
When I see a new brand in this category, I investigate it first
Investigating new brands of this category is generally a waste of time
To get variety, I shop at different stores and choose different brands
It’s fun to buy unfamiliar and new brands in this category
9 Using the scale provided, please indicate whether you agree or disagree with the following statements about shopping activity towards purchasing personal care products (body milk/shower, shampoo, conditioner, soap, body shower): Strongly
disagree Disagree Neutral Agree Strongly
agree Shopping for personal care products is not a pleasant activity to me
Going shopping for personal care products is very enjoyable activity for me
Shopping for personal care products is waste of my time
I make my personal care products shopping fast.
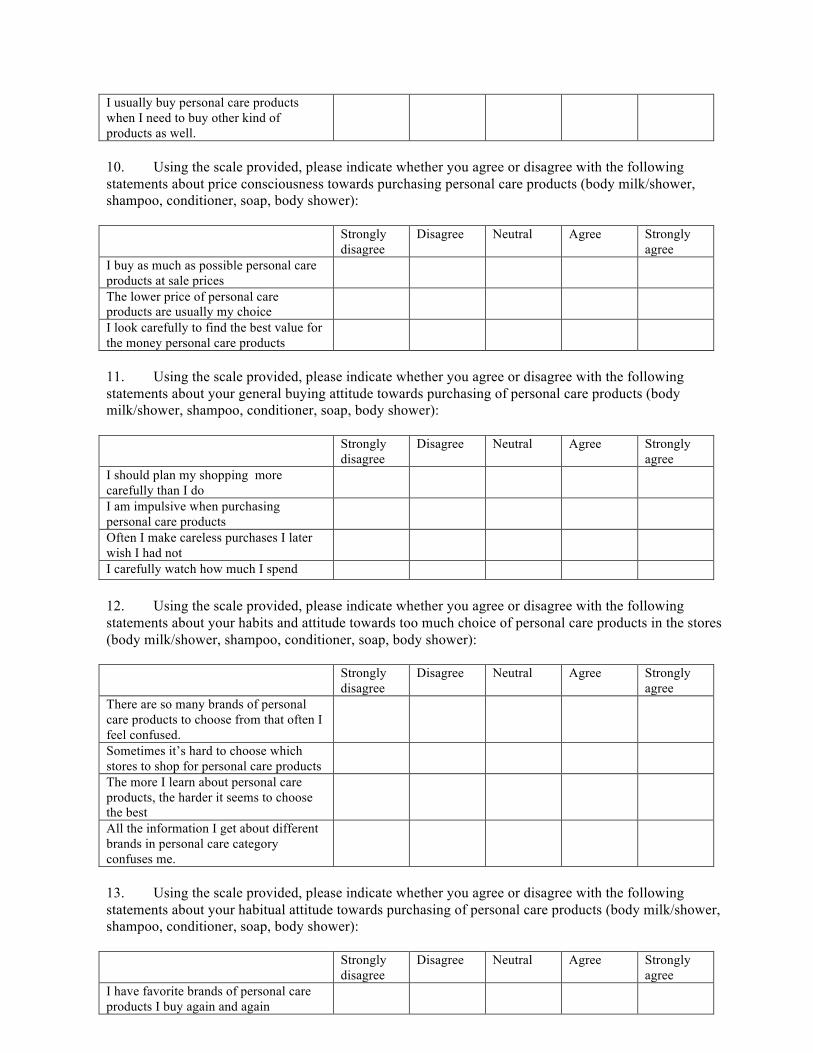
86
I usually buy personal care products when I need to buy other kind of products as well.
10. Using the scale provided, please indicate whether you agree or disagree with the following statements about price consciousness towards purchasing personal care products (body milk/shower, shampoo, conditioner, soap, body shower): Strongly
disagree Disagree Neutral Agree Strongly
agree I buy as much as possible personal care products at sale prices
The lower price of personal care products are usually my choice
I look carefully to find the best value for the money personal care products
11. Using the scale provided, please indicate whether you agree or disagree with the following statements about your general buying attitude towards purchasing of personal care products (body milk/shower, shampoo, conditioner, soap, body shower): Strongly
disagree Disagree Neutral Agree Strongly
agree I should plan my shopping more carefully than I do
I am impulsive when purchasing personal care products
Often I make careless purchases I later wish I had not
I carefully watch how much I spend 12. Using the scale provided, please indicate whether you agree or disagree with the following statements about your habits and attitude towards too much choice of personal care products in the stores (body milk/shower, shampoo, conditioner, soap, body shower): Strongly
disagree Disagree Neutral Agree Strongly
agree There are so many brands of personal care products to choose from that often I feel confused.
Sometimes it’s hard to choose which stores to shop for personal care products
The more I learn about personal care products, the harder it seems to choose the best
All the information I get about different brands in personal care category confuses me.
13. Using the scale provided, please indicate whether you agree or disagree with the following statements about your habitual attitude towards purchasing of personal care products (body milk/shower, shampoo, conditioner, soap, body shower): Strongly
disagree Disagree Neutral Agree Strongly
agree I have favorite brands of personal care products I buy again and again
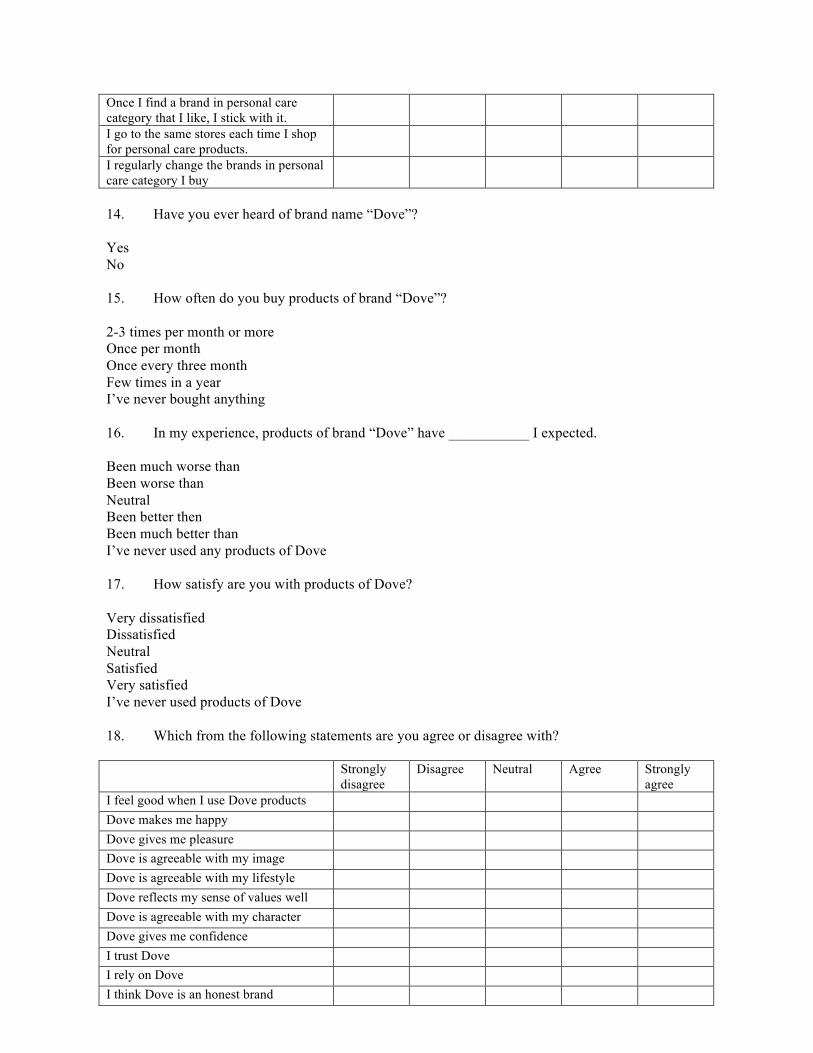
87
Once I find a brand in personal care category that I like, I stick with it.
I go to the same stores each time I shop for personal care products.
I regularly change the brands in personal care category I buy
14. Have you ever heard of brand name “Dove”? Yes No 15. How often do you buy products of brand “Dove”? 2-3 times per month or more Once per month Once every three month Few times in a year I’ve never bought anything 16. In my experience, products of brand “Dove” have ___________ I expected. Been much worse than Been worse than Neutral Been better then Been much better than I’ve never used any products of Dove 17. How satisfy are you with products of Dove? Very dissatisfied Dissatisfied Neutral Satisfied Very satisfied I’ve never used products of Dove 18. Which from the following statements are you agree or disagree with? Strongly
disagree Disagree Neutral Agree Strongly
agree I feel good when I use Dove products Dove makes me happy Dove gives me pleasure Dove is agreeable with my image Dove is agreeable with my lifestyle Dove reflects my sense of values well Dove is agreeable with my character Dove gives me confidence I trust Dove I rely on Dove I think Dove is an honest brand
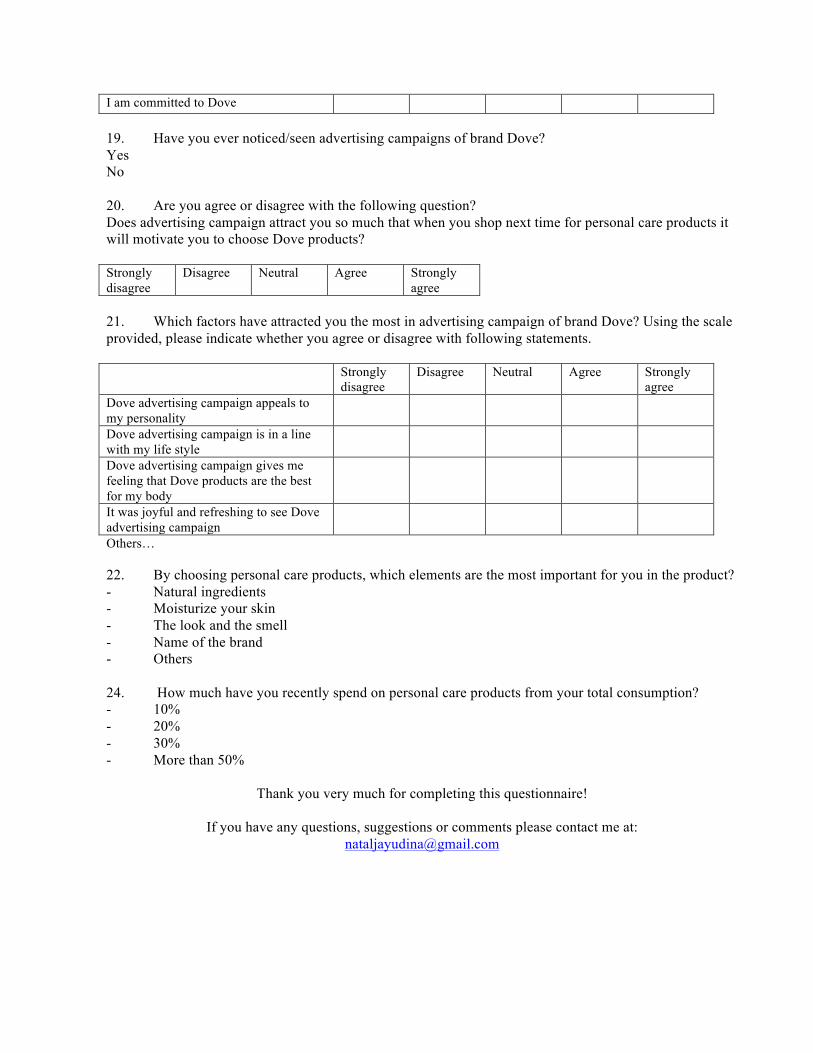
88
I am committed to Dove 19. Have you ever noticed/seen advertising campaigns of brand Dove? Yes No 20. Are you agree or disagree with the following question? Does advertising campaign attract you so much that when you shop next time for personal care products it will motivate you to choose Dove products? Strongly disagree
Disagree Neutral Agree Strongly agree
21. Which factors have attracted you the most in advertising campaign of brand Dove? Using the scale provided, please indicate whether you agree or disagree with following statements. Strongly
disagree Disagree Neutral Agree Strongly
agree Dove advertising campaign appeals to my personality
Dove advertising campaign is in a line with my life style
Dove advertising campaign gives me feeling that Dove products are the best for my body
It was joyful and refreshing to see Dove advertising campaign
Others… 22. By choosing personal care products, which elements are the most important for you in the product? - Natural ingredients - Moisturize your skin - The look and the smell - Name of the brand - Others 24. How much have you recently spend on personal care products from your total consumption? - 10% - 20% - 30% - More than 50%
Thank you very much for completing this questionnaire!
If you have any questions, suggestions or comments please contact me at: [email protected]
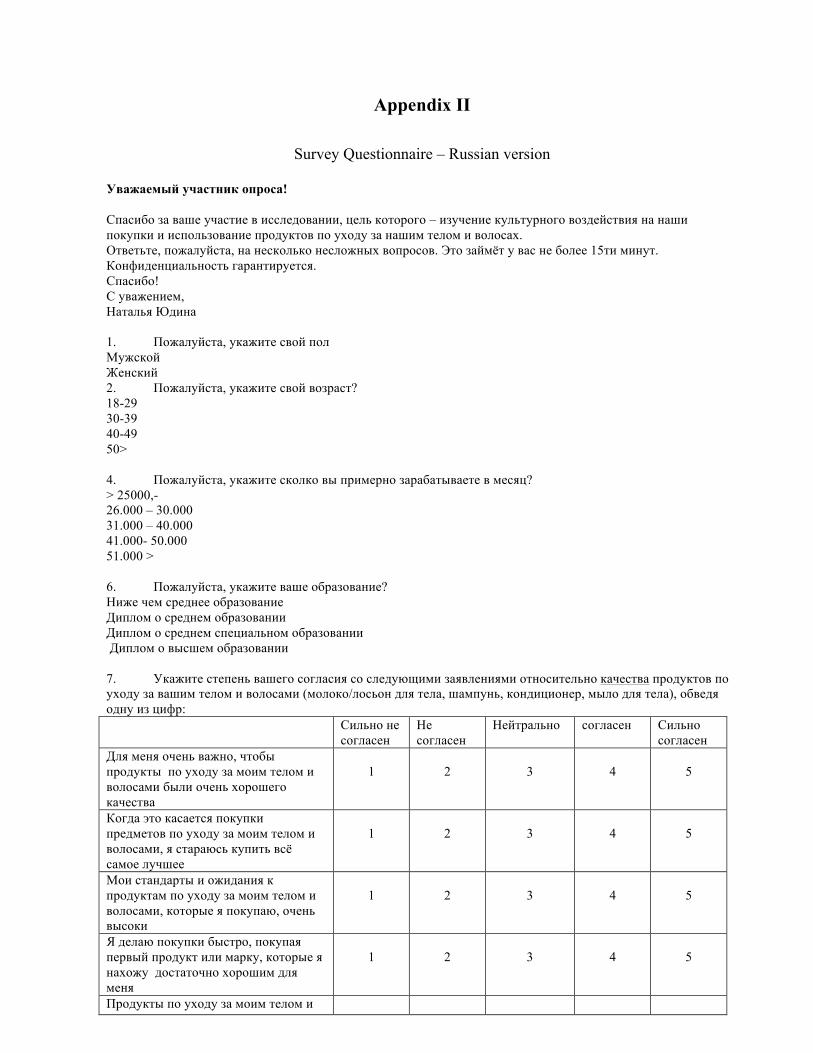
89
Appendix II
Survey Questionnaire – Russian version Уважаемый участник опроса! Спасибо за ваше участие в исследовании, цель которого – изучение культурного воздействия на наши покупки и использование продуктов по уходу за нашим телом и волосах. Ответьте, пожалуйста, на несколько несложных вопросов. Это займёт у вас не более 15ти минут. Конфиденциальность гарантируется. Спасибо! С уважением, Наталья Юдина 1. Пожалуйста, укажите свой пол Мужской Женский 2. Пожалуйста, укажите свой возраст? 18-29 30-39 40-49 50> 4. Пожалуйста, укажите сколко вы примерно зарабатываете в месяц? > 25000,- 26.000 – 30.000 31.000 – 40.000 41.000- 50.000 51.000 > 6. Пожалуйста, укажите ваше образование? Ниже чем среднее образование Диплом о среднем образовании Диплом о среднем специальном образовании Диплом о высшем образовании 7. Укажите степень вашего согласия со следующими заявлениями относительно качества продуктов по уходу за вашим телом и волосами (молоко/лосьон для тела, шампунь, кондиционер, мыло для тела), обведя одну из цифр: Сильно не
согласен Не согласен
Нейтрально согласен Сильно согласен
Для меня очень важно, чтобы продукты по уходу за моим телом и волосами были очень хорошего качества
1
2
3
4
5
Когда это касается покупки предметов по уходу за моим телом и волосами, я стараюсь купить всё самое лучшее
1
2
3
4
5
Мои стандарты и ожидания к продуктам по уходу за моим телом и волосами, которые я покупаю, очень высоки
1
2
3
4
5
Я делаю покупки быстро, покупая первый продукт или марку, которые я нахожу достаточно хорошим для меня
1
2
3
4
5
Продукты по уходу за моим телом и
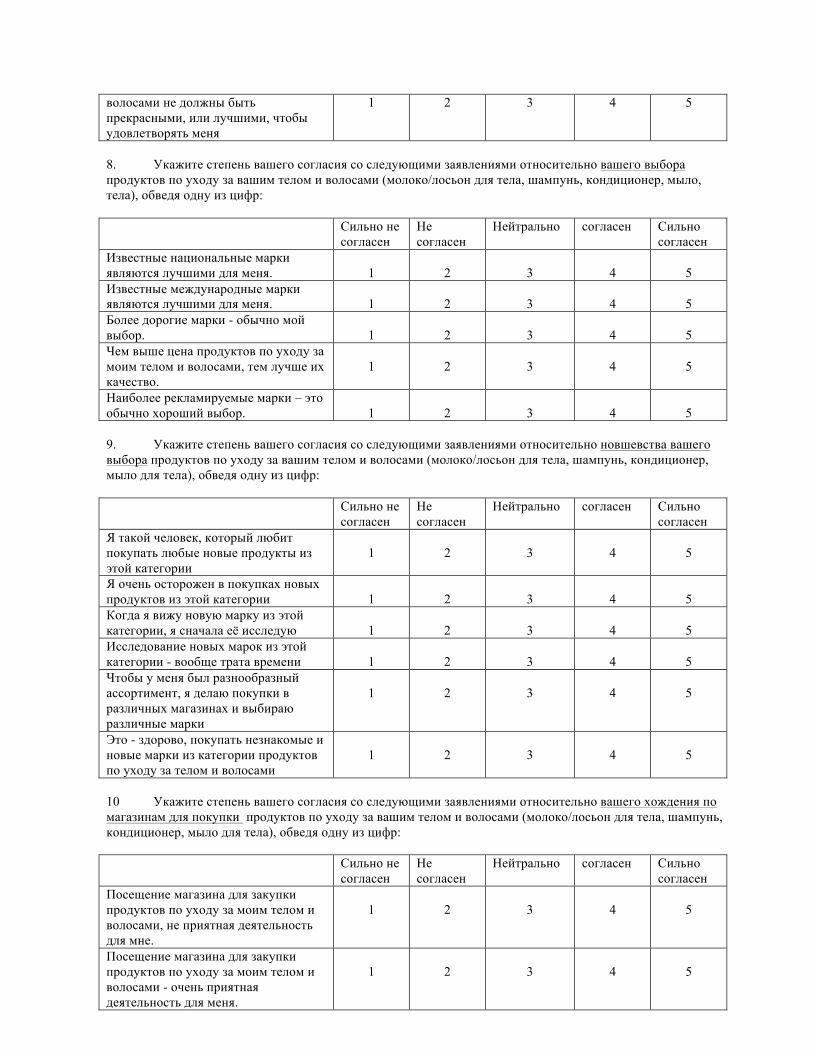
90
волосами не должны быть прекрасными, или лучшими, чтобы удовлетворять меня
1 2 3 4 5
8. Укажите степень вашего согласия со следующими заявлениями относительно вашего выбора продуктов по уходу за вашим телом и волосами (молоко/лосьон для тела, шампунь, кондиционер, мыло, тела), обведя одну из цифр: Сильно не
согласен Не согласен
Нейтрально согласен Сильно согласен
Известные национальные марки являются лучшими для меня.
1
2
3
4
5
Известные международные марки являются лучшими для меня.
1
2
3
4
5
Более дорогие марки - обычно мой выбор.
1
2
3
4
5
Чем выше цена продуктов по уходу за моим телом и волосами, тем лучше их качество.
1
2
3
4
5
Наиболее рекламируемые марки – это обычно хороший выбор.
1
2
3
4
5
9. Укажите степень вашего согласия со следующими заявлениями относительно новшевства вашего выбора продуктов по уходу за вашим телом и волосами (молоко/лосьон для тела, шампунь, кондиционер, мыло для тела), обведя одну из цифр: Сильно не
согласен Не согласен
Нейтрально согласен Сильно согласен
Я такой человек, который любит покупать любые новые продукты из этой категории
1
2
3
4
5
Я очень осторожен в покупках новых продуктов из этой категории
1
2
3
4
5
Когда я вижу новую марку из этой категории, я сначала её исследую
1
2
3
4
5
Исследование новых марок из этой категории - вообще трата времени
1
2
3
4
5
Чтобы у меня был разнообразный ассортимент, я делаю покупки в различных магазинах и выбираю различные марки
1
2
3
4
5
Это - здорово, покупать незнакомые и новые марки из категории продуктов по уходу за телом и волосами
1
2
3
4
5
10 Укажите степень вашего согласия со следующими заявлениями относительно вашего хождения по магазинам для покупки продуктов по уходу за вашим телом и волосами (молоко/лосьон для тела, шампунь, кондиционер, мыло для тела), обведя одну из цифр: Сильно не
согласен Не согласен
Нейтрально согласен Сильно согласен
Посещение магазина для закупки продуктов по уходу за моим телом и волосами, не приятная деятельность для мне.
1
2
3
4
5
Посещение магазина для закупки продуктов по уходу за моим телом и волосами - очень приятная деятельность для меня.
1
2
3
4
5
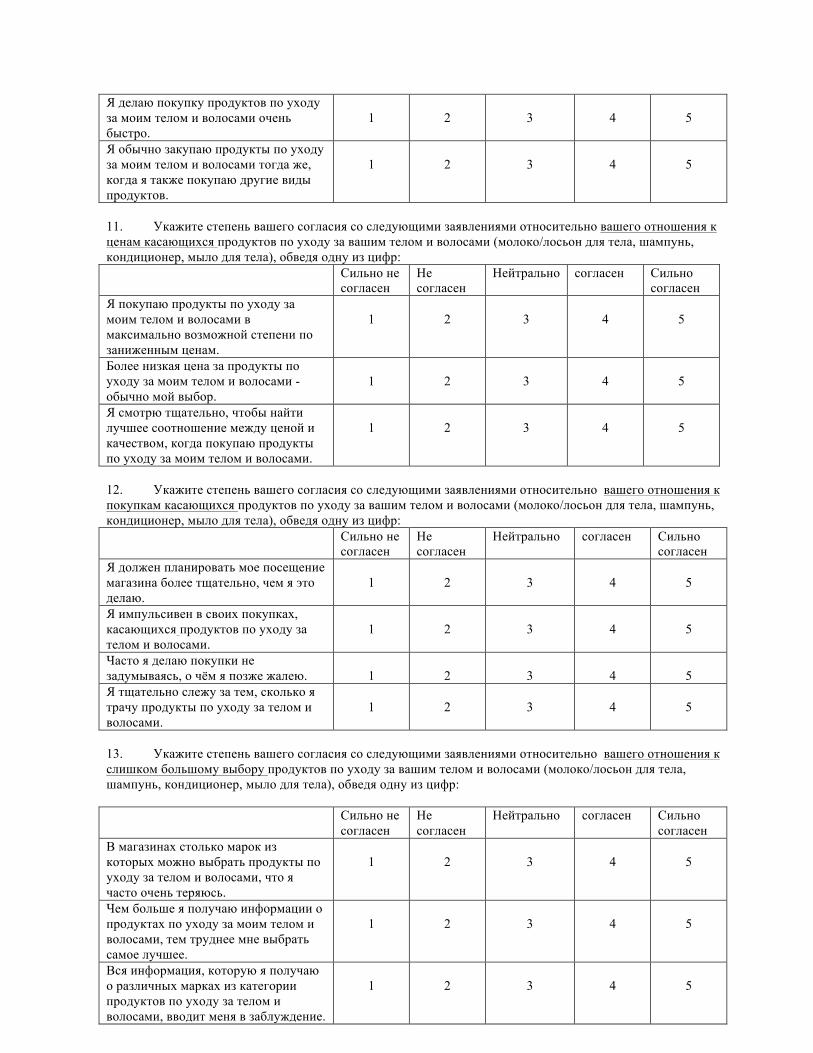
91
Я делаю покупку продуктов по уходу за моим телом и волосами очень быстро.
1
2
3
4
5
Я обычно закупаю продукты по уходу за моим телом и волосами тогда же, когда я также покупаю другие виды продуктов.
1
2
3
4
5
11. Укажите степень вашего согласия со следующими заявлениями относительно вашего отношения к ценам касающихся продуктов по уходу за вашим телом и волосами (молоко/лосьон для тела, шампунь, кондиционер, мыло для тела), обведя одну из цифр: Сильно не
согласен Не согласен
Нейтрально согласен Сильно согласен
Я покупаю продукты по уходу за моим телом и волосами в максимально возможной степени по заниженным ценам.
1
2
3
4
5
Более низкая цена за продукты по уходу за моим телом и волосами - обычно мой выбор.
1
2
3
4
5
Я смотрю тщательно, чтобы найти лучшее соотношение между ценой и качеством, когда покупаю продукты по уходу за моим телом и волосами.
1
2
3
4
5
12. Укажите степень вашего согласия со следующими заявлениями относительно вашего отношения к покупкам касающихся продуктов по уходу за вашим телом и волосами (молоко/лосьон для тела, шампунь, кондиционер, мыло для тела), обведя одну из цифр: Сильно не
согласен Не согласен
Нейтрально согласен Сильно согласен
Я должен планировать мое посещение магазина более тщательно, чем я это делаю.
1
2
3
4
5
Я импульсивен в своих покупках, касающихся продуктов по уходу за телом и волосами.
1
2
3
4
5
Часто я делаю покупки не задумываясь, о чём я позже жалею.
1
2
3
4
5
Я тщательно слежу за тем, сколько я трачу продукты по уходу за телом и волосами.
1
2
3
4
5
13. Укажите степень вашего согласия со следующими заявлениями относительно вашего отношения к слишком большому выбору продуктов по уходу за вашим телом и волосами (молоко/лосьон для тела, шампунь, кондиционер, мыло для тела), обведя одну из цифр: Сильно не
согласен Не согласен
Нейтрально согласен Сильно согласен
В магазинах столько марок из которых можно выбрать продукты по уходу за телом и волосами, что я часто очень теряюсь.
1
2
3
4
5
Чем больше я получаю информации о продуктах по уходу за моим телом и волосами, тем труднее мне выбрать самое лучшее.
1
2
3
4
5
Вся информация, которую я получаю о различных марках из категории продуктов по уходу за телом и волосами, вводит меня в заблуждение.
1
2
3
4
5
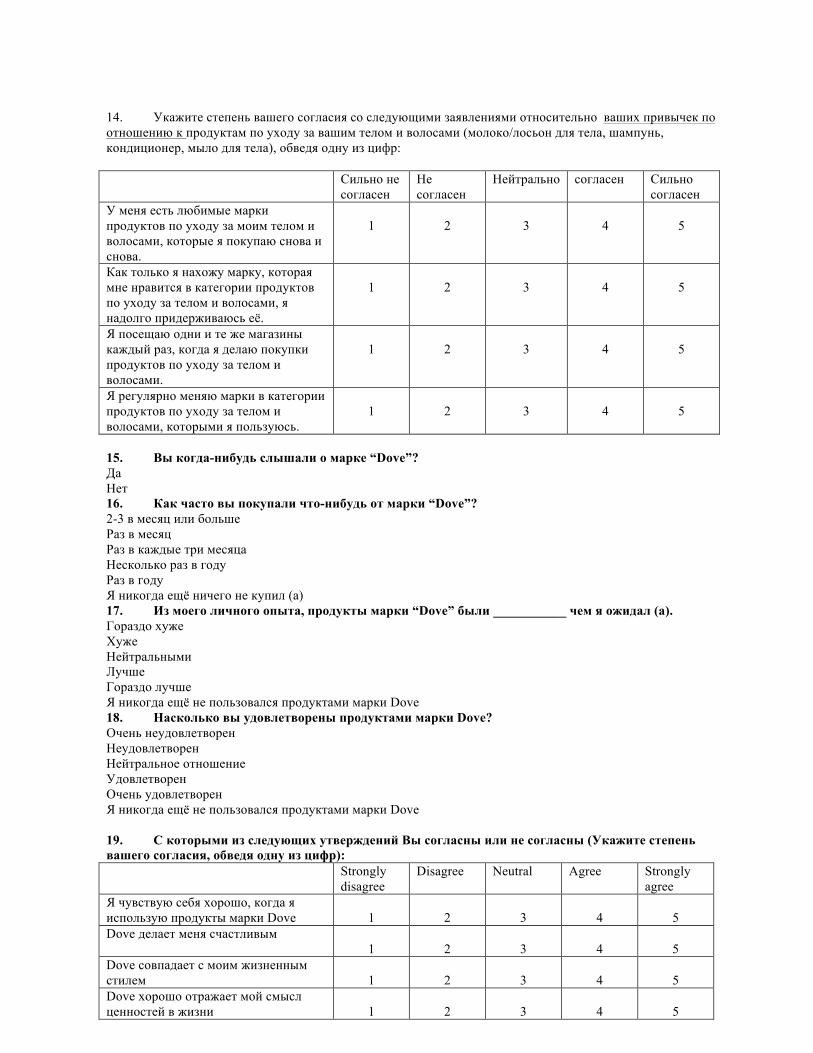
92
14. Укажите степень вашего согласия со следующими заявлениями относительно ваших привычек по отношению к продуктам по уходу за вашим телом и волосами (молоко/лосьон для тела, шампунь, кондиционер, мыло для тела), обведя одну из цифр: Сильно не
согласен Не согласен
Нейтрально согласен Сильно согласен
У меня есть любимые марки продуктов по уходу за моим телом и волосами, которые я покупаю снова и снова.
1
2
3
4
5
Как только я нахожу марку, которая мне нравится в категории продуктов по уходу за телом и волосами, я надолго придерживаюсь её.
1
2
3
4
5
Я посещаю одни и те же магазины каждый раз, когда я делаю покупки продуктов по уходу за телом и волосами.
1
2
3
4
5
Я регулярно меняю марки в категории продуктов по уходу за телом и волосами, которыми я пользуюсь.
1
2
3
4
5
15. Вы когда-нибудь слышали о маркe “Dove”? Да Нет 16. Как часто вы покупали что-нибудь от марки “Dove”? 2-3 в месяц или больше Раз в месяц Раз в каждые три месяца Несколько раз в году Раз в году Я никогда ещё ничего не купил (а) 17. Из моего личного опыта, продукты марки “Dove” были ___________ чем я ожидал (а). Гораздо хуже Хуже Нейтральными Лучше Гораздо лучше Я никогда ещё не пользовался продуктами марки Dove 18. Насколько вы удовлетворены продуктами марки Dove? Очень неудовлетворен Неудовлетворен Нейтральное отношение Удовлетворен Очень удовлетворен Я никогда ещё не пользовался продуктами марки Dove 19. С которыми из следующих утверждений Вы согласны или не согласны (Укажите степень вашего согласия, обведя одну из цифр): Strongly
disagree Disagree Neutral Agree Strongly
agree Я чувствую себя хорошо, когда я использую продукты марки Dove
1
2
3
4
5
Dove делает меня счастливым 1
2
3
4
5
Dove совпадает с моим жизненным стилем
1
2
3
4
5
Dove хорошо отражает мой смысл ценностей в жизни
1
2
3
4
5
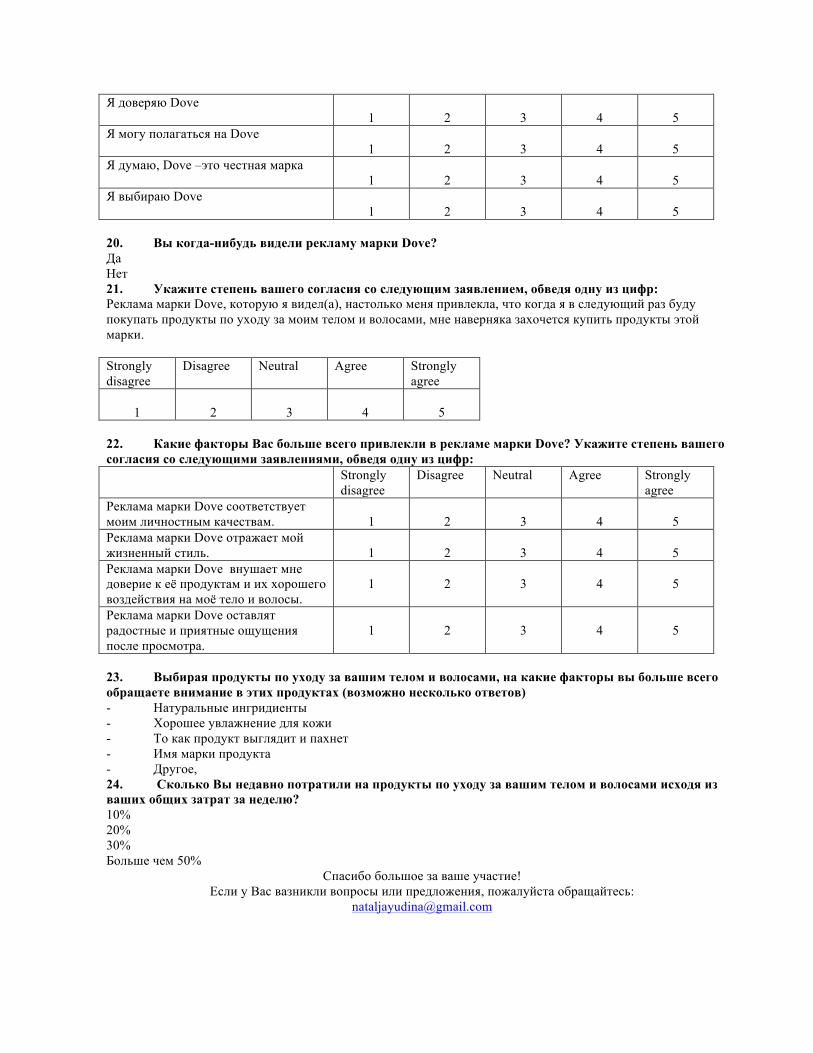
93
Я доверяю Dove 1
2
3
4
5
Я могу полагаться на Dove 1
2
3
4
5
Я думаю, Dove –это честная марка 1
2
3
4
5
Я выбираю Dove 1
2
3
4
5
20. Вы когда-нибудь видели рекламу марки Dove? Да Нет 21. Укажите степень вашего согласия со следующим заявлением, обведя одну из цифр: Реклама марки Dove, которую я видел(а), настолько меня привлекла, что когда я в следующий раз буду покупать продукты по уходу за моим телом и волосами, мне наверняка захочется купить продукты этой марки. Strongly disagree
Disagree Neutral Agree Strongly agree
1
2
3
4
5
22. Какие факторы Вас больше всего привлекли в рекламе марки Dove? Укажите степень вашего согласия со следующими заявлениями, обведя одну из цифр: Strongly
disagree Disagree Neutral Agree Strongly
agree Реклама марки Dove соответствует моим личностным качествам.
1
2
3
4
5
Реклама марки Dove отражает мой жизненный стиль.
1
2
3
4
5
Реклама марки Dove внушает мне доверие к её продуктам и их хорошего воздействия на моё тело и волосы.
1
2
3
4
5
Реклама марки Dove оставлят радостные и приятные ощущения после просмотра.
1
2
3
4
5
23. Выбирая продукты по уходу за вашим телом и волосами, на какие факторы вы больше всего обращаете внимание в этих продуктах (возможно несколько ответов) - Натуральные ингридиенты - Хорошее увлажнение для кожи - То как продукт выглядит и пахнет - Имя марки продукта - Другое, 24. Сколько Вы недавно потратили на продукты по уходу за вашим телом и волосами исходя из ваших общих затрат за неделю? 10% 20% 30% Больше чем 50%
Спасибо большое за ваше участие! Если у Вас вазникли вопросы или предложения, пожалуйста обращайтесь:
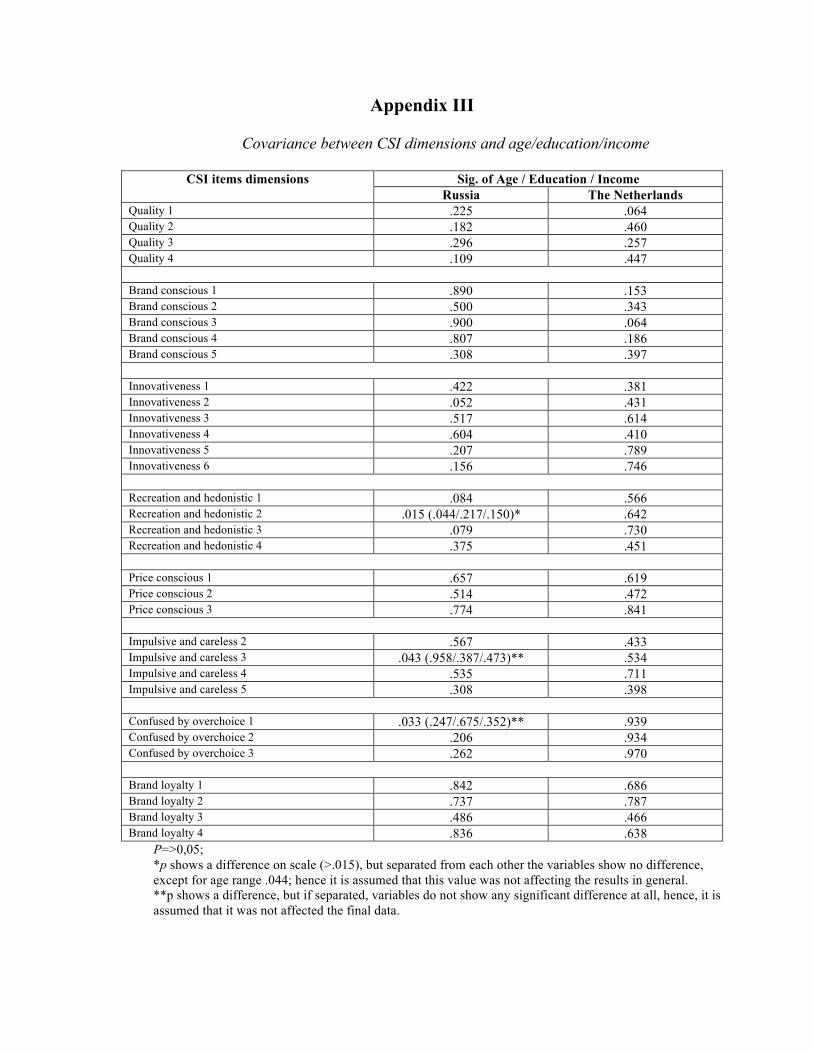
94
Appendix III
Covariance between CSI dimensions and age/education/income
CSI items dimensions Sig. of Age / Education / Income Russia The Netherlands
Quality 1 .225 .064 Quality 2 .182 .460 Quality 3 .296 .257 Quality 4 .109 .447
Brand conscious 1 .890 .153 Brand conscious 2 .500 .343 Brand conscious 3 .900 .064 Brand conscious 4 .807 .186 Brand conscious 5 .308 .397
Innovativeness 1 .422 .381 Innovativeness 2 .052 .431 Innovativeness 3 .517 .614 Innovativeness 4 .604 .410 Innovativeness 5 .207 .789 Innovativeness 6 .156 .746
Recreation and hedonistic 1 .084 .566 Recreation and hedonistic 2 .015 (.044/.217/.150)* .642 Recreation and hedonistic 3 .079 .730 Recreation and hedonistic 4 .375 .451
Price conscious 1 .657 .619 Price conscious 2 .514 .472 Price conscious 3 .774 .841
Impulsive and careless 2 .567 .433 Impulsive and careless 3 .043 (.958/.387/.473)** .534 Impulsive and careless 4 .535 .711 Impulsive and careless 5 .308 .398
Confused by overchoice 1 .033 (.247/.675/.352)** .939 Confused by overchoice 2 .206 .934 Confused by overchoice 3 .262 .970
Brand loyalty 1 .842 .686 Brand loyalty 2 .737 .787 Brand loyalty 3 .486 .466 Brand loyalty 4 .836 .638
P=>0,05; *p shows a difference on scale (>.015), but separated from each other the variables show no difference, except for age range .044; hence it is assumed that this value was not affecting the results in general. **p shows a difference, but if separated, variables do not show any significant difference at all, hence, it is assumed that it was not affected the final data.
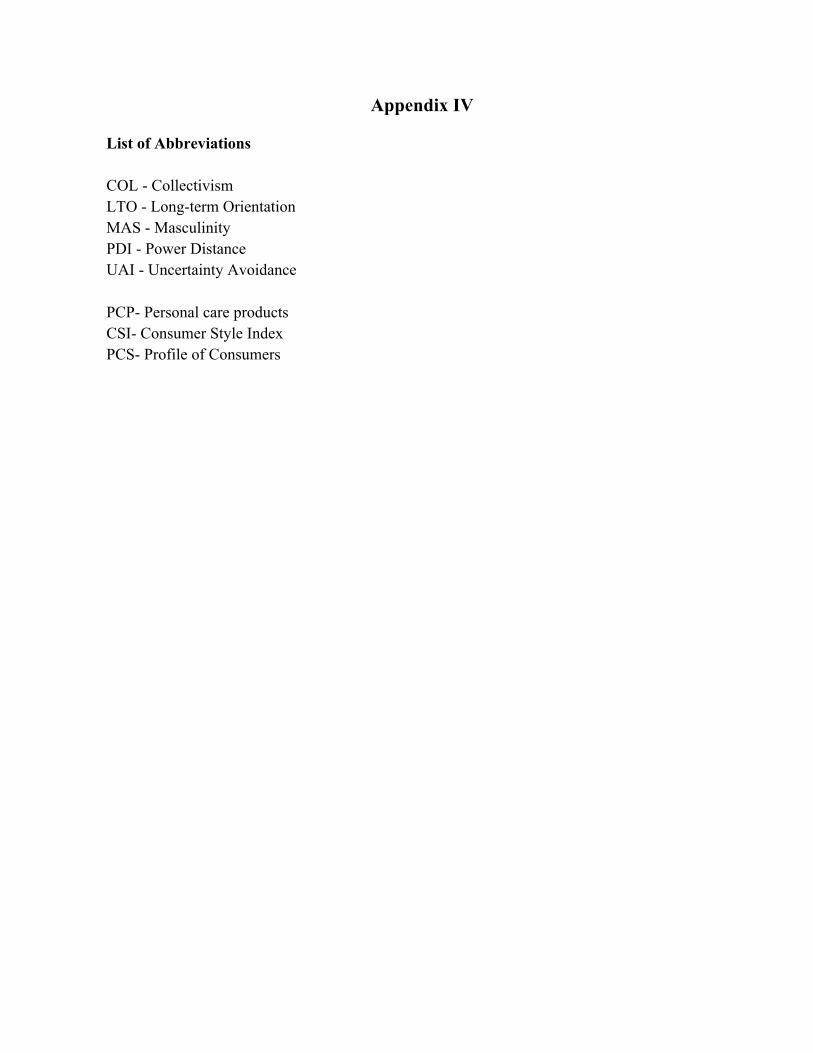
95
Appendix IV
List of Abbreviations COL - Collectivism LTO - Long-term Orientation MAS - Masculinity PDI - Power Distance UAI - Uncertainty Avoidance PCP- Personal care products CSI- Consumer Style Index PCS- Profile of Consumers