Embed Size (px)
Citation preview
Price Comparison Sites
in Indonesia 2014
Omnibus Popular Brand Index
Date: November 2014
2
A. Detail findings
1. Popular Brand Index
2. Brand awareness
3. Expansive
4. Frequent User
5. Future Intention
6. Switching
7. General Information
3
A. Detail findings
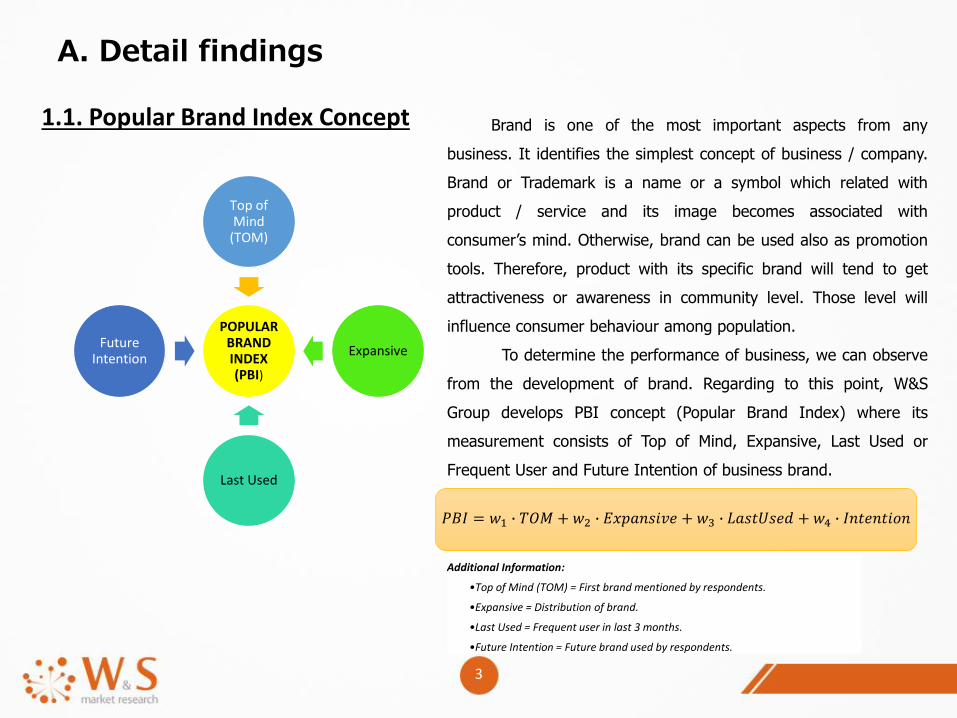
1.1. Popular Brand Index Concept
POPULAR BRAND INDEX (PBI)
Top of Mind
(TOM)
Expansive
Last Used
Future Intention
𝑃𝐵𝐼 = 𝑤1 ∙ 𝑇𝑂𝑀 + 𝑤2 ∙ 𝐸𝑥𝑝𝑎𝑛𝑠𝑖𝑣𝑒 + 𝑤3 ∙ 𝐿𝑎𝑠𝑡𝑈𝑠𝑒𝑑 + 𝑤4 ∙ 𝐼𝑛𝑡𝑒𝑛𝑡𝑖𝑜𝑛
Additional Information:
• Top of Mind (TOM) = First brand mentioned by respondents.
• Expansive = Distribution of brand.
• Last Used = Frequent user in last 3 months.
• Future Intention = Future brand used by respondents.
Brand is one of the most important aspects from any
business. It identifies the simplest concept of business / company.
Brand or Trademark is a name or a symbol which related with
product / service and its image becomes associated with
consumer’s mind. Otherwise, brand can be used also as promotion
tools. Therefore, product with its specific brand will tend to get
attractiveness or awareness in community level. Those level will
influence consumer behaviour among population.
To determine the performance of business, we can observe
from the development of brand. Regarding to this point, W&S
Group develops PBI concept (Popular Brand Index) where its
measurement consists of Top of Mind, Expansive, Last Used or
Frequent User and Future Intention of business brand.
4
A. Detail findings
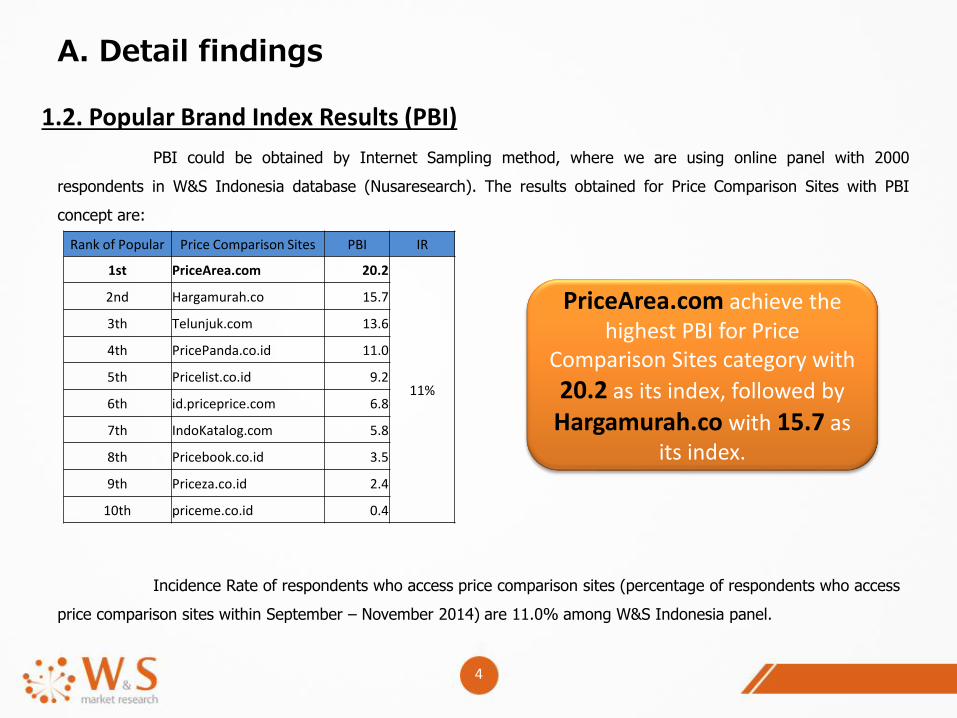
1.2. Popular Brand Index Results (PBI)
PBI could be obtained by Internet Sampling method, where we are using online panel with 2000
respondents in W&S Indonesia database (Nusaresearch). The results obtained for Price Comparison Sites with PBI
concept are:
Incidence Rate of respondents who access price comparison sites (percentage of respondents who access
price comparison sites within September – November 2014) are 11.0% among W&S Indonesia panel.
PriceArea.com achieve the highest PBI for Price
Comparison Sites category with
20.2 as its index, followed by
Hargamurah.co with 15.7 as its index.
Rank of Popular Price Comparison Sites PBI IR
1st PriceArea.com 20.2
11%
2nd Hargamurah.co 15.7
3th Telunjuk.com 13.6
4th PricePanda.co.id 11.0
5th Pricelist.co.id 9.2
6th id.priceprice.com 6.8
7th IndoKatalog.com 5.8
8th Pricebook.co.id 3.5
9th Priceza.co.id 2.4
10th priceme.co.id 0.4
5
A. Detail findings
1. Popular Brand Index
2. Brand Awareness
3. Expansive
4. Frequent User
5. Future Intention
6. Switching
7. General Information
6
A. Detail findings
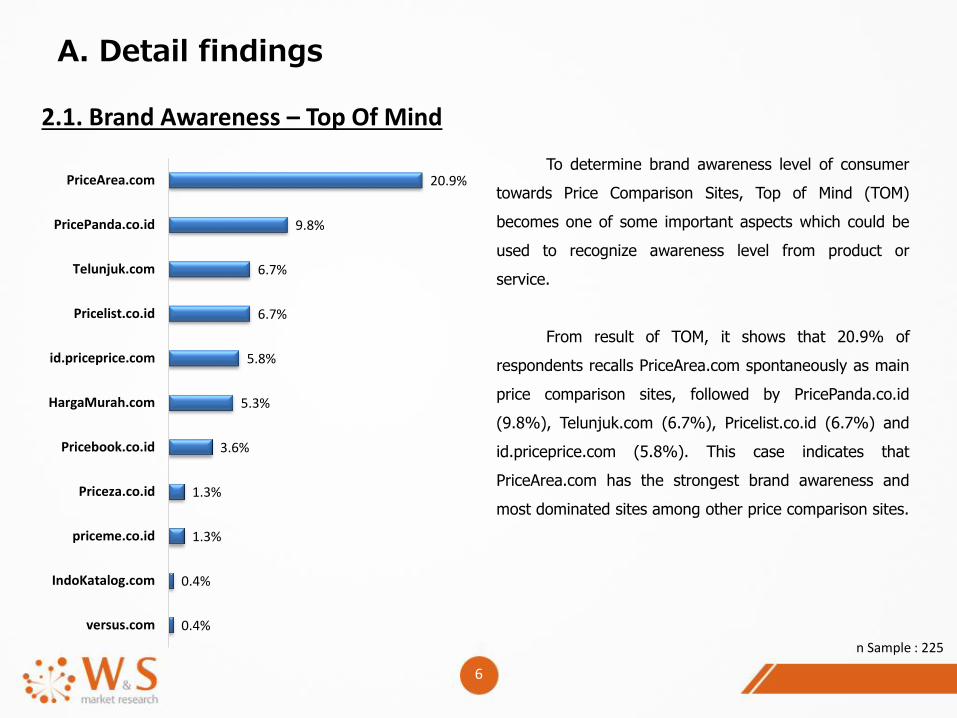
2.1. Brand Awareness – Top Of Mind
n Sample : 225
To determine brand awareness level of consumer
towards Price Comparison Sites, Top of Mind (TOM)
becomes one of some important aspects which could be
used to recognize awareness level from product or
service.
From result of TOM, it shows that 20.9% of
respondents recalls PriceArea.com spontaneously as main
price comparison sites, followed by PricePanda.co.id
(9.8%), Telunjuk.com (6.7%), Pricelist.co.id (6.7%) and
id.priceprice.com (5.8%). This case indicates that
PriceArea.com has the strongest brand awareness and
most dominated sites among other price comparison sites.
20.9%
9.8%
6.7%
6.7%
5.8%
5.3%
3.6%
1.3%
1.3%
0.4%
0.4%
PriceArea.com
PricePanda.co.id
Telunjuk.com
Pricelist.co.id
id.priceprice.com
HargaMurah.com
Pricebook.co.id
Priceza.co.id
priceme.co.id
IndoKatalog.com
versus.com
7
35.6%
10.2%
26.7% 27.1%
14.7%
5.8%
18.7%12.0%
8.0%3.1%
21.7%
43.6%
24.4%20.0%
25.7%
32.9%
17.7%
19.1%21.8%
0.0%
57.3%53.8%
51.1%47.1%
40.4%38.7%
36.4%
31.1% 29.8%
3.1%
Aided
Unaided
TotalAwareness
A. Detail findings
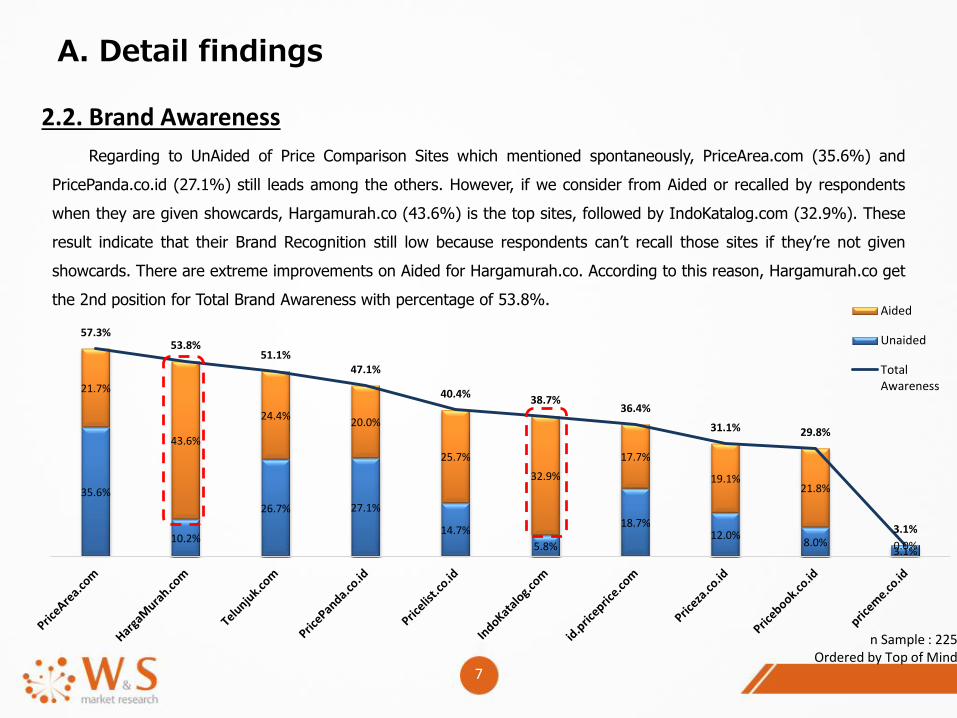
2.2. Brand Awareness
Regarding to UnAided of Price Comparison Sites which mentioned spontaneously, PriceArea.com (35.6%) and
PricePanda.co.id (27.1%) still leads among the others. However, if we consider from Aided or recalled by respondents
when they are given showcards, Hargamurah.co (43.6%) is the top sites, followed by IndoKatalog.com (32.9%). These
result indicate that their Brand Recognition still low because respondents can’t recall those sites if they’re not given
showcards. There are extreme improvements on Aided for Hargamurah.co. According to this reason, Hargamurah.co get
the 2nd position for Total Brand Awareness with percentage of 53.8%.
n Sample : 225Ordered by Top of Mind
8
A. Detail findings
1. Popular Brand Index
2. Brand Awareness
3. Expansive
4. Frequent User
5. Future Intention
6. Switching
7. General Information
9
A. Detail findings
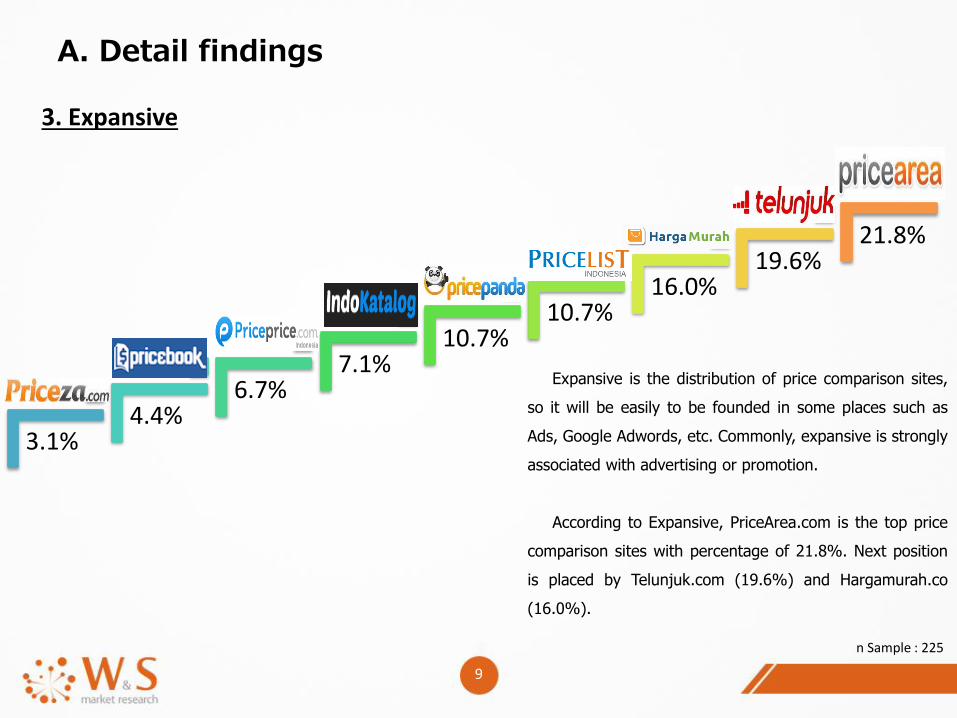
3. Expansive
n Sample : 225
3.1%4.4%
6.7%7.1%
10.7%10.7%
16.0%19.6%
21.8%
Expansive is the distribution of price comparison sites,
so it will be easily to be founded in some places such as
Ads, Google Adwords, etc. Commonly, expansive is strongly
associated with advertising or promotion.
According to Expansive, PriceArea.com is the top price
comparison sites with percentage of 21.8%. Next position
is placed by Telunjuk.com (19.6%) and Hargamurah.co
(16.0%).
10
A. Detail findings
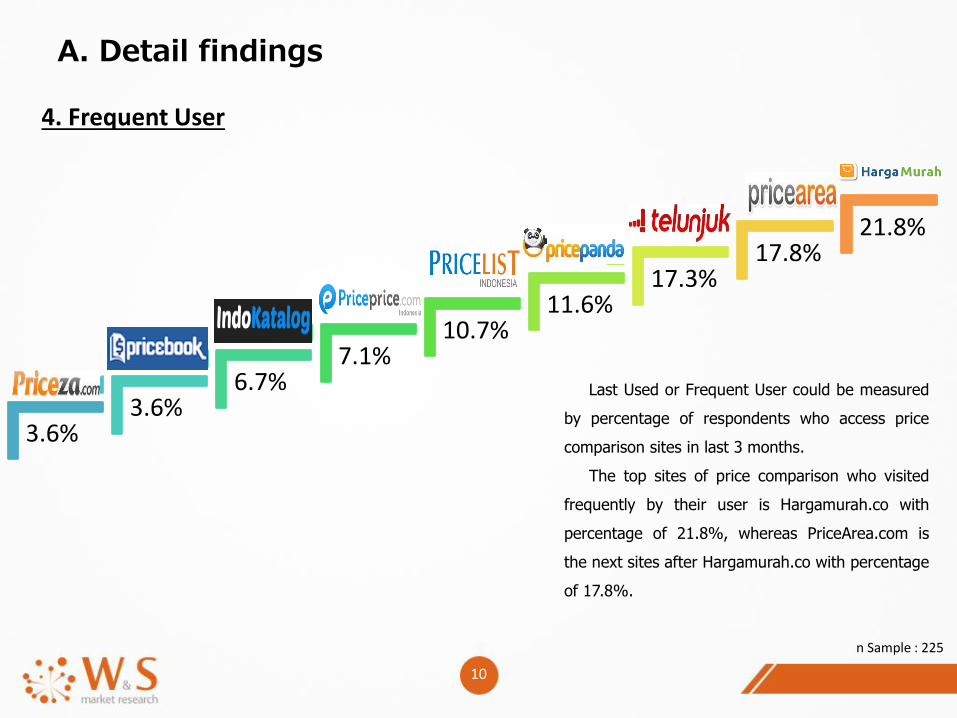
4. Frequent User
n Sample : 225
3.6%3.6%
6.7%7.1%
10.7%11.6%
17.3%17.8%
21.8%
Last Used or Frequent User could be measured
by percentage of respondents who access price
comparison sites in last 3 months.
The top sites of price comparison who visited
frequently by their user is Hargamurah.co with
percentage of 21.8%, whereas PriceArea.com is
the next sites after Hargamurah.co with percentage
of 17.8%.
11
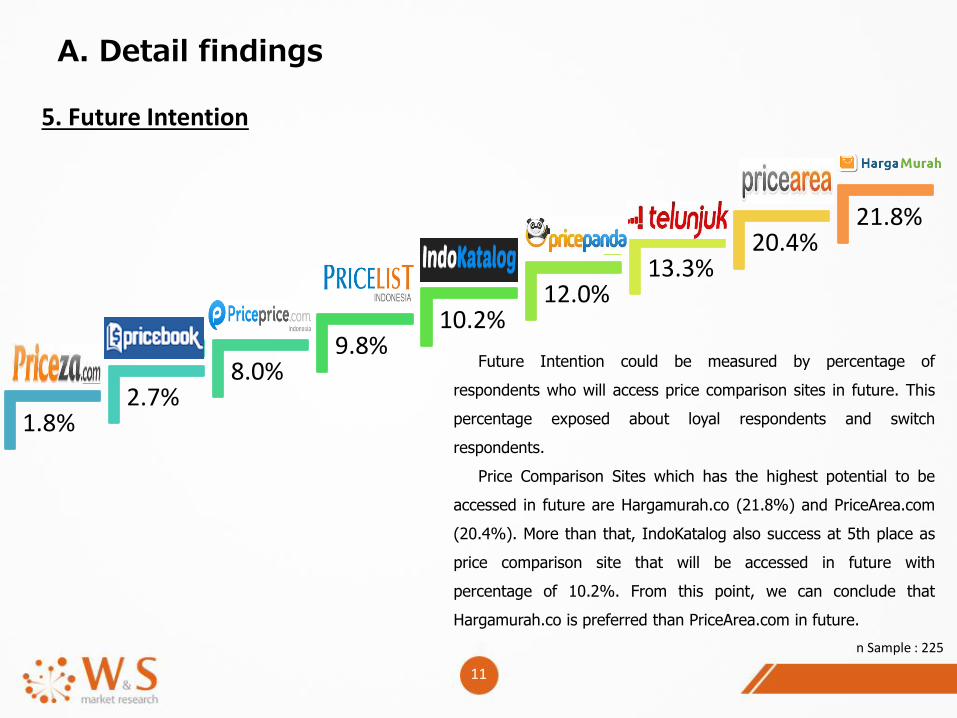
1.8%2.7%
8.0%9.8%
10.2%12.0%
13.3%20.4%
21.8%
A. Detail findings
5. Future Intention
Future Intention could be measured by percentage of
respondents who will access price comparison sites in future. This
percentage exposed about loyal respondents and switch
respondents.
Price Comparison Sites which has the highest potential to be
accessed in future are Hargamurah.co (21.8%) and PriceArea.com
(20.4%). More than that, IndoKatalog also success at 5th place as
price comparison site that will be accessed in future with
percentage of 10.2%. From this point, we can conclude that
Hargamurah.co is preferred than PriceArea.com in future.
n Sample : 225
12
A. Detail findings
1. Popular Brand Index
2. Brand Awareness
3. Expansive
4. Frequent User
5. Future Intention
6. Switching
7. General Information
13
36.9%
63.1%
A. Detail findings
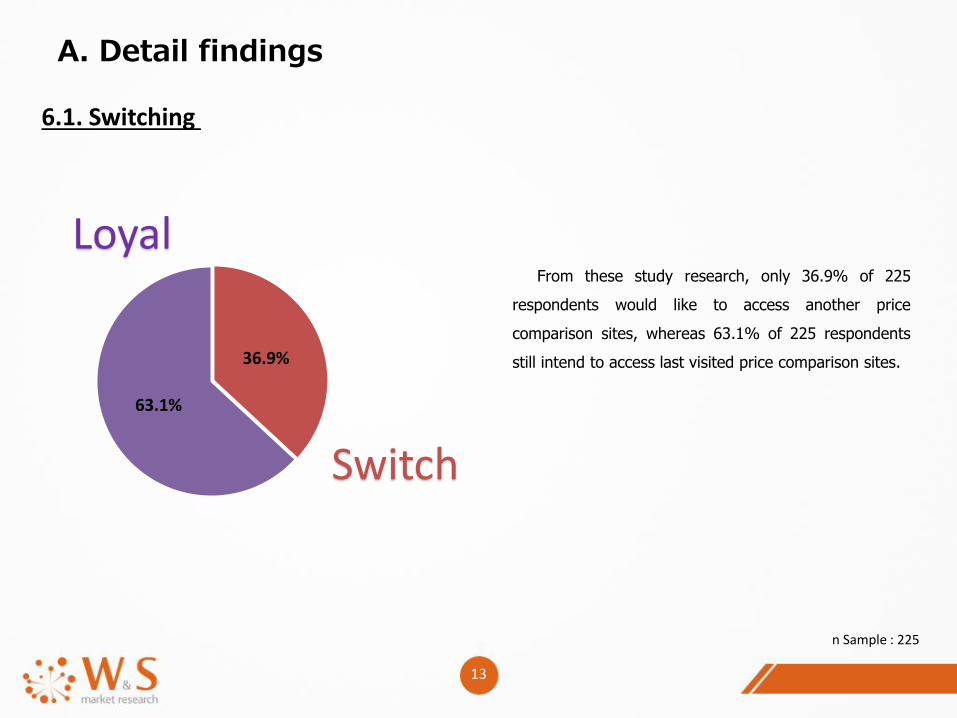
6.1. Switching
n Sample : 225
From these study research, only 36.9% of 225
respondents would like to access another price
comparison sites, whereas 63.1% of 225 respondents
still intend to access last visited price comparison sites.
Loyal
Switch
14
A. Detail findings
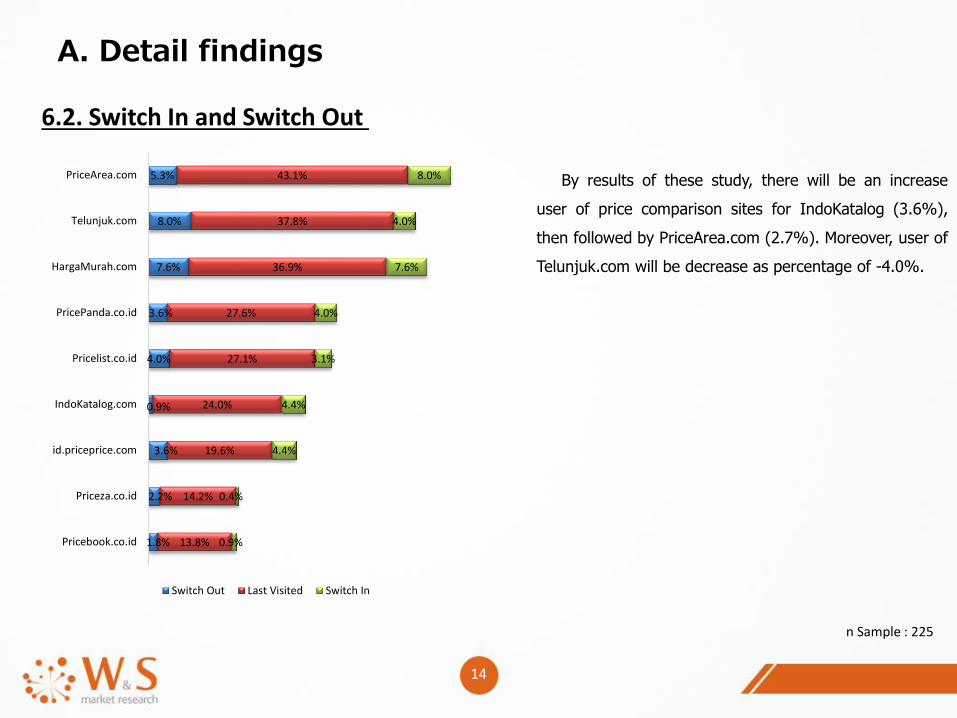
6.2. Switch In and Switch Out
n Sample : 225
By results of these study, there will be an increase
user of price comparison sites for IndoKatalog (3.6%),
then followed by PriceArea.com (2.7%). Moreover, user of
Telunjuk.com will be decrease as percentage of -4.0%.
5.3%
8.0%
7.6%
3.6%
4.0%
0.9%
3.6%
2.2%
1.8%
43.1%
37.8%
36.9%
27.6%
27.1%
24.0%
19.6%
14.2%
13.8%
8.0%
4.0%
7.6%
4.0%
3.1%
4.4%
4.4%
0.4%
0.9%
PriceArea.com
Telunjuk.com
HargaMurah.com
PricePanda.co.id
Pricelist.co.id
IndoKatalog.com
id.priceprice.com
Priceza.co.id
Pricebook.co.id
Switch Out Last Visited Switch In
15
A. Detail findings
1. Popular Brand Index
2. Brand Awareness
3. Expansive
4. Frequent User
5. Future Intention
6. Switching
7. General Information
16
3.6%
29.8%
13.8%
46.3%
1.3%
31.1%
14.2%
45.7%
0.4%
38.7%
24.0%
62.0%
1.3%
3.1%
0.4%
12.9%
A. Detail findings
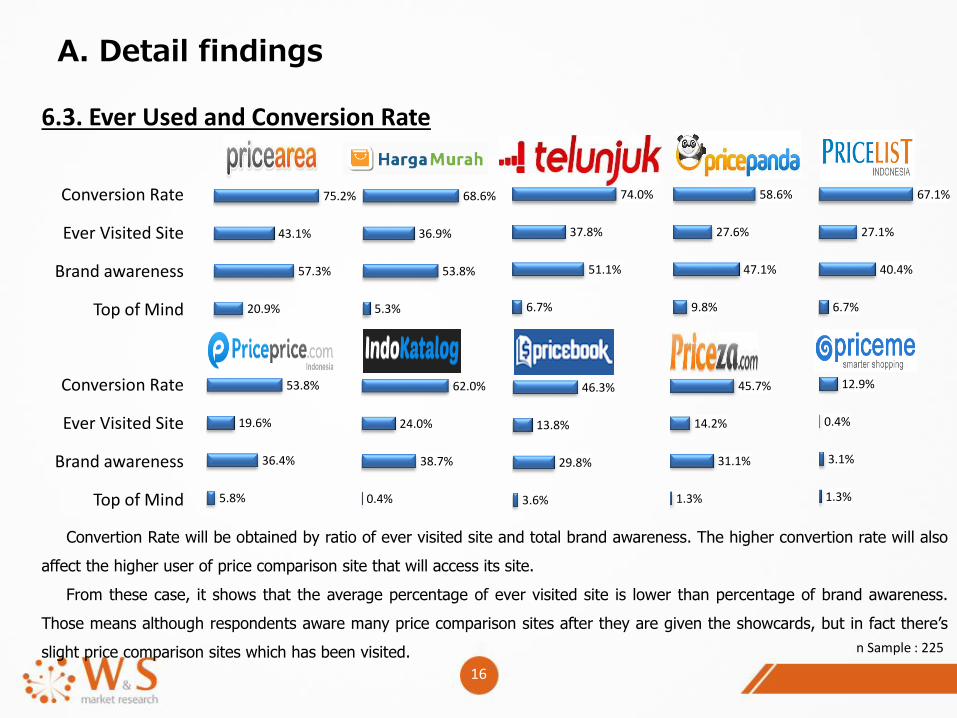
6.3. Ever Used and Conversion Rate
Conversion Rate
Ever Visited Site
Brand awareness
Top of Mind
Conversion Rate
Ever Visited Site
Brand awareness
Top of Mind
n Sample : 225
Convertion Rate will be obtained by ratio of ever visited site and total brand awareness. The higher convertion rate will also
affect the higher user of price comparison site that will access its site.
From these case, it shows that the average percentage of ever visited site is lower than percentage of brand awareness.
Those means although respondents aware many price comparison sites after they are given the showcards, but in fact there’s
slight price comparison sites which has been visited.
20.9%
57.3%
43.1%
75.2%
5.3%
53.8%
36.9%
68.6%
6.7%
51.1%
37.8%
74.0%
9.8%
47.1%
27.6%
58.6%
6.7%
40.4%
27.1%
67.1%
5.8%
36.4%
19.6%
53.8%
17
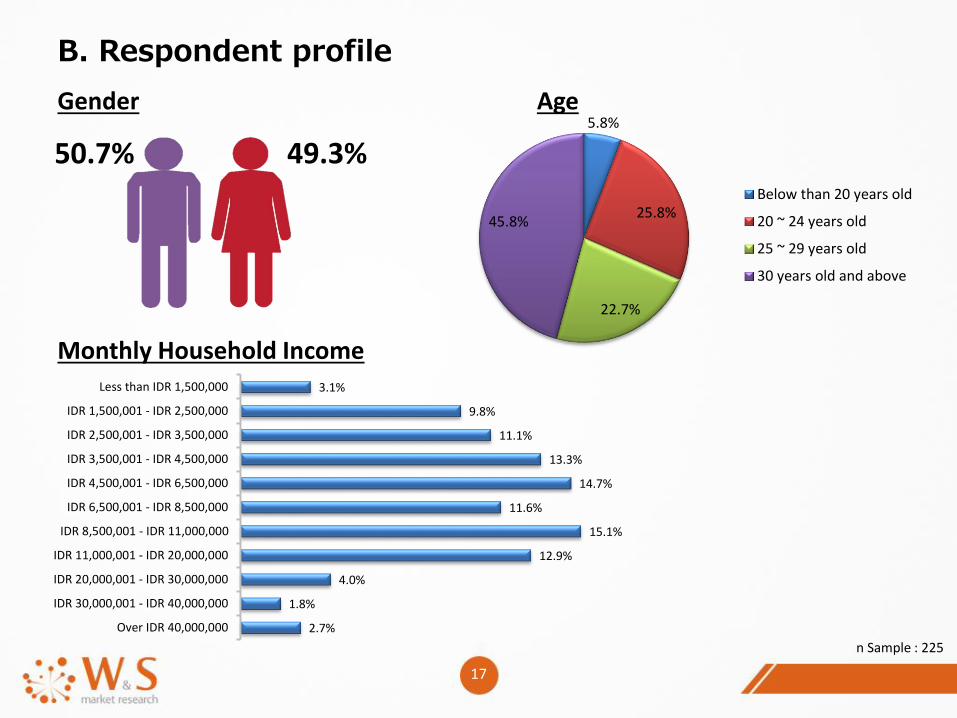
B. Respondent profile
Monthly Household Income
50.7% 49.3%
Age
n Sample : 225
Gender
2.7%
1.8%
4.0%
12.9%
15.1%
11.6%
14.7%
13.3%
11.1%
9.8%
3.1%
Over IDR 40,000,000
IDR 30,000,001 - IDR 40,000,000
IDR 20,000,001 - IDR 30,000,000
IDR 11,000,001 - IDR 20,000,000
IDR 8,500,001 - IDR 11,000,000
IDR 6,500,001 - IDR 8,500,000
IDR 4,500,001 - IDR 6,500,000
IDR 3,500,001 - IDR 4,500,000
IDR 2,500,001 - IDR 3,500,000
IDR 1,500,001 - IDR 2,500,000
Less than IDR 1,500,000
5.8%
25.8%
22.7%
45.8%
Below than 20 years old
20 ~ 24 years old
25 ~ 29 years old
30 years old and above
PT. Nusaresearch is a 100% Japanese investment. Our main professions are ‘Online market research’, ‘Web creative’ and ‘Web marketing’.Online research is conducted based on Nusaresearch – our actively managed over 100,000 members panel with various segmentationsacross Indonesia.
FOR FURTHER INQUIRIES, PLEASE CONTACT:
PT. Nusaresearch» Address: 21H Grand Slipi Tower, Jl. S. Parman Kav. 22-24, Slipi, Jakarta Barat, Indonesia 11480» Office phone: (+6221) 29 022 227 Fax: (+ 6221) 29 022 365» Email: [email protected] » Website: http://nusaresearch.com/
The copyright of this report belongs to PT. Nusaresearch Company. The results (analyzing, wording, data, tables and graphs) ofthis survey can be publicly used, but must be cited and sourced from PT. Nusaresearch Company (also include its website addresshttp://nusaresearch.com).