Embed Size (px)
DESCRIPTION
indonesia cement industry
Citation preview

www.dbsvickers.com
ed-SGC / sa- MA
Bulky valuations Unprecedented structural shift will see utilisation
rates reach a new low
Expect pricing power to weaken; do not discount a price war in 2016/17
Multiplier effect of infrastructure projects will only kick in in 2017
Valuations are rich but earnings growths are slowing; initiate coverage of SMGR and INTP with FULLY VALUED ratings
Unprecedented structural shift. Indonesia’s cement industry is experiencing an unprecedented structural shift that will see the derating of the key incumbent listed players. Cement demand growth peaked in 2010-2013, driven by the property sector which generated a multiplier of 2.4-2.7x GDP. But by 2017, cement supply will outstrip demand by a staggering 26m tonnes with incoming capacities from new foreign entrants. For the first time since 2010, we estimate industry utilisation rate will fall below 80%, and to 74% by 2017 (lowest since 2007). The more vulnerable segment will be bulk cement despite an expected acceleration in infrastructure spending, because this will likely be the target market for new entrants. Bulk cement is already generating lower margins than bag cement.
Situation exacerbated by weak pricing power. The supply-demand imbalance will continue to weaken pricing power and erode margins of cement players. This was evident last year, when the price hike was insufficient to offset cost increases. The situation was made worse after Jokowi instructed SOE cement companies (Semen Indonesia and Semen Baturaja) to reduce bag cement price by 4-5%, which offset the benefit of low energy prices. Also, floating electricity tariffs and fuel prices starting this year implies higher volatility for cement players. Do not discount a price war as early as 2016/2017, when most of the new supply comes on stream. Our channel checks reveal that Anhui’s and Siam Cement’s Indonesian presence account for c.3% of their total production, respectively, suggesting they may sacrifice pricing to gain market share.
Rich valuations unwarranted given slower earnings growth
and declining ROE. SMGR and INTP are currently trading at 15x/14x FY15F/16F EPS (slightly above their 10-year mean P/E), but earnings growth will slow to <5% CAGR (FY14-FY17) from 13-16% between FY09 and FY13. ROE will also drop from 31%-27% (in FY12) to 19%-20% (in FY17). Our TPs are based on 12x FY16F EPS (-1SD of mean). Our forecast earnings are 11-14% below consensus estimates. Of the two, Semen Indonesia is less vulnerable because of its geographical reach and the bulk of new supply which is coming onstream is in Western Java, where Indocement is dominant. We initiate coverage of SMGR and INTP with FULLY VALUED calls.
JCI : 5,337.50
Analyst Deidy WIJAYA +6221 3003 4931 [email protected] CHONG Tjen San, CFA +603 26043972 [email protected]
STOCKS
Source: Bloomberg Finance L.P., DBS Vickers, AllianceDBS
Semen Indonesia : Semen Indonesia (SMGR IJ) : SMGR was established in 1957. In 1995 the company completed an acquisition of Semen Padang and Semen Tonasa. It is currently the largest player in the market with 40.7% market share.
Indocement Tunggal Prakarsa : Indocement was established in 1975. The expanded heavily in the 90’s, prior to Heidelberg Cement Group becoming the majority shareholder in 2001. The company now trades under the brand “Tiga Roda”.
Holcim Indonesia: PT Holcim Indonesia Tbk is an Indonesia-based company primarily engaged in cement manufacturing and distribution. Its business is classified into three segments: cement production and distribution; ready-mix concrete production and aggregates mining, and other services, comprising cement distribution services.
DBS Group Research . Equity 17 Feb 2015
Indonesia Industry Focus
Indonesia Cement Sector
Refer to important disclosures at the end of this report
Price Mkt Cap Target Price Performance (%)
Rp US$m Rp 3 mth 12 mth Rating
Semen Indonesia 14,675 6,823 12,200 (8.5) (2.4) FV Indocement 23,800 6,868 20,200 (3.3) 5.5 FV Holcim Indonesia 1,960 1,172 N.A (13.5) (14.5) N.R

Industry Focus
Indonesia Cement Sector
Page 2
Analysts Deidy WIJAYA +6221 3003 4931 [email protected] CHONG Tjen San, CFA +603 26043972 [email protected]
Table of Contents Investment Thesis 3 Supply/Demand Outlook 5 Significant new capacity in the next three years 7 Positive impact from weak energy prices offset by lower ASP 9 Premium valuation to narrow as oligopoly structure breaks down 11
STOCK PROFILE 12
Indocement Tunggal P. 13 Semen Indonesia 28

Industry Focus
Indonesia Cement Sector
Page 3
Investment Thesis Entering a new era – skewed supply-demand balance. We estimate 33m tons of new capacity will come onstream in the next three years. This will be more than double our forecast cement demand growth (16m tons) over the same period. As such, we forecast industry utilisation will drop from 90% in FY14 to 74% in FY17. SMGR and INTP would be able to keep utilisation relatively high at over 80% due to their strong brand equity and solid distribution channels. But this will depend on how rational the new competition in the form of foreign players will be. For sure, competition will be more intense and pricing power will weaken. Demand to recover partially, driven by rollout of infrastructure projects. We expect cement demand to pick up this year after a very slow 2014 (+3.3% y-o-y vs. 7.6% CAGR over FY04-13) as the government accelerates the rollout of infrastructure projects. The channeling of fuel subsidy into infrastructure and the new land bill (which will be effective from 2015) will boost cement demand from this year onwards. But growth will not return to the hey days as bag demand will be impacted by the slowdown in property sales and slow economic growth this year. Our base case assumption is for cement demand to grow by 6%/8%/10% in FY15/16/17, with demand for bulk cement growing by 14%/18%/20%. Our base case estimate is for bulk cement contribution to increase from 22% currently to 27% by 2017. But this is still insufficient to absorb the additional supply coming on stream. Bulk segment most vulnerable. We estimate bulk cement generate c.500 bps lower gross margin than bag cement. Furthermore, bulk segment will continue to face margin pressure as entry barriers are also much lower. The incumbents will continue to enjoy high market shares in the bag segment for the next few years due to their strong brand equity and solid distribution channels. But in the bulk segment, customers are more price-sensitive and the new entrants could be a serious threat to the incumbents’ pricing power as they try to gain market share. Hence, a price war should not be ruled out. Based on our channel checks, Anhui’s and Siam Cement’s capacity in Indonesia will account for a very small share (c.3%) of their total installed capacity. And given the high capex incurred, they may sacrifice pricing to gain market share. Anhui currently has 260m tons capacity in China, but is targeting for only 6.5m tons capacity in Indonesia by 2017 (<3% of group capacity). Likewise, Siam Cement has 56m tons capacity in Thailand, and is planning to commission 1.8m tons in Indonesia by 2017 (c.3%). This
suggests those players can afford to be aggressive in their pricing in order to win market share in Indonesia. We are already seeing some signs, as the pricing of Semen Merah Putih (by Wilmar Group) is c.5-10% cheaper than the Tiga Roda brand (by Indocement) and Semen Gresik brand (by Semen Indonesia group). Semen Merah Putih bag cement (cement imported from Vietnam) was introduced two years ago so Wilmar would get a head start in marketing the product. In January this year, they have managed to capture 2.4% market share. We believe the new players will pose a bigger threat to the incumbents’ market shares a few years down the road, especially in the bulk market, once they have batching plants to deliver Ready Mix Concrete (RMC). Benefits from low energy prices offset by lower ASP. Margins have fallen in the last two years as cement producers had been reluctant to pass on all of the cost increases. EBITDA margins have fallen by almost 400 bps for both of the cement players, to 31%/34%, attributed to soft demand in the last two years and also to discourage foreign players from entering Indonesia. The cost pressure has eased recently as electricity tariff had been reduced by 15% m-o-m in January (after the 65% hike last year) and a further 2% in February and subsidised diesel price have also been reduced twice in January (-14.6% total after 36.4% hike in Nov 2014). However, these benefits were short-lived as Jokowi had recently instructed SOE cement companies (Semen Indonesia (SMGR) and Semen Baturaja (SMBR)) to reduce bag cement price by Rp3,000/bag (cut by 4-5%) because of the lower energy price. This is the first time that a president has played a role in determining cement prices, and we fear Jokowi would continue to control SMGR’s and SMBR’s cement prices, and erase prospects of margins recovery as a result of lower costs. Rich valuations unwarranted given slower growth and declining ROE. We forecast SMGR and INTP will register slower earnings growth in the next three years (c.5% vs. 13-16% over FY09-13), as their margins continue to decline. EBITDA margins are expected to drop by further 400-500 bps between FY14 and FY17. And ROE would drop from 30.5%-27.1% (in FY12) to 19%-20% (in FY17). These could lead to a derating of the two stocks, from 15-16/14-15x FY15/16 P/E (5 year mean). Our TPs are pegged to 12-13x FY16 EPS (-1Sd of mean) to reflect the weak outlook for the sector. Therefore, we initiate coverage of SMGR and INTP with FULLY VALUED calls.

Industry Focus
Indonesia Cement Sector
Page 4
Key risks to our call. 1) Strong property sales. We expect property sales to be relatively flat this year. But if sales unexpectedly surge this year, there would be upside risk to our demand assumptions. 2) Stronger-than-expected economic growth. If GDP growth is significantly higher than our assumption (>7%), there could be upside risk to our sales volume and utilisation rate assumptions. 3) Major delays in new greenfield projects. If the new players’ plants are delayed by more than a year, there would be downside to our supply assumption, and utilisation rate would be higher, and pricing power of the incumbents would be higher than we predicted. 4) Further drop in coal and oil prices and/or a stronger IDR. If coal and oil prices continue to tumble or the IDR strengthens sharply this year, Indonesian cement players will see minimal cost increases and enjoy stronger margins, assuming the government does not further interfere in cement pricing.

Industry Focus
Indonesia Cement Sector
Page 5
Supply/Demand Outlook
Growth forecast Demand to recover after a slow year, but growth will not be spectacular. Historically, near-term cement demand has strong positive correlation with GDP growth, property presales, as well as infrastructure development. Of these determining factors, only infrastructure development is positive in the near term, as we expect slow economic growth and a lackluster property market this year. But infrastructure development will mainly lift demand for bulk cement, which is a much smaller contributor than bag cement and faces the most competition because there is little differentiation between products. We also do not expect the multiplier effect from infrastructure development to kick in soon, given several headwinds in the property sector in the near term. Indonesia: Cement domestic consumption breakdown
Source: Semen Indonesia Presentation Bulk cement sales will continue to grow faster than bag cement. The bulk segment has been growing faster than bag segment every year since 2008, and contribution has grown from 15% to 22% last year. Following the recent cut in fuel subsidy, the government will save c.Rp200tr under the APBN (Central Government Budget), and based on 2015 RAPBN-P (revised budget), c.50% of the savings would be channeled into infrastructure development. As a result, we expect to see large infrastructure projects being rolled out in the coming years. Such projects typically use bulk cement, which supports our thesis that the bulk segment will continue to grow rapidly in the next few years. We estimate bulk sales will grow by 14%/18%/20% in FY15/16/17, to take bulk contribution to 27% by 2017.
Indonesia: Construction spending as % of GDP
Source: CEIC, DBS Vickers, AllianceDBS SOE contractors: new contracts (in Rp bn)
Source: Companies, DBS Vickers, AllianceDBS Cement: bag vs. bulk sales volume (in m tons) and growth
Source: ASI, DBS Vickers, AllianceDBS
Bulk21.0%
Bag79.0%
Housing:c.90%
Cement based industry: c.10%
RMC: c..60%
Fabricator: c.35%
Projects (mortar, render): c.5%
0%
2%
4%
6%
8%
10%
12%
0100200300400500600700800900
1,000
2000
2001
2002
2003
2004
2005
2006
2007
2008
2009
2010
2011
2012
2013
Rp bn
Construction spending (LHS) % of GDP (RHS)
3%
14%
26%
19%
0%
5%
10%
15%
20%
25%
30%
0
10,000
20,000
30,000
40,000
50,000
60,000
70,000
80,000
90,000
100,000
2012 2013 2014 2015F 2016F
WIKA PTPP WSKT yoy growth
32.2 32.8 34.2 39.2 44.1 45.7 46.9 48.7 51.2 54.6
5.9 6.2 6.6
8.8 10.8 12.2 13.0
14.8 17.5
21.0
0%
5%
10%
15%
20%
25%
30%
35%
0
10
20
30
40
50
60
70
80
2008 2009 2010 2011 2012 2013 2014 2015F 2016F 2017F
Bag Bulk Bag's yoy growth Bulk's yoy growth Bulk's contribution
in m tons

Industry Focus
Indonesia Cement Sector
Page 6
Large housing backlog + growing middle-class = robust long term demand; but there are headwinds in the near-term The property sector will remain bullish over the long term supported by the large housing deficit, a young population, and urbanisation. However, there are several headwinds in the near term. Our Indonesia Property analyst expects transaction volume for listed property developers to drop this year as the affordability ratio is stretched, albeit still lower than in regional cities (see “When the going gets tough” dated 2 Dec 2014 by Edward Tanuwijaya). The other headwinds are: Regulations and liquidity tightening risk Upward trend in BI rate Possible revision to Income Tax article 22 to extend the
scope of residential properties that are subject to 5% additional tax
The slow growth of the Property sector in the near-term will have an impact on cement demand, especially bag cement. Hence, we forecast demand for bag cement to be muted (4-5%) in the next two years. Jakarta property price/income ratio is rising
Source: Numbeo, DBS Vickers Indonesia: maximum Loan-to-Value (LTV) regulation
Category Maximum LTV
1st mortgage 2nd mortgage 3rd mortgage
onwards
House > 70 sqm 70% 60% 50% House 22 - 70 sqm - 70% 60% Apartment > 70 sqm 70% 60% 50% Apartment 22 - 70 sqm 80% 70% 60% Apartment < 21 sqm - 70% 60% Shophouse - 70% 60%
Source: Bank Indonesia (BI), DBS Vickers
Indonesia: Possible revision to income tax article 22 Threshold to be taxed under tax income
article 22
No Taxed Items
Current regulation (PMK no. 253/2008)
Proposed changes
1 Landed residential
1) Transaction value > Rp10bn and/or 2) Building area > 500m2
1) Transaction value > Rp2bn and/or 2) Building area > 400m2
2
Apartment, condominium, etc
1) Transaction value > Rp10bn and/or 2) Building area > 400m2
1) Transaction value > Rp2bn and/or 2) Building area > 150m2
Source: Various sources, DBS Vickers BI rate movement
Source: Bank Indonesia (BI), DBS Vickers Indonesia: Marketing sales of listed property companies
Source: Companies, DBS Vickers Multiplier effects will take years to kick in We are bullish on the multiplier effects of infrastructure projects, especially road construction. Better road access will trigger more housing and commercial developments, which will then be followed by other property developments. These would boost cement consumption further. But this will not kick in so soon as the removal of fuel subsidy will reduce disposable income, and in turn, demand for property.
0
2
4
6
8
10
12
14
16
18
2009 2010 2011 2012 2013 2014
x
5.00
5.50
6.00
6.50
7.00
7.50
8.00
Jan-11 May-11 Sep-11 Jan-12 May-12 Sep-12 Jan-13 May-13 Sep-13 Jan-14 May-14 Sep-14
BI Rate
-
5,000
10,000
15,000
20,000
25,000
30,000
35,000
40,000
45,000
2009 2010 2011 2012 2013 2014F 2015F
+56% CAGR
flattishRpbn

Industry Focus
Indonesia Cement Sector
Page 7
Significant new capacity in the next three years New supply will be twice that of cement demand growth, utilisation will drop below 75% by 2017. Between 2002 and 2017F, we note 3 distinct stages in the demand and supply dynamics of Indonesia cement industry. From 2002 to 2008, supply was more or less constant while demand grew in line with GDP (5.7% CAGR), lifting utilisation gradually from 61% to 80%. Between 2010 and 2013, the unexpected property boom drove cement demand to the roof (12.5% CAGR or about 2x GDP growth). During that period, incremental demand (17.2m
tons) was more than of incremental supply (7.7m tons), pushing domestic utilisation rate to over 95%. We are now entering the third phase, where incremental supply will be significantly more than incremental demand. We forecast new supply in the next three years to reach 34m tons compared to only c.16m tons forecast incremental demand. The biggest incremental supply will come in 2016, which would push utilisation to below 80% for the first time since 2010. By 2017, we estimate utilisation would drop further to 74%, similar to 2007 level.
Indonesia cement industry: supply, demand and utiliaation rate
Source: Companies, DBS Vickers, AllianceDBS Indonesia: Utilisation rate will continue to drop as incremental supply outpaces new demand
Source: Companies, DBS Vickers, AllianceDBS
New players eyeing Western Java; Indocement will hurt the most. Since cement is a regional product in Indonesia, not all areas are equally affected. Based on the manufacturers’ expansion plans, Western Java (West Java, Jakarta and Banten) faces the biggest supply risk as 14.7m tons (or 42%) of new supply will be in that region, with 70% of that supply coming from new players (Anhui Conch, Siam Cement and Semen Merah Putih). The incremental new capacities in Java will reach 18.2m tons by end 2017, assuming no major delays in greenfield projects. This is almost twice our forecasted incremental demand of c.10m tons for Java.
61% 61%67% 68% 70%
73%
80%76% 77%
88%
96% 95%
89%85%
77%74%
0%
20%
40%
60%
80%
100%
120%
0
20,000
40,000
60,000
80,000
100,000
120,000
Demand (000 tons) Capacity (000 tons) Utilization rate
Capacity was flat for >6 years, demand growing in line with GDP
Aggressive expansion plans by incumbents and new entrants
Property boom fuelled cement demand
3,054 2,029
3,587
5,105
6,884
3,750
6,300 7,600
14,300
12,550
60%
65%
70%
75%
80%
85%
90%
95%
100%
0
2,000
4,000
6,000
8,000
10,000
12,000
14,000
16,000
2013 2014 2015F 2016F 2017F
Incremental demand Incremental effective supply* Utilization rate (RHS)
(in 000 tons)
Industry Focus
Indonesia Cement Sector
Page 8
Indonesia: New installed capacity by location (2015-2017)
Source: Companies, DBS Vickers, AllianceDBS
Since Western Java is Indocement’s primary market (c.50% contribution to its domestic sales volume; >40% market share), its lead will be at risk when the new plants come on stream.
Indonesia cement companies: historical and planned capacities
Source: Companies, DBS Vickers, AllianceDBS
INTP SMGR SMCB Others Tota lWest Java, Banten and Jakarta 4,400 10,300 14,700 Central Java 2,500 3,000 1,500 7,000 East Java 1,700 1,100 2,800 West Sumatra 3,000 - 3,000 South Sumatra 1,850 1,850 South Sulawesi 1,500 - 1,500 South Kalimantan - - Others 3,750 3,750 Tota l 6,900 7,500 1,700 18,500 34,600
Company Location 2012 2013 2014 2015F 2016F 2017FEast Java 11,600 14,000 14,400 14,400 14,400 14,400 Central Java - - - - 3,000 3,000 West Sumatra 6,330 6,400 7,300 7,300 10,300 10,300 South Sulawesi 4,620 7,300 7,300 8,800 8,800 8,800
22,550 27,700 29,000 30,500 36,500 36,500
West Java 16,000 16,000 17,900 22,300 22,300 22,300 South Kalimantan 2,600 2,600 2,600 2,600 2,600 2,600 Central Java - - - - - 2,500
18,600 18,600 20,500 24,900 24,900 27,400
West Java 5,600 5,600 5,600 5,600 5,600 5,600 Central Java 3,500 3,500 3,500 3,500 3,500 3,500 East Java - - 1,700 3,400 3,400 3,400
9,100 9,100 10,800 12,500 12,500 12,500
South Sulawesi 2,300 2,300 4,000 4,000 4,000 4,000 Riau 1,200 1,200 1,200 1,200 1,200 1,200 East Java - - - 1,100 1,100 1,100 Papua - - - - 750 750
3,500 3,500 5,200 6,300 7,050 7,050
Baturaja South Sumatra 1,250 2,000 2,000 2,000 2,000 3,850
Andalas (Lafarge) Aceh 1,600 1,600 1,600 1,600 1,600 1,600
Kupang NTT 550 550 550 550 550 550
South Kalimantan - - 1,500 1,500 1,500 1,500 West Java - - - - - 2,000 Others - - - - - 3,000
- - 1,500 1,500 1,500 6,500
Siam Cement West Java - - - - 1,800 1,800
Semen Merah Putih (Wilmar) Banten - - 750 1,750 5,750 5,750
Panasia Central Java - - - - 1,500 1,500
Juishin West Java - - - 1,500 1,500 1,500
Tota l 57,150 63,050 71,900 83,100 97,150 106,500
SMGR
INTP
SMCB
Bosowa
Anhui Conch

Industry Focus
Indonesia Cement Sector
Page 9
Positive impact from weak energy prices offset by lower ASP Energy accounts for a big chunk of cement players’ cash cost. Coal/fuel accounts for about 20% of SMGR’s and INTP’s cash costs, while electricity accounts for 12-14%. Distribution, transportation and handling costs are also a major cost items, at c.24%/16% of SMGR’s/INTP’s cash costs. We estimate c.30% of the distribution, transportation and handling costs is from diesel, so the price of coal, electricity and diesel collectively account for c.40% of SMGR’s and INTP’s cash costs. SMGR and INTP: cash cost breakdown
Source: Semen Indonesia, Indocement, DBS Vickers, AllianceDBS Benefits of low coal and oil prices offset by recent price control. The benefit of lower energy prices was short-lived for Indonesian cement companies, after Jokowi instructed SMGR and SMBR to cut bag cement price by 4-5%. With c.46% market share between them, this move would have a significant impact on the industry. We expect Indocement (INTP) and Holcim (SMCB) to also lower prices to protect their market shares. In fact, INTP said they have lowered the price of cement in Jakarta (where they are the price leader) by Rp3,000 to maintain the same gap with the rest of the players. We think SMGR’s share price will be affected more by this as: 1) the stock offers lower dividend yield than INTP, and even
that may be cut; and 2) INTP has greater flexibility in determining selling price. If
utilisation remains high, INTP has the option to reduce selling price by a smaller quantum.
Lingering risk of further margin erosion. There will be further margin erosion once the new supply comes on stream from 2016 onwards. Falling oil price could delay the negative impact on cement players’ margins. But this could be short-lived once the new supply comes on stream; we would not discount a price war to gain market share. Our base case assumption is that EBITDA margins will decline by c.500 bps between FY13 and FY17 as cement utilisation rate drops from 95% to 74%. Utilisation rates vs. EBITDA margins
Source: Semen Indonesia, Indocement, DBS Vickers, AllianceDBS Floating electricity and diesel prices imply higher earnings volatility. Starting January 2015, electricity tariff is revised monthly using the following formulas: Tariffnew = Tariffold * (1 + Adjustment)
Tariffold = 1,191 per kWh (based on the tariff regulation set in
Permen ESDM number 09/2014)
Adjustment = %(Kexchange_rate * exchange_rate) + %(Kicp *
ICP) + %(Kinflation * inflation) where, K is the coefficient of
each variable in place, determined by PLN each month
exchange_rate = the difference between the average USD/IDR
exchange rate (2 months prior) and the USD/IDR exchange rate
assumption in 2013 APBN (Rp9,300/USD)
ICP = the difference between Indonesia Crude Price (2 months
prior) and the Indonesia Crude Price assumption in 2013 APBN
(US$100/barrel)
inflation = the difference between monthly inflation rate (2
months prior) and the monthly inflation rate assumption in 2013
APBN (4.9%/12 months)
YTD, the tariff for I4 has been lowered twice (-15%/-2% m-o-m in Jan/Feb) following the sharp drop in the oil price. The adjustment for January/February was based on ICP, USD/IDR exchange rate and inflation rate in November/December 2014 (2
20.1% 19.2%
12.2% 13.7%
23.6%15.9%
8.4%
7.8%
35.7%43.4%
SMGR INTP
Coal/fuel Electricity Distribution, transportation and handling Direct labor Others
20%
25%
30%
35%
40%
45%
50%
60%
65%
70%
75%
80%
85%
90%
95%
100%
2006 2007 2008 2009 2010 2011 2012 2013 2014F 2015F 2016F 2017F
Cement's utilization rate INTP's EBITDA margin SMGR's EBITDA margin

Industry Focus
Indonesia Cement Sector
Page 10
months lag). Prices of subsidised gasoline/diesel was also cut by c.13%/12% in January 2015, also due to the sharp drop in ICP. Based on January 2015 prices, the government has completely removed the subsidy for gasoline, but there is still a Rp1,000/liter
subsidy for diesel. This means that subsidised fuel prices will also be floated starting this year. Floating electricity and fuel prices imply higher earnings volatility for cement players going forward.
Electricity tariff for I4 (Industry with >30,000 kVa of power)
Source: PLN, DBS Vickers Historical subsidised fuel prices
Source: Pertamina, DBS Vickers
600
700
800
900
1,000
1,100
1,200
1,300
Jan-
13
Feb-
13
Mar
-13
Apr
-13
May
-13
Jun-
13
Jul-1
3
Aug
-13
Sep-
13
Oct
-13
Nov
-13
Dec
-13
Jan-
14
Feb-
14
Mar
-14
Apr
-14
May
-14
Jun-
14
Jul-1
4
Aug
-14
Sep-
14
Oct
-14
Nov
-14
Dec
-14
Jan-
15
Feb-
15
Electricity tariff for I4 (per kWh)
in Rp
13% hike every 2 months (65% total increase)
-
1,000
2,000
3,000
4,000
5,000
6,000
7,000
8,000
9,000
Jan-
05M
ay-0
5Se
p-05
Jan-
06M
ay-0
6Se
p-06
Jan-
07M
a y-0
7Se
p-07
Jan-
08M
a y-0
8Se
p-08
Jan-
09M
ay-0
9Se
p-09
Jan-
10M
ay-1
0Se
p-10
Jan-
11M
ay-1
1Se
p-11
Jan-
12M
ay-1
2Se
p-12
Jan-
13M
ay-1
3Se
p-13
Jan-
14M
ay-1
4Se
p-14
Jan-
15
Gasoline Diesel
Gasoline price was hiked by 89% in 18 mths
Subsidized fuel price have been lowered twice in January due to low oil price

Industry Focus
Indonesia Cement Sector
Page 11
Premium valuation to narrow as oligopoly structure breaks down More attractive industry structure than China and Thailand, but advantages will gradually be eroded. Indonesian cement players have been enjoying high margins due to the oligopoly structure of the industry, with the top 3 players controlling nearly 90% market share. In Thailand, the top 3 players command c.80% market share, while in China, the top 10 players only control 40-45% market share. In terms of utilisation rate, it was 89% for Indonesia last year vs. 85% for Thailand and 75% for China. However, despite higher forecast
demand growth for Indonesia, we still expect utilisation rates to continue to drop over the next three years to c.74% as new players aggressively ramp up production. As such, we estimate the market share of the top 3 players would fall to c.82% by FY17. Valuation wise, Indonesian cement players are trading on par with Siam Cement and at a premium to the China players, despite slower expected earnings growth. But with the Indonesian cement players experiencing an unprecedented structural shift, we expect their current premium valuation relative to China peers to narrow.
Cement Sector: Indonesia vs Thailand and China
Source: Companies, DBS Vickers Peer comparison of regional cement companies
Company Ticker Code
Current Price (local currency)
Market Cap (USDm)
P/E EV/EBITDA ROE FY15
FY15 FY16 FY15 FY16 Semen Indonesia SMGR IJ 14,525 6,863 14.2 13.5 9.4 8.7 23% Indocement INTP IJ 23,000 6,768 15.1 14.2 9.4 8.7 22% Holcim Indonesia* SMCB IJ 1,970 1,204 15.2 12.8 7.9 7.0 18% Indonesia 14.8 13.5 8.9 8.1 Anhui Conch 914 HK 26.8 18,337 9.0 8.2 5.3 5.2 19% CNBM 3323 HK 7.6 5,288 5.3 5.0 8.3 8.1 14% China Shanshui 691 HK 3.7 1,611 10.8 8.8 7.0 6.4 7% West China Cement 2233 HK 0.9 518 12.4 10.0 4.7 4.5 8% CR Cement 1313 HK 4.7 3,877 6.6 6.4 5.5 5.3 16% China 8.8 7.7 6.2 5.9 Siam Cement SCC TB 472.0 17,688 15.0 13.7 10.3 9.6 20% Thailand 15.0 13.7 10.3 9.6
Source: Bloomberg Finance L.P., DBS Vickers Note*: Based on consensus forecasts
Country CompanyCement Production Capacity (m ton) Uti l iza tion ra te
FY15 demand growth
FY16 demand growth
Semen Indonesia 28.5Indocement 21.5Holchim Indonesia 10.1CNBM 400Anhui Conch 260China Shanshui 107West China Cement 27CR Cement 77
Thailand Siam Cement* 56 85% 5% 5%
China
6.0%Indonesia
75%
8.0%
2.5% 2.5%
98%

Industry Focus
Indonesia Cement Sector
Page 12
STOCK PROFILES
www.dbsvickers.com ed: SGC / sa: MA
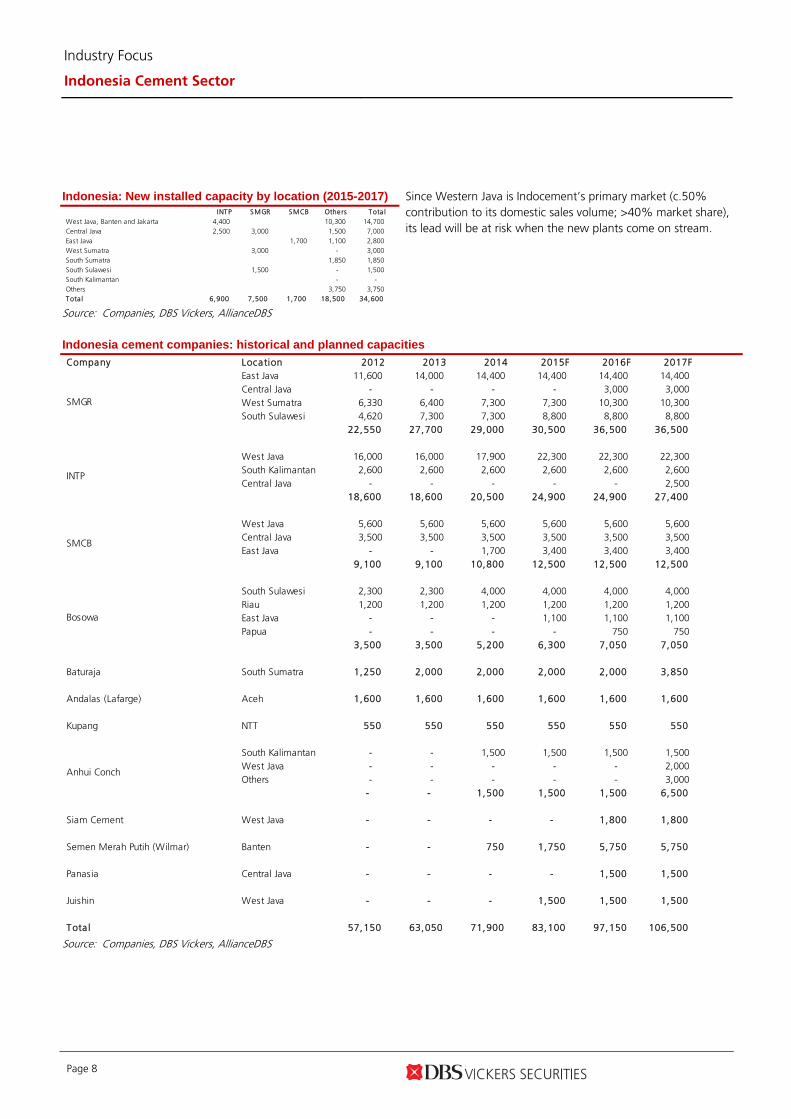
FULLY VALUED Rp23,800 JCI : 5,325.50 (Initiating Coverage) Price Target : 12-Month Rp20,200 Reason for Report : Initiating coverage Potential Catalyst: Strong property sales, lower coal and oil price
Analyst Deidy WIJAYA +6221 3003 4931 [email protected]
CHONG Tjen San, CFA +603 2604 3972 [email protected]
Price Relative
Forecasts and Valuation FY Dec (Rp bn) 2013A 2014F 2015F 2016F Revenue 18,691 20,141 22,222 25,089 EBITDA 6,785 6,953 7,370 7,863 Pre-tax Profit 6,595 6,808 7,133 7,510 Net Profit 5,010 5,174 5,421 5,707 Net Pft (Pre Ex.) 5,010 5,174 5,421 5,707 EPS (Rp) 1,361 1,406 1,473 1,550 EPS Pre Ex. (Rp) 1,361 1,406 1,473 1,550 EPS Gth (%) 5 3 5 5 EPS Gth Pre Ex (%) 5 3 5 5 Diluted EPS (Rp) 1,361 1,406 1,473 1,550 Net DPS (Rp) 900 929 974 1,025 BV Per Share (Rp) 6,234 6,739 7,282 7,859 PE (X) 17.5 16.9 16.2 15.4 PE Pre Ex. (X) 17.5 16.9 16.2 15.4 P/Cash Flow (X) 16.2 16.5 14.3 13.7 EV/EBITDA (X) 11.1 10.8 10.2 9.5 Net Div Yield (%) 3.8 3.9 4.1 4.3 P/Book Value (X) 3.8 3.5 3.3 3.0 Net Debt/Equity (X) CASH CASH CASH CASH ROAE (%) 23.7 21.7 21.0 20.5 Earnings Rev (%): - - - Consensus EPS (Rp): 1,411 1,533 1,755 No. of brokers following: B: 20 S: 5 H: 8 ICB Industry : Industrials ICB Sector: Construction & Materials Principal Business: Indocement was established in 1975. The expanded heavily in the 90’s, prior to Heidelberg Cement Group becoming the majority shareholder in 2001. The company now trades under the brand “Tiga Roda”.
Source of all data: Company, DBS Vickers, AllianceDBS, Bloomberg Finance L.P
At A Glance Issued Capital (m shrs) 3,681 Mkt. Cap (Rpbn/US$m) 87,613 / 6,868 Major Shareholders HC Indocement Gmbr (%) 64.1 Mekar Perkasa (%) 13.0 Free Float (%) 22.9 Avg. Daily Vol.(‘000) 3,433
DBS Group Research . Equity 17 Feb 2015
Indonesia Company Focus
Indocement Tunggal Prakarsa Bloomberg: INTP IJ | Reuters: INTP.JK Refer to important disclosures at the end of this report
Most vulnerable to competition Heavily reliant on Java with >70% of sales
volume coming from Java
New players aggressively entering Western Java poses significant threat
Premium margins to face pressure
Initiate with Fully Valued (TP Rp20,200) as valuation is rich at 15x FY16 EPS
Core primary market to face headwinds. INTP derives >70% of its sales volume from Java, while Western Java (West Java, Jakarta and Banten) alone contributes almost 50% of its total sales volume. Based on the companies’ expansion plans, Western Java faces the biggest supply risk as 14.7m tons (or 42%) of the new supply will be from that region and 70% of that supply is coming from new players (Anhui Conch, Siam Cement and Semen Merah Putih).
Premium margins to face pressure. Indocement (INTP) is currently the most profitable cement company with c.35% EBITDA margin primarily due to its pricing power and centralised facilities. It trades under the “Tiga Roda” brand, arguably the most widely known cement brand in the country. It benefits from economics of scale from centralised facilities. However, we think this position will be soon under pressure with the additional competition and we project utilisation rates to fall to 88% in 2017 (94% now) bringing down EBITDA margins to 29.5% (FY17).
Initiate with FULLY VALUED given rich valuation. INTP is currently trading at c.16x 12M forward P/E (above 5-year mean), despite slowing growth (c.5% CAGR FY14-17) and declining ROEs. This appears unjustified in our view with the changing demand and supply dynamics. Moreover, the multiplier effect from infrastructure boom will likely only filters through in 2017 which may coincide with a price war from the heightened competition. Our TP of Rp20,200 is based on 13x FY16 EPS (-1sd below its 5 year mean P/E).
71
91
111
131
151
171
191
211
10,080.0
12,080.0
14,080.0
16,080.0
18,080.0
20,080.0
22,080.0
24,080.0
26,080.0
28,080.0
Feb-11 Feb-12 Feb-13 Feb-14 Feb-15
Relative IndexRp
Indocement Tunggal P. (LHS) Relative JCI INDEX (RHS)

Page 14
Company Focus
Indocement Tunggal Prakarsa
INVESTMENT THESIS
Profile Rationale
Indocement (INTP) is the most profitable cement player with the highest margin. It trades under “Tiga Roda” brand, arguably the most widely known brand in Indonesia. It is the market leader in Western Java where its sales volume is concentrated at (c.50%). It commands a higher margin due to its centralised production facilities and premium pricing. It also has a strong RMC arm.
Cement industry is facing an unprecedented structural shift We estimate new supply to be more than double of new
demand, bringing utilisation down from 89% to 74% by 2017.
Margin projected to keep sliding due to weakening pricing power and increasing contribution from bulk cement 3 major players are entering Indonesia – Semen Merah
Putih (Wilmar Group), Anhui Conch and Siam Cement. Anhui Conch and Siam Cement are market leaders in China and Thailand respectively. With their Indonesia plants contributing only c.3% to their total capacities, there could be price war once their plants come on stream as they try to gain market share.
The fast growing segment in Indonesia is the bulk segment (contribution estimated to rise from 22% to 27% by FY17), which is used for infrastructure projects and high rise buildings. With less barriers to entry (brand equity and distribution channels), this segment (which already commands lower margins) will be the likely target for the new entrants.
Benefits from low energy prices offset by lower ASP After Semen Indonesia (SMGR) and Semen Baturaja
(SMBR) reduced their prices last month, INTP has also lowered its prices in certain areas to maintain the gap between its product and the competitors’.
Rich valuations unwarranted given slower growth and declining ROE INTP is currently trading at 16x 12M forward P/E (above 5
year mean) despite slowing earnings growth and declining
ROE.
Valuation Risks
Our target price of Rp20,200 is pegged to 13x FY16 EPS (-1 sd of 5 year mean). Initiate with FULLY VALUED call as there is more than 10% downside from the current price
Weak demand growth due to slow rollout of infrastructure projects If the new government does not live up to expectation in speeding up infrastructure development, cement demand growth could disappoint, thus hurting INTP’s utilisation and profitability.
Competition in Western Java INTP’s dominance in Western Java could be under threat once the new players start productions. We think that there would be oversupply in Western Java by 2017 and INTP’s dominance in that region will be under severe threat.
Source: DBS Vickers, AllianceDBS

Page 15
Company Focus
Indocement Tunggal Prakarsa
SWOT Analysis
Strengths Weakness
Centralised facilities. The company adopts a centralised strategy which allows it to obtain economies of scale. Sharing of facilities, largely weighted in West Java enables the company to minimize the cost of production. Strong brand image, especially in Java. INTP trades under the brand “Semen Tiga Roda” which is arguably the most widely known brand in the country. Its brand image is especially strong in Western Java, where it is currently the market leader. It has a strong RMC arm. As RMC is widely used for infrastructure projects, it stands to benefit from potential infrastructure boom.
Lack of presence outside Java. 72% of its cement sales came from Java, so INTP’s cement sales is very heavily dependent on the performance of a single island. Less packing plants compared to SMGR. Currently INTP do not have as many packing plants as SMGR. Therefore, distribution time and readiness of stock can be a problem when demand suddenly spikes up.
Opportunities Threats
Geographically, the company still has a lot of room to expand. As the company is currently very heavily weighted in Java, it has ample opportunities to expand to other islands, backed by its strong balance sheet.
New players (Anhui Conch, Siam Cement and Semen Merah Putih) are all eyeing Western Java, Indocement’s primary market. Based on the companies’ expansion plans, Western Java faces the biggest supply risk as 14.7m tons (or 42%) of the new supply will be from that region and 70% of that supply is coming from new players (Anhui Conch, Siam Cement and Semen Merah Putih).
Source: DBS Vickers, AllianceDBS
Page 16
Company Focus
Indocement Tunggal Prakarsa
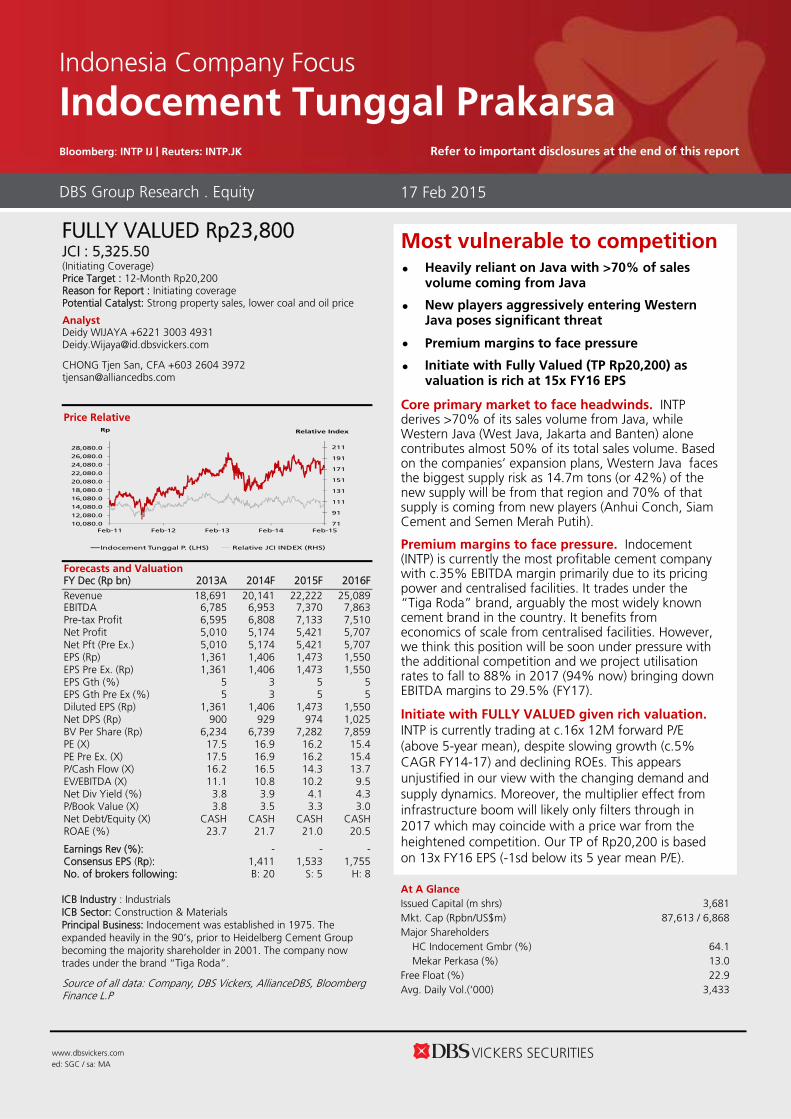
Western Java, its primary market faces the highest supply risk INTP’s domestic sales dominated by Western Java. INTP has a strong Java focus; 72% of its domestic sales volume is derived from Java vs. 56% for the national average. In fact, almost
half of its domestic sales volume is derived from Western Java (Jakarta, Banten and West Java). It has so far enjoyed high market share in Jakarta (40.5%) and West Java (54.8%).
Breakdown on sales volume by region
Source: ASI, DBS Vickers, AllianceDBS
FY14 Market Share of Cement Companies in Java
Source: ASI, DBS Vickers, AllianceDBS
12.9% 9.7%
36.3%
20.1%
15.5%
11.5%
5.9%
13.3%
9.7%
20.9%
7.4%7.6%
3.3% 7.6%7.6% 7.6%
INTP National
Jakarta West Java Central Java Yogyakarta East Java
Sumatra Kalimantan Sulawesi Others
40.5%54.8%
40.9%25.0%
13.4%
38.8%
25.2%
27.4%40.3%
40.0%71.2%
40.4%
27.2%
17.7% 18.8%35.0%
10.4% 18.3%7.1% 4.6% 2.3%
Jakarta West Java Central Java Yogyakarta East Java Whole Java
INTP SMGR SMCB Bosowa

Page 17
Company Focus
Indocement Tunggal Prakarsa
Incoming supply is largely in Western Java. Based on cement companies’ guidance, we estimate that 42% (14.7m tons) of the incoming supply in the next 3 years will be located in Western Java. INTP faces intensifying competition as 70% (14.7m tons) of the new capacities will come from new players. Even if we assume an aggressive growth rate of 10% CAGR between FY14-17 for Western Java, the incremental demand from this region would only be 5.9m tons or merely
40% of the potential increment in capacity. We are concerned that new players would sacrifice margin to gain market share as they try to ramp up their utilisation rate. INTP’s margin, currently being the highest in Indonesia, is therefore at significant risk. Therefore, we built in EBITDA margin erosion from 36.3-34.5% in FY13-FY14 to 33.2-29.7% in FY15-FY17F respectively.
New installed capacity by location (2015-2017)
Source: Companies, DBS Vickers, AllianceDBS
INTP SMGR SMCB Others Tota lWest Java, Banten and Jakarta 4,400 10,300 14,700 Central Java 2,500 3,000 1,500 7,000 East Java 1,700 1,100 2,800 West Sumatra 3,000 - 3,000 South Sumatra 1,850 1,850 South Sulawesi 1,500 - 1,500 South Kalimantan - - Others 3,750 3,750 Tota l 6,900 7,500 1,700 18,500 34,600

Page 18
Company Focus
Indocement Tunggal Prakarsa
Company Background Corporate History. Indocement was established in 1975. In 1989, the Company became PT. Indocement Tunggal Prakarsa following a merger with 6 companies. Two years later, the Company became listed. Following major expansions in the 90’s, Heidelberg Cement Group acquired a majority stake in 2001.
The Company trades cement under the brand “Tiga Road” and currently supplies a number of products ranging from PCC and OPC to less common cements such as oil well cements and white masonry. The Company prides itself as the introducer of Portland Composite Cement (PCC) to Indonesia. Currently, the majority of INTP’s sales volume comes from PCC.
Sales Trend Profitability Trend
Source: Company, DBS Vickers, AllianceDBS
0.0%
5.0%
10.0%
15.0%
20.0%
25.0%
30.0%
0
5,000
10,000
15,000
20,000
25,000
2012A 2013A 2014F 2015F 2016F
Rp bn
Total Revenue Revenue Growth (%) (YoY)
4,760
5,260
5,760
6,260
6,760
7,260
2012A 2013A 2014F 2015F 2016F
Rp bn
Operating EBIT Pre tax Profit Net Profit

Page 19
Company Focus
Indocement Tunggal Prakarsa
Key Management Team
Christian Kartawijaya President Director
He was appointed as the President Director in May 2014. He has been a member of the Board of Director since 2004. He holds an MBA degree from San Diego State University and Master of Arts in Christian Education from SWBTS, Fort Worth, Texas, USA.
Franciscus Welirang Vice President Director
Has been VP since early 2011. Concurrently also the VP commisioner for Lonsum, diector for Indofood and the chairman for the Indonesian Wheat Flour Producers Association. Was also the President commisioner for the Surabaya Stock Exchange. Graduated from Chemical engeneering from South Bank Polytechnic, England.
Kuky Permana Director
Joined the company in 1978 and became a director in 2006. Previously the Deputy Technical Director of the company. Has a Degree in Civil and Municipal Engineering from University College, London, UK.
Hasan Imer Director
Has been a director since 2008. Previosly was project and investment manager in Turkey . Was also the Asian Regional Coordinator for the Group at the Heidelberg Technology Center. In Germany up until 2004. Holds a degree in Mechanical Engineering from Istanbul State Engineering and Architecture Academy, Turkey.
Tjue Lie Sukanto Director
Appointed director in 2011. Previously served as the Finance Director for a German company subsidiary in Indonesia, beforebecoming the manager for the purchsing division in Indocement. Holds a degree in Industrial Management and Engineering, majoring in Finance and accounting from University of Karlsruhe, Germany.
Ramakanta Bhattacharjee Director
Appointed director in November 2012. Prior to joining Indocement, he served as Deputy Managing Director, HeidelbergCement Bangladesh Ltd. He holds a Bachelor’s of Science in Electrical and Electronic Engineering from Chittagong University of Engineering and Technology in 1988 and a Master’s degree in Business Administration & Management in 1994 from Southeastern University, London, England. Bangladeshi citizen, age 49.
Daniel Kundjono Adam Director
Appointed as director in December 2013. Previously, was the Sales and Marketing Division Manager of the Company since 2002. He holds an MBA degree from Institut Pendidikan dan Pembinaan Manajemen, Jakarta.
Benny S. Santoso Director
Director since 1994. Also serve as President commisioner for PT. Nippon Indosari and commisioner for Indoofood. Also director for First Pacific Co. Ltd. Holds a degree from Ngee Ann College in Singapore.
Daniel R. Fritz Director
Has been director since 2009. Previously worked in Votorantim Cimentos, America as VP and COO. Holds a Bachelor Science dgree in Civil Engineering Technology from University of Massachusetts, USA.
Source: Company

Page 20
Company Focus
Indocement Tunggal Prakarsa
Key Business Risks Weak demand growth due to slow rollout of infrastructure projects. If the new government does not live up to expectation in speeding up infrastructure development, cement demand growth could disappoint, thus hurting INTP’s utilisation and profitability.
Competition in Western Java. INTP’s dominance in Western Java could be under threat once the new players start productions. We think that there would be oversupply in Western Java by 2017 and INTP’s dominance in that region will be under severe threat.
Upside Risks to Our Call
Strong rebound in property sales. We expect domestic property sales volume to register flattish growth for this year as there are plenty of headwinds in the near term – upward trend in BI rate, regulations and liquidity tightening risk as well as cost pressure from fuel subsidy removal. If property sales actually rebound strongly this year, there would be upside risk to our cement sales volume assumption as property is the biggest contributor to cement consumption. Further drop in oil and coal price. If coal and oil price continues their downtrend, INTP would benefit in the short
term. Almost 40% of its cash cost are linked to coal and oil price. Should coal and oil continue their downtrend, there would be upside to our margin and earnings assumptions for this year. Significant delay in new players’ Greenfield projects. If the new players’ Greenfield projects are delayed or cancelled, our incremental supply assumption would be overstated and cement utilisation rate would be understated. Competition could be less severe than our assumption and thus pricing power would be higher than we predicted.

Page 21
Company Focus
Indocement Tunggal Prakarsa
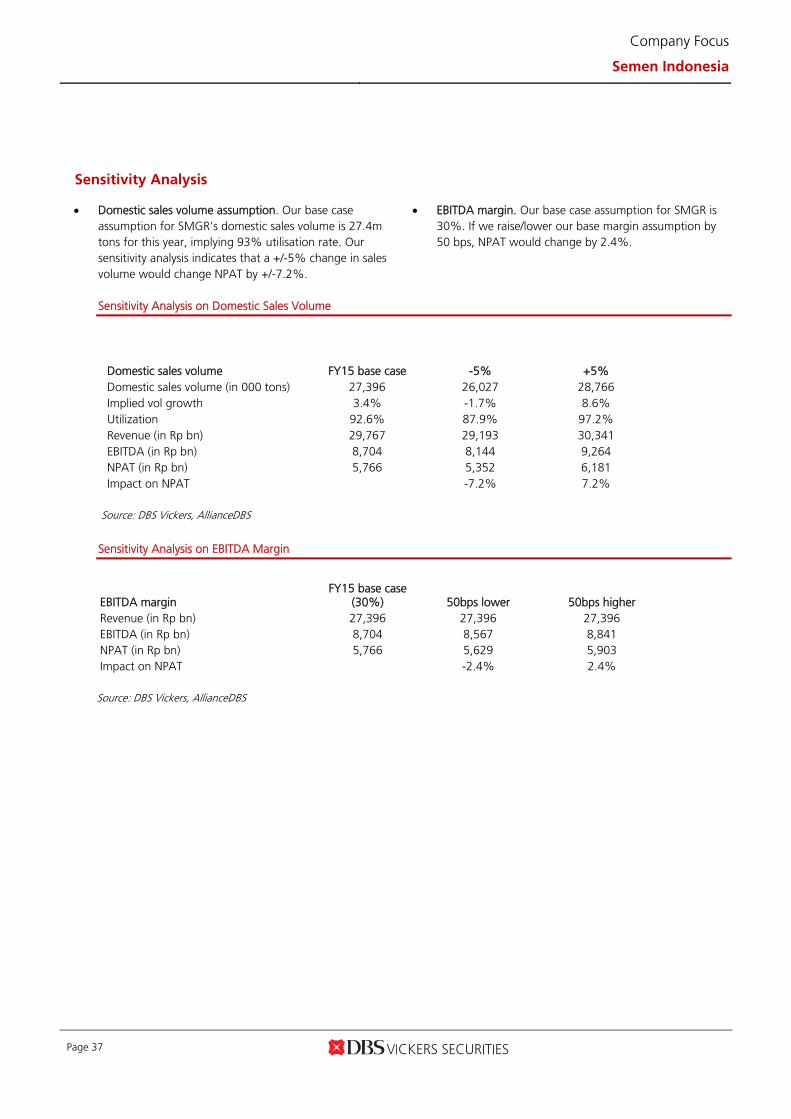
Sensitivity Analysis Domestic sales volume assumption. Our base case
assumption for INTP’s domestic sales volume to be 19.4m tons for this year, implying a utilisation rate of 90.8%. We performed sensitivity analysis and assumed 5% higher and lower sales volume. As a result, NPAT is impacted by +/-3.5%.
EBITDA margin. Our base case assumption for INTP’s EBITDA margin is 33.2%. If we raise/lower our margin assumption by 50 bps, NPAT would be impacted by 2.0%.
Sensitivity Analysis on Domestic Sales Volume
Domestic sales volume FY15 base case -5% +5% Domestic sales volume (in 000 tons) 19,350 18,383 20,318 Implied volume growth 6.4% 1.1% 11.7% Utilisation 90.8% 86.3% 95.3% Revenue (in Rp bn) 22,222 21,224 23,220 EBITDA (in Rp bn) 7,370 7,074 7,666 NPAT (in Rp bn) 5,421 5,230 5,611 Impact on NPAT -3.5% 3.5%
Source: DBS Vickers, AllianceDBS
Sensitivity Analysis on EBITDA Margin
EBITDA margin FY15 base case
(33.2%) 50bps lower 50bps higher Revenue (in Rp bn) 22,222 22,222 22,222 EBITDA (in Rp bn) 7,370 7,259 7,481 NPAT (in Rp bn) 5,421 5,310 5,532 Impact on NPAT -2.0% 2.0%
Source: DBS Vickers, AllianceDBS

Page 22
Company Focus
Indocement Tunggal Prakarsa
Key Assumptions
FY Dec 2011A 2012A 2013A 2014F 2015F 2016F Domestic Sales Vol ('000 tones)
15,122 17,611 17,642 18,189 19,350 20,769
Domestic ASP/tonne (in Rp)
862,953 911,182 958,265 1,001,387 1,031,428 1,075,780
EBITDA margin (%) 36.7 38.3 36.3 34.5 33.2 31.3 Segmental Breakdown
FY Dec 2011A 2012A 2013A 2014F 2015F 2016F Revenues (Rp bn)
Cement 13,260 16,115 17,046 18,316 20,076 22,567
Ready Mix Concrete 1,343 1,934 2,739 2,990 3,486 4,065
Aggregates 71 81 116 139 160 184
Other Businesses (786) (839) (1,209) (1,304) (1,501) (1,727)
Total 13,888 17,290 18,691 20,141 22,222 25,089
Operating profit (Rp bn)
Cement 4,404 5,799 6,139 6,026 6,276 6,503
Ready Mix Concrete (22) 76 (86) 0 70 203
Aggregates 7 2 11 21 24 28
Other Businesses 29 0 0 0 0 0
Total 4,418 5,877 6,064 6,047 6,370 6,734
Operating profit Margins (%)
Cement 33.2 36.0 36.0 32.9 31.3 28.8
Ready Mix Concrete (1.6) 3.9 (3.1) 0.0 2.0 5.0
Aggregates 9.9 2.5 9.2 15.0 15.0 15.0
Other Businesses (3.7) 0.0 0.0 0.0 0.0 0.0
Total 31.8 34.0 32.4 30.0 28.7 26.8
Source: Company, DBS Vickers, AllianceDBS
Sensitivity Analysis 2015
Domestic sales volume +/- 5%
Net Profit +/- 3.5%
EBITDA margin +/- 50bps
Net Profit +/- 2%
Growing RMC business

Page 23
Company Focus
Indocement Tunggal Prakarsa
Income Statement (Rp bn)
FY Dec 2011A 2012A 2013A 2014F 2015F 2016F Revenue 13,888 17,290 18,691 20,141 22,222 25,089
Cost of Goods Sold (7,474) (9,020) (10,037) (11,018) (12,330) (14,219)
Gross Profit 6,414 8,270 8,655 9,123 9,891 10,870
Other Opng (Exp)/Inc (1,987) (2,425) (2,680) (3,076) (3,521) (4,137)
Operating Profit 4,427 5,845 5,975 6,047 6,370 6,734
Other Non Opg (Exp)/Inc (9) 32 89 0 0 0
Associates & JV Inc 8 9 18 19 21 22
Net Interest (Exp)/Inc 282 354 513 742 742 754
Exceptional Gain/(Loss) 0 0 0 0 0 0
Pre-tax Profit 4,708 6,240 6,595 6,808 7,133 7,510
Tax (1,107) (1,476) (1,583) (1,634) (1,712) (1,802)
Minority Interest (5) (3) (2) 0 0 0
Preference Dividend 0 0 0 0 0 0
Net Profit 3,597 4,760 5,010 5,174 5,421 5,707
Net Profit before Except. 3,597 4,760 5,010 5,174 5,421 5,707
EBITDA 5,091 6,619 6,785 6,953 7,370 7,863
Growth
Revenue Gth (%) 24.7 24.5 8.1 7.8 10.3 12.9
EBITDA Gth (%) 9.7 30.0 2.5 2.5 6.0 6.7
Opg Profit Gth (%) 10.1 32.0 2.2 1.2 5.3 5.7
Net Profit Gth (%) 11.5 32.3 5.2 3.3 4.8 5.3
Margins & Ratio
Gross Margins (%) 46.2 47.8 46.3 45.3 44.5 43.3
Opg Profit Margin (%) 31.9 33.8 32.0 30.0 28.7 26.8
Net Profit Margin (%) 25.9 27.5 26.8 25.7 24.4 22.7
ROAE (%) 25.0 27.1 23.7 21.7 21.0 20.5
ROA (%) 21.5 23.3 20.3 18.8 18.4 17.9
ROCE (%) 21.9 24.1 20.5 18.5 18.1 17.8
Div Payout Ratio (%) 30.0 34.8 66.1 66.1 66.1 66.1
Net Interest Cover (x) NM NM NM NM NM NM
Source: Company, DBS Vickers, AllianceDBS
Margins Trend
21.0%
23.0%
25.0%
27.0%
29.0%
31.0%
33.0%
35.0%
2012A 2013A 2014F 2015F 2016F
Operating Margin % Net Income Margin %
We expect margins to keep declining as competition intensifies

Page 24
Company Focus
Indocement Tunggal Prakarsa
Quarterly / Interim Income Statement (Rp bn)
FY Dec 2Q2013 3Q2013 4Q2013 1Q2014 2Q2014 3Q2014 Revenue 4,699 4,430 5,343 4,500 4,999 4,668
Cost of Goods Sold (2,443) (2,385) (2,958) (2,531) (2,764) (2,524)
Gross Profit 2,255 2,045 2,385 1,969 2,235 2,144
Other Oper. (Exp)/Inc (622) (614) (751) (753) (683) (777)
Operating Profit 1,633 1,431 1,635 1,216 1,551 1,367
Other Non Opg (Exp)/Inc 0 0 0 0 0 0
Associates & JV Inc 4 5 5 4 6 7
Net Interest (Exp)/Inc 117 105 172 218 215 180
Exceptional Gain/(Loss) 0 0 0 0 0 0
Pre-tax Profit 1,754 1,541 1,812 1,438 1,773 1,554
Tax (479) (354) (409) (307) (390) (348)
Minority Interest (1) 0 (1) (1) (2) 0
Net Profit 1,275 1,187 1,402 1,129 1,380 1,206
Net profit bef Except. 1,275 1,187 1,402 1,129 1,380 1,206
EBITDA 1,838 1,632 1,843 1,427 1,775 1,580
Growth
Revenue Gth (%) 11.4 (5.7) 20.6 (15.8) 11.1 (6.6)
EBITDA Gth (%) 17.8 (11.2) 12.9 (22.5) 24.4 (11.0)
Opg Profit Gth (%) 19.6 (12.4) 14.2 (25.6) 27.6 (11.9)
Net Profit Gth (%) 11.2 (6.9) 18.1 (19.4) 22.2 (12.6)
Margins
Gross Margins (%) 48.0 46.2 44.6 43.8 44.7 45.9
Opg Margins (%) 34.8 32.3 30.6 27.0 31.0 29.3
Net Profit Margins (%) 27.1 26.8 26.2 25.1 27.6 25.8
Revenue Trend
Source: Company, DBS Vickers, AllianceDBS
-20%
-15%
-10%
-5%
0%
5%
10%
15%
20%
25%
0
1,000
2,000
3,000
4,000
5,000
6,000
2Q
20
12
3Q
20
12
4Q
20
12
1Q
20
13
2Q
20
13
3Q
20
13
4Q
20
13
1Q
20
14
2Q
20
14
3Q
20
14
Revenue Revenue Growth % (QoQ)
1Q is seasonally weakest

Page 25
Company Focus
Indocement Tunggal Prakarsa
Balance Sheet (Rp bn)
FY Dec 2011A 2012A 2013A 2014F 2015F 2016F Net Fixed Assets 7,638 7,935 9,305 10,399 11,899 13,270
Invts in Associates & JVs 0 0 0 0 0 0
Other LT Assets 199 241 456 456 456 456
Cash & ST Invts 6,865 10,474 12,595 12,600 12,798 13,131
Inventory 1,328 1,470 1,474 1,790 2,004 2,310
Debtors 1,977 2,455 2,519 2,813 3,104 3,505
Other Current Assets 146 180 259 300 338 391
Total Assets 18,151 22,755 26,607 28,359 30,598 33,063
ST Debt
0 0 0 0 0 0
Other Current Liab 1,477 2,419 2,740 2,631 2,871 3,212
LT Debt 131 108 93 93 93 93
Other LT Liabilities 809 809 797 797 797 797
Shareholder’s Equity 15,706 19,388 22,947 24,808 26,808 28,930
Minority Interests 28 31 30 30 30 30
Total Cap. & Liab. 18,151 22,755 26,607 28,359 30,598 33,063
Non-Cash Wkg. Capital 1,973 1,687 1,511 2,273 2,574 2,994
Net Cash/(Debt) 6,733 10,366 12,502 12,507 12,705 13,038
Debtors Turn (avg days) 44.4 46.8 48.6 48.3 48.6 48.1
Creditors Turn (avg days) 37.8 48.0 53.5 49.8 47.4 46.9
Inventory Turn (avg days) 70.4 61.9 58.2 58.9 61.1 60.1
Asset Turnover (x) 0.8 0.8 0.8 0.7 0.8 0.8
Current Ratio (x) 7.0 6.0 6.1 6.7 6.4 6.0
Quick Ratio (x) 6.0 5.3 5.5 5.9 5.5 5.2
Net Debt/Equity (X) CASH CASH CASH CASH CASH CASH
Net Debt/Equity ex MI (X) CASH CASH CASH CASH CASH CASH
Capex to Debt (%) 390.1 886.6 2,161.0 2,155.2 2,694.1 2,694.1
Z-Score (X) 22.7 14.3 16.8 15.8 14.7 NA
Source: Company, DBS Vickers, AllianceDBS
Asset Breakdown (2014)
Net Fixed Assets -37.7%
Assocs'/JVs -0.0%
Bank, Cash and Liquid
Assets -45.6%
Inventory -6.5%
Debtors -10.2%
Strong balance sheet
Page 26
Company Focus
Indocement Tunggal Prakarsa
Cash Flow Statement (Rp bn)
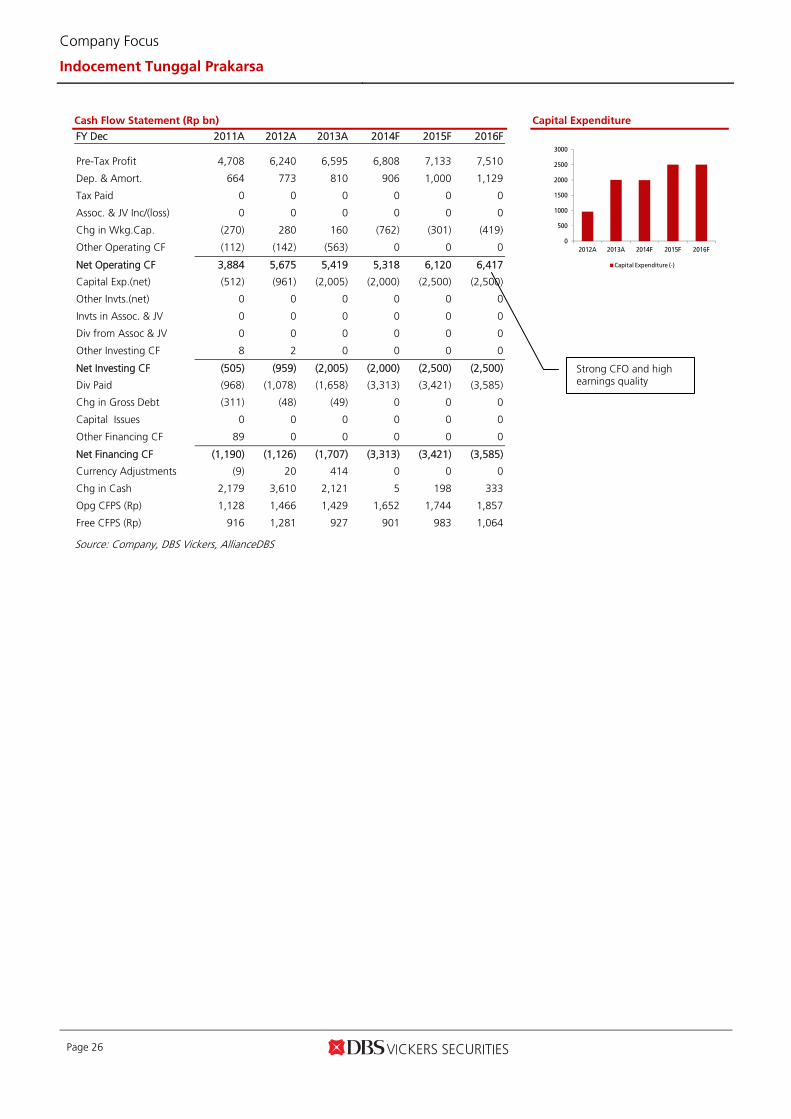
FY Dec 2011A 2012A 2013A 2014F 2015F 2016F Pre-Tax Profit 4,708 6,240 6,595 6,808 7,133 7,510
Dep. & Amort. 664 773 810 906 1,000 1,129
Tax Paid 0 0 0 0 0 0
Assoc. & JV Inc/(loss) 0 0 0 0 0 0
Chg in Wkg.Cap. (270) 280 160 (762) (301) (419)
Other Operating CF (112) (142) (563) 0 0 0
Net Operating CF 3,884 5,675 5,419 5,318 6,120 6,417
Capital Exp.(net) (512) (961) (2,005) (2,000) (2,500) (2,500)
Other Invts.(net) 0 0 0 0 0 0
Invts in Assoc. & JV 0 0 0 0 0 0
Div from Assoc & JV 0 0 0 0 0 0
Other Investing CF 8 2 0 0 0 0
Net Investing CF (505) (959) (2,005) (2,000) (2,500) (2,500)
Div Paid (968) (1,078) (1,658) (3,313) (3,421) (3,585)
Chg in Gross Debt (311) (48) (49) 0 0 0
Capital Issues 0 0 0 0 0 0
Other Financing CF 89 0 0 0 0 0
Net Financing CF (1,190) (1,126) (1,707) (3,313) (3,421) (3,585)
Currency Adjustments (9) 20 414 0 0 0
Chg in Cash 2,179 3,610 2,121 5 198 333
Opg CFPS (Rp) 1,128 1,466 1,429 1,652 1,744 1,857
Free CFPS (Rp) 916 1,281 927 901 983 1,064
Source: Company, DBS Vickers, AllianceDBS
Capital Expenditure
0
500
1000
1500
2000
2500
3000
2012A 2013A 2014F 2015F 2016F
Capital Expenditure (-)
Strong CFO and high earnings quality

Page 27
Company Focus
Indocement Tunggal Prakarsa
Valuation Initiate coverage: FULLY VALUED, TP Rp20,200. We peg our TP to 13x FY16 EPS (slightly more than 1 sd below its 5 year mean P/E to reflect the slowing earnings growth). INTP is currently trading at c.16x (5 year mean) 12M forward
P/E. We believe the stock faces derating from the current rich valuation as its earnings growth slow to c.5% CAGR (FY14-17) from c.16% (FY09-13).
INTP’s 12M forward P/E band
Source: Bloomberg Finance LP, DBS Vickers, AllianceDBS INTP’s 12M forward EV/EBITDA band
Source: Bloomberg Finance LP, DBS Vickers, AllianceDBS
8.0
12.0
16.0
20.0
Jan-10 Jan-11 Jan-12 Jan-13 Jan-14 Jan-15
(x)Peak = 20.3x
Trough = 9.2x
Current = 15.9x
Mean = 15.4x
5.0
8.0
11.0
14.0
Jan-10 Jan-11 Jan-12 Jan-13 Jan-14 Jan-15
(x)
Peak = 13.2x
Mean = 10x
Trough = 5.7x
Current = 10.4x

www.dbsvickers.com ed: SGC / sa: MA
FULLY VALUED Rp14,675 JCI : 5,325.50 (Initiating Coverage) Price Target : 12-Month Rp 12,200 Reason for Report : Initiating coverage Potential Catalyst: Strong property sales, lower coal and oil price Analyst Deidy WIJAYA +6221 3003 4931 [email protected]
CHONG Tjen San, CFA +603 2604 3972 [email protected]
Price Relative
Forecasts and Valuation FY Dec (Rp bn) 2013A 2014F 2015F 2016F Revenue 24,501 27,132 29,035 31,910 EBITDA 8,099 8,451 8,704 9,197 Pre-tax Profit 6,920 7,256 7,459 7,806 Net Profit 5,370 5,604 5,766 6,040 Net Pft (Pre Ex.) 5,370 5,604 5,766 6,040 EPS (Rp) 905 945 972 1,018 EPS Pre Ex. (Rp) 905 945 972 1,018 EPS Gth (%) 11 4 3 5 EPS Gth Pre Ex (%) 11 4 3 5 Diluted EPS (Rp) 905 945 972 1,018 Net DPS (Rp) 407 425 437 458 BV Per Share (Rp) 3,521 4,058 4,605 5,186 PE (X) 16.2 15.5 15.1 14.4 PE Pre Ex. (X) 16.2 15.5 15.1 14.4 P/Cash Flow (X) 14.4 13.6 12.5 11.9 EV/EBITDA (X) 10.8 10.3 9.9 9.3 Net Div Yield (%) 2.8 2.9 3.0 3.1 P/Book Value (X) 4.2 3.6 3.2 2.8 Net Debt/Equity (X) CASH CASH CASH CASH ROAE (%) 28.1 24.9 22.4 20.8 Earnings Rev (%): - - - Consensus EPS (Rp): 956 1,032 1,183 No. of brokers following: B: 20 S: 8 H: 6 ICB Industry : Industrials ICB Sector: Construction & Materials Principal Business: Semen Gresik (SMGR IJ) : SMGR was established in 1957. In 1995 the company completed an acquisition of Semen Padang and Semen Tonasa. It is currently the largest player in the market with 40.7% market share.
Source of all data: Company, DBS Vickers, Bloomberg Finance L.P
At A Glance Issued Capital (m shrs) 5,932 Mkt. Cap (Rpbn/US$m) 87,045 / 6,823 Major Shareholders Govt. of Indonesia (%) 60.0 Free Float (%) 40.0 Avg. Daily Vol.(‘000) 8,405
DBS Group Research . Equity 17 Feb 2015
Indonesia Company Focus
Semen Indonesia Bloomberg: SMGR IJ | Reuters: SMGR.JK Refer to important disclosures at the end of this report
Market lead under pressure Pole position under pressure
Further margin degradation as pricing power erodes
Expensive at 15x/14x FY15/16F EPS given pedestrian growth
Initiate coverage: FULLY VALUED, TP Rp12,200 (pegged to 12x FY16F EPS)
Market lead will be eroded. Semen Indonesia (SMGR) currently leads with 44% share of cement sales in Indonesia. But this will be eroded gradually after the anticipated new capacities come on stream in 2016. We estimate its market share would shrink to 41% by 2017, partly mitigated by its strong and established brand equity. SMGR sells cement under three brands, “Semen Gresik”, “Semen Padang” and “Semen Tonasa” which have strong brand equities in Java, Sumatra and Sulawesi, respectively. Also, the different price points for each brand allow the company to tap different market segments to maximise its market share. Hurt least by rising competition, but not spared. SMGR sells 52% of its output to Java vs 72% for Indocement and 71% for Holcim. It also has >30% market share on the major islands in Indonesia. Hence, it should be less affected by incoming competition which will be mainly in Java. However, its margins will not be spared; we anticipate they will drop to 30% by this year from 33.1% and 31.1% in FY13-14F. This also takes into account the 4-5% mandated price cuts by Jokowi for bag cement, which effectively offset potential savings arising from lower electricity and diesel costs.
High valuation unwarranted given slowing growth.
SMGR is currently trading 15x 12M forward P/E (5 year mean), despite much slower earnings growth of c.5% CAGR over FY14-17 vs. 13.9% over FY09-13. The stock is likely to be derated as earnings growth will be at its slowest since 2004.
81
101
121
141
161
181
201
221
6,930.0
8,930.0
10,930.0
12,930.0
14,930.0
16,930.0
18,930.0
Feb-11 Feb-12 Feb-13 Feb-14 Feb-15
Relative IndexRp
Semen Gresik (LHS) Relative JCI INDEX (RHS)

Page 29
Company Focus
Semen Indonesia
INVESTMENT THESIS
Profile Rationale
Semen Indonesia (SMGR) is the largest cement player in Indonesia with >40% market share. It has production facilities on three key islands (Java, Sumatra and Sulawesi) and solid distribution channels, which enables it to command high market shares throughout Indonesia. SMGR sells cement under three brands, “Semen Gresik”, “Semen Padang” and “Semen Tonasa” which have strong brand equities in Java, Sumatra and Sulawesi, respectively.
Cement industry is facing an unprecedented structural shift We estimate new supply to be more than double of new
demand, bringing utilisation down from 89% to 74% by 2017.
Margin projected to keep sliding due to weakening pricing power and increasing contribution from bulk cement 3 major players are entering Indonesia – Semen Merah
Putih (Wilmar Group), Anhui Conch and Siam Cement. Anhui Conch and Siam Cement are market leaders in China and Thailand respectively. With their Indonesia plants contributing only c.3% to their total capacities, there could be price war once their plants come on stream as they try to gain market share.
The fast growing segment in Indonesia is the bulk segment (contribution estimated to rise from 22% to 27% by FY17), which is used for infrastructure projects and high rise buildings. With less barriers to entry (brand equity and distribution channels), this segment (which already commands lower margins) will be the likely target for the new entrants.
Benefits from low energy prices offset by lower ASP After Jokowi recently instructed SOE cement companies
to reduce bag cement price by Rp3,000/bag (cut by 4-5%), the positive impact from lower energy prices are wiped out. We also fear Jokowi would continue to control SMGR’s and SMBR’s cement prices, and erase prospects of higher margins as a result of lower costs.
Rich valuations unwarranted given slower growth and declining ROE SMGR is currently trading at 15x 12M forward P/E (5 year
mean) despite the slowest earnings growth expected in a decade.
Valuation Risks
Our target price of Rp12,200 is pegged to 12x FY16 EPS (-1 sd of 5 year mean). Initiate with FULLY VALUED call as there is more than 10% downside from the current price
Weak demand due to slow rollout of infrastructure projects If the new government fails in speeding up infrastructure
developments, cement demand growth could disappoint and hurt SMGR’s utilisation rates and profitability.
Timely completion of facilities SMGR plans to increase capacity by c.25% over the next
three years. Delays could cause SMGR to lose market share.
Expansion outside Indonesia facing some risks We believe that SMGR faces some country and political
risks as it expands into Vietnam and Myanmar. Also, the expansion will reduce SMGR’s profitability as ASPs are much lower in these countries.
Source: DBS Vickers, AllianceDBS

Page 30
Company Focus
Semen Indonesia
SWOT Analysis
Strengths Weakness
Largest market share in the industry. SMGR had 44% market share in FY14. It has production facilities on three key islands (Java, Sumatra and Sulawesi) and solid distribution channels, which enables it to command high market shares throughout Indonesia.
Expansion beyond Indonesia may pressure margins as ASPs in other countries are much lower than in Indonesia. Higher transportation costs than INTP and SMCB as its distribution covers a wider area.
Opportunities Threats
Large growth opportunities outside Java. Eastern Indonesia is growing rapidly due to the low base. SMGR will be the main beneficiary when that market starts to generate meaningful contribution as it is already building brand equity and distribution networks in those regions.
Entry of new players such as Anhui Conch, Siam Cement, Semen Merah Putih could disrupt the oligopoly structure of Indonesia’s cement sector. Potential price war if the competitors decide to fight for market share. Government intervention to lower prices, as demonstrated recently for bag cement.
Source: DBS Vickers, AllianceDBS
Page 31
Company Focus
Semen Indonesia
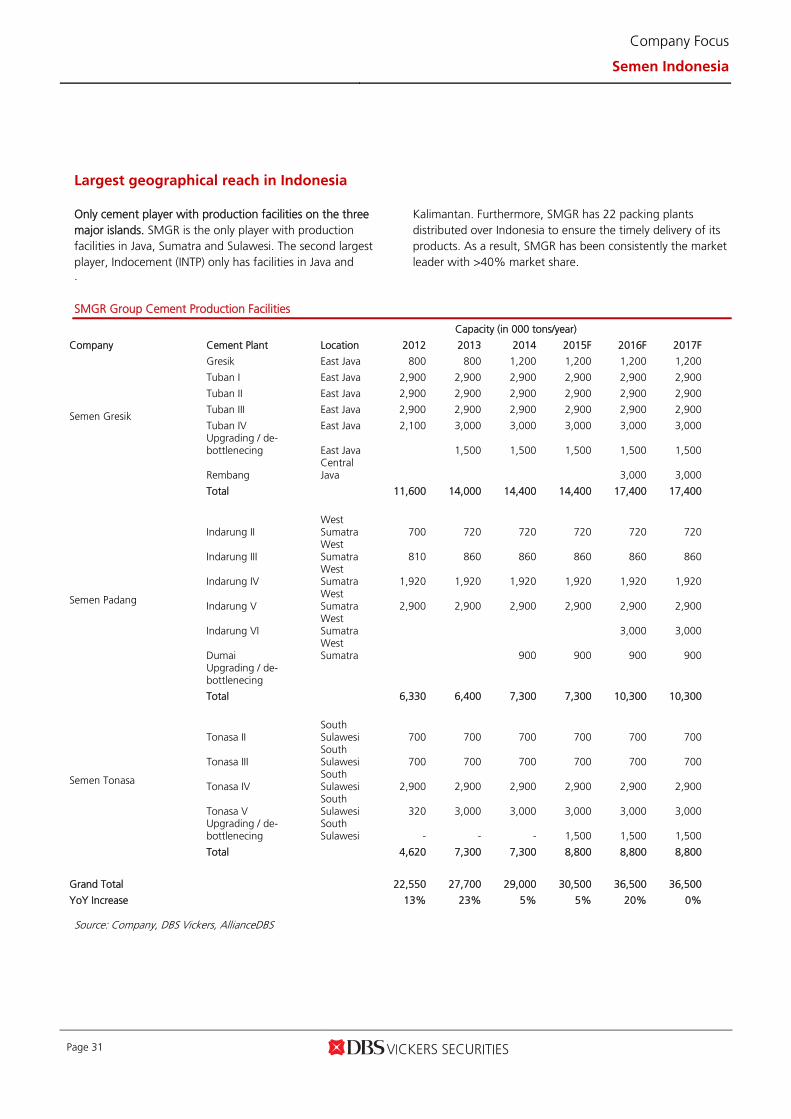
Largest geographical reach in Indonesia Only cement player with production facilities on the three major islands. SMGR is the only player with production facilities in Java, Sumatra and Sulawesi. The second largest player, Indocement (INTP) only has facilities in Java and
Kalimantan. Furthermore, SMGR has 22 packing plants distributed over Indonesia to ensure the timely delivery of its products. As a result, SMGR has been consistently the market leader with >40% market share.
. SMGR Group Cement Production Facilities
Capacity (in 000 tons/year)
Company Cement Plant Location 2012 2013 2014 2015F 2016F 2017F
Semen Gresik
Gresik East Java 800 800 1,200 1,200 1,200 1,200
Tuban I East Java 2,900 2,900 2,900 2,900 2,900 2,900
Tuban II East Java 2,900 2,900 2,900 2,900 2,900 2,900
Tuban III East Java 2,900 2,900 2,900 2,900 2,900 2,900
Tuban IV East Java 2,100 3,000 3,000 3,000 3,000 3,000 Upgrading / de-bottlenecing East Java 1,500 1,500 1,500 1,500 1,500
Rembang Central Java 3,000 3,000
Total 11,600 14,000 14,400 14,400 17,400 17,400
Semen Padang
Indarung II West Sumatra 700 720 720 720 720 720
Indarung III West Sumatra 810 860 860 860 860 860
Indarung IV West Sumatra 1,920 1,920 1,920 1,920 1,920 1,920
Indarung V West Sumatra 2,900 2,900 2,900 2,900 2,900 2,900
Indarung VI West Sumatra 3,000 3,000
Dumai West Sumatra 900 900 900 900
Upgrading / de-bottlenecing
Total 6,330 6,400 7,300 7,300 10,300 10,300
Semen Tonasa
Tonasa II South Sulawesi 700 700 700 700 700 700
Tonasa III South Sulawesi 700 700 700 700 700 700
Tonasa IV South Sulawesi 2,900 2,900 2,900 2,900 2,900 2,900
Tonasa V South Sulawesi 320 3,000 3,000 3,000 3,000 3,000
Upgrading / de-bottlenecing
South Sulawesi - - - 1,500 1,500 1,500
Total 4,620 7,300 7,300 8,800 8,800 8,800
Grand Total 22,550 27,700 29,000 30,500 36,500 36,500
YoY Increase 13% 23% 5% 5% 20% 0% Source: Company, DBS Vickers, AllianceDBS

Page 32
Company Focus
Semen Indonesia
SMGR Group Sales Volume and Market Share
Source: Company, DBS Vickers, AllianceDBS Multi-brand strategy to maximise market share. Unlike INTP and SMCB which sell under one brand name, SMGR sells its products under three different brands. The main reason for this is that all three brands have strong brand equities in their respective regions before SMGR acquired Semen Padang and Semen Tonasa. Each brand has a different geographical focus: Semen Gresik on Java and Kalimantan, Semen Padang
on Sumatra, Jakarta and West Java, and Semen Tonasa on Sulawesi, Kalimantan and East Indonesia. Furthermore, because of their different price points, SMGR is able to maximise market share by capturing customers from different market segments. Semen Gresik is the group’s premium brand, while Semen Padang and Semen Tonasa are priced c.5% cheaper.
Primary Markets for SG, SP and ST Company Plant Location Primary Markets
Semen Gresik East Java Java, Kalimantan Semen Padang West Sumatra Sumatra, Jakarta, West Java Semen Tonasa South Sulawesi Sulawesi, Kalimantan, Eastern
Indonesia Source: Company, DBS Vickers, AllianceDBS
38%
39%
40%
41%
42%
43%
44%
45%
46%
47%
0
5,000
10,000
15,000
20,000
25,000
30,000
35,000
Semen Gresik Semen Padang Semen Tonasa SMGR's market share (RHS)

Page 33
Company Focus
Semen Indonesia
Less dependent on Java than Indocement and Holcim
Java only contributes c.50% of SMGR’s sales volume. This is much smaller than for Indocement (72%) and Holcim (71%). Therefore, SMGR should be affected less by the incoming new supply and competition from new players, which will be
concentrated in Java. By island, SMGR is also the market leader (by sales volume) on all the major islands (Java, Sumatra, Sulawesi, Kalimantan).
Sales volume by region
Source: ASI, DBS Vickers, AllianceDBS
FY14 Market Share of Cement Companies By Region
Region SMGR INTP SMCB Bosowa Andalas Baturaja Kupang
Java 40.4% 38.8% 18.3% 2.3% 0.0% 0.0% 0.0%
Sumatra 42.9% 14.1% 14.7% 3.2% 15.0% 10.1% 0.0%
Kalimantan 50.2% 29.6% 11.1% 9.1% 0.0% 0.0% 0.0%
Sulawesi 63.1% 13.3% 0.9% 22.7% 0.0% 0.0% 0.0%
Others 43.8% 29.9% 4.1% 18.5% 0.0% 0.0% 3.7%
Total Indonesia 43.7% 30.4% 14.6% 5.8% 3.1% 2.1% 0.3% Source: ASI, DBS Vickers, AllianceDBS
52.1%
72.0% 70.7%56.3%
20.5%
9.7%20.9%
20.9%
8.7%
7.4%
5.8%
7.6%10.9%
3.3%0.4%
7.6%
7.7% 7.6% 2.2% 7.6%
SMGR INTP SMCB National
Java Sumatra Kalimantan Sulawesi Others

Page 34
Company Focus
Semen Indonesia
Company Background Corporate History. Semen Indonesia (formerly known as Semen Gresik) started in 1957 as a state-owned company with an installed capacity of 250,000 tons. The government completed the IPO over 20 years ago by releasing 27% of its
shares to the public. In 1995, Semen Indonesia increased its capacity significantly by acquiring PT Semen Padang and PT Semen Tonasa. In 1998, the public float increased as the government pared down its stake to 51%.
Sales Trend Profitability Trend
Source: Company, DBS Vickers, AllianceDBS Capacity. Semen Indonesia (SMGR) is currently the largest cement producer in Indonesia with 29m tons/year installed capacity (40% of national installed capacity). It has integrated facilities in East Java, West Sumatra and South Sulawesi, and is building a new facility in Central Java.
East Java is the largest contributor. The company’s largest single largest contributor is East Java. More than 20% of the group’s output is sold to East Java, where it has >70% market share.
0.0%
5.0%
10.0%
15.0%
20.0%
25.0%
30.0%
0
5,000
10,000
15,000
20,000
25,000
30,000
2012A 2013A 2014F 2015F 2016F
Rp bn
Total Revenue Revenue Growth (%) (YoY)
4,847
5,347
5,847
6,347
6,847
7,347
2012A 2013A 2014F 2015F 2016F
Rp bn
Operating EBIT Pre tax Profit Net Profit

Page 35
Company Focus
Semen Indonesia
Key Management Team
Suparni President Director Suparni was born on December 13, 1958. He was appointed as a Director of the Company at the 2015 EGM. He was previously the Director of Production and R & D. Current tenure as Director will expire in 2017. He joined the Company in 1986. He was previously the Head Compartment Tuban (2007), Head of Corporate Development Department (2006-2007), and Head of Production II Tuban (2002-2006). He has a Bachelor’s degree in Electrical Engineering from ITS Surabaya.
Ahyanizzaman Director Ahyanizzaman was born on July 6, 1966. He was appointed as Director of
Finance at the EGM on 11 March 2011; the term will end in 2016. He previously served as Head of the Finance Division (2006-2010), Head of Finance and Accounting (2010-2011), Head of Financial Accounting (2006-2007), Head of Accounting (2004-2006), and Acting Head of Accounting (2002). He joined the Company in 1991. He has a Bachelor degree in accounting from Airlangga University, Surabaya.
Amat Pria Darma Director Amat Men Darma was born on August 13, 1961. He was appointed as a
member of the Board of Directors in 2012 and his current term will expire in 2017. Previously, he served as Head of Distribution and Transportation Department. He started his career in PT Semen Gresik (Persero) Tbk in 1986. He graduated with Bachelor of Chemical Engineering degree from Institut Teknologi Sepuluh Nopember in 1985.
Gatot Kustyadji Director Gatot Kustyadji was born on July 25, 1963. He was appointed as a member
of the Board of Directors at the 2014 AGM; the current term expires in 2019. Previously, he served as Director of Research and Development at PT Semen Tonasa (2005-2010), Director of Research and Development and Operations at PT Semen Tonasa (2011-2012), Production Director at PT Semen Tonasa (2012-2014), and Director at PT. Semen Gresik. He has a Chemical Engineering degree from Institut Teknologi Sepuluh Nopember and a Bachelor’s degree in Management from University of Indonesia. He has a Master degree in Economic Planning and Development from University of Andalas. He received his Doctorate degree in the field of human resources from Universitas Brawijaya.
Johan Samudra Director Johan Samudra was born on June 22, 1956. He was appointed as a
member of the Board of Directors at the 2014 AGM; the current term expires in 2019. Previously, he served as CEO of Thang Long Cement Vietnam, Director of Research and Development at PT Semen Padang (2003-2005), and as GM Capex Management Group at PT Semen Gresik. He has a Master’s degree in Financial Management from Andalas University.
Rizkan Chandra Director Rizkan Chandra was born in Jakarta on January 27, 1969. He was
appointed as a member of the Board of Directors at the EGM in 2015. Previously, he served as Director of Network, IT & Solution PT Telekomunikasi Indonesia (Persero) Tbk, Commissioner of PT Telkomsel and Director of PT Sigma Cipta Caraka. He has a Bachelor’s degree in Computer Science from Institut Teknologi Bandung (ITB) and a MSc in Management of Technology from National University of Singapore.
Source: Company, DBS Vickers, AllianceDBS

Page 36
Company Focus
Semen Indonesia
Key Business Risks Weak demand growth due to slow rollout of infrastructure projects. If the new government does not live up to expectation in speeding up infrastructure developments, cement demand growth could disappoint and hurt SMGR’s utilisation rates and profitability. Timely completion of facilities. SMGR plans to increase capacity by c.25% over the next three years. Delays could cause SMGR to lose market share.
Expansion outside Indonesia facing some risks. SMGR has decided to expand beyond Indonesia by acquiring Thang Long (a Vietnam-based cement producer) at the end of 2012 The management also indicated that they are looking at countries such as Myanmar and Bangladesh for future acquisitions. However, we believe that SMGR faces some political risks in these countries. Also, the expansion will reduce SMGR’s profitability as ASPs are much lower in these countries.
Upside Risks to Our Call
Strong rebound in property sales. We expect domestic property sales volume to register flattish growth for this year as there are plenty of headwinds in the near term – upward trend in BI rate, regulations and liquidity tightening risk as well as cost pressure from fuel subsidy removal. If property sales actually rebound strongly this year, there would be upside risk to our cement sales volume assumption as property is the biggest contributor to cement consumption. Further drop in oil and coal price. If coal and oil price continues their downtrend, SMGR would benefit in the short term. Roughly 40% of its cash cost are linked to coal and oil
price. Should coal and oil continue their downtrend, there would be upside to our margin and earnings assumptions for this year. Significant delay in new players’ Greenfield projects. If the new players’ Greenfield projects are delayed or cancelled, our incremental supply assumption would be overstated and cement utilization rate would be understated. Competition could be less severe than our assumption and thus pricing power would be higher than we predicted.
Page 37
Company Focus
Semen Indonesia
Sensitivity Analysis Domestic sales volume assumption. Our base case
assumption for SMGR’s domestic sales volume is 27.4m tons for this year, implying 93% utilisation rate. Our sensitivity analysis indicates that a +/-5% change in sales volume would change NPAT by +/-7.2%.
EBITDA margin. Our base case assumption for SMGR is 30%. If we raise/lower our base margin assumption by 50 bps, NPAT would change by 2.4%.
Sensitivity Analysis on Domestic Sales Volume
Domestic sales volume FY15 base case -5% +5% Domestic sales volume (in 000 tons) 27,396 26,027 28,766 Implied vol growth 3.4% -1.7% 8.6% Utilization 92.6% 87.9% 97.2% Revenue (in Rp bn) 29,767 29,193 30,341 EBITDA (in Rp bn) 8,704 8,144 9,264 NPAT (in Rp bn) 5,766 5,352 6,181 Impact on NPAT -7.2% 7.2%
Source: DBS Vickers, AllianceDBS
Sensitivity Analysis on EBITDA Margin
EBITDA margin FY15 base case
(30%) 50bps lower 50bps higher Revenue (in Rp bn) 27,396 27,396 27,396 EBITDA (in Rp bn) 8,704 8,567 8,841 NPAT (in Rp bn) 5,766 5,629 5,903 Impact on NPAT -2.4% 2.4%
Source: DBS Vickers, AllianceDBS

Page 38
Company Focus
Semen Indonesia
Key Assumptions
FY Dec 2011A 2012A 2013A 2014F 2015F 2016F Domestic Sales Volume (in 000 tons)
19,586 22,477 25,450 26,485 27,396 28,880
Domestic ASP/tonne (in Rp) 819,929 850,692 904,542 954,291 978,149 1,017,275
EBITDA margin (%) 33.0 35.0 33.1 31.1 30.0 28.8 Segmental Breakdown
FY Dec 2011A 2012A 2013A 2014F 2015F 2016F Revenues (Rp bn)
Cement 16,179 19,195 24,152 26,614 28,439 31,225
Others 200 404 370 518 596 686
Total 16,379 19,598 24,522 27,132 29,035 31,910
Operating profit (Rp bn)
Cement 4,808 5,947 6,998 7,100 7,278 7,560
Others 29 162 (26) 104 119 137
Total 4,838 6,109 6,972 7,204 7,397 7,697
Operating profit Margins (%)
Cement 29.7 31.0 29.0 26.7 25.6 24.2
Others 14.7 40.0 (7.0) 20.0 20.0 20.0
Total 29.5 31.2 28.4 26.6 25.5 24.1
Source: Company, DBS Vickers
Sensitivity Analysis 2015
Domestic sales volume +/- 5%
Net Profit +/- 7.2%
EBITDA margin +/- 50bps
Net Profit +/- 2.4%
Cement contributes 98% of SMGR’s revenue

Page 39
Company Focus
Semen Indonesia
Income Statement (Rp bn)
FY Dec 2011A 2012A 2013A 2014F 2015F 2016F Revenue 16,379 19,598 24,501 27,132 29,035 31,910
Cost of Goods Sold (8,892) (10,301) (13,557) (15,445) (16,686) (18,757)
Gross Profit 7,487 9,298 10,944 11,687 12,349 13,153
Other Opng (Exp)/Inc (2,649) (3,189) (3,972) (4,484) (4,951) (5,456)
Operating Profit 4,838 6,109 6,972 7,204 7,397 7,697
Other Non Opg (Exp)/Inc 55 73 91 80 80 80
Associates & JV Inc 15 28 35 39 43 49
Net Interest (Exp)/Inc 183 78 (177) (67) (61) (19)
Exceptional Gain/(Loss) 0 0 0 0 0 0
Pre-tax Profit 5,090 6,287 6,920 7,256 7,459 7,806
Tax (1,135) (1,361) (1,566) (1,642) (1,688) (1,767)
Minority Interest (30) (79) 16 (10) (5) 0
Preference Dividend 0 0 0 0 0 0
Net Profit 3,926 4,847 5,370 5,604 5,766 6,040
Net Profit before Except. 3,926 4,847 5,370 5,604 5,766 6,040
EBITDA 5,402 6,869 8,099 8,451 8,704 9,197
Growth
Revenue Gth (%) 14.2 19.7 25.0 10.7 7.0 9.9
EBITDA Gth (%) 8.7 27.2 17.9 4.4 3.0 5.7
Opg Profit Gth (%) 7.8 26.3 14.1 3.3 2.7 4.0
Net Profit Gth (%) 8.1 23.5 10.8 4.4 2.9 4.7
Margins & Ratio
Gross Margins (%) 45.7 47.4 44.7 43.1 42.5 41.2
Opg Profit Margin (%) 29.5 31.2 28.5 26.6 25.5 24.1
Net Profit Margin (%) 24.0 24.7 21.9 20.7 19.9 18.9
ROAE (%) 29.7 30.5 28.1 24.9 22.4 20.8
ROA (%) 22.3 21.0 18.7 17.2 16.1 15.3
ROCE (%) 25.2 24.6 22.5 20.5 19.0 17.8
Div Payout Ratio (%) 50.0 45.0 45.0 45.0 45.0 45.0
Net Interest Cover (x) NM NM 39.4 108.3 120.7 408.4
Source: Company, DBS Vickers
Margins Trend
17.0%
19.0%
21.0%
23.0%
25.0%
27.0%
29.0%
31.0%
33.0%
2012A 2013A 2014F 2015F 2016F
Operating Margin % Net Income Margin %
We expect margins and ROE to decline as competition intensify

Page 40
Company Focus
Semen Indonesia
Quarterly / Interim Income Statement (Rp bn)
FY Dec 2Q2013 3Q2013 4Q2013 1Q2014 2Q2014 3Q2014 Revenue 5,878 5,969 7,110 6,178 6,708 6,463
Cost of Goods Sold (3,217) (3,275) (4,006) (3,503) (3,620) (3,776)
Gross Profit 2,661 2,694 3,104 2,675 3,088 2,688
Other Oper. (Exp)/Inc (900) (956) (1,236) (1,021) (1,137) (1,083)
Operating Profit 1,762 1,737 1,868 1,655 1,950 1,604
Other Non Opg (Exp)/Inc 18 34 32 (75) 26 58
Associates & JV Inc 9 9 10 7 8 7
Net Interest (Exp)/Inc (40) (46) (55) (3) (8) (27)
Exceptional Gain/(Loss) 0 0 0 0 0 0
Pre-tax Profit 1,748 1,734 1,855 1,584 1,977 1,642
Tax (387) (379) (452) (354) (420) (326)
Minority Interest 6 0 2 (2) (7) 4
Net Profit 1,366 1,356 1,406 1,228 1,549 1,320
Net profit bef Except. 1,366 1,356 1,406 1,228 1,549 1,320
EBITDA 2,014 2,014 2,202 1,968 2,271 1,950
Growth
Revenue Gth (%) 6.0 1.5 19.1 (13.1) 8.6 (3.6)
EBITDA Gth (%) 7.8 0.0 9.4 (10.6) 15.4 (14.2)
Opg Profit Gth (%) 9.7 (1.4) 7.5 (11.4) 17.9 (17.7)
Net Profit Gth (%) 16.8 (0.8) 3.7 (12.6) 26.1 (14.8)
Margins
Gross Margins (%) 45.3 45.1 43.7 43.3 46.0 41.6
Opg Margins (%) 30.0 29.1 26.3 26.8 29.1 24.8
Net Profit Margins (%) 23.2 22.7 19.8 19.9 23.1 20.4
Revenue Trend
Source: Company, DBS Vickers
-15%
-10%
-5%
0%
5%
10%
15%
20%
25%
0
1,000
2,000
3,000
4,000
5,000
6,000
7,000
8,000
2Q
20
12
3Q
20
12
4Q
20
12
1Q
20
13
2Q
20
13
3Q
20
13
4Q
20
13
1Q
20
14
2Q
20
14
3Q
20
14
Revenue Revenue Growth % (QoQ)
Margin has been trending down

Page 41
Company Focus
Semen Indonesia
Balance Sheet (Rp bn)
FY Dec 2011A 2012A 2013A 2014F 2015F 2016F Net Fixed Assets 11,641 16,794 18,863 21,615 23,808 25,809
Invts in Associates & JVs 0 0 0 0 0 0
Other LT Assets 375 1,554 1,958 1,958 1,958 1,958
Cash & ST Invts 3,682 3,317 4,213 3,846 4,433 5,821
Inventory 2,007 2,285 2,646 3,314 3,580 4,025
Debtors 1,864 2,523 2,916 3,229 3,456 3,798
Other Current Assets 93 106 197 221 240 269
Total Assets 19,662 26,579 30,793 34,183 37,476 41,679
ST Debt
0 350 321 321 321 321
Other Current Liab 2,889 4,475 4,977 5,510 5,893 6,491
LT Debt 1,813 3,222 3,242 2,902 2,562 2,722
Other LT Liabilities 344 367 449 449 449 449
Shareholder’s Equity 14,465 17,347 20,883 24,070 27,314 30,759
Minority Interests 150 818 921 931 936 936
Total Cap. & Liab. 19,662 26,579 30,793 34,183 37,476 41,679
Non-Cash Wkg. Capital 1,075 439 782 1,254 1,382 1,599
Net Cash/(Debt) 1,869 (255) 650 623 1,551 2,778
Debtors Turn (avg days) 40.4 40.8 40.5 41.3 42.0 41.5
Creditors Turn (avg days) 71.9 86.4 80.9 77.7 79.6 78.3
Inventory Turn (avg days) 79.6 82.1 72.4 76.6 81.8 80.4
Asset Turnover (x) 0.9 0.8 0.9 0.8 0.8 0.8
Current Ratio (x) 2.6 1.7 1.9 1.8 1.9 2.0
Quick Ratio (x) 1.9 1.2 1.3 1.2 1.3 1.4
Net Debt/Equity (X) CASH 0.0 CASH CASH CASH CASH
Net Debt/Equity ex MI (X) CASH 0.0 CASH CASH CASH CASH
Capex to Debt (%) 231.3 95.4 71.4 124.1 121.4 115.0
Z-Score (X) 23.4 10.3 19.2 18.0 17.4 NA
Source: Company, DBS Vickers
Asset Breakdown (2014)
Net Fixed Assets -67.8%
Assocs'/JVs -0.0%
Bank, Cash and Liquid
Assets -11.6%
Inventory -10.4%
Debtors -10.1%
Balance sheet remains strong
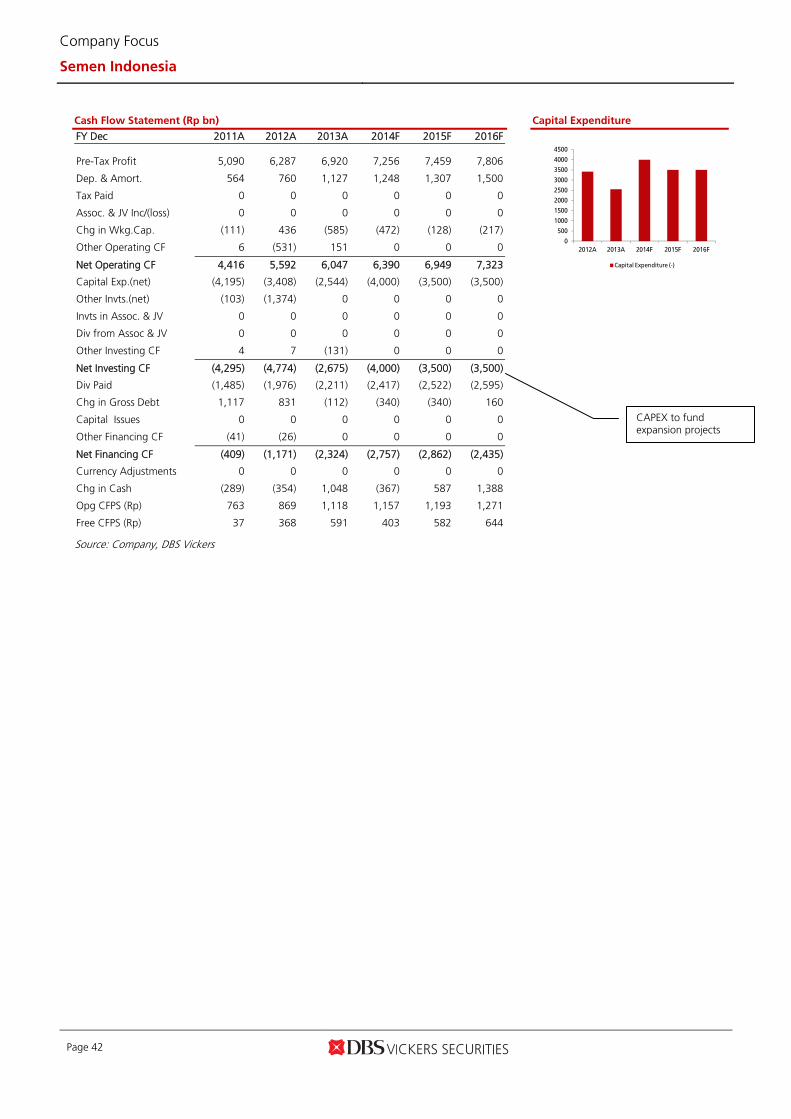
Page 42
Company Focus
Semen Indonesia
Cash Flow Statement (Rp bn)
FY Dec 2011A 2012A 2013A 2014F 2015F 2016F Pre-Tax Profit 5,090 6,287 6,920 7,256 7,459 7,806
Dep. & Amort. 564 760 1,127 1,248 1,307 1,500
Tax Paid 0 0 0 0 0 0
Assoc. & JV Inc/(loss) 0 0 0 0 0 0
Chg in Wkg.Cap. (111) 436 (585) (472) (128) (217)
Other Operating CF 6 (531) 151 0 0 0
Net Operating CF 4,416 5,592 6,047 6,390 6,949 7,323
Capital Exp.(net) (4,195) (3,408) (2,544) (4,000) (3,500) (3,500)
Other Invts.(net) (103) (1,374) 0 0 0 0
Invts in Assoc. & JV 0 0 0 0 0 0
Div from Assoc & JV 0 0 0 0 0 0
Other Investing CF 4 7 (131) 0 0 0
Net Investing CF (4,295) (4,774) (2,675) (4,000) (3,500) (3,500)
Div Paid (1,485) (1,976) (2,211) (2,417) (2,522) (2,595)
Chg in Gross Debt 1,117 831 (112) (340) (340) 160
Capital Issues 0 0 0 0 0 0
Other Financing CF (41) (26) 0 0 0 0
Net Financing CF (409) (1,171) (2,324) (2,757) (2,862) (2,435)
Currency Adjustments 0 0 0 0 0 0
Chg in Cash (289) (354) 1,048 (367) 587 1,388
Opg CFPS (Rp) 763 869 1,118 1,157 1,193 1,271
Free CFPS (Rp) 37 368 591 403 582 644
Source: Company, DBS Vickers
Capital Expenditure
0
500
1000
1500
2000
2500
3000
3500
4000
4500
2012A 2013A 2014F 2015F 2016F
Capital Expenditure (-)
CAPEX to fund expansion projects
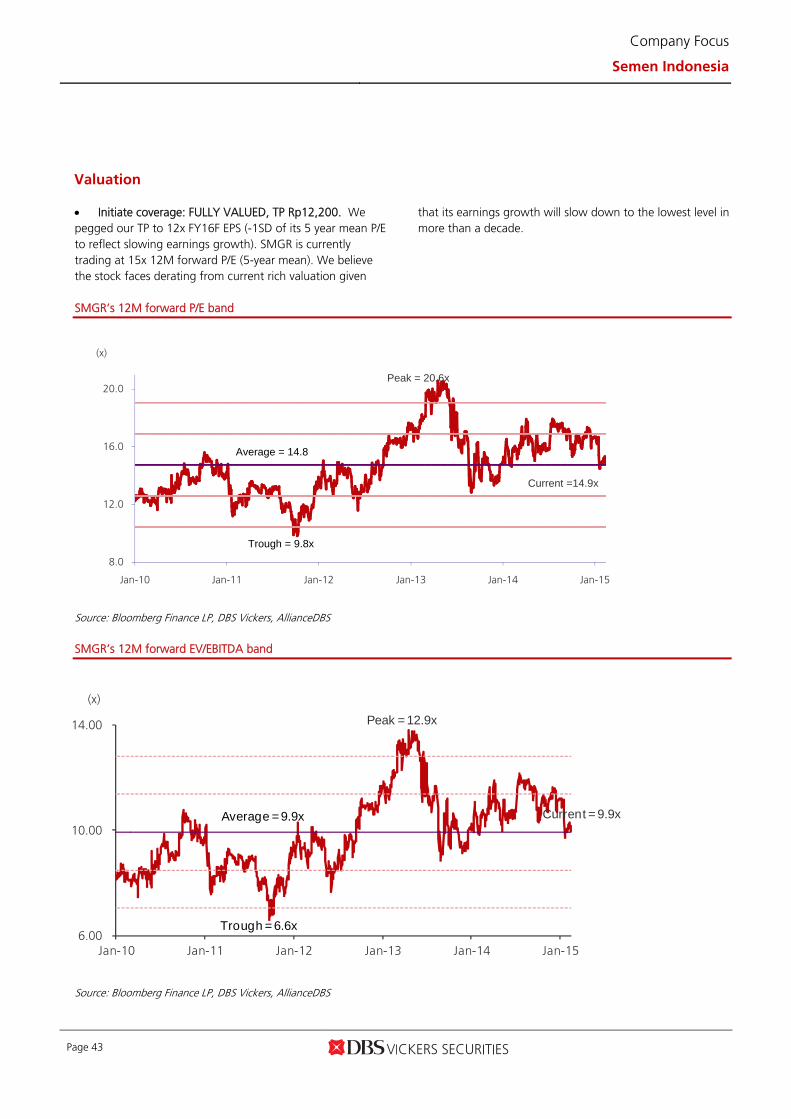
Page 43
Company Focus
Semen Indonesia
Valuation Initiate coverage: FULLY VALUED, TP Rp12,200. We pegged our TP to 12x FY16F EPS (-1SD of its 5 year mean P/E to reflect slowing earnings growth). SMGR is currently trading at 15x 12M forward P/E (5-year mean). We believe the stock faces derating from current rich valuation given
that its earnings growth will slow down to the lowest level in more than a decade.
SMGR’s 12M forward P/E band
Source: Bloomberg Finance LP, DBS Vickers, AllianceDBS SMGR’s 12M forward EV/EBITDA band
Source: Bloomberg Finance LP, DBS Vickers, AllianceDBS
8.0
12.0
16.0
20.0
Jan-10 Jan-11 Jan-12 Jan-13 Jan-14 Jan-15
(x)
Peak = 20.6x
Trough = 9.8x
Current =14.9x
Average = 14.8
6.00
10.00
14.00
Jan-10 Jan-11 Jan-12 Jan-13 Jan-14 Jan-15
(x)
Peak = 12.9x
Trough = 6.6x
Current = 9.9xAverage = 9.9x

Page 44
Company Focus
Semen Indonesia
DBSV recommendations are based an Absolute Total Return* Rating system, defined as follows:
STRONG BUY (>20% total return over the next 3 months, with identifiable share price catalysts within this time frame)
BUY (>15% total return over the next 12 months for small caps, >10% for large caps)
HOLD (-10% to +15% total return over the next 12 months for small caps, -10% to +10% for large caps)
FULLY VALUED (negative total return i.e. > -10% over the next 12 months)
SELL (negative total return of > -20% over the next 3 months, with identifiable catalysts within this time frame)
* Share price appreciation + dividends
GENERAL DISCLOSURE/DISCLAIMER This report is prepared by PT. DBS Vickers Securities Indonesia ("DBSVI"), a direct wholly-owned subsidiary of DBS Vickers Securities Holdings Pte Ltd ("DBSVH"). This report is intended for clients of DBSV Group only and no part of this document may be (i) copied, photocopied or duplicated in any form or by any means or (ii) redistributed without the prior written consent of DBSVR. The research set out in this report is based on information obtained from sources believed to be reliable, but we (which collectively refers to DBSVI and/or DBSVH) do not make any representation or warranty as to its accuracy, completeness or correctness. Opinions expressed are subject to change without notice. This document is prepared for general circulation. Any recommendation contained in this document does not have regard to the specific investment objectives, financial situation and the particular needs of any specific addressee. This document is for the information of addressees only and is not to be taken in substitution for the exercise of judgment by addressees, who should obtain separate independent legal or financial advice. DBSVI accepts no liability whatsoever for any direct, indirect and/or consequential loss (including any claims for loss of profit) arising from any use of and/or reliance upon this document and/or further communication given in relation to this document. This document is not to be construed as an offer or a solicitation of an offer to buy or sell any securities. DBSVH is a wholly-owned subsidiary of DBS Bank Ltd. DBS Bank Ltd along with its affiliates and/or persons associated with any of them may from time to time have interests in the securities mentioned in this document. DBSVI, DBS Bank Ltd and their associates, their directors, and/or employees may have positions in, and may effect transactions in securities mentioned herein and may also perform or seek to perform broking, investment banking and other banking services for these companies. Any valuations, opinions, estimates, forecasts, ratings or risk assessments herein constitutes a judgment as of the date of this report, and there can be no assurance that future results or events will be consistent with any such valuations, opinions, estimates, forecasts, ratings or risk assessments. The information in this document is subject to change without notice, its accuracy is not guaranteed, it may be incomplete or condensed and it may not contain all material information concerning the company (or companies) referred to in this report. The valuations, opinions, estimates, forecasts, ratings or risk assessments described in this report were based upon a number of estimates and assumptions and are inherently subject to significant uncertainties and contingencies. It can be expected that one or more of the estimates on which the valuations, opinions, estimates, forecasts, ratings or risk assessments were based will not materialize or will vary significantly from actual results. Therefore, the inclusion of the valuations, opinions, estimates, forecasts, ratings or risk assessments described herein IS NOT TO BE RELIED UPON as a representation and/or warranty by DBSVI and/or DBSVH (and/or any persons associated with the aforesaid entities), that: (a) such valuations, opinions, estimates, forecasts, ratings or risk assessments or their underlying assumptions will be achieved, and (b) there is any assurance that future results or events will be consistent with any such valuations, opinions, estimates, forecasts, ratings or risk
assessments stated therein. Any assumptions made in this report that refers to commodities, are for the purposes of making forecasts for the company (or companies) mentioned herein. They are not to be construed as recommendations to trade in the physical commodity or in the futures contract relating to the commodity referred to in this report. DBS Vickers Securities (USA) Inc ("DBSVUSA")"), a U.S.-registered broker-dealer, does not have its own investment banking or research department, nor has it participated in any investment banking transaction as a manager or co-manager in the past twelve months.
ANALYST CERTIFICATION The research analyst primarily responsible for the content of this research report, in part or in whole, certifies that the views about the companies and their securities expressed in this report accurately reflect his/her personal views. The analyst also certifies that no part of his/her compensation was, is, or will be, directly, or indirectly, related to specific recommendations or views expressed in this report. As of the date the report is published, the analyst and his / her spouse and/or relatives who are financially dependent on the analyst, do not hold interests in the securities recommended in this report (“interest” includes direct or indirect ownership of securities, directorships and trustee positions).
COMPANY-SPECIFIC / REGULATORY DISCLOSURES
1. PT. DBS Vickers Securities Indonesia ("DBSVI") has no proprietary position in the company recommended in this report as of 17 February 2015.
2. DBSVI, DBSVS, DBS Bank Ltd and/or other affiliates of DBS Vickers Securities (USA) Inc ("DBSVUSA"), a U.S.-registered broker-dealer, may beneficially own a total of 1% or more of any class of common equity securities of as of 18 February 2015.
3. Compensation for investment banking services: DBSVI, DBSVS, DBS Bank Ltd and/or other affiliates of DBSVUSA may have received compensation, within the past 12 months, and within the next 3 months may receive or intends to seek compensation for investment banking services from the subject companies.

Page 45
Company Focus
Semen Indonesia
DBSVUSA does not have its own investment banking or research department, nor has it participated in any investment banking transaction as a manager or co-manager in the past twelve months. Any US persons wishing to obtain further information, including any clarification on disclosures in this disclaimer, or to effect a transaction in any security discussed in this document should contact DBSVUSA exclusively.
RESTRICTIONS ON DISTRIBUTION General This report is not directed to, or intended for distribution to or use by, any person or entity who is a citizen or resident of or
located in any locality, state, country or other jurisdiction where such distribution, publication, availability or use would be contrary to law or regulation.
Australia This report is being distributed in Australia by DBS Bank Ltd. (“DBS”) or DBS Vickers Securities (Singapore) Pte Ltd (“DBSVS”), both of which are exempted from the requirement to hold an Australian Financial Services Licence under the Corporation Act 2001 (“CA”) in respect of financial services provided to the recipients. Both DBS and DBSVS are regulated by the Monetary Authority of Singapore under the laws of Singapore, which differ from Australian laws. Distribution of this report is intended only for “wholesale investors” within the meaning of the CA.
Hong Kong This report is being distributed in Hong Kong by DBS Vickers (Hong Kong) Limited which is licensed and regulated by the Hong Kong Securities and Futures Commission.
Indonesia This report is being distributed in Indonesia by PT DBS Vickers Securities Indonesia.
Malaysia This report is distributed in Malaysia by AllianceDBS Research Sdn Bhd ("ADBSR") (formerly known as HwangDBS Vickers Research Sdn Bhd). Recipients of this report, received from ADBSR are to contact the undersigned at 603-2604 3333 in respect of any matters arising from or in connection with this report. In addition to the General Disclosure/Disclaimer found at the preceding page, recipients of this report are advised that ADBSR (the preparer of this report), its holding company Alliance Investment Bank Berhad, their respective connected and associated corporations, affiliates, their directors, officers, employees, agents and parties related or associated with any of them may have positions in, and may effect transactions in the securities mentioned herein and may also perform or seek to perform broking, investment banking/corporate advisory and other services for the subject companies. They may also have received compensation and/or seek to obtain compensation for broking, investment banking/corporate advisory and other services from the subject companies.
Wong Ming Tek, Executive Director, ADBSR
Singapore This report is distributed in Singapore by DBS Bank Ltd (Company Regn. No. 196800306E) or DBSVS (Company Regn No. 198600294G), both of which are Exempt Financial Advisers as defined in the Financial Advisers Act and regulated by the Monetary Authority of Singapore. DBS Bank Ltd and/or DBSVS, may distribute reports produced by its respective foreign entities, affiliates or other foreign research houses pursuant to an arrangement under Regulation 32C of the Financial Advisers Regulations. Where the report is distributed in Singapore to a person who is not an Accredited Investor, Expert Investor or an Institutional Investor, DBS Bank Ltd accepts legal responsibility for the contents of the report to such persons only to the extent required by law. Singapore recipients should contact DBS Bank Ltd at 6327 2288 for matters arising from, or in connection with the report.
Thailand This report is being distributed in Thailand by DBS Vickers Securities (Thailand) Co Ltd. Research reports distributed are only intended for institutional clients only and no other person may act upon it.
United Kingdom
This report is being distributed in the UK by DBS Vickers Securities (UK) Ltd, who is an authorised person in the meaning of the Financial Services and Markets Act and is regulated by The Financial Conduct Authority. Research distributed in the UK is intended only for institutional clients.
Dubai
This research report is being distributed in The Dubai International Financial Centre (“DIFC”) by DBS Bank Ltd., (DIFC Branch) having its office at PO Box 506538, 3rd Floor, Building 3, East Wing, Gate Precinct, Dubai International Financial Centre (DIFC), Dubai, United Arab Emirates. DBS Bank Ltd., (DIFC Branch) is regulated by The Dubai Financial Services Authority. This research report is intended only for professional clients (as defined in the DFSA rulebook) and no other person may act upon it.
United States Neither this report nor any copy hereof may be taken or distributed into the United States or to any U.S. person except in compliance with any applicable U.S. laws and regulations. It is being distributed in the United States by DBSVUSA, which accepts responsibility for its contents. Any U.S. person receiving this report who wishes to effect transactions in any securities referred to herein should contact DBSVUSA directly and not its affiliate.
Other jurisdictions
In any other jurisdictions, except if otherwise restricted by laws or regulations, this report is intended only for qualified, professional, institutional or sophisticated investors as defined in the laws and regulations of such jurisdictions.
PT. DBS Vickers Securities Indonesia
DBS Bank Tower, Ciputra World 1, 32/F Jl. Prof. Dr. Satrio Kav. 3-5, Jakarta 12940, Indonesia
Tel. 6221-3003 4900, Fax: 6221-3003 4943