Embed Size (px)
Citation preview

Communication in category analysis on Facebook: Reach, costs, & types of content.
1
Jakub Wyglądała Client Service Team Leader +22 500 076 970 [email protected]
Dr Jan Zając CEO
+48 606 797 043 [email protected]
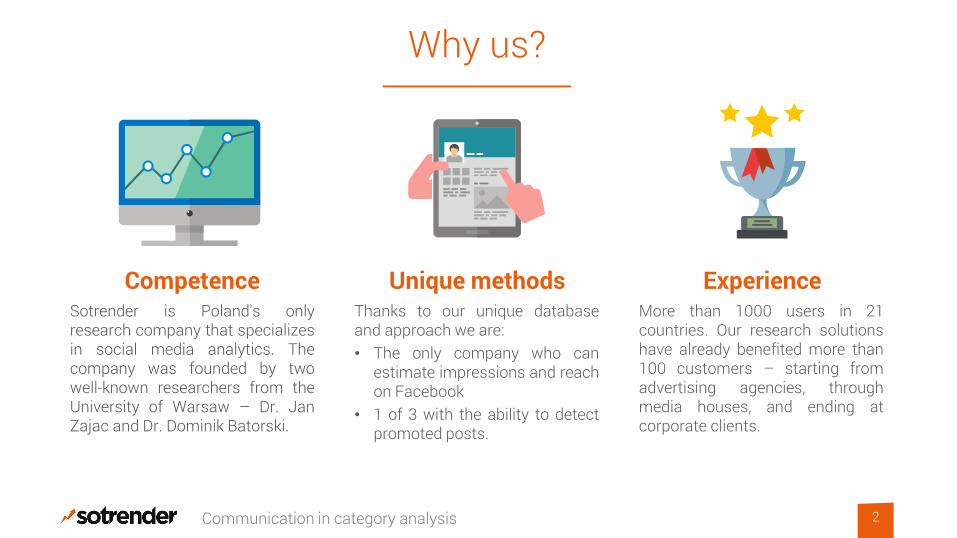
Why us?
Sotrender is Poland's only research company that specializes in social media analytics. The company was founded by two well-known researchers from the University of Warsaw – Dr. Jan Zajac and Dr. Dominik Batorski.
Thanks to our unique database and approach we are: • The only company who can
estimate impressions and reach on Facebook
• 1 of 3 with the ability to detect promoted posts.
More than 1000 users in 21 countries. Our research solutions have already benefited more than 100 customers – starting from advertising agencies, through media houses, and ending at corporate clients.
Communication in category analysis 2
Competence Unique methods Experience
What does communication from each category look like? Estimated share of voice and of spending. What is the strategic communication of specific brands? Frequency of posting and promoting, reach and impressions. What is promoted? Sponsored posts – quantity, proportion, and examples.
Questions about communication on Facebook
3 Communication in category analysis
Learn exactly what your competitors are doing!
01
02
03
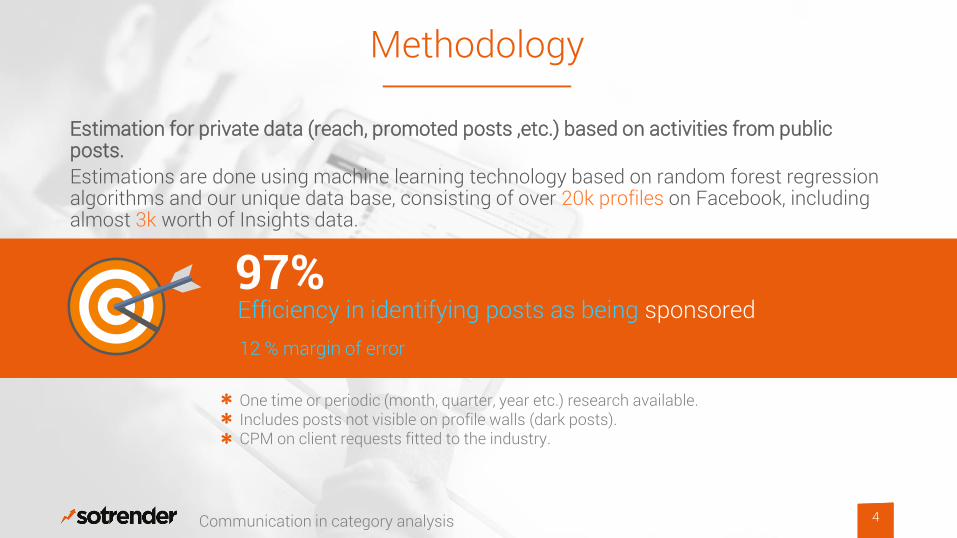
Estimation for private data (reach, promoted posts ,etc.) based on activities from public posts. Estimations are done using machine learning technology based on random forest regression algorithms and our unique data base, consisting of over 20k profiles on Facebook, including almost 3k worth of Insights data.
Methodology
4 Communication in category analysis
97% Efficiency in identifying posts as being sponsored 12 % margin of error
One time or periodic (month, quarter, year etc.) research available. Includes posts not visible on profile walls (dark posts). CPM on client requests fitted to the industry.

What do we take into consideration?
Communication in category analysis 5
Promotion of posts, including dark/unpublished posts. Mobiles included
YES Ads in the right column, including website redirection
NO

Share of Voice & Share of Spend
6

What portion of all impressions within a category comes from particular profiles? What portion of communication does each individual brand hold? Who from the competition is leading the way?
Facebook Share of Voice
7 Communication in category analysis
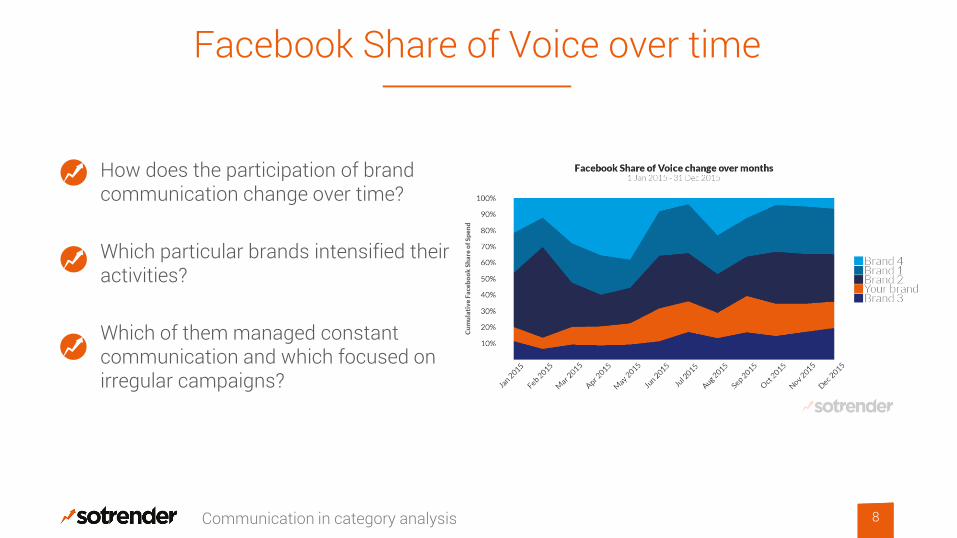
How does the participation of brand communication change over time? Which particular brands intensified their activities? Which of them managed constant communication and which focused on irregular campaigns?
Facebook Share of Voice over time
8 Communication in category analysis

Estimated Facebook spendings
Communication in category analysis 9
Brand Impressions Facebook share of voice Estimated spendings
Brand 1 76 705 044 59% 153 410 EUR
Brand 2 20 624 971 16% 41 249 EUR
Your brand 14 545 202 11% 29 090 EUR
Brand 3 6 155 560 4% 12 311 EUR
Brand 4 5 445 459 4% 10 890 EUR
Brand 5 3 619 636 2% 7 239 EUR
Total 128 317 372 100% 254 191 EUR
CPM is defined for each market; here we took CPM = 2 EUR as an example

How is the advertising budget distributed over the year? Which month has the highest spendings? Do your brand activities reflect current trends in the industry?
Facebook Share of Spend in the industry
10 Communication in category analysis
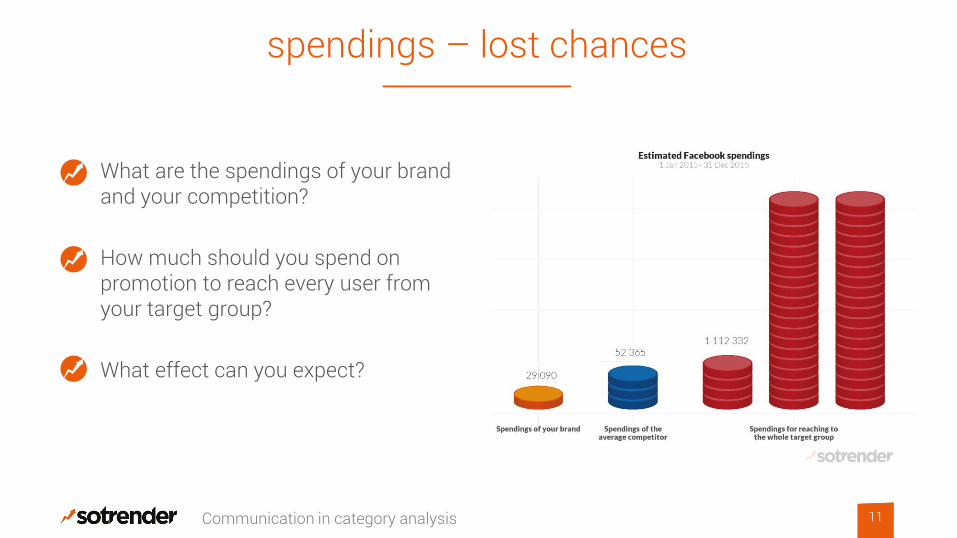
What are the spendings of your brand and your competition? How much should you spend on promotion to reach every user from your target group? What effect can you expect?
spendings – lost chances
11 Communication in category analysis

Reach and impressions
12
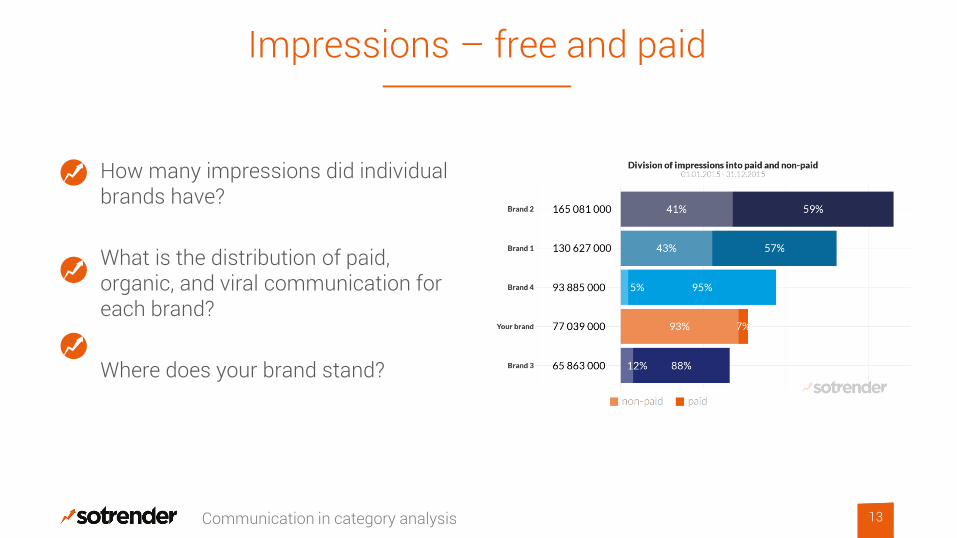
How many impressions did individual brands have? What is the distribution of paid, organic, and viral communication for each brand? Where does your brand stand?
Impressions – free and paid
13 Communication in category analysis
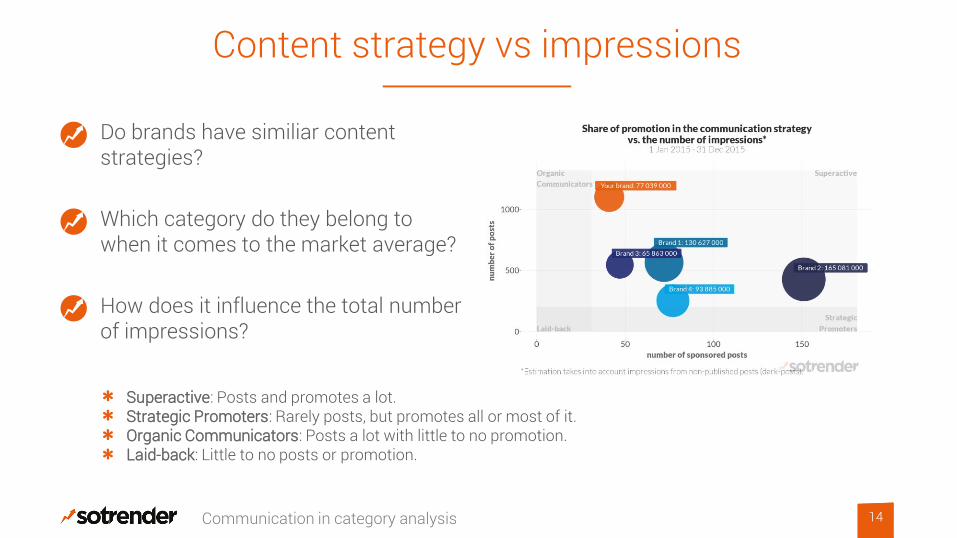
Do brands have similiar content strategies? Which category do they belong to when it comes to the market average? How does it influence the total number of impressions?
Content strategy vs impressions
14 Communication in category analysis
Superactive: Posts and promotes a lot. Strategic Promoters: Rarely posts, but promotes all or most of it. Organic Communicators: Posts a lot with little to no promotion. Laid-back: Little to no posts or promotion.
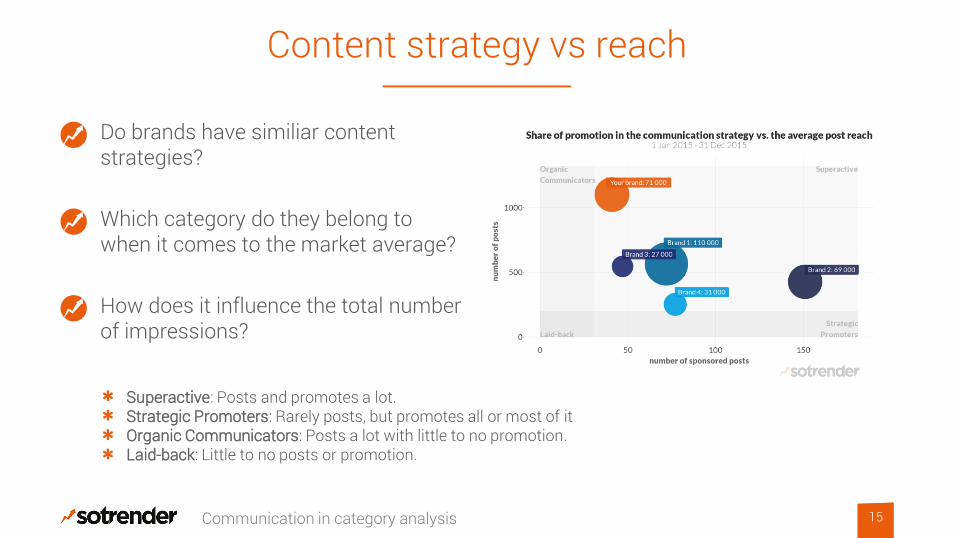
Do brands have similiar content strategies? Which category do they belong to when it comes to the market average? How does it influence the total number of impressions?
Content strategy vs reach
15 Communication in category analysis
Superactive: Posts and promotes a lot. Strategic Promoters: Rarely posts, but promotes all or most of it Organic Communicators: Posts a lot with little to no promotion. Laid-back: Little to no posts or promotion.
Types of promoted content
16
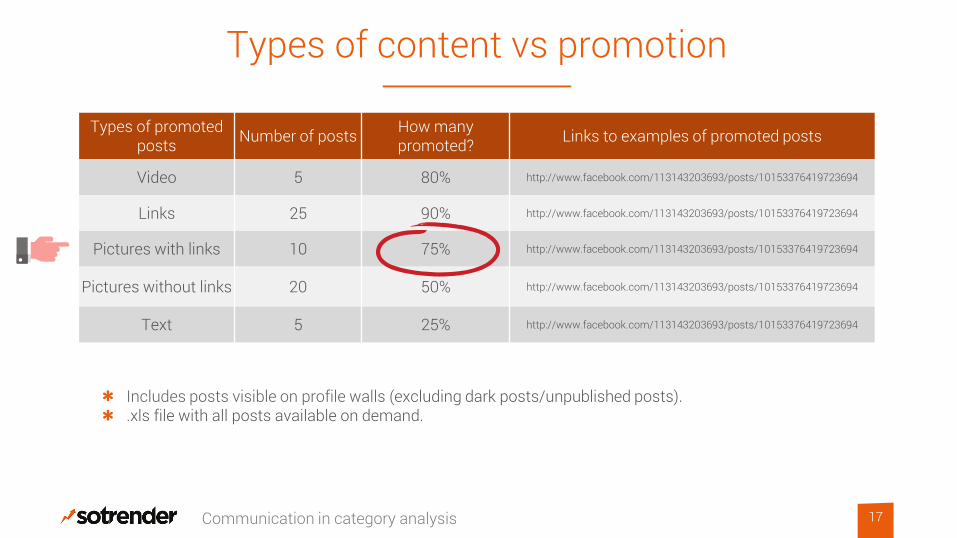
Types of content vs promotion
Communication in category analysis 17
Types of promoted posts Number of posts How many
promoted? Links to examples of promoted posts
Video 5 80% http://www.facebook.com/113143203693/posts/10153376419723694
Links 25 90% http://www.facebook.com/113143203693/posts/10153376419723694
Pictures with links 10 75% http://www.facebook.com/113143203693/posts/10153376419723694
Pictures without links 20 50% http://www.facebook.com/113143203693/posts/10153376419723694
Text 5 25% http://www.facebook.com/113143203693/posts/10153376419723694
Includes posts visible on profile walls (excluding dark posts/unpublished posts). .xls file with all posts available on demand.
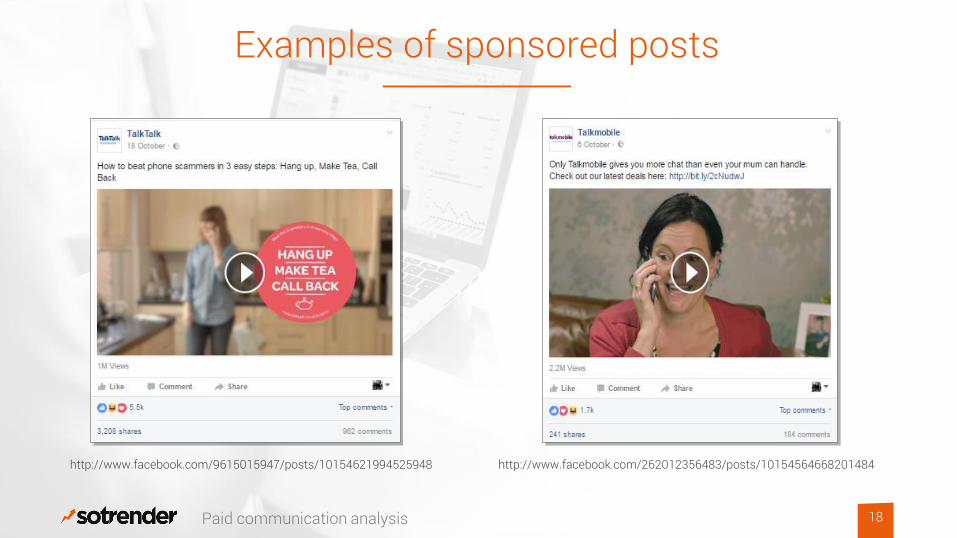
Examples of sponsored posts
Paid communication analysis 18
http://www.facebook.com/262012356483/posts/10154564668201484 http://www.facebook.com/9615015947/posts/10154621994525948

Do brands use organic or paid communication to reach their audience? How many posts were published and how much of it was sponsored? Can we distinguish any trends in the industry and does your brand follow them or act differently?
Percentage of sponsored posts
19 Communication in category analysis
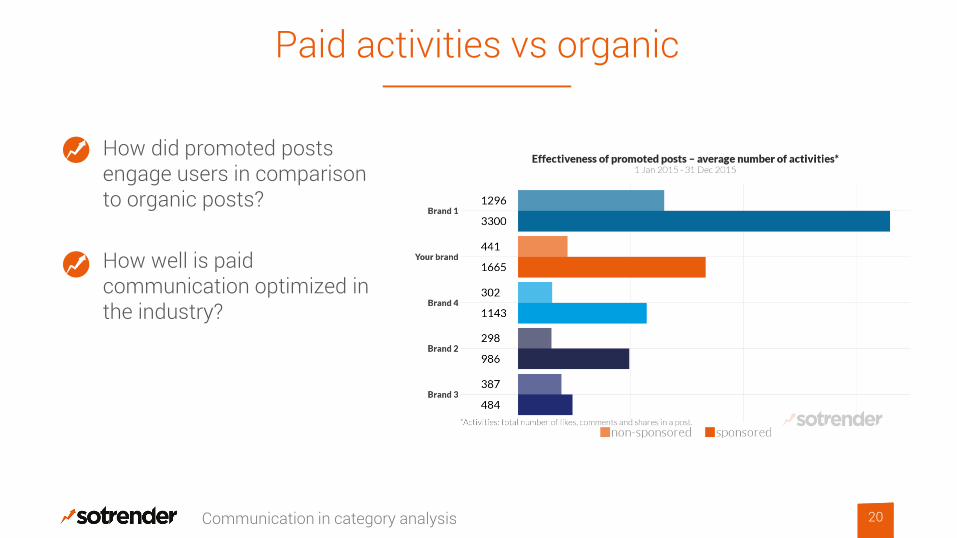
How did promoted posts engage users in comparison to organic posts? How well is paid communication optimized in the industry?
Paid activities vs organic
20 Communication in category analysis
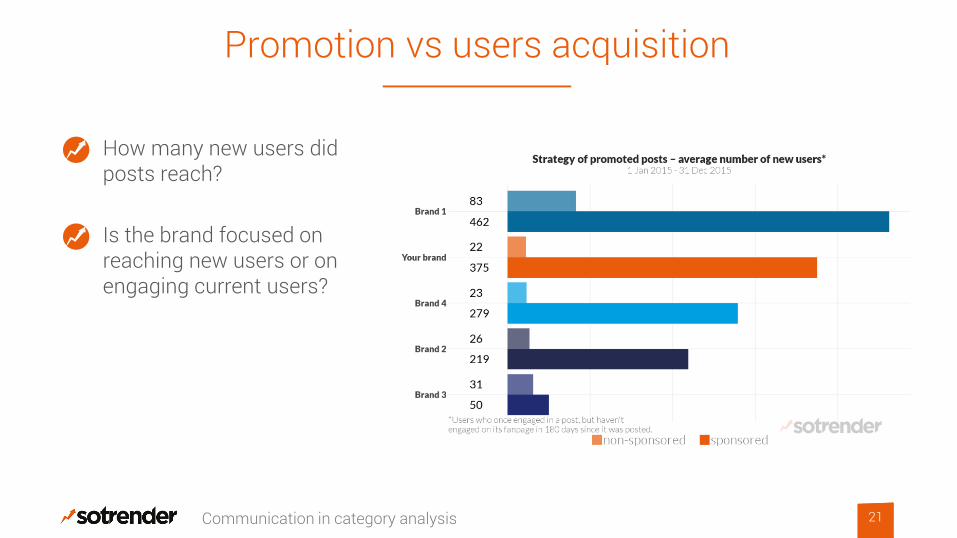
How many new users did posts reach? Is the brand focused on reaching new users or on engaging current users?
Promotion vs users acquisition
21 Communication in category analysis
Benchmarking: Check your results and position among choosen brands. Budget optimization: Know how much other brands pay to get the same results. We have arguments for both raising and lowering spendings. . Optimize your content strategy: Learn the methods and results of your competitor’s communication and see if it’ll help improve your own communication within the industry
Usage
22 Communication in category analysis
01
02
03
01
02
03

Pricing
Communication in category analysis 23
Analysis period Price Time Form
3 months 700 EUR 5 working days Report – presentation
6 months 950 EUR 6 working days Report – presentation
12 months 1200 EUR 7 working days Report - presentation
Analysis of 1 product category or part of it (we suggest at least 4 brands). Possibility of periodic reports (monthly, quarterly). Presentation of result on demand. Prices concern analysis up to 10 brands. More than 10 brands means +10% for every 5 new brands.
Contact us!
24
Jakub Wyglądała Client Service Team Leader +48 500 076 970 [email protected]
Dr Jan Zając CEO
+48 606 797 043 [email protected]