Embed Size (px)
Citation preview

RESULTS ANNOUNCEMENT4TH Quarter 2015 and Fiscal Year 2015
Conference Call / Webcast
March, 22nd 2016

2
DISCLAIMER
FORWARD-LOOKING STATEMENTS:
DISCLAIMER
The presentation may contain forward-looking statements about future eventswithin the meaning of Section 27A of the Securities Act of 1933, as amended, andSection 21E of the Securities Exchange Act of 1934, as amended, that are not basedon historical facts and are not assurances of future results. Such forward-lookingstatements merely reflect the Company’s current views and estimates of futureeconomic circumstances, industry conditions, company performance and financialresults. Such terms as "anticipate", "believe", "expect", "forecast", "intend", "plan","project", "seek", "should", along with similar or analogous expressions, are used toidentify such forward-looking statements. Readers are cautioned that thesestatements are only projections and may differ materially from actual future resultsor events. Readers are referred to the documents filed by the Company with theSEC, specifically the Company’s most recent Annual Report on Form 20-F, whichidentify important risk factors that could cause actual results to differ from thosecontained in the forward-looking statements, including, among other things, risksrelating to general economic and business conditions, including crude oil and othercommodity prices, refining margins and prevailing exchange rates, uncertaintiesinherent in making estimates of our oil and gas reserves including recentlydiscovered oil and gas reserves, international and Brazilian political, economic andsocial developments, receipt of governmental approvals and licenses and our abilityto obtain financing.
We undertake no obligation to publicly update or revise any forward-lookingstatements, whether as a result of new information or future events or for any otherreason. Figures for 2016 on are estimates or targets.
All forward-looking statements are expressly qualified in their entirety by thiscautionary statement, and you should not place reliance on any forward-lookingstatement contained in this presentation.
In addition, this presentation also contains certain financial measures that are notrecognized under Brazilian GAAP or IFRS. These measures do not have standardizedmeanings and may not be comparable to similarly-titled measures provided by othercompanies. We are providing these measures because we use them as a measure ofcompany performance; they should not be considered in isolation or as a substitutefor other financial measures that have been disclosed in accordance with BrazilianGAAP or IFRS.
NON-SEC COMPLIANT OIL AND GAS RESERVES:
CAUTIONARY STATEMENT FOR US INVESTORS
We present certain data in this presentation, such as oil and gas resources, that weare not permitted to present in documents filed with the United States Securitiesand Exchange Commission (SEC) under new Subpart 1200 to Regulation S-K becausesuch terms do not qualify as proved, probable or possible reserves under Rule 4-10(a) of Regulation S-X.

3
Exchange Rate
FX Rate (R$/US$) 1Q14 2Q14 3Q14 4Q14 1Q15 2Q15 3Q15 4Q15
Average 2.37 2.23 2.27 2.54 2.87 3.07 3.54 3.84
End of Period 2.26 2.20 2.45 2.66 3.21 3.10 3.97 3.90
R$ / US$
Source: Bloomberg – PTAX Exchange Rate
2,00
2,50
3,00
3,50
4,00
4,502015 FX Rate
R$ 3.902014 FX Rate
R$ 2.6647%
-2%
.
.
.
.
.
.

4
30
50
70
90
110
130
Oil Prices - Brent
Average Brent 1Q14 2Q14 3Q14 4Q14 1Q15 2Q15 3Q15 4Q15
R$ 256.48 244.47 231.56 193.73 154.89 190.09 177.38 167.86
US$ 108.22 109.63 101.85 76.27 53.97 61.92 50.26 43.69
US$ / bbl
Source: Platts-13%
2015 Average BrentUS$ 52.46
2014 Average BrentUS$ 98.99
- 47%

5
Results Highlights
+ Free cash flow of R$ 15.6 Billion. Petrobras has not posted a positive free cash flow since 2007.
+ Adjusted EBITDA of R$ 73.9 Billion, 25% higher than 2014
+ Total production of 2,787 mil boed, a 4% increase over 2014, with a daily production record in the pre-salt* of
1,173 th. boe in 12/14/2015
+ Lower expenses related to imports (oil and oil products) and government take
- Impairment of assets (R$ 47.7 billion) and investments (R$ 2.1 billion)
- Higher net financial expenses, due to FX devaluation and higher interest expenses
2015Highlights
4Q15 Highlights
- Impairment of assets (R$ 46.4 billion) and investments (R$ 1.9 billion)
+ Free cash flow of R$ 7.3 billion
+ 57% decrease in net financial expenses
*Petrobras + Partners production

6
Results Highlights
EBITDA Margin (%)
Free Cash Flow (R$ Billion)
Investments (R$ Billion)
EBITDA (R$ Billion)
+25%
2015
73.9
2014
59.1
20152014
Majors
Petrobras
12
23
1418
87.1
-12%
2015
76.3
2014
180%
2015
15.6
2014
-19.6

7
Results Highlights
Average Debt Maturity(years)
Cost of Debt(% p.y.)
Net Borrowings* (US$ Billion)
Net Debt(US$ Billion)
-5%
2015
100.4
2014
106.2
-52%
2015
12.0
2014
25.2
+0.7 p.p.
2015
6.3
2014
5.6
7.1
2015
6.1
2014
* Net of rollovers and pre-payments
8
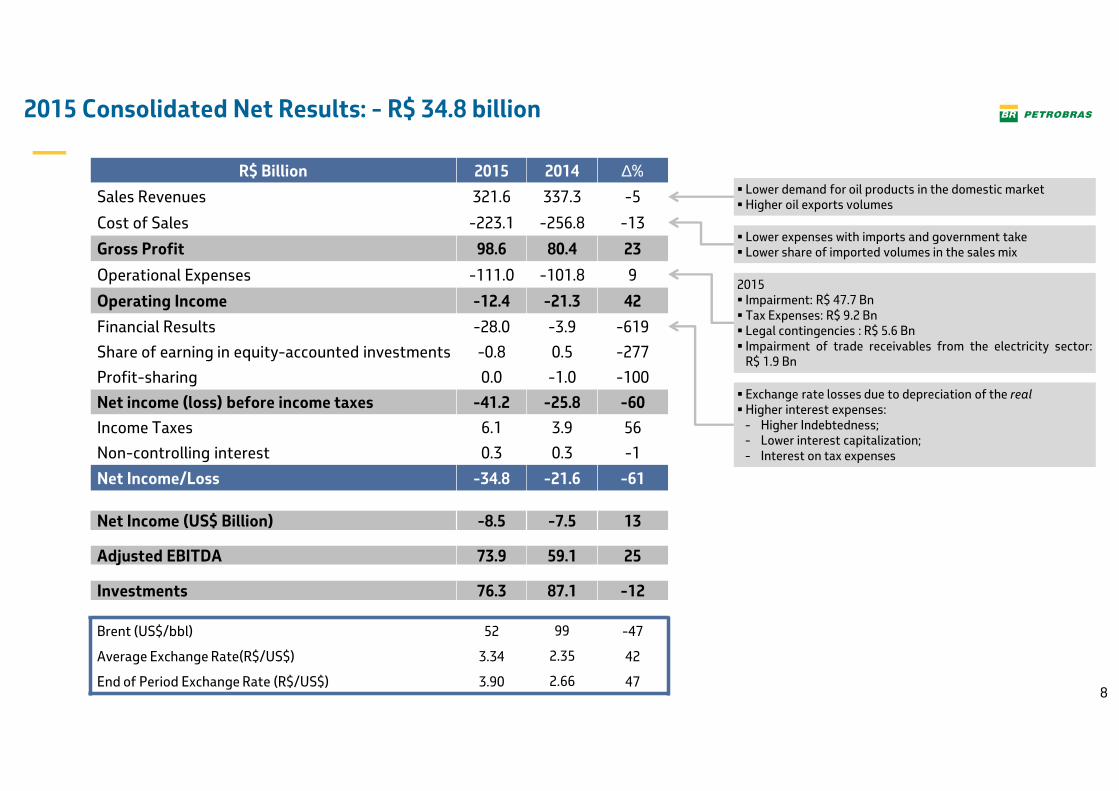
2015 Consolidated Net Results: - R$ 34.8 billion
R$ Billion 2015 2014 ∆%
Sales Revenues 321.6 337.3 -5
Cost of Sales -223.1 -256.8 -13
Gross Profit 98.6 80.4 23
Operational Expenses -111.0 -101.8 9
Operating Income -12.4 -21.3 42
Financial Results -28.0 -3.9 -619
Share of earning in equity-accounted investments -0.8 0.5 -277
Profit-sharing 0.0 -1.0 -100
Net income (loss) before income taxes -41.2 -25.8 -60
Income Taxes 6.1 3.9 56
Non-controlling interest 0.3 0.3 -1
Net Income/Loss -34.8 -21.6 -61
Net Income (US$ Billion) -8.5 -7.5 13
Adjusted EBITDA 73.9 59.1 25
Investments 76.3 87.1 -12
Brent (US$/bbl) 52 99 -47
Average Exchange Rate(R$/US$) 3.34 2.35 42
End of Period Exchange Rate (R$/US$) 3.90 2.66 47
� Lower demand for oil products in the domestic market� Higher oil exports volumes
2015� Impairment: R$ 47.7 Bn� Tax Expenses: R$ 9.2 Bn� Legal contingencies : R$ 5.6 Bn� Impairment of trade receivables from the electricity sector:
R$ 1.9 Bn
� Exchange rate losses due to depreciation of the real� Higher interest expenses:
- Higher Indebtedness;- Lower interest capitalization;- Interest on tax expenses
� Lower expenses with imports and government take� Lower share of imported volumes in the sales mix
9
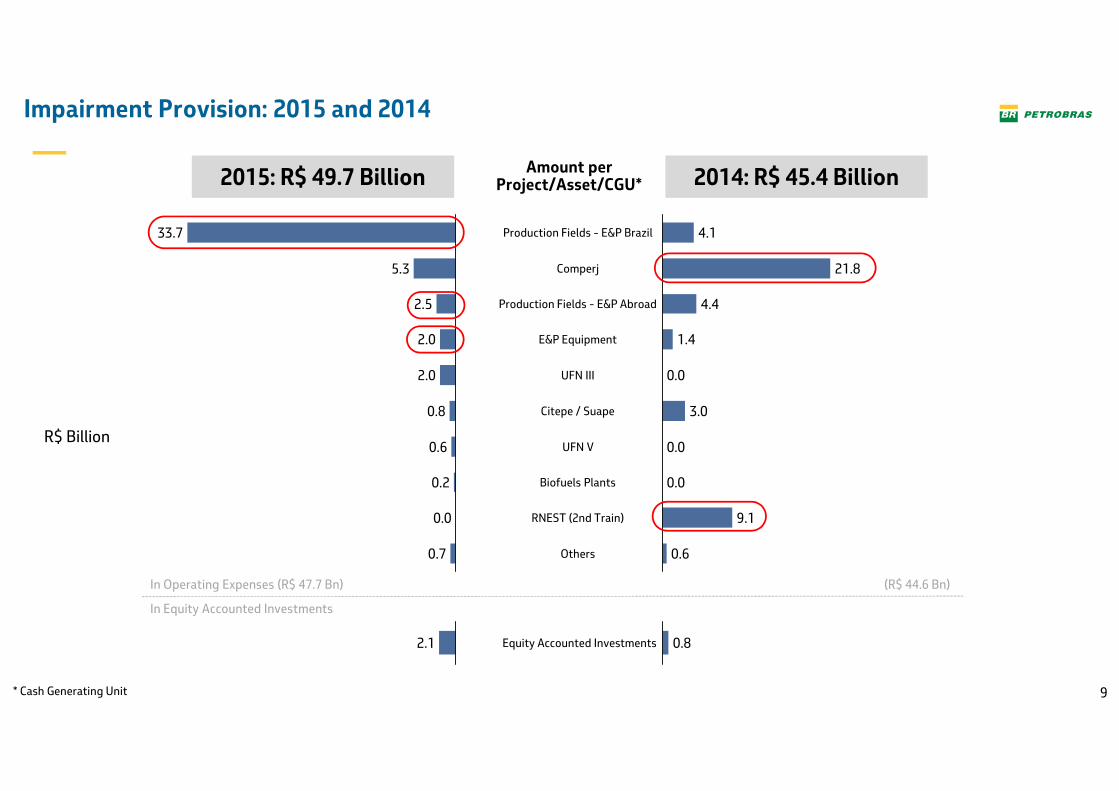
Impairment Provision: 2015 and 2014
Amount perProject/Asset/CGU*
4.4
21.8
0.6
RNEST (2nd Train)
UFN V
Comperj
Others
9.1
1.4
Production Fields - E&P Abroad
0.0
0.0
E&P Equipment
UFN III
3.0Citepe / Suape
4.1Production Fields - E&P Brazil
0.0Biofuels Plants0.2
0.7
2.0
0.0
2.0
0.6
0.8
2.5
5.3
33.7
In Operating Expenses (R$ 47.7 Bn) (R$ 44.6 Bn)
In Equity Accounted Investments
0.8Equity Accounted Investments2.1
2015: R$ 49.7 Billion 2014: R$ 45.4 Billion
R$ Billion
* Cash Generating Unit
10
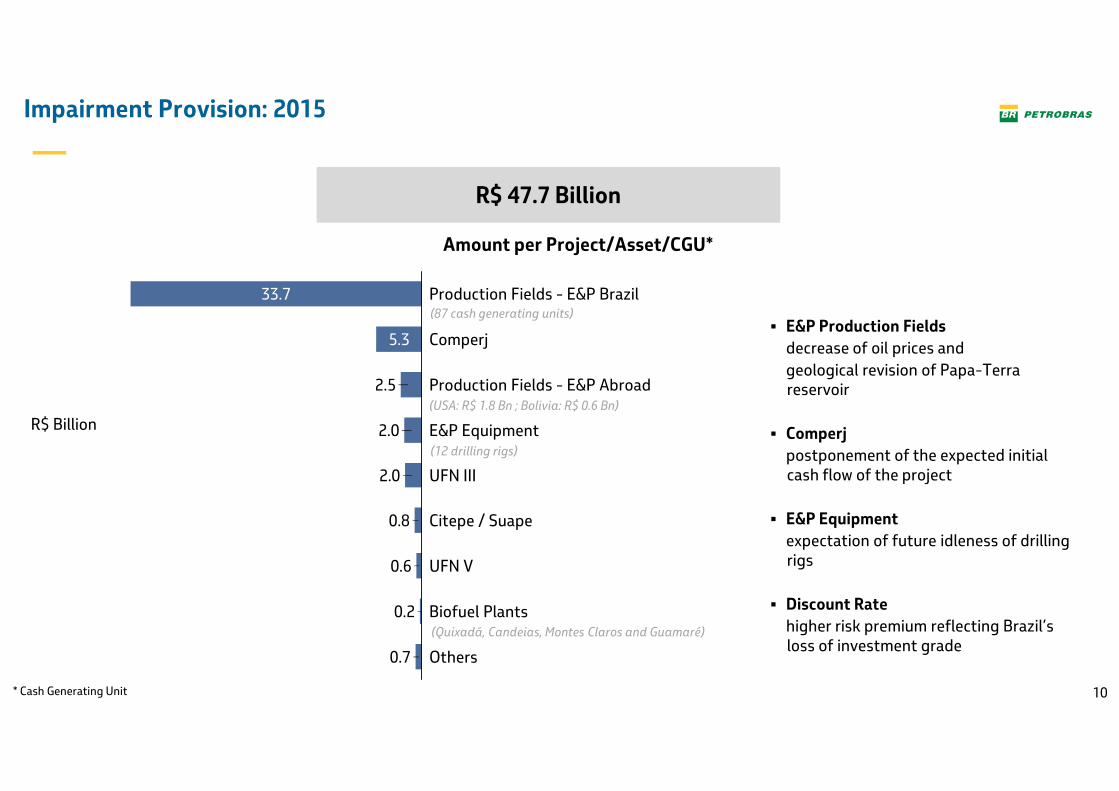
Impairment Provision: 2015
Amount per Project/Asset/CGU*
R$ 47.7 Billion
33.7 Production Fields - E&P Brazil
2.0
Production Fields - E&P Abroad
2.0
Comperj
2.5
Biofuel Plants
0.8
UFN V
E&P Equipment
0.6
0.7
0.2
Others
5.3
UFN III
Citepe / Suape
� E&P Production Fields
decrease of oil prices and
geological revision of Papa-Terra reservoir
� Comperj
postponement of the expected initial cash flow of the project
� E&P Equipment
expectation of future idleness of drilling rigs
� Discount Rate
higher risk premium reflecting Brazil’s loss of investment grade
(87 cash generating units)
(USA: R$ 1.8 Bn ; Bolivia: R$ 0.6 Bn)
(12 drilling rigs)
(Quixadá, Candeias, Montes Claros and Guamaré)
R$ Billion
* Cash Generating Unit
11
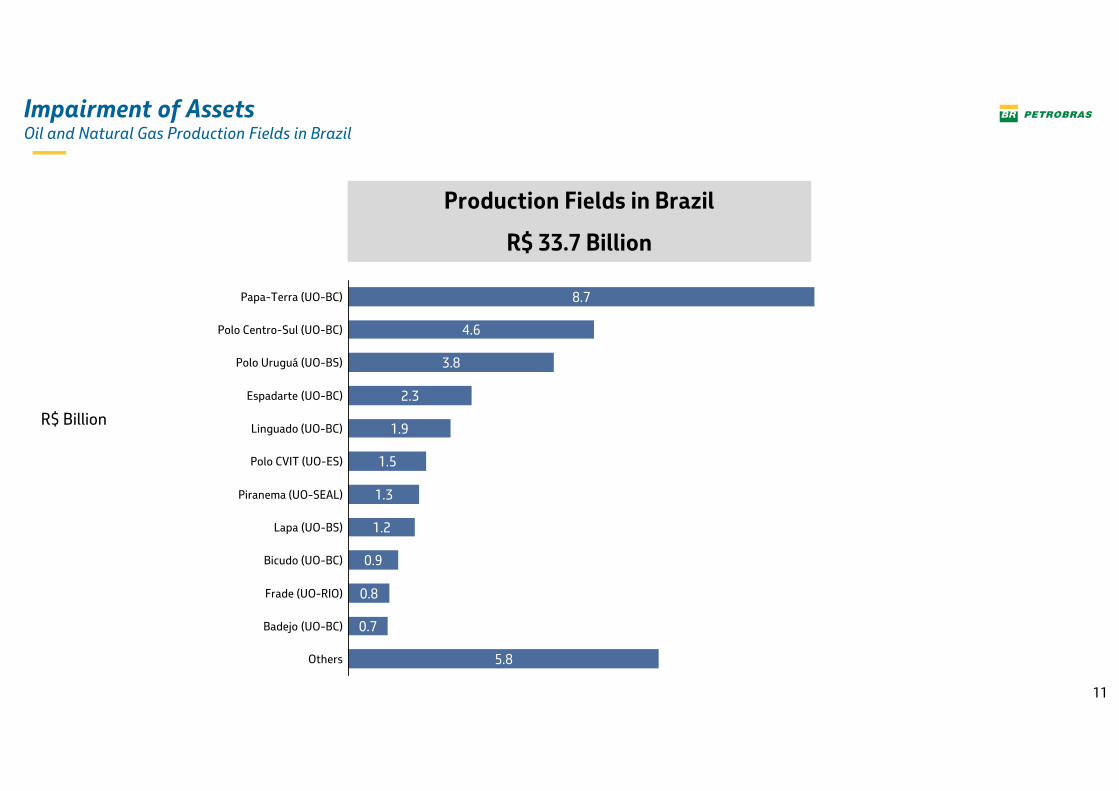
Production Fields in Brazil
R$ 33.7 Billion
0.9
Polo CVIT (UO-ES)
1.3Piranema (UO-SEAL)
1.2Lapa (UO-BS)
Others 5.8
Badejo (UO-BC) 0.7
Frade (UO-RIO) 0.8
Bicudo (UO-BC)
1.5
Linguado (UO-BC) 1.9
Espadarte (UO-BC) 2.3
Polo Uruguá (UO-BS) 3.8
Polo Centro-Sul (UO-BC) 4.6
Papa-Terra (UO-BC) 8.7
Impairment of AssetsOil and Natural Gas Production Fields in Brazil
R$ Billion
12
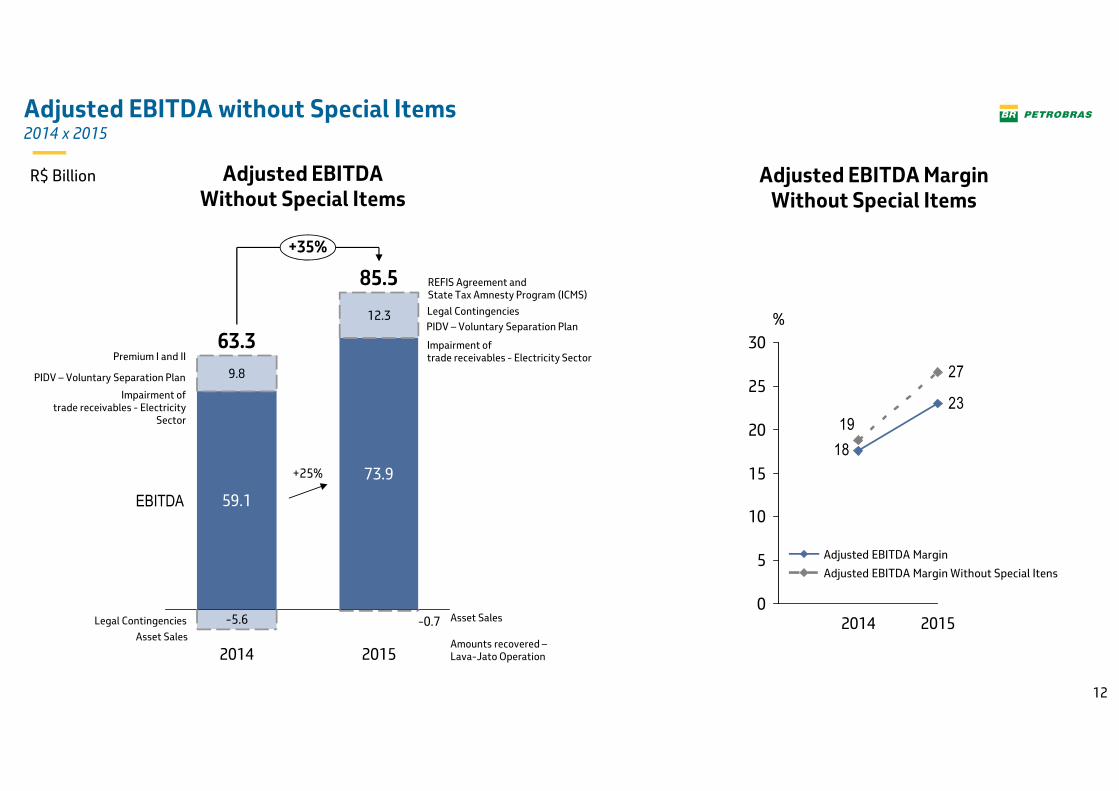
Adjusted EBITDA without Special Items2014 x 2015
73.9
12.3
2014
63.3
59.1
-5.6
9.8
+35%
EBITDA
2015
85.5
27
23
18
19
0
5
10
15
20
25
30
%
20152014
Adjusted EBITDA Margin Without Special Itens
Adjusted EBITDA Margin
+25%
Asset Sales
Legal Contingencies
PIDV – Voluntary Separation Plan
Impairment of trade receivables - Electricity
Sector
Premium I and II
Amounts recovered –Lava-Jato Operation
REFIS Agreement andState Tax Amnesty Program (ICMS)
Legal Contingencies
PIDV – Voluntary Separation Plan
Asset Sales
Impairment of trade receivables - Electricity Sector
-0.7
Adjusted EBITDAWithout Special Items
Adjusted EBITDA MarginWithout Special Items
R$ Billion

13
Simulation of 2015 Consolidated Net IncomeWithout special items
COGS
-223.1
Revenue
321.6
-34.8
49.7
Impairment2015 Net Income
2015Net Income(Estimated)
Income Tax
-15.5
REFIS, Legal Contingencies, Receiveables
(electricity sector) and
others
Equity Income, Minority
Interest and Income Tax
5.6
Net Financial Results
-28.0
Operating Expenses
-111.0
14.3 13.6
R$ Billion

14
4Q15 Consolidated Net Result: - R$ 36.9 Billion
R$ Billion 4Q15 3Q15 ∆%
Sales Revenues 85.1 82.2 3
Cost of Sales -58.3 -58.5 0
Gross Profit 26.8 23.8 13
Operational Expenses -67.9 -17.9 -278
Operating Income -41.0 5.8 -806
Financial Results -4.9 -11.4 57
Share of earning in equity-accounted investments -1.3 0.2 -770
Profit-sharing 0.1 0.2 -44
Net income (loss) before income taxes -47.2 -5.2 -807
Income Taxes 11.6 0.2 6.555
Non-controlling interest -1.4 1.3 -207
Net Income/Loss -36.9 -3.8 -883
Net Income (US$ Billion) -9.4 -1.1 787
Adjusted EBITDA 17.1 15.5 10
Investments 20.8 19.3 8
Brent (US$/bbl) 44 50 -13
Average Exchange Rate(R$/US$) 3.84 3.54 8
End of Period Exchange Rate (R$/US$) 3.90 3.97 -2
� Higher domestic prices of oil products due to diesel and gasoline adjustments in Sep/15
� Lower oil products sales in the domestic market
� Lower exchange rate losses due to the appreciation of the realover net liabilities in dollars and euros
� Lower expenses with imports and government take
� Lower share of imported volumes in the sales mix
� Impairment

15
Exploration & Production
Oil and Natural Gas Production – Brazil and Abroad
* NGL – Natural Gas Liquids
389426
469
99128
91+6%
+5%
2,128
2,539
20152013
2,7872,669
116
1,931
Natural Gas Brazil
93
+4%
Oil and NGL Brazil 2,034
2014
Natural Gas Abroad
Oil and NGL Abroad91
+5%+5%
kboed
� P-58 (Parque das Baleias)� P-62 (Roncador)� FPSO Cidade de Mangaratiba (Iracema Sul) � FPSO Cidade de Ilhabela (Sapinhoá)
� FPSO Itaguaí (Iracema Norte)� P-61 (Papa-Terra)New
Units
16
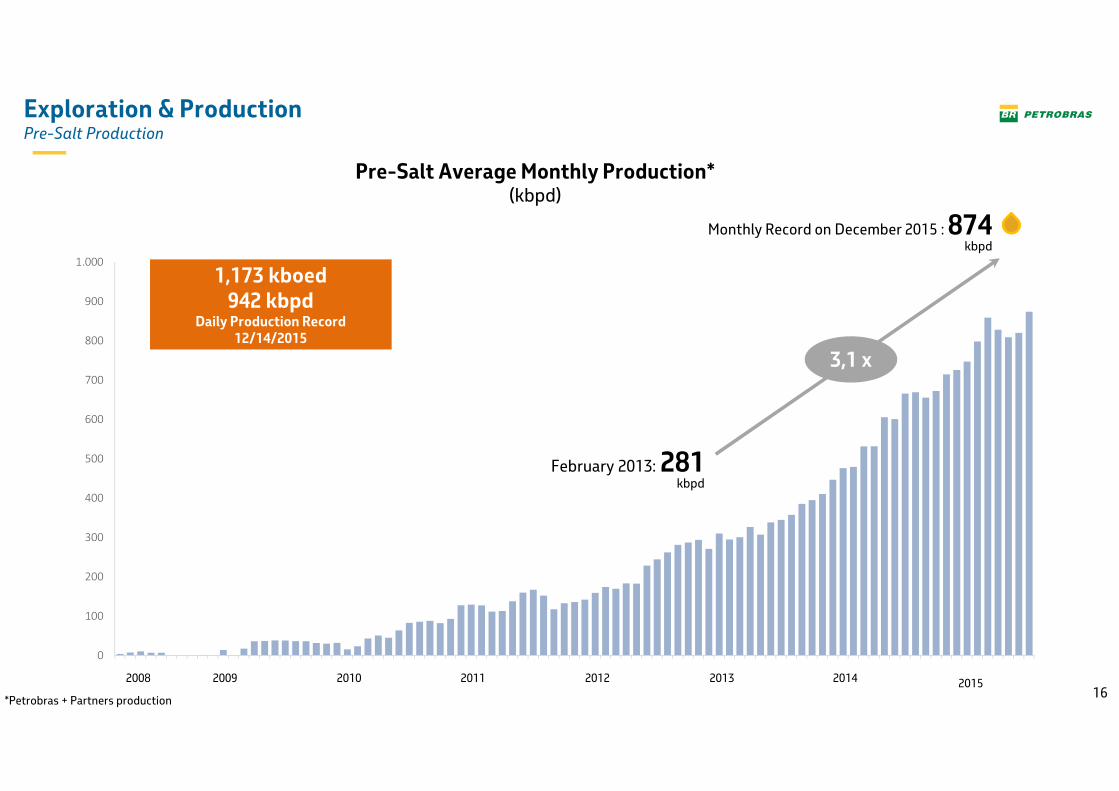
Exploration & ProductionPre-Salt Production
Pre-Salt Average Monthly Production*(kbpd)
0
100
200
300
400
500
600
700
800
900
1.000
Monthly Record on December 2015 : 874kbpd
February 2013: 281kbpd
3,1 x
1,173 kboed942 kbpd
Daily Production Record12/14/2015
2008 2009 2010 2011 2012 2013 2014 2015
*Petrobras + Partners production

17
Exploration & Production
Connection of New Wells in Brazil
30 34
61
47
1217
26
26
72
42
2014
87
2013
51
2012 2015Target
2015
73Producers
Injectors

18
Downstream
Utilization Factor (%) 97 98 89
Yield (%) (Diesel, Gasoline and Jet Fuel)
68 67 68
850 853 848
491 494 434
783 823744
+2% -7%
Gasoline
Diesel
Others
20152014
2,1702,026
2013
2,124
Oil Products Output in Brazil
kbpd

19
Downstream
Sales Volumes in Brazil
984 923
590 620553
809837
758
2013
2,383
2015
Others
2,234
1,001
2,458
2014
Gasoline
+3%
Diesel
-9%
�Naphtha: lower demand, mainly from Braskem
�Gasoline: increase of ethanol content in gasoline C to 27% from 25%; lower market-share
�Diesel: lower consumption in infrastructure projects; lower market share and higher content of biodiesel in the diesel/biodiesel mix
kbpd

20
Operating Income Evolution 2014 x 2015 (-42%)By segment
R$ Billion
Biofuels
-12.4
-21.3
Exploration & Production
Downstream
-3.3
2015Operating
Income
2014Operating
Income
-68.3
Eliminations
-0.20.3
2.3
Gas & Power Distribution
-6.1
84.2
Corporate
2014 2015 ∆%
Brent (USD) 99 52 -47
Brent (BRL) 231 173 -25
Average Exchange Rate 2.35 3.34 42
2015 25.4 -17.9 0.8 -1.2 -0.4 -21.1 2.02014 -58.8 50.3 -1.5 2.1 -0.3 -14.9 1.7
∆ 84.2 -68.3 2.3 -3.4 -0.2 -6.1 0.3

21* Gross Profit ex-Depreciation
R$ Billion
% of Gross Profit* 11% 10% 8%
+4% -2%
Personnel (Holding)
2015
11.0
4.1
6.9
2014
11.2
4.0
7.2
2013
10.8
3.9
6.8
ConsultanciesTraining
Data ProcessingServices, Rents and Charges
Asset DepreciationPersonnel (other companies)
3%
6%
1%
-5% Expenses with Lava JatoOperation and Class Action:2015: R$ 276 MM
General and Administrative Expenses

22
Indebtedness
4Q15
Total Debt(R$ Billion)
100.4
126.2
392.0
282.1
351.0
Net Debt(R$ Billion)
Gross Debt(US$ Billion)
132.2
492.8
127.5
3Q151Q15
402.3
2Q15
101.3
4Q14
106.2
506.6
Net Debt(US$ Billion) 4Q14 4Q15
Cost of Debt (in USD) 5.6% p.y. 6.3% p.y.
Average Maturity 6.10 years 7.14 years
New Borrowings² (USD Bn)2014
25,22015
12,0
1%
TJLPOthers¹
9%5% CDI
50%Fixed
36%
LIBOR 1M, 3M, 6M
¹ Others: IPCA, TIBOR 6M, EURIBOR 6M, BNDES_006, SCD (Selic).
Net Debt/ EBITDA LTM
4.77 3.86 4.64 5.24 5.31
Leverage % 48 52 51 58 60 ² Net of roll-overs and pre-payments
Indebtedness Evolution Debt Profile
23
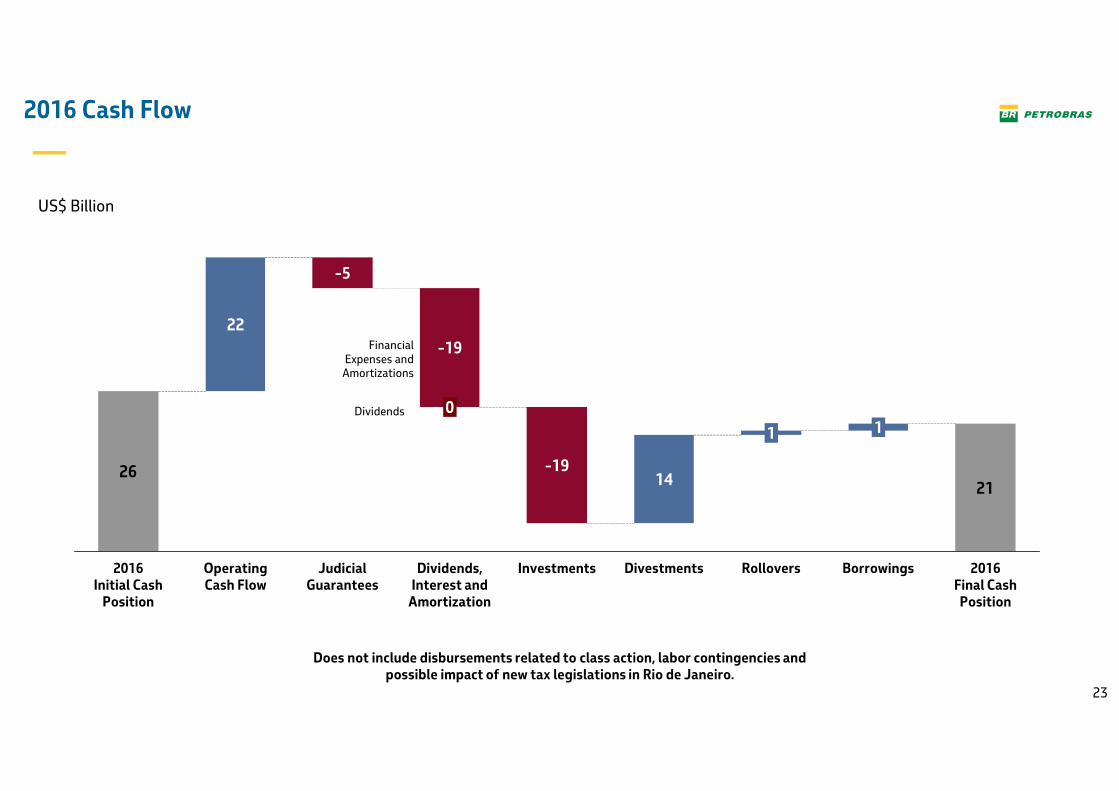
2016 Cash Flow
US$ Billion
1
262114
22
-19
Judicial Guarantees
Dividends, Interest and
Amortization
0
Investments
-19
Divestments Rollovers
1
Borrowings
1
2016Final Cash Position
-5
Operating Cash Flow
2016Initial Cash
Position
Dividends
Financial Expenses and
Amortizations
Does not include disbursements related to class action, labor contingencies and possible impact of new tax legislations in Rio de Janeiro.
RESULTS ANNOUNCEMENT4th Quarter and
2015 Year End 2015 Reults
Information:
Investor Relations
+55 21 3224-1510