Embed Size (px)
Citation preview

Conference Call
DuPont Fourth-Quarter and Full-Year 2015 Earnings
January 26, 2016
1
Regulation G The attached charts include company information that does not conform to generally accepted accounting principles (GAAP). Management
believes that an analysis of this data is meaningful to investors because it provides insight with respect to ongoing operating results of the
company. These measures should not be viewed as an alternative to GAAP measures of performance. Furthermore, these measures may not
be consistent with similar measures provided by other companies. This data should be read in conjunction with previously published company
reports on Forms 10-K, 10-Q, and 8-K. These reports, along with reconciliations of non-GAAP measures to GAAP are available on the
Investor Center of www.dupont.com under Filings and Reports – Reconciliations and Other Data. Reconciliations of non-GAAP measures to
GAAP are also included with this presentation.
Forward-Looking Statements This document contains forward-looking statements which may be identified by their use of words like “plans,” “expects,” “will,” “believes,”
“intends,” “estimates,” “anticipates” or other words of similar meaning. All statements that address expectations or projections about the future,
including statements about the company’s strategy for growth, product development, regulatory approval, market position, anticipated benefits
of recent acquisitions, timing of anticipated benefits from restructuring actions, outcome of contingencies, such as litigation and environmental
matters, expenditures and financial results, and timing of, as well as expected benefits, including synergies, from proposed merger with The
Dow Chemical Company and intended post-merger separations, are forward looking statements. Forward-looking statements are not
guarantees of future performance and are based on certain assumptions and expectations of future events which may not be realized.
Forward-looking statements also involve risks and uncertainties, many of which are beyond the company’s control. Some of the important
factors that could cause the company’s actual results to differ materially from those projected in any such forward-looking statements are:
fluctuations in energy and raw material prices; failure to develop and market new products and optimally manage product life cycles; ability to
respond to market acceptance, rules, regulations and policies affecting products based on biotechnology and, in general, for products for the
agriculture industry; outcome of significant litigation and environmental matters, including realization of associated indemnification assets, if
any; failure to appropriately manage process safety and product stewardship issues; changes in laws and regulations or political conditions;
global economic and capital markets conditions, such as inflation, interest and currency exchange rates; business or supply disruptions;
security threats, such as acts of sabotage, terrorism or war, natural disasters and weather events and patterns which could affect demand as
well as availability of products for the agriculture industry; ability to protect and enforce the company’s intellectual property rights; successful
integration of acquired businesses and separation of underperforming or non-strategic assets or businesses; and risks related to the
agreement entered on December 11, 2015, with The Dow Chemical Company pursuant to which the companies have agreed to effect an all-
stock merger of equals, including the completion of the proposed transaction on anticipated terms and timing, the ability to fully and timely
realize the expected benefits of the proposed transaction and risks related to the intended business separations contemplated to occur after
the completion of the proposed transaction. The company undertakes no duty to update any forward-looking statements as a result of future
developments or new information.
Developing Markets Total developing markets is comprised of Developing Asia, Developing Europe, Middle East & Africa, and Latin America. A detailed list of all
developing countries is available on the Earnings News Release link on the Investor Center website at www.dupont.com.
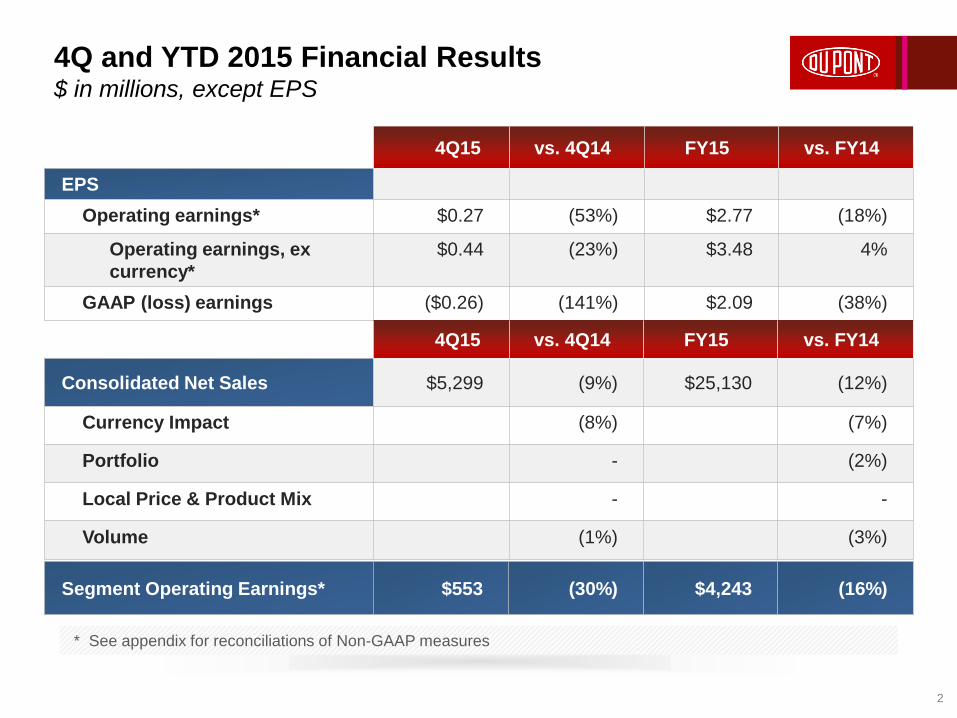
4Q and YTD 2015 Financial Results $ in millions, except EPS
2
4Q15 vs. 4Q14 FY15 vs. FY14
EPS
Operating earnings* $0.27 (53%) $2.77 (18%)
Operating earnings, ex
currency*
$0.44 (23%) $3.48 4%
GAAP (loss) earnings ($0.26) (141%) $2.09 (38%)
Segment Operating Earnings* $553 (30%) $4,243 (16%)
4Q15 vs. 4Q14 FY15 vs. FY14
Consolidated Net Sales $5,299 (9%) $25,130 (12%)
Currency Impact (8%) (7%)
Portfolio - (2%)
Local Price & Product Mix - -
Volume (1%) (3%)
* See appendix for reconciliations of Non-GAAP measures
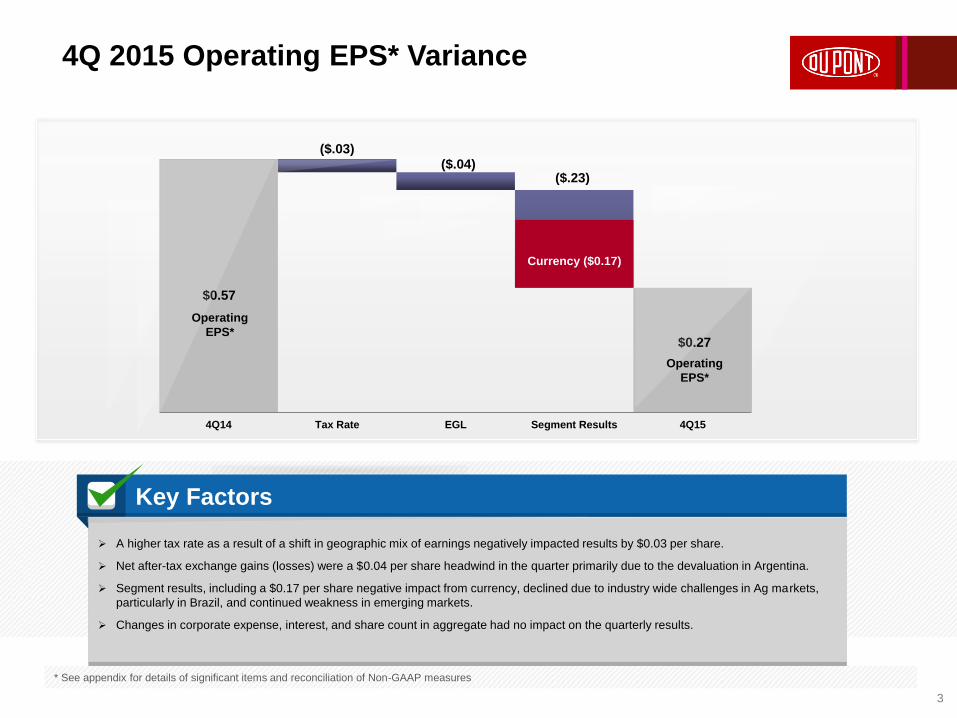
4Q 2015 Operating EPS* Variance
3
* See appendix for details of significant items and reconciliation of Non-GAAP measures
A higher tax rate as a result of a shift in geographic mix of earnings negatively impacted results by $0.03 per share.
Net after-tax exchange gains (losses) were a $0.04 per share headwind in the quarter primarily due to the devaluation in Argentina.
Segment results, including a $0.17 per share negative impact from currency, declined due to industry wide challenges in Ag markets,
particularly in Brazil, and continued weakness in emerging markets.
Changes in corporate expense, interest, and share count in aggregate had no impact on the quarterly results.
Key Factors
$0.57
($.03)
($.04)
($.04)
$0.27
4Q14 Tax Rate EGL Segment Results 4Q15
Operating
EPS*
Operating
EPS*
Currency ($0.17)
($.23)
Collaboration Speeds Innovation
2013 Highlights
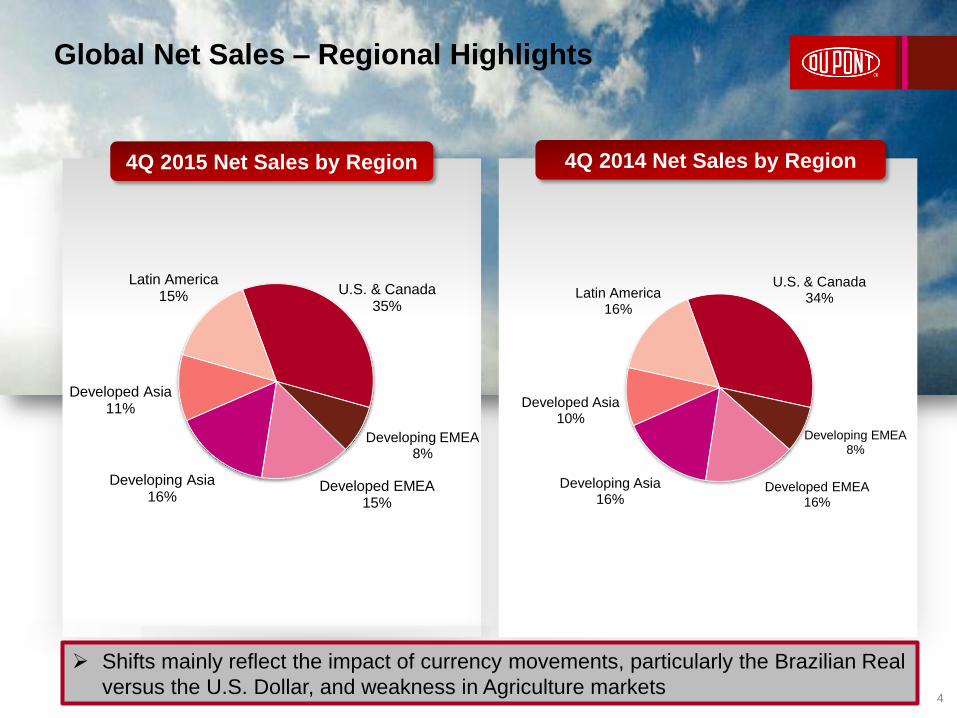
Global Net Sales – Regional Highlights
4
U.S. & Canada 35%
Developing EMEA 8%
Developed EMEA 15%
Developing Asia 16%
Developed Asia 11%
Latin America 15%
4Q 2015 Net Sales by Region
4Q 2014 Net Sales by Region
U.S. & Canada 34%
Developing EMEA 8%
Developed EMEA 16%
Developing Asia 16%
Developed Asia 10%
Latin America 16%
Shifts mainly reflect the impact of currency movements, particularly the Brazilian Real
versus the U.S. Dollar, and weakness in Agriculture markets
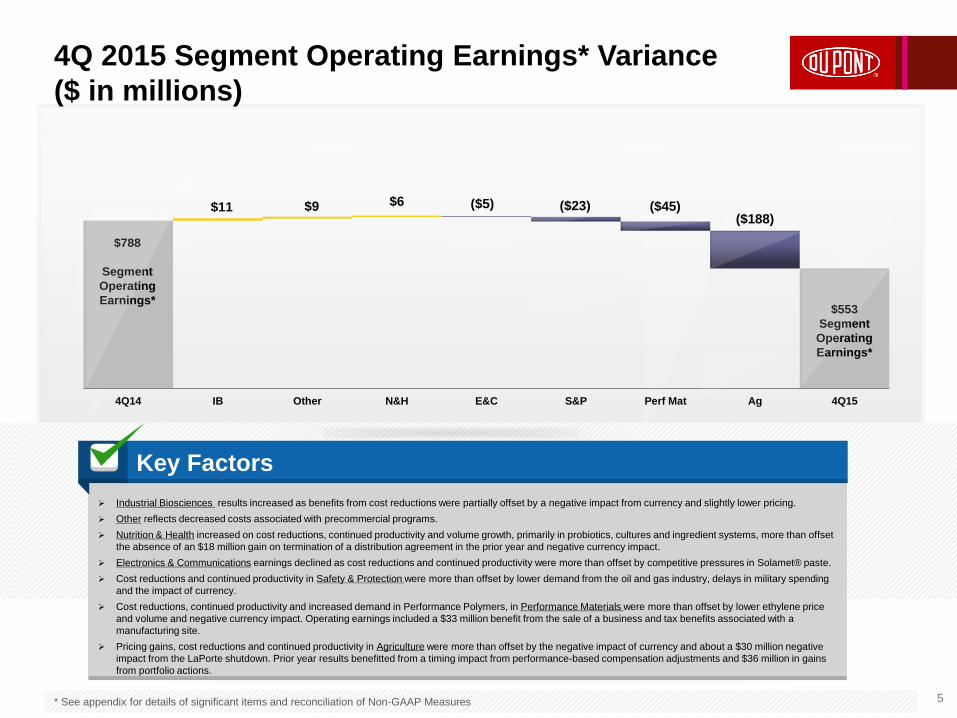
4Q 2015 Segment Operating Earnings* Variance
($ in millions)
5 * See appendix for details of significant items and reconciliation of Non-GAAP Measures
Industrial Biosciences results increased as benefits from cost reductions were partially offset by a negative impact from currency and slightly lower pricing.
Other reflects decreased costs associated with precommercial programs.
Nutrition & Health increased on cost reductions, continued productivity and volume growth, primarily in probiotics, cultures and ingredient systems, more than offset
the absence of an $18 million gain on termination of a distribution agreement in the prior year and negative currency impact.
Electronics & Communications earnings declined as cost reductions and continued productivity were more than offset by competitive pressures in Solamet® paste.
Cost reductions and continued productivity in Safety & Protection were more than offset by lower demand from the oil and gas industry, delays in military spending
and the impact of currency.
Cost reductions, continued productivity and increased demand in Performance Polymers, in Performance Materials were more than offset by lower ethylene price
and volume and negative currency impact. Operating earnings included a $33 million benefit from the sale of a business and tax benefits associated with a
manufacturing site.
Pricing gains, cost reductions and continued productivity in Agriculture were more than offset by the negative impact of currency and about a $30 million negative
impact from the LaPorte shutdown. Prior year results benefitted from a timing impact from performance-based compensation adjustments and $36 million in gains
from portfolio actions.
Key Factors
$11 $6 ($45) $9 ($188)
($23) ($5)
4Q14 IB Other N&H E&C S&P Perf Mat Ag 4Q15
$788
Segment
Operating
Earnings* $553
Segment
Operating
Earnings*
Balance Sheet and Cash December 31, 2015
6
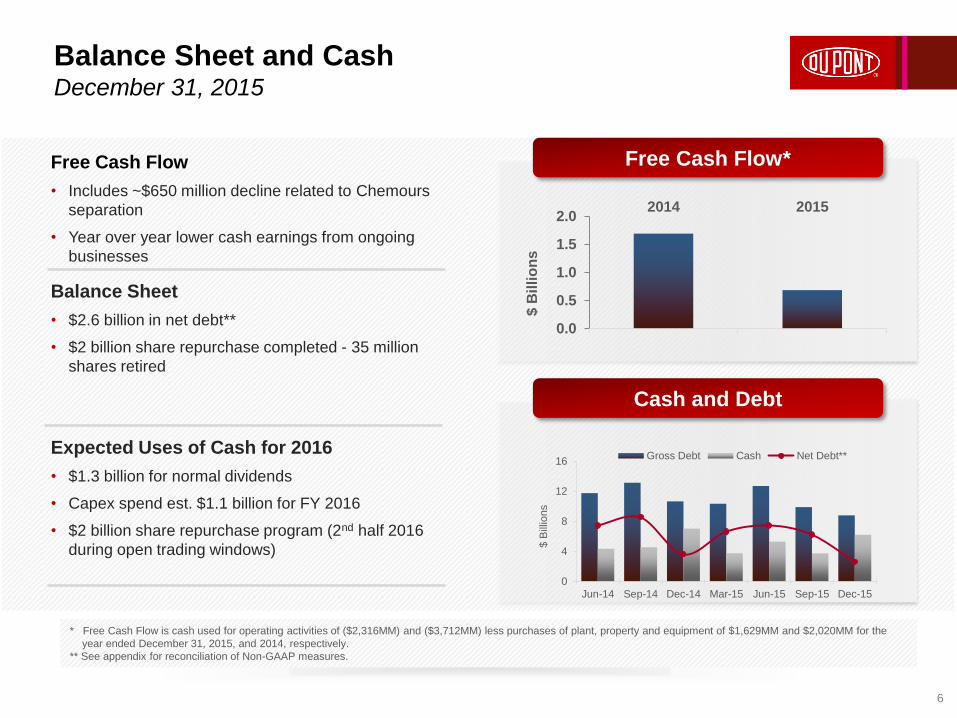
Free Cash Flow
• Includes ~$650 million decline related to Chemours
separation
• Year over year lower cash earnings from ongoing
businesses
Balance Sheet
• $2.6 billion in net debt**
• $2 billion share repurchase completed - 35 million
shares retired
Expected Uses of Cash for 2016
• $1.3 billion for normal dividends
• Capex spend est. $1.1 billion for FY 2016
• $2 billion share repurchase program (2nd half 2016
during open trading windows)
0.0
0.5
1.0
1.5
2.02014 2015
$ B
illi
on
s
0
4
8
12
16
Jun-14 Sep-14 Dec-14 Mar-15 Jun-15 Sep-15 Dec-15
$ B
illio
ns
Gross Debt Cash Net Debt**
Free Cash Flow*
Cash and Debt
* Free Cash Flow is cash used for operating activities of ($2,316MM) and ($3,712MM) less purchases of plant, property and equipment of $1,629MM and $2,020MM for the
year ended December 31, 2015, and 2014, respectively.
** See appendix for reconciliation of Non-GAAP measures.
2013 Highlights
Other Highlights
7
• Redesign initiative contributed incremental $0.10 per share to operating earnings in the quarter; delivered $0.40 per
share in incremental savings for full year 2015
• 2016 Global Cost Savings and Restructuring Plan to generate $1.0B in cost savings on a run-rate basis, which
represents about $730 million in cost reductions in 2016 versus prior year
• $2 billion accelerated share repurchase program completed in 4Q
• On December 11, 2015, DuPont and The Dow Chemical Company announced an all-stock merger of equals. The
combined company will be named DowDuPont. The merger is expected to close in the second half of 2016, subject to
customary closing conditions, including regulatory approvals, and approval by both Dow and DuPont shareholders
• Announced first-quarter 2016 dividend of $0.38 per share
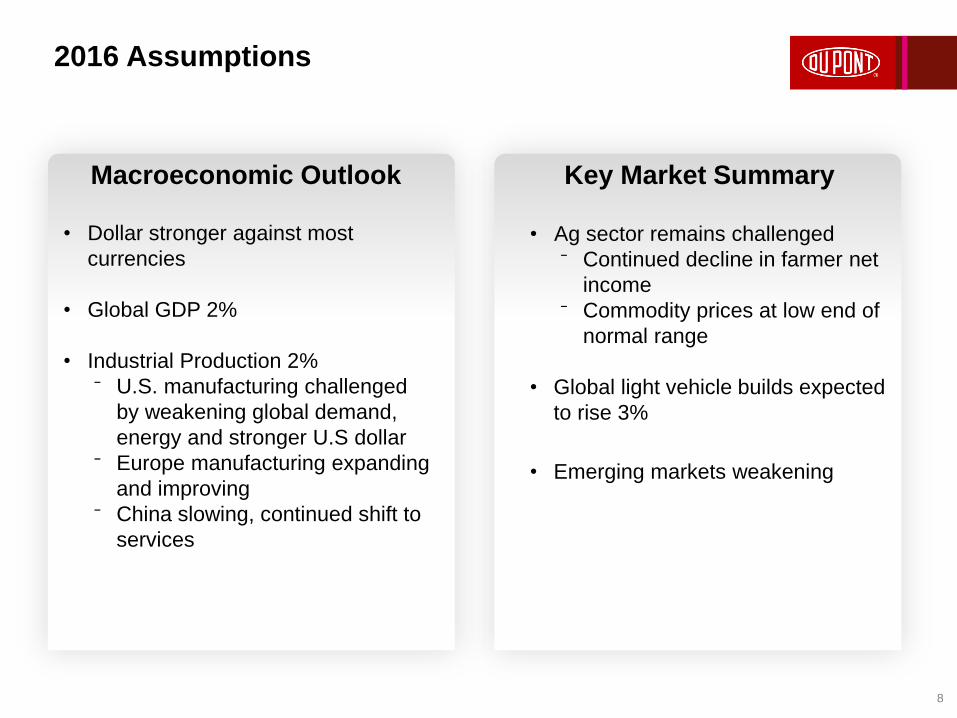
2016 Assumptions
8
Key Market Summary Macroeconomic Outlook
• Ag sector remains challenged
⁻ Continued decline in farmer net
income
⁻ Commodity prices at low end of
normal range
• Global light vehicle builds expected
to rise 3%
• Emerging markets weakening
• Dollar stronger against most
currencies
• Global GDP 2%
• Industrial Production 2%
⁻ U.S. manufacturing challenged
by weakening global demand,
energy and stronger U.S dollar
⁻ Europe manufacturing expanding
and improving
⁻ China slowing, continued shift to
services
Full Year 2016 Expectations and Outlook
9
• Net sales down low-single-digits versus prior year due to impact of currency
and continued challenges in agriculture and emerging markets; excluding
currency, sales about even with prior year
• Operating EPS* $2.95 - $3.10 per share
• Includes currency headwind of $0.30 per share
• Includes tax headwind of $0.05 - $0.10 per share
• Includes benefit from cost reductions of $0.64 per share from 2016 Global Cost
Savings and Restructuring Program
• Base tax rate 23%
• Unfavorable versus prior year due to anticipated geographic mix of earnings
• Capital Expenditures ~$1.1 billion
• Items excluded from Operating Earnings*:
• Non-operating pension expense ~$0.15 per share; decrease from 2015 due to
discount rates
• Transaction costs for merger of equals with Dow
* See appendix for reconciliation of Non-GAAP measures
Industrial Biosciences
10
4Q13 4Q14 4Q15 0.0%
5.0%
10.0%
15.0%
20.0%
0
10
20
30
40
50
60
Ma
rgin
$ in
Millio
ns
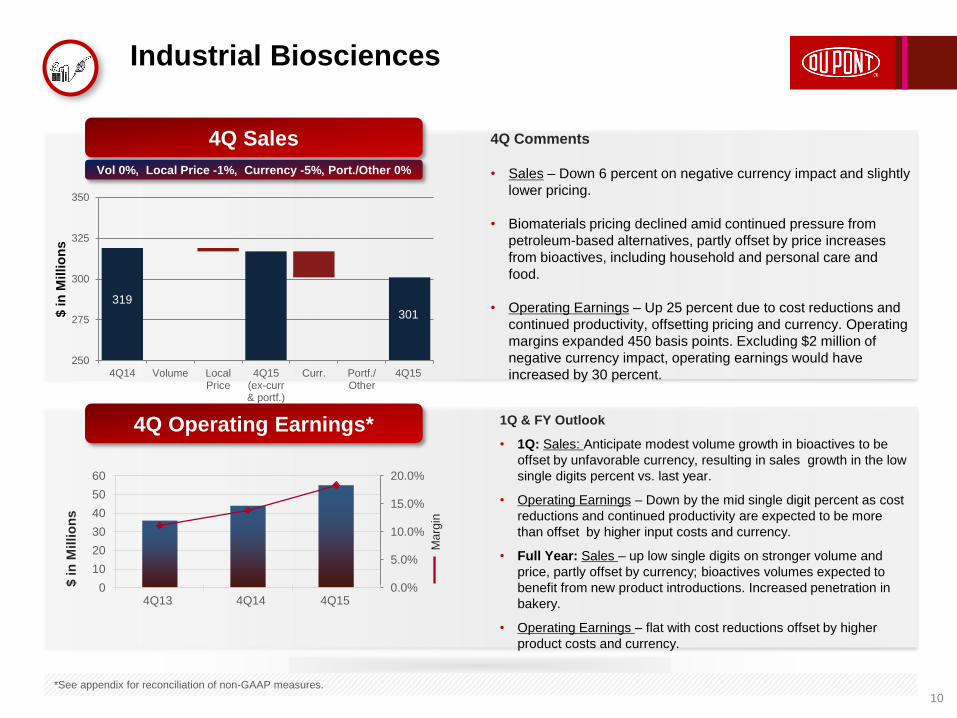
4Q Comments
• Sales – Down 6 percent on negative currency impact and slightly
lower pricing.
• Biomaterials pricing declined amid continued pressure from
petroleum-based alternatives, partly offset by price increases
from bioactives, including household and personal care and
food.
• Operating Earnings – Up 25 percent due to cost reductions and
continued productivity, offsetting pricing and currency. Operating
margins expanded 450 basis points. Excluding $2 million of
negative currency impact, operating earnings would have
increased by 30 percent.
1Q & FY Outlook
• 1Q: Sales: Anticipate modest volume growth in bioactives to be
offset by unfavorable currency, resulting in sales growth in the low
single digits percent vs. last year.
• Operating Earnings – Down by the mid single digit percent as cost
reductions and continued productivity are expected to be more
than offset by higher input costs and currency.
• Full Year: Sales – up low single digits on stronger volume and
price, partly offset by currency; bioactives volumes expected to
benefit from new product introductions. Increased penetration in
bakery.
• Operating Earnings – flat with cost reductions offset by higher
product costs and currency.
*See appendix for reconciliation of non-GAAP measures.
4Q Operating Earnings*
4Q Sales
Vol 0%, Local Price -1%, Currency -5%, Port./Other 0%
250
275
300
325
350
4Q14 Volume LocalPrice
4Q15(ex-curr& portf.)
Curr. Portf./Other
4Q15
$ in
Millio
ns
319
301
Nutrition & Health
11
*See appendix for reconciliation of non-GAAP measures.
4Q13 4Q14 4Q15 0%
3%
6%
9%
12%
0
20
40
60
80
100
Ma
rgin
$ in
Millio
ns
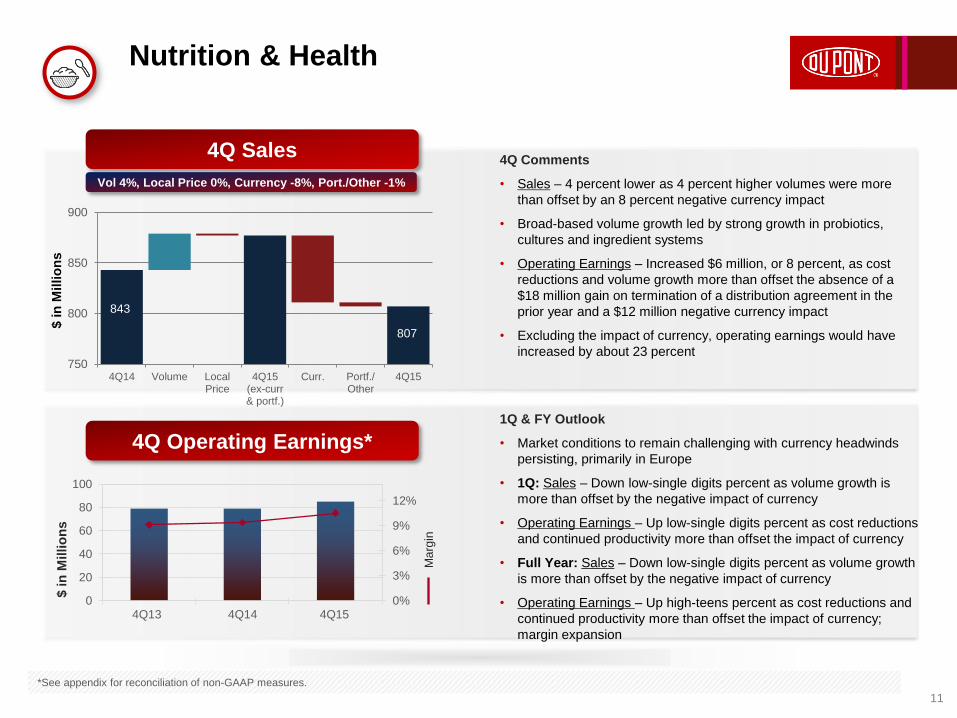
4Q Comments
• Sales – 4 percent lower as 4 percent higher volumes were more
than offset by an 8 percent negative currency impact
• Broad-based volume growth led by strong growth in probiotics,
cultures and ingredient systems
• Operating Earnings – Increased $6 million, or 8 percent, as cost
reductions and volume growth more than offset the absence of a
$18 million gain on termination of a distribution agreement in the
prior year and a $12 million negative currency impact
• Excluding the impact of currency, operating earnings would have
increased by about 23 percent
1Q & FY Outlook
• Market conditions to remain challenging with currency headwinds
persisting, primarily in Europe
• 1Q: Sales – Down low-single digits percent as volume growth is
more than offset by the negative impact of currency
• Operating Earnings – Up low-single digits percent as cost reductions
and continued productivity more than offset the impact of currency
• Full Year: Sales – Down low-single digits percent as volume growth
is more than offset by the negative impact of currency
• Operating Earnings – Up high-teens percent as cost reductions and
continued productivity more than offset the impact of currency;
margin expansion
4Q Operating Earnings*
4Q Sales
Vol 4%, Local Price 0%, Currency -8%, Port./Other -1%
750
800
850
900
4Q14 Volume LocalPrice
4Q15(ex-curr& portf.)
Curr. Portf./Other
4Q15
$ in
Millio
ns
843
807
* See appendix for reconciliation of non-GAAP measures.
Electronics & Communications
12
4Q13 4Q14 4Q15 0%
5%
10%
15%
20%
0
25
50
75
100
Ma
rgin
$ in
Millio
ns
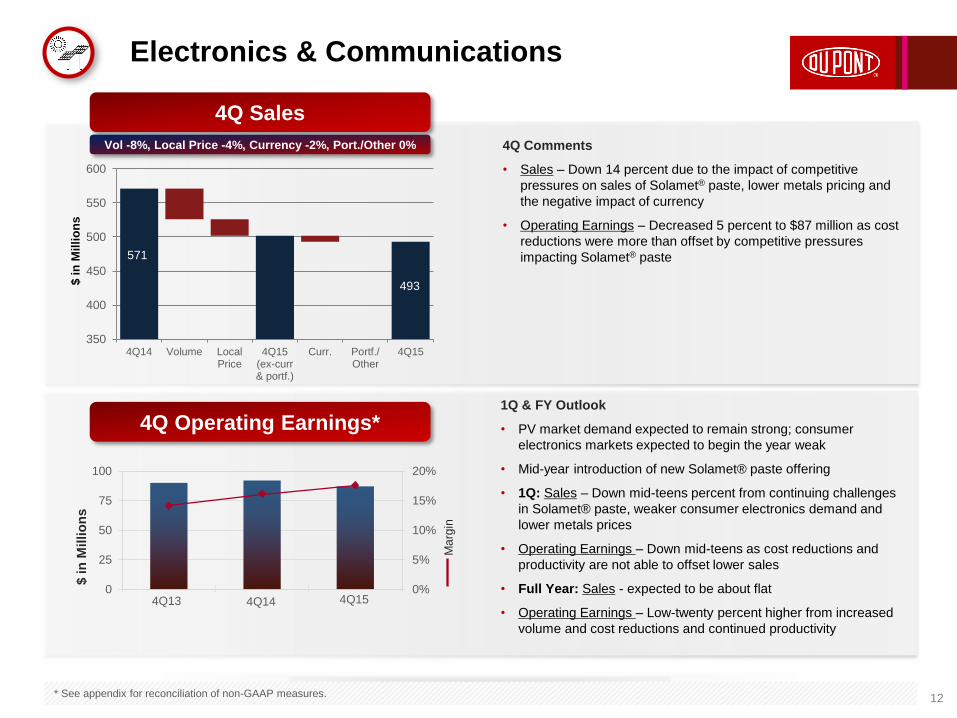
4Q Comments
• Sales – Down 14 percent due to the impact of competitive
pressures on sales of Solamet® paste, lower metals pricing and
the negative impact of currency
• Operating Earnings – Decreased 5 percent to $87 million as cost
reductions were more than offset by competitive pressures
impacting Solamet® paste
1Q & FY Outlook
• PV market demand expected to remain strong; consumer
electronics markets expected to begin the year weak
• Mid-year introduction of new Solamet® paste offering
• 1Q: Sales – Down mid-teens percent from continuing challenges
in Solamet® paste, weaker consumer electronics demand and
lower metals prices
• Operating Earnings – Down mid-teens as cost reductions and
productivity are not able to offset lower sales
• Full Year: Sales - expected to be about flat
• Operating Earnings – Low-twenty percent higher from increased
volume and cost reductions and continued productivity
4Q Operating Earnings*
4Q Sales
Vol -8%, Local Price -4%, Currency -2%, Port./Other 0%
350
400
450
500
550
600
4Q14 Volume LocalPrice
4Q15(ex-curr& portf.)
Curr. Portf./Other
4Q15
$
in
Mil
lio
ns
571
493
Safety & Protection Protection Technologies (DPT), Building Innovations (BI), Sustainable
Solutions (DSS)
13
4Q13 4Q14 4Q15 0%
5%
10%
15%
20%
25%
0
50
100
150
200
250
Ma
rgin
$ in
Millio
ns
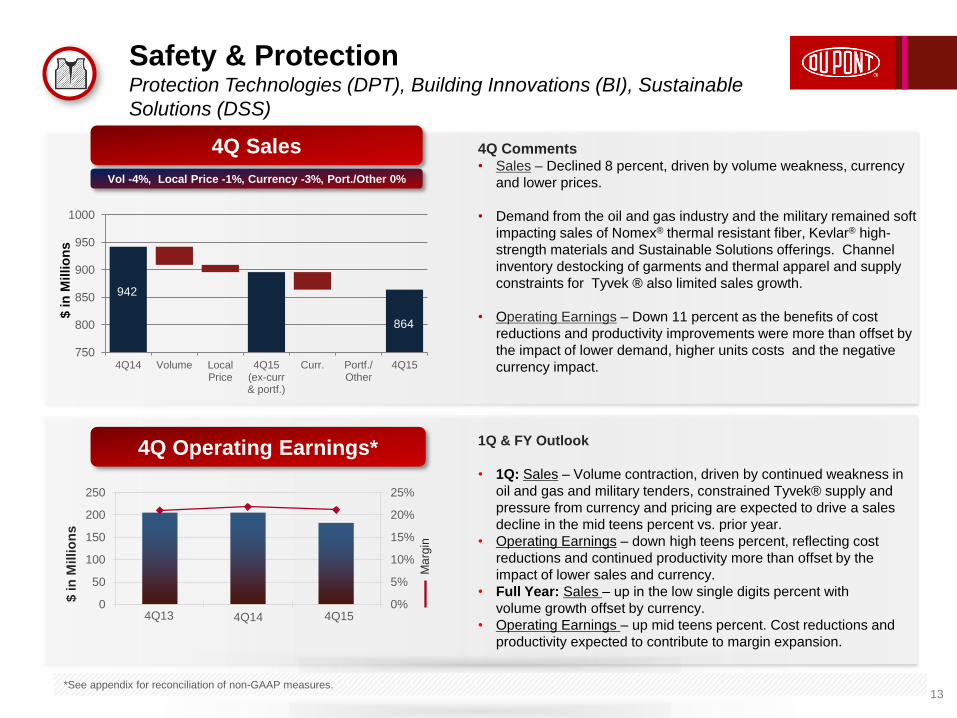
4Q Comments • Sales – Declined 8 percent, driven by volume weakness, currency
and lower prices.
• Demand from the oil and gas industry and the military remained soft
impacting sales of Nomex® thermal resistant fiber, Kevlar® high-
strength materials and Sustainable Solutions offerings. Channel
inventory destocking of garments and thermal apparel and supply
constraints for Tyvek ® also limited sales growth.
• Operating Earnings – Down 11 percent as the benefits of cost
reductions and productivity improvements were more than offset by
the impact of lower demand, higher units costs and the negative
currency impact.
1Q & FY Outlook
• 1Q: Sales – Volume contraction, driven by continued weakness in
oil and gas and military tenders, constrained Tyvek® supply and
pressure from currency and pricing are expected to drive a sales
decline in the mid teens percent vs. prior year.
• Operating Earnings – down high teens percent, reflecting cost
reductions and continued productivity more than offset by the
impact of lower sales and currency.
• Full Year: Sales – up in the low single digits percent with
volume growth offset by currency.
• Operating Earnings – up mid teens percent. Cost reductions and
productivity expected to contribute to margin expansion.
4Q Operating Earnings*
4Q Sales
Vol -4%, Local Price -1%, Currency -3%, Port./Other 0%
*See appendix for reconciliation of non-GAAP measures.
750
800
850
900
950
1000
4Q14 Volume LocalPrice
4Q15(ex-curr& portf.)
Curr. Portf./Other
4Q15
942
864
$ in
Millio
ns
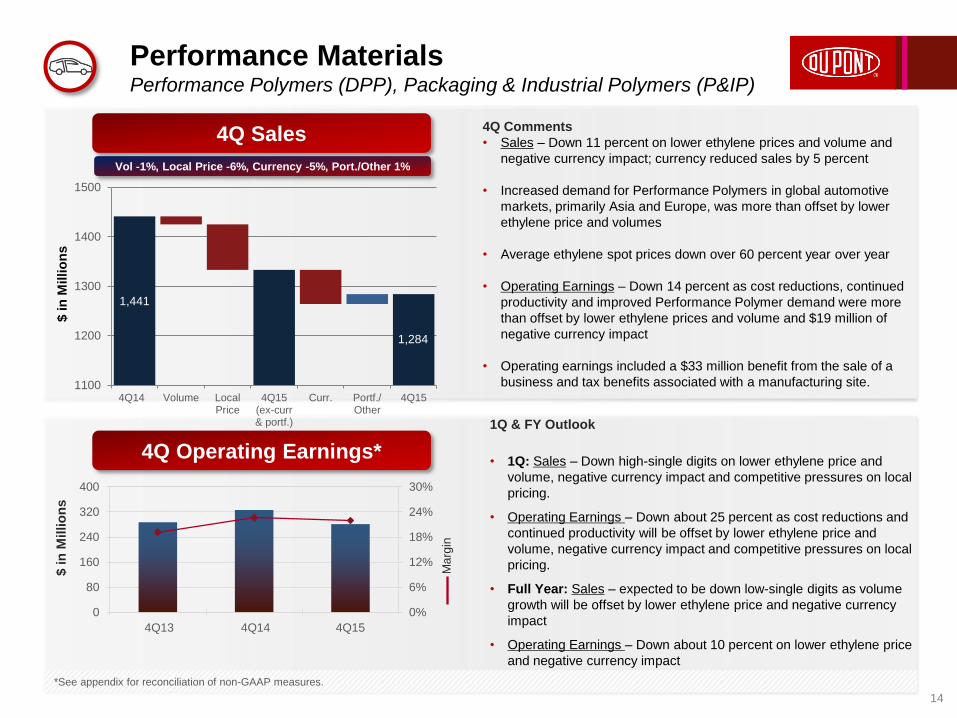
Performance Materials Performance Polymers (DPP), Packaging & Industrial Polymers (P&IP)
14
4Q13 4Q14 4Q15
0%
6%
12%
18%
24%
30%
0
80
160
240
320
400
Ma
rgin
$ in
Millio
ns
4Q Comments
• Sales – Down 11 percent on lower ethylene prices and volume and
negative currency impact; currency reduced sales by 5 percent
• Increased demand for Performance Polymers in global automotive
markets, primarily Asia and Europe, was more than offset by lower
ethylene price and volumes
• Average ethylene spot prices down over 60 percent year over year
• Operating Earnings – Down 14 percent as cost reductions, continued
productivity and improved Performance Polymer demand were more
than offset by lower ethylene prices and volume and $19 million of
negative currency impact
• Operating earnings included a $33 million benefit from the sale of a
business and tax benefits associated with a manufacturing site.
*See appendix for reconciliation of non-GAAP measures.
4Q Operating Earnings*
4Q Sales
Vol -1%, Local Price -6%, Currency -5%, Port./Other 1%
$ in
Millio
ns
1,441
1100
1200
1300
1400
1500
4Q14 Volume LocalPrice
4Q15(ex-curr& portf.)
Curr. Portf./Other
4Q15
1,284
1Q & FY Outlook
• 1Q: Sales – Down high-single digits on lower ethylene price and
volume, negative currency impact and competitive pressures on local
pricing.
• Operating Earnings – Down about 25 percent as cost reductions and
continued productivity will be offset by lower ethylene price and
volume, negative currency impact and competitive pressures on local
pricing.
• Full Year: Sales – expected to be down low-single digits as volume
growth will be offset by lower ethylene price and negative currency
impact
• Operating Earnings – Down about 10 percent on lower ethylene price
and negative currency impact
*See appendix for reconciliation of non-GAAP measures.
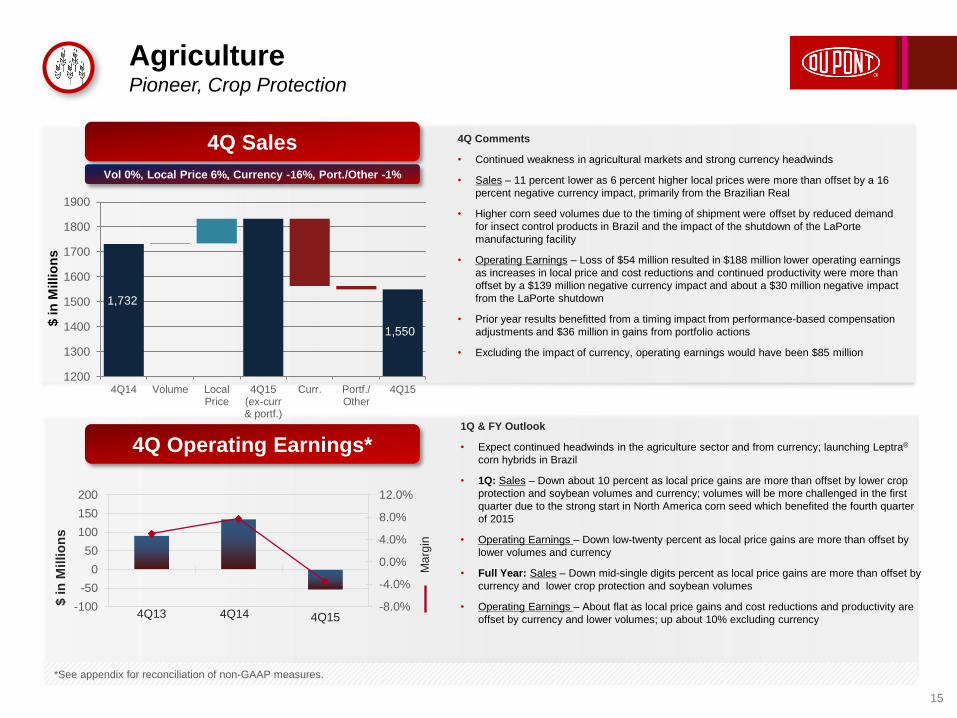
Agriculture Pioneer, Crop Protection
15
4Q13 4Q14 4Q15 -8.0%
-4.0%
0.0%
4.0%
8.0%
12.0%
-100
-50
0
50
100
150
200
Ma
rgin
$ in
Millio
ns
1Q & FY Outlook
• Expect continued headwinds in the agriculture sector and from currency; launching Leptra®
corn hybrids in Brazil
• 1Q: Sales – Down about 10 percent as local price gains are more than offset by lower crop
protection and soybean volumes and currency; volumes will be more challenged in the first
quarter due to the strong start in North America corn seed which benefited the fourth quarter
of 2015
• Operating Earnings – Down low-twenty percent as local price gains are more than offset by
lower volumes and currency
• Full Year: Sales – Down mid-single digits percent as local price gains are more than offset by
currency and lower crop protection and soybean volumes
• Operating Earnings – About flat as local price gains and cost reductions and productivity are
offset by currency and lower volumes; up about 10% excluding currency
4Q Comments
• Continued weakness in agricultural markets and strong currency headwinds
• Sales – 11 percent lower as 6 percent higher local prices were more than offset by a 16
percent negative currency impact, primarily from the Brazilian Real
• Higher corn seed volumes due to the timing of shipment were offset by reduced demand
for insect control products in Brazil and the impact of the shutdown of the LaPorte
manufacturing facility
• Operating Earnings – Loss of $54 million resulted in $188 million lower operating earnings
as increases in local price and cost reductions and continued productivity were more than
offset by a $139 million negative currency impact and about a $30 million negative impact
from the LaPorte shutdown
• Prior year results benefitted from a timing impact from performance-based compensation
adjustments and $36 million in gains from portfolio actions
• Excluding the impact of currency, operating earnings would have been $85 million
4Q Operating Earnings*
4Q Sales
Vol 0%, Local Price 6%, Currency -16%, Port./Other -1%
1200
1300
1400
1500
1600
1700
1800
1900
4Q14 Volume LocalPrice
4Q15(ex-curr& portf.)
Curr. Portf./Other
4Q15
1,732
$ in
Millio
ns
1,550
APPENDIX 1:
FOURTH QUARTER 2015 SEGMENT COMMENTARY
This data should be read in conjunction with the Company’s fourth quarter earnings news
release dated January 26, 2016, DuPont’s 4Q 2015 Earnings Conference Call presentation
materials and reconciliations of non-GAAP to GAAP measures included in the presentation
materials and posted on the DuPont Investor Center website at www.dupont.com.
1/25/2016 16
Segment Commentary Fourth Quarter Earnings 2015
17
Industrial Biosciences
In Industrial Biosciences, fourth-quarter sales declined 6 percent as flat volumes were more than offset by significant
pressure from currency and slightly lower prices. Volume in enzymes, animal nutrition and biomaterials was flat with the
prior year. While strength in household and personal care and food helped Bioactives deliver volume and price
improvements, these gains were more than offset by currency and unfavorable pricing trends in Biomaterials, which saw
continued pressure from petroleum-based alternatives.
Despite the sales decline, operating earnings of $55 million increased 25 percent ($11 million) in the quarter, due to cost
reductions and continued productivity partly offset by negative pricing. Operating margins improved 450 basis points year
over year. Excluding a $2 million negative impact of currency, operating earnings would have increased by 30 percent.
Sales for Industrial Biosciences for the full year matched the fourth-quarter trend, declining 6 percent, driven by currency.
Volume growth and pricing gains in Bioactives offset weakness in Biomaterials.
Operating earnings rose 6% to $203 million for 2015. Volume gains, cost reductions and productivity more than offset
pressure from price/mix and currency.
Turning to 2016, in the first quarter, we anticipate sales up by the low single digits percent, reflecting volume growth from
bioactives partly offset by continued pressure from currency.
We expect first-quarter operating earnings to to be down by the mid single digit percent, with cost reductions and
continued productivity offset by higher input costs and currency.
As for the full-year outlook, we project 2016 sales growth in the low-single digits percent, driven by volume improvement,
pricing and the impact of new product introductions in bioactives, including increased market penetration in the food
segment. We anticipate that operating earnings will be about flat, as cost savings and productivity are expected to be
offset by higher product costs and currency.
In Nutrition & Health, the business continued to deliver solid results and margin improvement despite significant
headwinds from currency. Sales were 4 percent lower as broad-based volume growth of 4 percent -- led by probiotics,
cultures, and ingredient systems -- was more than offset by an 8 percent negative impact from currency. Operating
earnings increased $6 million, or 8 percent, as cost reductions, productivity improvements and volume growth more than
offset the absence of a $18 million gain on termination of a distribution agreement in the prior year and a $12 million
negative currency impact. Excluding the impact of currency, operating earnings would have increased by about 23
percent.
For the full year, sales were 8 percent lower as solid volume growth in a challenging market was more than offset by the
negative impact of currency. Operating earnings were up 1 percent as cost reductions, productivity improvements and
volume gains more than offset the negative impact of currency. Excluding the impact of currency, operating earnings
would have increased by about 15 percent. Full-year operating margin improved about 110 basis points, and we have
grown operating margins year-over-year for ten consecutive quarters.
Looking forward to 2016, market conditions are expected to remain challenging with currency headwinds persisting,
primarily in Europe. In the first quarter, we expect sales to be down low-single digits percent as volume growth is more
than offset by the negative impact of currency with operating earnings up low-single digits percent, benefitting from cost
reductions and continued productivity.
Full-year 2016 sales are expected to be down low-single digits percent as volume growth, driven by investments in
probiotics and cultures, is more than offset by the negative impact of currency. We expect operating earnings will be up
high-teens percent, benefiting from cost reductions and productivity improvements, further expanding operating margins.
Segment Commentary Fourth Quarter Earnings 2015
18
Nutrition & Health
In Electronics & Communications, fourth-quarter sales were 14 percent lower due to the impact of competitive pressures
on sales of Solamet® paste, lower metals pricing and the negative impact of currency. Operating earnings of $87 million
decreased $5 million, or 5 percent, as cost reductions and continued productivity were more than offset by lower sales of
Solamet® paste.
For the full year, sales were 13 percent lower as volume growth in Tedlar® film in photovoltaics and in consumer
electronics related businesses was more than offset by the impact of competitive pressures on sales of Solamet® paste,
lower metals pricing and the negative impact of currency. Operating earnings were 7 percent higher as cost reductions
and productivity improvements more than offset lower sales.
Looking forward to 2016, we expect the photovoltaic market to remain strong with module installations forecasted to
increase mid-teens percent, driving strong growth in Tedlar® film in photovoltaics. Segment results are expected to
continue to be negatively impacted by declines in Solamet® paste with the impact lessening in the second half of the year
due to more favorable year-over-year comparisons and expected new product introductions. We anticipate consumer
electronics markets will have a weaker start to the year but strengthen in the second half as channel inventories are
worked off.
For the first quarter we expect sales to be down mid-teens percent from continuing challenges in Solamet® paste, weaker
consumer electronics demand and lower metals prices. Operating earnings are expected to be down mid-teens percent
as cost reductions and productivity are not able to offset lower sales.
Full year 2016 sales are expected to be about flat as strong volume growth in Tedlar® film for photovoltaics is offset by
lower sales of Solamet® paste and lower metals pricing. For the full year we expect operating earnings to be in the low-
twenty percent range higher from increased volume and cost reductions and continued productivity improvements.
Segment Commentary Fourth Quarter Earnings 2015
19
Electronics & Communications
Segment Commentary Fourth Quarter Earnings 2015
20
Safety & Protection
Sales of $864 million in the fourth quarter declined 8 percent on a 4-percent negative impact of volume, a 3-percent negative
impact of currency and a 1-percent negative impact from price. Demand from the oil and gas industry and the military was
weak, which lowered sales of Nomex® thermal resistant fiber, Kevlar® high-strength materials, and Sustainable Solutions
offerings. Supply constraints for Tyvek® limited its sales growth for the quarter.
Fourth-quarter operating earnings of $182 million declined 11 percent, including $2 million of negative impact from currency.
Benefits from cost reductions and continued productivity were more than offset by pressure from volume declines, higher unit
costs and currency.
For 2015, sales of $3.5 billion declined by 9 percent. Excluding 4 points of pressure from currency and 4 points from portfolio
changes, sales declined 1 percent due to softness in volume.
Operating earnings for the segment in 2015 declined by 9 percent to $704 million, including benefits from cost reductions and
productivity, more than offset by higher unit costs associated with the Chamber Works outage, unfavorable currency and
volumes.
Turning to 2016, in the first quarter, sales are expected to be down by the mid teens percent, driven by volume declines
(reflecting continued weakness in oil and gas and military tenders), pressure from currency and pricing. We anticipate
operating earnings to be down high teens percent vs. prior year, as cost reductions and continued productivity will be more
than offset by the impact of our lower sales and currency.
Looking ahead to full-year 2016, we project sales up in the low single digits percent, with volume growth partly offset by
currency pressures. Operating earnings are anticipated to grow by the mid teens percent, based on cost reductions and
productivity improvements, leading to operating margin expansion for the year.
Segment Commentary Fourth Quarter Earnings 2015
21
Performance Materials
Sales of $1.3 billion were down 11 percent on lower ethylene prices and the negative impact of currency. Price was down
6 percent in the quarter, with average ethylene spot prices down over 60 percent year over year. Currency negatively
impacted sales by 5 percent.
Segment volume decreased 1 percent as increased demand for Performance Polymers in global automotive markets,
primarily Asia and Europe, was offset by lower ethylene volumes.
According to IHS, global automotive market demand was up 2 percent in the fourth quarter, driven by growth in China,
Europe and North America. IHS forecasts 8 percent growth in China as a result of economic stimulus actions in the
quarter. IHS is forecasting year over year growth of 3 percent in 2016, with 2 percent growth in first quarter versus prior
year.
Operating earnings were down 14 percent as cost reductions, productivity improvements and increased Performance
Polymer demand were more than offset by lower ethylene price and volume and $19 million of negative impact from
currency. Operating earnings included a $33 million benefit from the sale of a business and realization of tax benefits
associated with a manufacturing site.
Full year operating earnings were down 4 percent, as cost reductions, productivity improvements and volume growth for
ethylene were more than offset by $132 million of negative currency impact, lower ethylene price and the portfolio change
from the sale of Glass Laminating Solutions/Vinyls. Prior year ethylene sales were constrained due to the scheduled
outage at the ethylene unit in Orange, Texas. Excluding the impact of currency, operating earnings increased 6 percent
year over year. Operating margins increased 200 basis points to close the year at about 23 percent.
Segment Commentary Fourth Quarter Earnings 2015
22
Performance Materials (continued)
For the first quarter, we anticipate sales will be down in the high-single-digits percent range, with operating earnings down
about 25 percent, on lower ethylene price and volume, the negative impact of currency and competitive pressure on local
pricing.
For the full year of 2016, we anticipate sales down in the low-single digits and operating earnings down about 10 percent
as volume growth will be more than offset by lower ethylene price and the negative impact of currency. 2015 operating
earnings included $49 million of benefits from a joint venture, the sale of a business and realization of tax benefits
associated with a manufacturing site.
Segment Commentary Third Quarter Earnings 2015
23
Agriculture
In our Agriculture segment, fourth-quarter sales are largely driven by the summer and Safrinha seasons in Latin America and
the beginning of shipments to customers in the northern hemisphere in advance of the 2016 planting season. Continued
challenging conditions in agriculture markets were compounded by strong currency headwinds, particularly from a weaker
Brazilian Real.
Fourth-quarter Agriculture sales were 11 percent lower as 6 percent higher local prices were more than offset by a 16
percent negative currency impact. The segment had a 1 percent negative impact from portfolio actions. Seed sales were 2
percent higher, and crop protection sales were down 24 percent versus last year.
Higher corn seed volumes from a strong start to the North America season and a shift in seasonal timing in Brazil (which
benefited the fourth quarter versus the third quarter) were offset by lower crop protection volumes. Low expected insect
pressure, the adoption of insect-protected soybean varieties, higher inventories and a challenging macro environment have
softened the demand for insect control products, where we have a strong market position. Insect control volumes continue
to be impacted by the shutdown of the LaPorte manufacturing facility.
An operating loss of $54 million resulted in $188 million lower operating earnings as increases in local price and cost
reductions and continued productivity were more than offset by a $139 million negative currency impact and about a $30
million negative impact from the continued shutdown of the LaPorte manufacturing facility. Prior-year results benefitted from
a timing impact from performance-based compensation adjustments and $36 million in gains from portfolio actions.
Excluding the impact of currency, the segment would have reported operating earnings of $85 million.
For the full year, sales decreased 13 percent as higher local prices were more than offset by a 9 percent negative impact of
currency, and lower seed and crop protection volumes. Operating earnings were 30 percent lower as the decrease in sales
Segment Commentary Fourth Quarter Earnings 2015
24
Agriculture (continued)
was partially offset by cost reductions and productivity improvements. Excluding the impact of currency, the segment would
have reported about 5 percent lower operating earnings.
Turning to the outlook for 2016, farmer net returns for row crops continue to trend down as land and rent prices have lagged
the transition to lower commodity prices while grain stocks remain at elevated levels. We expect the economic environment
in the agriculture sector to remain challenged with commodity prices at the low end of normal until demand accelerates or
there is a disruption in global production. Volatile currency markets will also continue to present headwinds given the size of
our businesses in Europe and Latin America. As farmers look to relative economics between crop alternatives, we expect a
slight year-over-year uptick in Brazil Safrinha and North America corn area, provided weather cooperates during planting.
Our order book in North America suggests a modest improvement in corn demand at the expense of soybeans in a highly
competitive seed market. In crop protection, continued weak demand for foliar-applied insecticides in Brazil and elevated
distributor inventories will continue to present challenges.
For the first half of 2016, which reflects the majority of the northern hemisphere season, we expect Agriculture segment
sales to be mid-single digits percent lower with operating earnings low-teens percent below 2015 as local price gains and the
benefit of cost actions are more than offset by lower insecticide and soybean volumes and currency. Our volume forecast
includes a continued impact from the shutdown of the LaPorte manufacturing facility. Volumes will be more challenged in
the first quarter due to the strong start in North America corn seed, which benefited the fourth quarter of 2015 and a larger
first-quarter impact in Brazil crop protection. We expect first quarter sales to be about ten percent lower and operating
earnings in the low-twenty percent range below 2015.
For the full year we expect sales to be down mid-single digits percent and operating earnings about flat as local price gains
and cost actions are offset by currency headwinds and lower volumes. Excluding the impact of currency, we would expect
operating earnings to be up about 10 percent.
Segment Commentary Fourth Quarter Earnings 2015
25
Agriculture (continued)
While markets remain challenging, we are confident in the long-term growth in demand for agricultural products and in our
pipeline of new genetics, unique trait combinations and innovative crop protection solutions coming from our focused
investments in R&D. We are taking disciplined actions to streamline our cost structure and further focus our investments on
the highest growth opportunities, building upon the work we began back in 2014. These actions better position DuPont
Agriculture for the current challenging environment and will allow us to emerge stronger when markets improve.
In Brazil we have successfully launched Leptra® corn hybrids for the Safrinha season. Production plans for Leptra® are on
track for one of the fastest technology ramp-ups in Pioneer history in the summer season. In North America, we held corn
market share in 2015 during one of the most competitive sales seasons in recent history. Our two newest classes of
genetics demonstrated strong harvest performance and are expected to comprise over half of our North America corn sales
volume in 2016. Qrome™ corn products continue to progress well toward commercialization. We will expand testing this
coming summer in our IMPACT™ trials, as we await final import approvals in key markets. While we did lose between one
and two points of North America market share in soybeans, we are very excited about the improved yield performance
growers experienced last fall from our newest classes of T Series soybean. T Series will represent about 80 percent of 2016
soybean volume as we continue meaningful progress in our soybean transition. We also have a strong portfolio of herbicide
options for soybean growers, including varieties tolerant to glyphosate, glufosinate, and our proprietary BOLT™ technology;
we also are currently taking pre-orders for Roundup Ready 2 Xtend™ technology, pending regulatory approvals. In crop
protection we continue to receive registrations of Cyazypyr® insecticide in additional countries and are preparing for new
launches of Zorvec™ fungicide and Pyraxalt™ insecticide for rice, pending regulatory approvals. Finally, while Rynaxypyr®
sales declined in 2015 in Latin America, it remains the foundation of our insect-control lineup with good growth opportunities
in additional crops and countries and from the expansion of seed treatment offerings like Lumivia® in corn.
Roundup® and Xtend™ are registered trademarks of Monsanto Technology LLC used under license. Dicamba herbicide is not currently approved for commercial in-crop
use with soybeans with the Roundup Ready 2 Xtend™ technology and nothing herein is a promotion or an offer to sell dicamba herbicide for this use. It is a violation of
federal law to promote or offer to sell unregistered pesticides or a registered pesticide for an unregistered use.
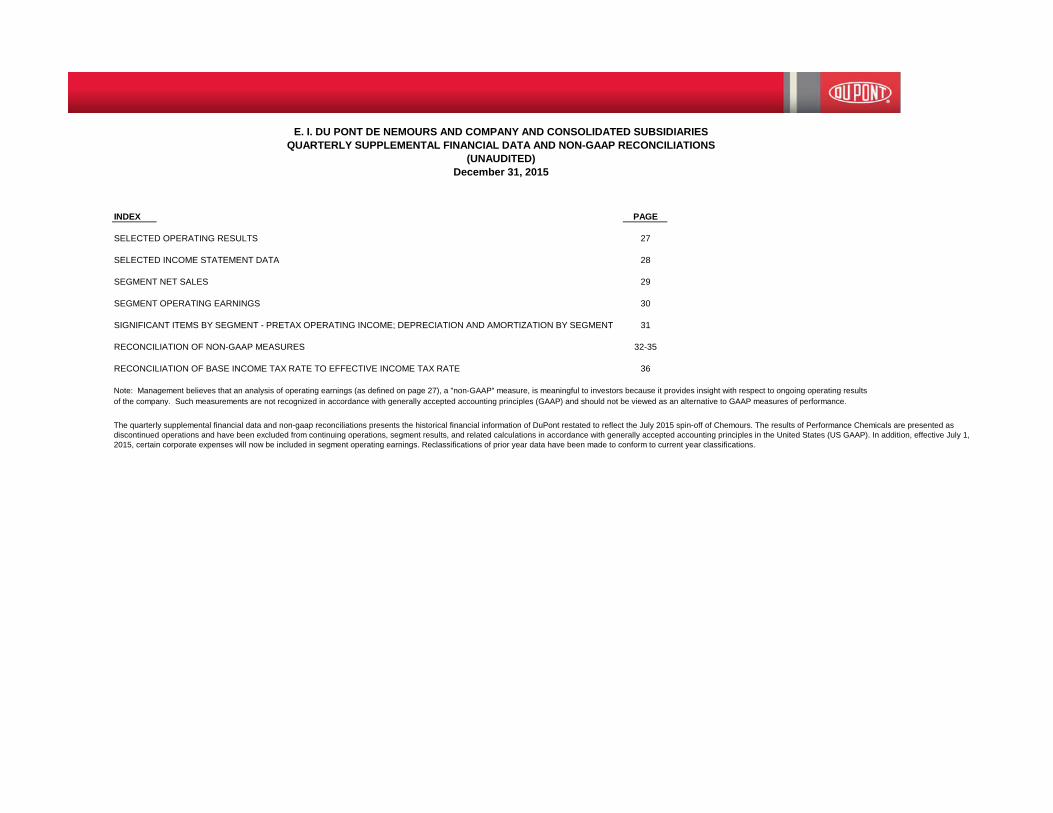
INDEX PAGE
SELECTED OPERATING RESULTS 27
SELECTED INCOME STATEMENT DATA 28
SEGMENT NET SALES 29
SEGMENT OPERATING EARNINGS 30
SIGNIFICANT ITEMS BY SEGMENT - PRETAX OPERATING INCOME; DEPRECIATION AND AMORTIZATION BY SEGMENT 31
RECONCILIATION OF NON-GAAP MEASURES 32-35
RECONCILIATION OF BASE INCOME TAX RATE TO EFFECTIVE INCOME TAX RATE 36
Note: Management believes that an analysis of operating earnings (as defined on page 27), a "non-GAAP" measure, is meaningful to investors because it provides insight with respect to ongoing operating results of the company. Such measurements are not recognized in accordance with generally accepted accounting principles (GAAP) and should not be viewed as an alternative to GAAP measures of performance.
E. I. DU PONT DE NEMOURS AND COMPANY AND CONSOLIDATED SUBSIDIARIESQUARTERLY SUPPLEMENTAL FINANCIAL DATA AND NON-GAAP RECONCILIATIONS
(UNAUDITED)December 31, 2015
The quarterly supplemental financial data and non-gaap reconciliations presents the historical financial information of DuPont restated to reflect the July 2015 spin-off of Chemours. The results of Performance Chemicals are presented as discontinued operations and have been excluded from continuing operations, segment results, and related calculations in accordance with generally accepted accounting principles in the United States (US GAAP). In addition, effective July 1, 2015, certain corporate expenses will now be included in segment operating earnings. Reclassifications of prior year data have been made to conform to current year classifications.
4Q15 Supplemental Financial Data and Non-GAAP Reconciliations 27 1/26/2016
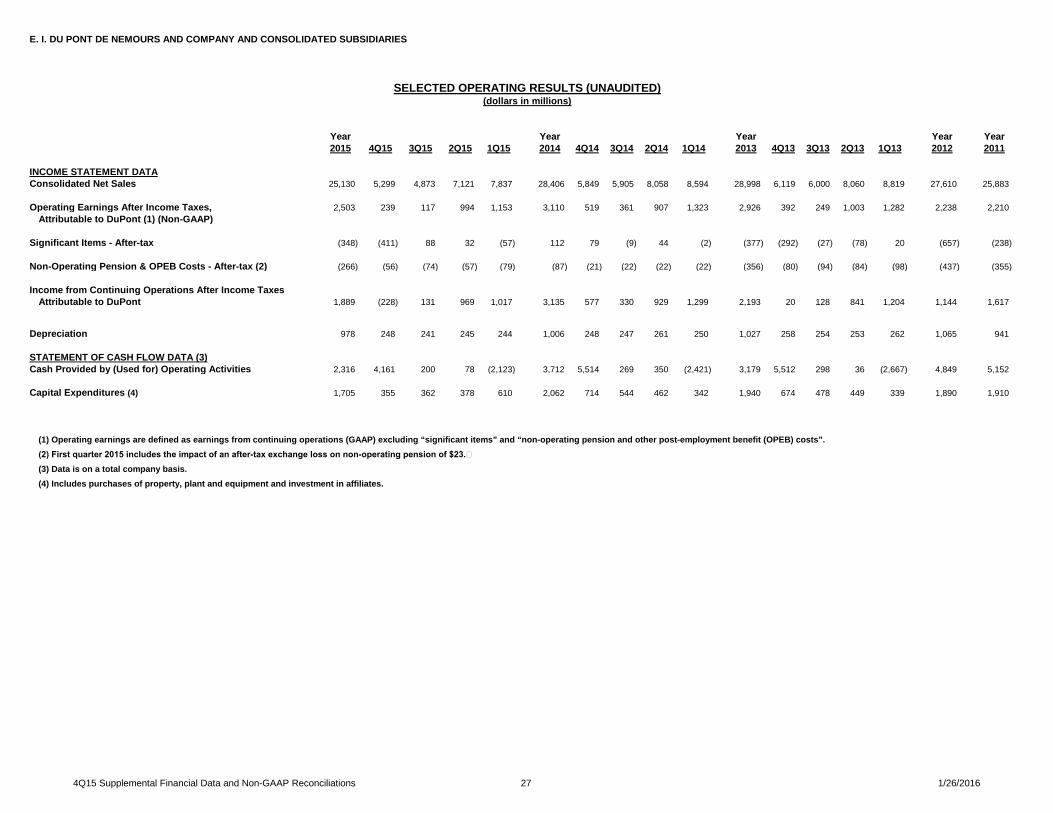
E. I. DU PONT DE NEMOURS AND COMPANY AND CONSOLIDATED SUBSIDIARIES
Year Year Year Year Year2015 4Q15 3Q15 2Q15 1Q15 2014 4Q14 3Q14 2Q14 1Q14 2013 4Q13 3Q13 2Q13 1Q13 2012 2011
INCOME STATEMENT DATAConsolidated Net Sales 25,130 5,299 4,873 7,121 7,837 28,406 5,849 5,905 8,058 8,594 28,998 6,119 6,000 8,060 8,819 27,610 25,883
Operating Earnings After Income Taxes, 2,503 239 117 994 1,153 3,110 519 361 907 1,323 2,926 392 249 1,003 1,282 2,238 2,210 Attributable to DuPont (1) (Non-GAAP)
Significant Items - After-tax (348) (411) 88 32 (57) 112 79 (9) 44 (2) (377) (292) (27) (78) 20 (657) (238)
Non-Operating Pension & OPEB Costs - After-tax (2) (266) (56) (74) (57) (79) (87) (21) (22) (22) (22) (356) (80) (94) (84) (98) (437) (355)
Income from Continuing Operations After Income TaxesAttributable to DuPont 1,889 (228) 131 969 1,017 3,135 577 330 929 1,299 2,193 20 128 841 1,204 1,144 1,617
Depreciation 978 248 241 245 244 1,006 248 247 261 250 1,027 258 254 253 262 1,065 941
STATEMENT OF CASH FLOW DATA (3)Cash Provided by (Used for) Operating Activities 2,316 4,161 200 78 (2,123) 3,712 5,514 269 350 (2,421) 3,179 5,512 298 36 (2,667) 4,849 5,152
Capital Expenditures (4) 1,705 355 362 378 610 2,062 714 544 462 342 1,940 674 478 449 339 1,890 1,910
(1) Operating earnings are defined as earnings from continuing operations (GAAP) excluding “significant items” and “non-operating pension and other post-employment benefit (OPEB) costs”.(2) First quarter 2015 includes the impact of an after-tax exchange loss on non-operating pension of $23.(3) Data is on a total company basis.(4) Includes purchases of property, plant and equipment and investment in affiliates.
SELECTED OPERATING RESULTS (UNAUDITED)(dollars in millions)
4Q15 Supplemental Financial Data and Non-GAAP Reconciliations 28 1/26/2016
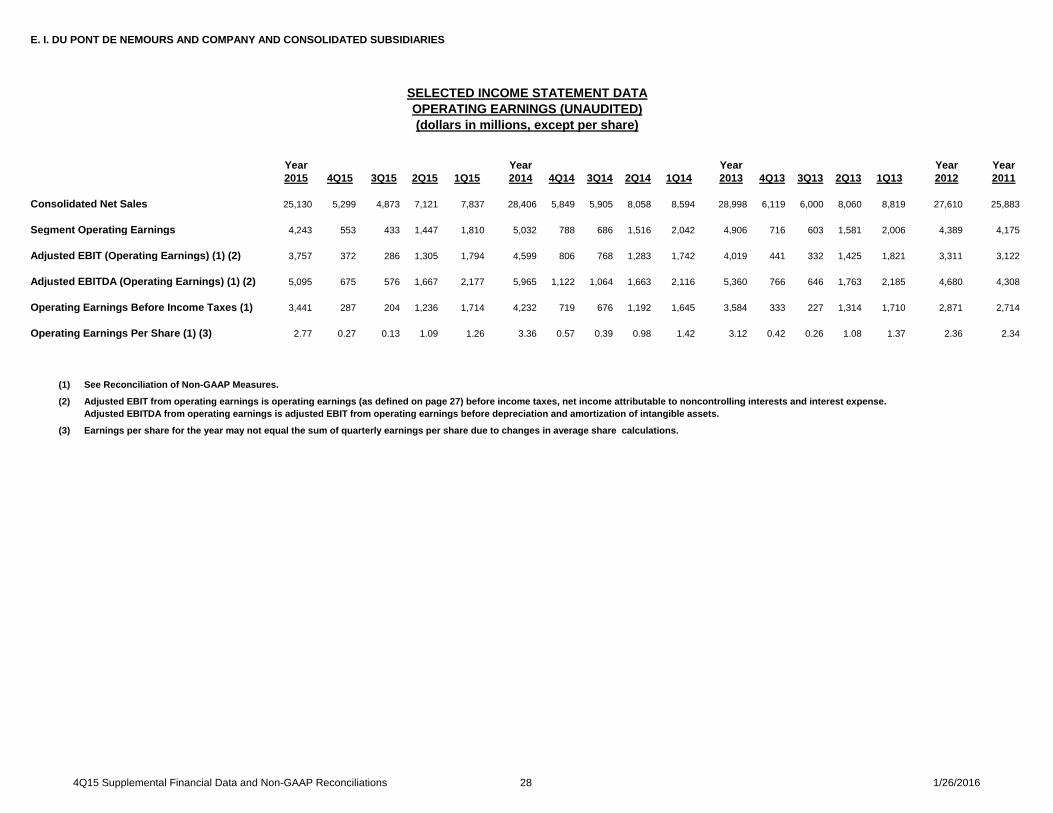
E. I. DU PONT DE NEMOURS AND COMPANY AND CONSOLIDATED SUBSIDIARIES
Year Year Year Year Year2015 4Q15 3Q15 2Q15 1Q15 2014 4Q14 3Q14 2Q14 1Q14 2013 4Q13 3Q13 2Q13 1Q13 2012 2011
Consolidated Net Sales 25,130 5,299 4,873 7,121 7,837 28,406 5,849 5,905 8,058 8,594 28,998 6,119 6,000 8,060 8,819 27,610 25,883
Segment Operating Earnings 4,243 553 433 1,447 1,810 5,032 788 686 1,516 2,042 4,906 716 603 1,581 2,006 4,389 4,175
Adjusted EBIT (Operating Earnings) (1) (2) 3,757 372 286 1,305 1,794 4,599 806 768 1,283 1,742 4,019 441 332 1,425 1,821 3,311 3,122
Adjusted EBITDA (Operating Earnings) (1) (2) 5,095 675 576 1,667 2,177 5,965 1,122 1,064 1,663 2,116 5,360 766 646 1,763 2,185 4,680 4,308
Operating Earnings Before Income Taxes (1) 3,441 287 204 1,236 1,714 4,232 719 676 1,192 1,645 3,584 333 227 1,314 1,710 2,871 2,714
Operating Earnings Per Share (1) (3) 2.77 0.27 0.13 1.09 1.26 3.36 0.57 0.39 0.98 1.42 3.12 0.42 0.26 1.08 1.37 2.36 2.34
(1) See Reconciliation of Non-GAAP Measures.
(2) Adjusted EBIT from operating earnings is operating earnings (as defined on page 27) before income taxes, net income attributable to noncontrolling interests and interest expense. Adjusted EBITDA from operating earnings is adjusted EBIT from operating earnings before depreciation and amortization of intangible assets.
(3) Earnings per share for the year may not equal the sum of quarterly earnings per share due to changes in average share calculations.
SELECTED INCOME STATEMENT DATAOPERATING EARNINGS (UNAUDITED)(dollars in millions, except per share)
4Q15 Supplemental Financial Data and Non-GAAP Reconciliations 29 1/26/2016
E. I. DU PONT DE NEMOURS AND COMPANY AND CONSOLIDATED SUBSIDIARIES
Year Year Year Year Year2015 4Q15 3Q15 2Q15 1Q15 2014 4Q14 3Q14 2Q14 1Q14 2013 4Q13 3Q13 2Q13 1Q13 2012 2011
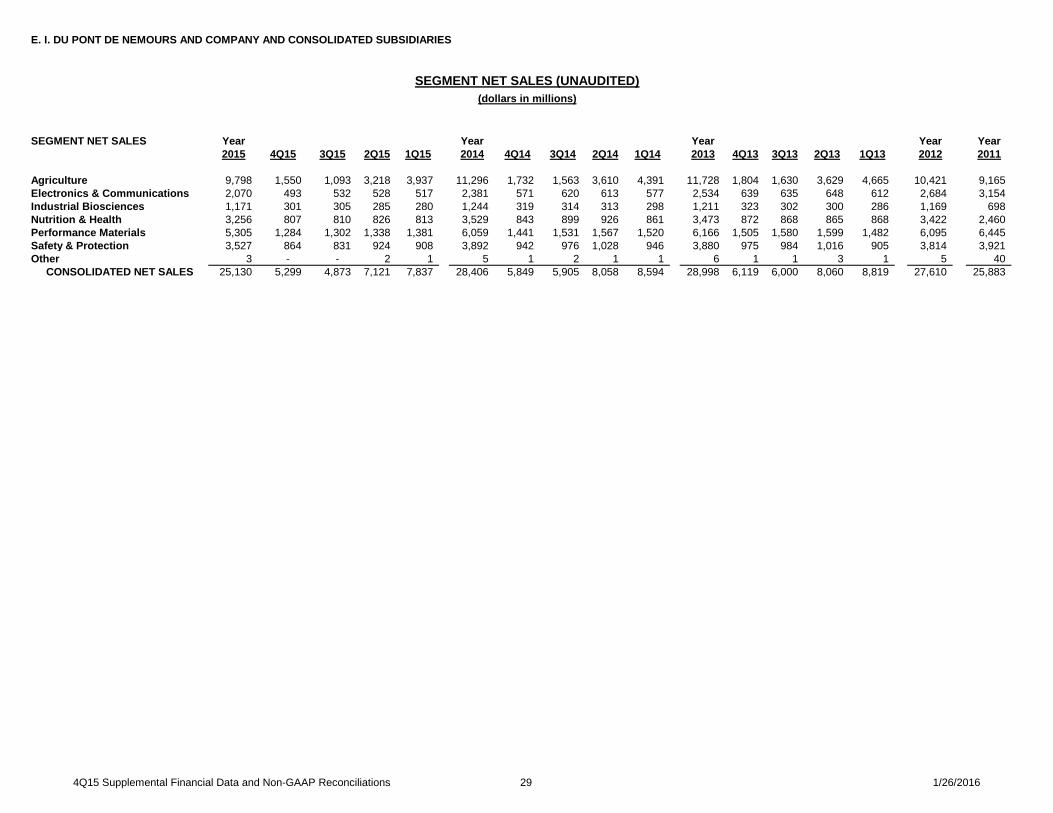
Agriculture 9,798 1,550 1,093 3,218 3,937 11,296 1,732 1,563 3,610 4,391 11,728 1,804 1,630 3,629 4,665 10,421 9,165 Electronics & Communications 2,070 493 532 528 517 2,381 571 620 613 577 2,534 639 635 648 612 2,684 3,154 Industrial Biosciences 1,171 301 305 285 280 1,244 319 314 313 298 1,211 323 302 300 286 1,169 698 Nutrition & Health 3,256 807 810 826 813 3,529 843 899 926 861 3,473 872 868 865 868 3,422 2,460 Performance Materials 5,305 1,284 1,302 1,338 1,381 6,059 1,441 1,531 1,567 1,520 6,166 1,505 1,580 1,599 1,482 6,095 6,445 Safety & Protection 3,527 864 831 924 908 3,892 942 976 1,028 946 3,880 975 984 1,016 905 3,814 3,921 Other 3 - - 2 1 5 1 2 1 1 6 1 1 3 1 5 40 CONSOLIDATED NET SALES 25,130 5,299 4,873 7,121 7,837 28,406 5,849 5,905 8,058 8,594 28,998 6,119 6,000 8,060 8,819 27,610 25,883
SEGMENT NET SALES
SEGMENT NET SALES (UNAUDITED)(dollars in millions)
4Q15 Supplemental Financial Data and Non-GAAP Reconciliations 30 1/26/2016
E. I. DU PONT DE NEMOURS AND COMPANY AND CONSOLIDATED SUBSIDIARIES
Year Year Year Year Year2015 4Q15 3Q15 2Q15 1Q15 2014 4Q14 3Q14 2Q14 1Q14 2013 4Q13 3Q13 2Q13 1Q13 2012 2011
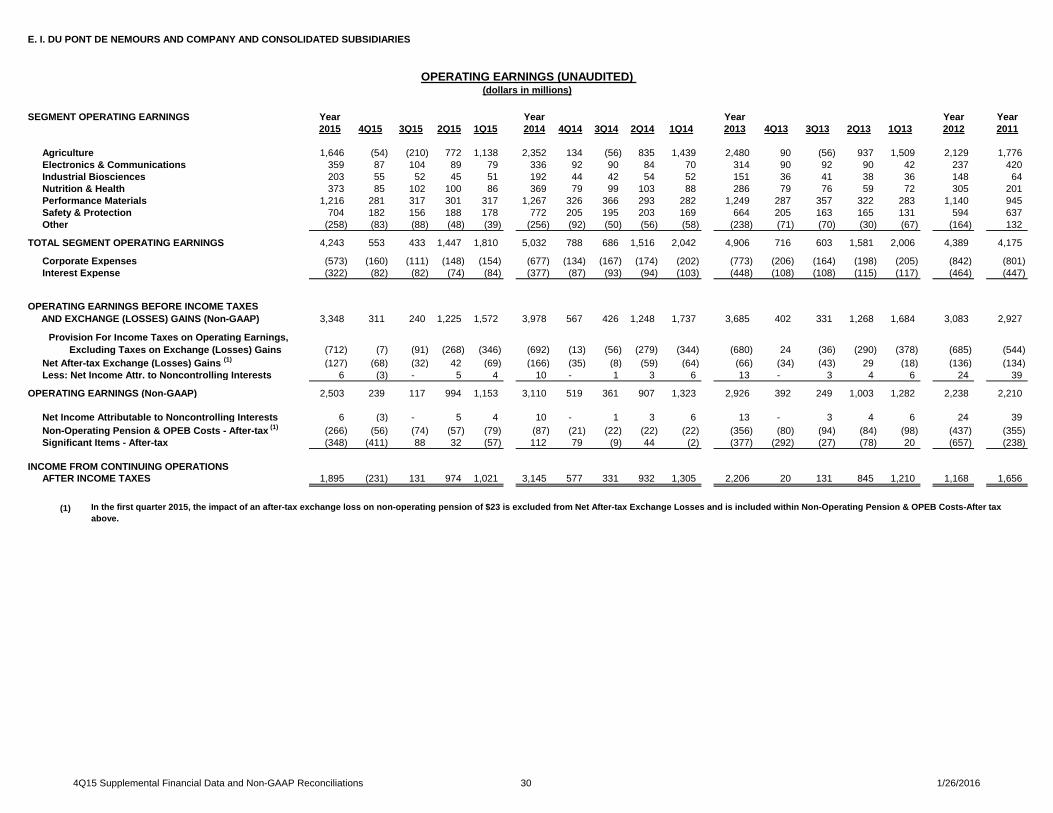
Agriculture 1,646 (54) (210) 772 1,138 2,352 134 (56) 835 1,439 2,480 90 (56) 937 1,509 2,129 1,776 Electronics & Communications 359 87 104 89 79 336 92 90 84 70 314 90 92 90 42 237 420 Industrial Biosciences 203 55 52 45 51 192 44 42 54 52 151 36 41 38 36 148 64 Nutrition & Health 373 85 102 100 86 369 79 99 103 88 286 79 76 59 72 305 201 Performance Materials 1,216 281 317 301 317 1,267 326 366 293 282 1,249 287 357 322 283 1,140 945 Safety & Protection 704 182 156 188 178 772 205 195 203 169 664 205 163 165 131 594 637 Other (258) (83) (88) (48) (39) (256) (92) (50) (56) (58) (238) (71) (70) (30) (67) (164) 132
TOTAL SEGMENT OPERATING EARNINGS 4,243 553 433 1,447 1,810 5,032 788 686 1,516 2,042 4,906 716 603 1,581 2,006 4,389 4,175
Corporate Expenses (573) (160) (111) (148) (154) (677) (134) (167) (174) (202) (773) (206) (164) (198) (205) (842) (801) Interest Expense (322) (82) (82) (74) (84) (377) (87) (93) (94) (103) (448) (108) (108) (115) (117) (464) (447)
3,348 311 240 1,225 1,572 3,978 567 426 1,248 1,737 3,685 402 331 1,268 1,684 3,083 2,927
(712) (7) (91) (268) (346) (692) (13) (56) (279) (344) (680) 24 (36) (290) (378) (685) (544) Net After-tax Exchange (Losses) Gains (1) (127) (68) (32) 42 (69) (166) (35) (8) (59) (64) (66) (34) (43) 29 (18) (136) (134) Less: Net Income Attr. to Noncontrolling Interests 6 (3) - 5 4 10 - 1 3 6 13 - 3 4 6 24 39
OPERATING EARNINGS (Non-GAAP) 2,503 239 117 994 1,153 3,110 519 361 907 1,323 2,926 392 249 1,003 1,282 2,238 2,210
Net Income Attributable to Noncontrolling Interests 6 (3) - 5 4 10 - 1 3 6 13 - 3 4 6 24 39 Non-Operating Pension & OPEB Costs - After-tax (1) (266) (56) (74) (57) (79) (87) (21) (22) (22) (22) (356) (80) (94) (84) (98) (437) (355) Significant Items - After-tax (348) (411) 88 32 (57) 112 79 (9) 44 (2) (377) (292) (27) (78) 20 (657) (238)
INCOME FROM CONTINUING OPERATIONSAFTER INCOME TAXES 1,895 (231) 131 974 1,021 3,145 577 331 932 1,305 2,206 20 131 845 1,210 1,168 1,656
(1)
OPERATING EARNINGS (UNAUDITED) (dollars in millions)
In the first quarter 2015, the impact of an after-tax exchange loss on non-operating pension of $23 is excluded from Net After-tax Exchange Losses and is included within Non-Operating Pension & OPEB Costs-After tax above.
OPERATING EARNINGS BEFORE INCOME TAXES AND EXCHANGE (LOSSES) GAINS (Non-GAAP)
Provision For Income Taxes on Operating Earnings, Excluding Taxes on Exchange (Losses) Gains
SEGMENT OPERATING EARNINGS
4Q15 Supplemental Financial Data and Non-GAAP Reconciliations 31 1/26/2016
E. I. DU PONT DE NEMOURS AND COMPANY AND CONSOLIDATED SUBSIDIARIES
SEGMENT PRETAX IMPACT OF Year Year Year Year YearSIGNIFICANT ITEMS 2015 4Q15 3Q15 2Q15 1Q15 2014 4Q14 3Q14 2Q14 1Q14 2013 4Q13 3Q13 2Q13 1Q13 2012 2011
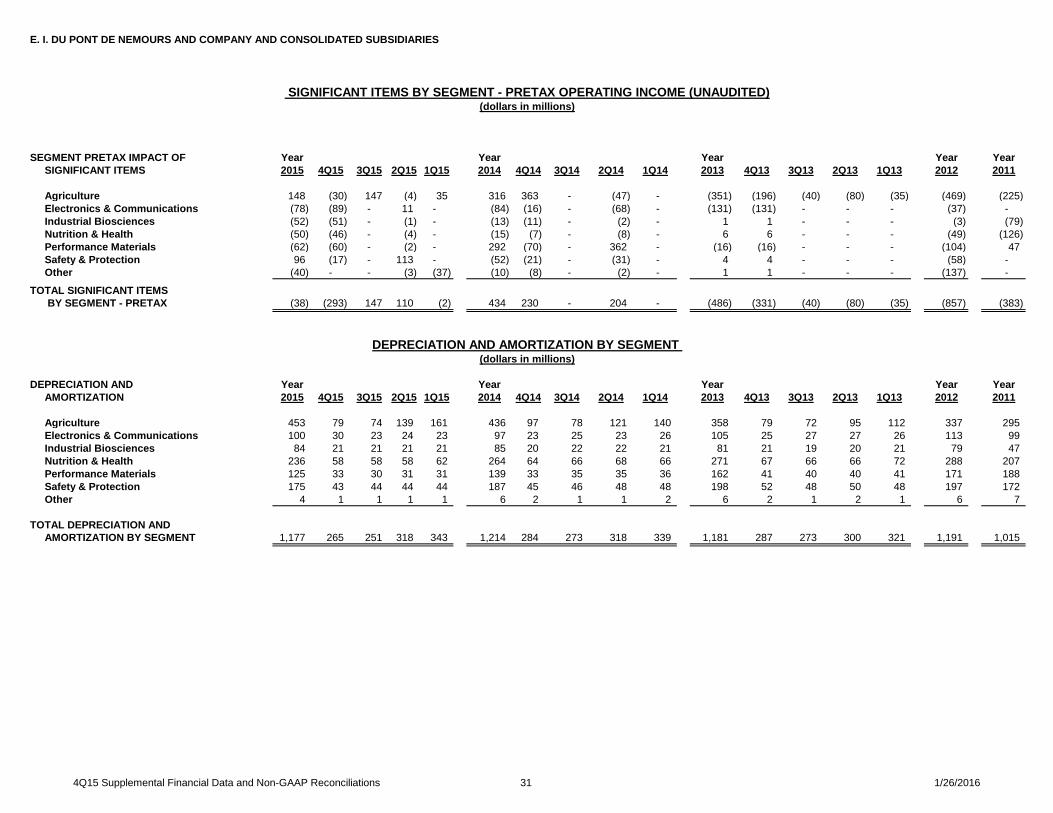
Agriculture 148 (30) 147 (4) 35 316 363 - (47) - (351) (196) (40) (80) (35) (469) (225) Electronics & Communications (78) (89) - 11 - (84) (16) - (68) - (131) (131) - - - (37) - Industrial Biosciences (52) (51) - (1) - (13) (11) - (2) - 1 1 - - - (3) (79) Nutrition & Health (50) (46) - (4) - (15) (7) - (8) - 6 6 - - - (49) (126) Performance Materials (62) (60) - (2) - 292 (70) - 362 - (16) (16) - - - (104) 47 Safety & Protection 96 (17) - 113 - (52) (21) - (31) - 4 4 - - - (58) - Other (40) - - (3) (37) (10) (8) - (2) - 1 1 - - - (137) -
TOTAL SIGNIFICANT ITEMS BY SEGMENT - PRETAX (38) (293) 147 110 (2) 434 230 - 204 - (486) (331) (40) (80) (35) (857) (383)
DEPRECIATION AND Year Year Year Year YearAMORTIZATION 2015 4Q15 3Q15 2Q15 1Q15 2014 4Q14 3Q14 2Q14 1Q14 2013 4Q13 3Q13 2Q13 1Q13 2012 2011
Agriculture 453 79 74 139 161 436 97 78 121 140 358 79 72 95 112 337 295 Electronics & Communications 100 30 23 24 23 97 23 25 23 26 105 25 27 27 26 113 99 Industrial Biosciences 84 21 21 21 21 85 20 22 22 21 81 21 19 20 21 79 47 Nutrition & Health 236 58 58 58 62 264 64 66 68 66 271 67 66 66 72 288 207 Performance Materials 125 33 30 31 31 139 33 35 35 36 162 41 40 40 41 171 188 Safety & Protection 175 43 44 44 44 187 45 46 48 48 198 52 48 50 48 197 172 Other 4 1 1 1 1 6 2 1 1 2 6 2 1 2 1 6 7
TOTAL DEPRECIATION AND AMORTIZATION BY SEGMENT 1,177 265 251 318 343 1,214 284 273 318 339 1,181 287 273 300 321 1,191 1,015
SIGNIFICANT ITEMS BY SEGMENT - PRETAX OPERATING INCOME (UNAUDITED)(dollars in millions)
DEPRECIATION AND AMORTIZATION BY SEGMENT (dollars in millions)
4Q15 Supplemental Financial Data and Non-GAAP Reconciliations 32 1/26/2016
E. I. DU PONT DE NEMOURS AND COMPANY AND CONSOLIDATED SUBSIDIARIES
Year Year Year Year Year2015 4Q15 3Q15 2Q15 1Q15 2014 4Q14 3Q14 2Q14 1Q14 2013 4Q13 3Q13 2Q13 1Q13 2012 2011
RECONCILIATION OF DILUTED EPS (1)
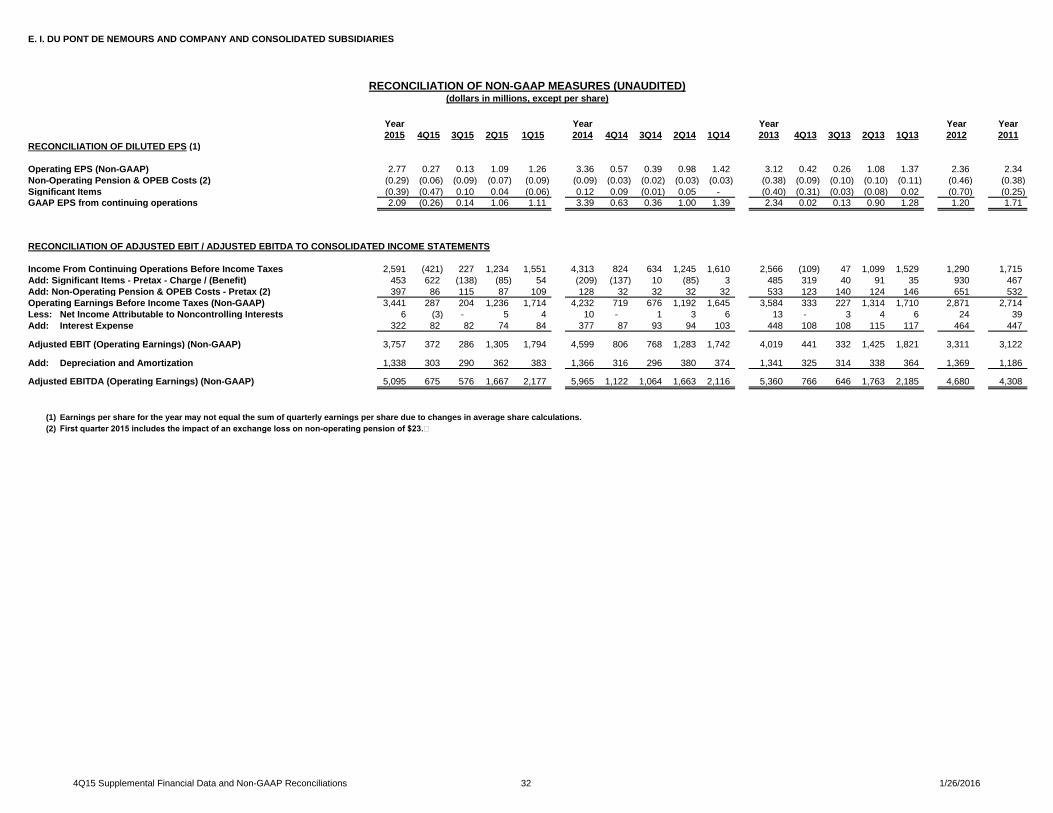
Operating EPS (Non-GAAP) 2.77 0.27 0.13 1.09 1.26 3.36 0.57 0.39 0.98 1.42 3.12 0.42 0.26 1.08 1.37 2.36 2.34 Non-Operating Pension & OPEB Costs (2) (0.29) (0.06) (0.09) (0.07) (0.09) (0.09) (0.03) (0.02) (0.03) (0.03) (0.38) (0.09) (0.10) (0.10) (0.11) (0.46) (0.38) Significant Items (0.39) (0.47) 0.10 0.04 (0.06) 0.12 0.09 (0.01) 0.05 - (0.40) (0.31) (0.03) (0.08) 0.02 (0.70) (0.25) GAAP EPS from continuing operations 2.09 (0.26) 0.14 1.06 1.11 3.39 0.63 0.36 1.00 1.39 2.34 0.02 0.13 0.90 1.28 1.20 1.71
RECONCILIATION OF ADJUSTED EBIT / ADJUSTED EBITDA TO CONSOLIDATED INCOME STATEMENTS
Income From Continuing Operations Before Income Taxes 2,591 (421) 227 1,234 1,551 4,313 824 634 1,245 1,610 2,566 (109) 47 1,099 1,529 1,290 1,715 Add: Significant Items - Pretax - Charge / (Benefit) 453 622 (138) (85) 54 (209) (137) 10 (85) 3 485 319 40 91 35 930 467 Add: Non-Operating Pension & OPEB Costs - Pretax (2) 397 86 115 87 109 128 32 32 32 32 533 123 140 124 146 651 532 Operating Earnings Before Income Taxes (Non-GAAP) 3,441 287 204 1,236 1,714 4,232 719 676 1,192 1,645 3,584 333 227 1,314 1,710 2,871 2,714 Less: Net Income Attributable to Noncontrolling Interests 6 (3) - 5 4 10 - 1 3 6 13 - 3 4 6 24 39 Add: Interest Expense 322 82 82 74 84 377 87 93 94 103 448 108 108 115 117 464 447
Adjusted EBIT (Operating Earnings) (Non-GAAP) 3,757 372 286 1,305 1,794 4,599 806 768 1,283 1,742 4,019 441 332 1,425 1,821 3,311 3,122
Add: Depreciation and Amortization 1,338 303 290 362 383 1,366 316 296 380 374 1,341 325 314 338 364 1,369 1,186
Adjusted EBITDA (Operating Earnings) (Non-GAAP) 5,095 675 576 1,667 2,177 5,965 1,122 1,064 1,663 2,116 5,360 766 646 1,763 2,185 4,680 4,308
(1) Earnings per share for the year may not equal the sum of quarterly earnings per share due to changes in average share calculations.(2) First quarter 2015 includes the impact of an exchange loss on non-operating pension of $23.
RECONCILIATION OF NON-GAAP MEASURES (UNAUDITED)(dollars in millions, except per share)
4Q15 Supplemental Financial Data and Non-GAAP Reconciliations 33 1/26/2016
E. I. DU PONT DE NEMOURS AND COMPANY AND CONSOLIDATED SUBSIDIARIES
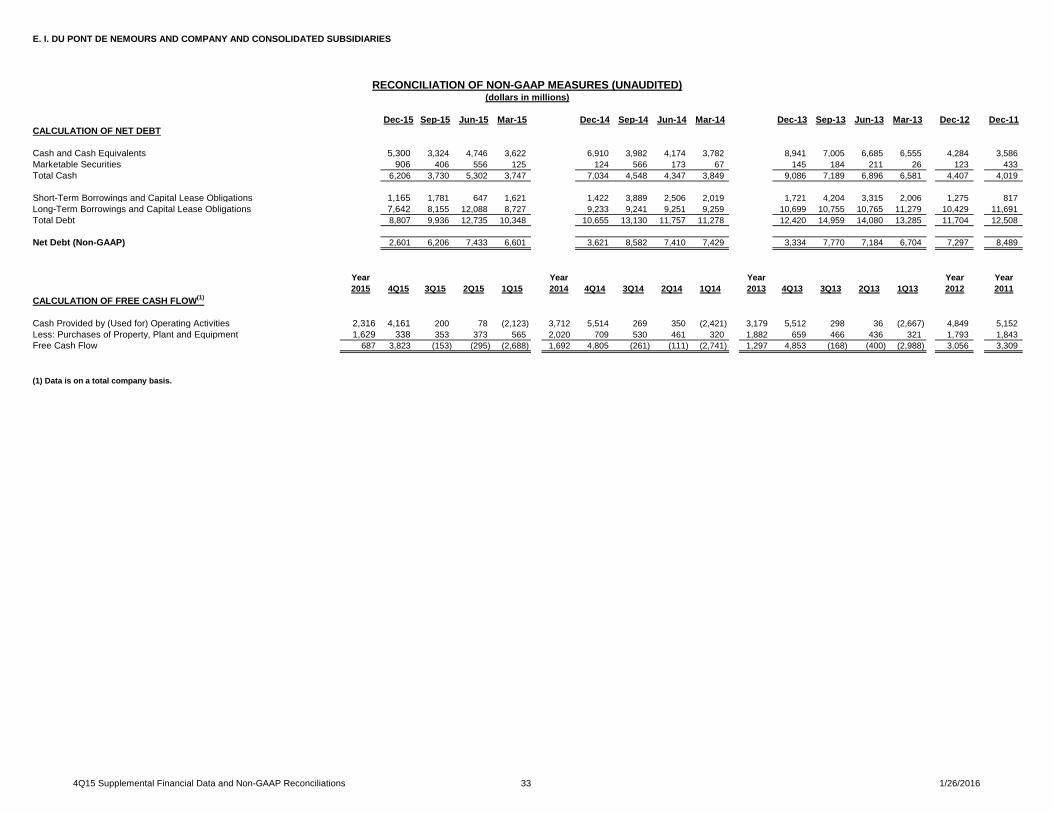
Dec-15 Sep-15 Jun-15 Mar-15 Dec-14 Sep-14 Jun-14 Mar-14 Dec-13 Sep-13 Jun-13 Mar-13 Dec-12 Dec-11CALCULATION OF NET DEBT
Cash and Cash Equivalents 5,300 3,324 4,746 3,622 6,910 3,982 4,174 3,782 8,941 7,005 6,685 6,555 4,284 3,586 Marketable Securities 906 406 556 125 124 566 173 67 145 184 211 26 123 433 Total Cash 6,206 3,730 5,302 3,747 7,034 4,548 4,347 3,849 9,086 7,189 6,896 6,581 4,407 4,019
Short-Term Borrowings and Capital Lease Obligations 1,165 1,781 647 1,621 1,422 3,889 2,506 2,019 1,721 4,204 3,315 2,006 1,275 817 Long-Term Borrowings and Capital Lease Obligations 7,642 8,155 12,088 8,727 9,233 9,241 9,251 9,259 10,699 10,755 10,765 11,279 10,429 11,691 Total Debt 8,807 9,936 12,735 10,348 10,655 13,130 11,757 11,278 12,420 14,959 14,080 13,285 11,704 12,508
Net Debt (Non-GAAP) 2,601 6,206 7,433 6,601 3,621 8,582 7,410 7,429 3,334 7,770 7,184 6,704 7,297 8,489
Year Year Year Year Year2015 4Q15 3Q15 2Q15 1Q15 2014 4Q14 3Q14 2Q14 1Q14 2013 4Q13 3Q13 2Q13 1Q13 2012 2011
CALCULATION OF FREE CASH FLOW(1)
Cash Provided by (Used for) Operating Activities 2,316 4,161 200 78 (2,123) 3,712 5,514 269 350 (2,421) 3,179 5,512 298 36 (2,667) 4,849 5,152 Less: Purchases of Property, Plant and Equipment 1,629 338 353 373 565 2,020 709 530 461 320 1,882 659 466 436 321 1,793 1,843 Free Cash Flow 687 3,823 (153) (295) (2,688) 1,692 4,805 (261) (111) (2,741) 1,297 4,853 (168) (400) (2,988) 3,056 3,309
(1) Data is on a total company basis.
RECONCILIATION OF NON-GAAP MEASURES (UNAUDITED)(dollars in millions)
4Q15 Supplemental Financial Data and Non-GAAP Reconciliations 34 1/26/2016
E. I. DU PONT DE NEMOURS AND COMPANY AND CONSOLIDATED SUBSIDIARIES
Year Year Year Year Year2015 4Q15 3Q15 2Q15 1Q15 2014 4Q14 3Q14 2Q14 1Q14 2013 4Q13 3Q13 2Q13 1Q13 2012 2011
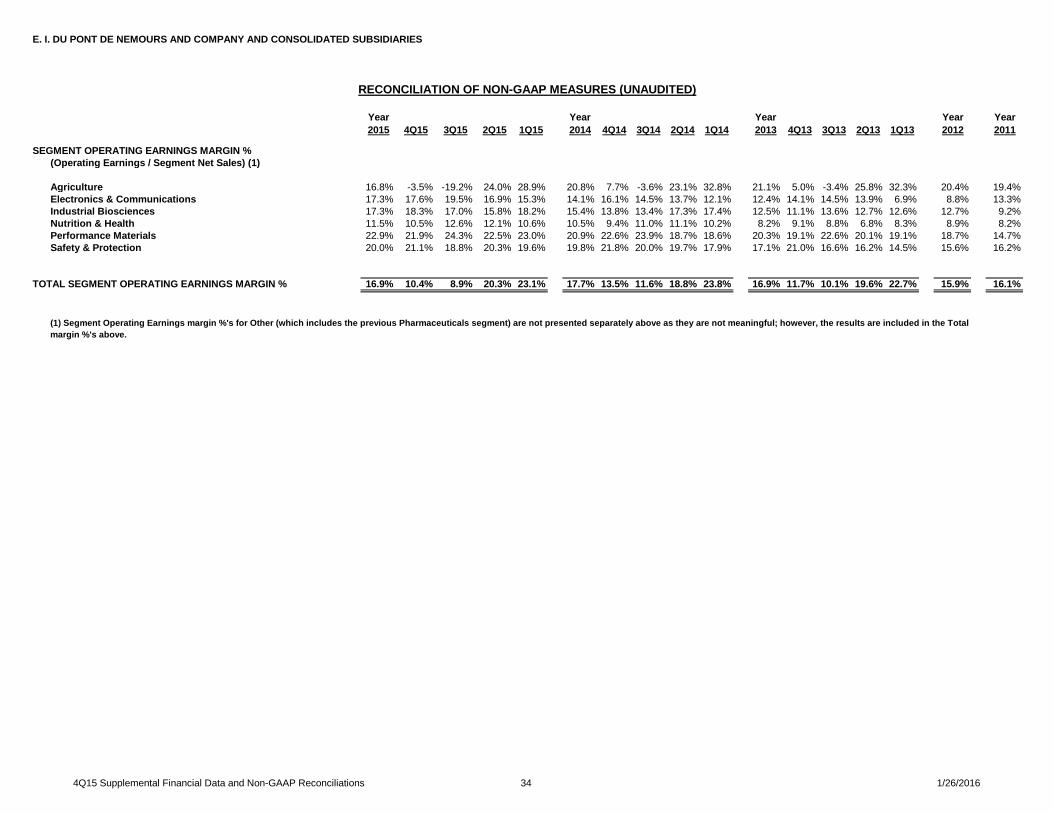
SEGMENT OPERATING EARNINGS MARGIN % (Operating Earnings / Segment Net Sales) (1)
Agriculture 16.8% -3.5% -19.2% 24.0% 28.9% 20.8% 7.7% -3.6% 23.1% 32.8% 21.1% 5.0% -3.4% 25.8% 32.3% 20.4% 19.4%Electronics & Communications 17.3% 17.6% 19.5% 16.9% 15.3% 14.1% 16.1% 14.5% 13.7% 12.1% 12.4% 14.1% 14.5% 13.9% 6.9% 8.8% 13.3%Industrial Biosciences 17.3% 18.3% 17.0% 15.8% 18.2% 15.4% 13.8% 13.4% 17.3% 17.4% 12.5% 11.1% 13.6% 12.7% 12.6% 12.7% 9.2%Nutrition & Health 11.5% 10.5% 12.6% 12.1% 10.6% 10.5% 9.4% 11.0% 11.1% 10.2% 8.2% 9.1% 8.8% 6.8% 8.3% 8.9% 8.2%Performance Materials 22.9% 21.9% 24.3% 22.5% 23.0% 20.9% 22.6% 23.9% 18.7% 18.6% 20.3% 19.1% 22.6% 20.1% 19.1% 18.7% 14.7%Safety & Protection 20.0% 21.1% 18.8% 20.3% 19.6% 19.8% 21.8% 20.0% 19.7% 17.9% 17.1% 21.0% 16.6% 16.2% 14.5% 15.6% 16.2%
16.9% 10.4% 8.9% 20.3% 23.1% 17.7% 13.5% 11.6% 18.8% 23.8% 16.9% 11.7% 10.1% 19.6% 22.7% 15.9% 16.1%
TOTAL SEGMENT OPERATING EARNINGS MARGIN %
RECONCILIATION OF NON-GAAP MEASURES (UNAUDITED)
(1) Segment Operating Earnings margin %'s for Other (which includes the previous Pharmaceuticals segment) are not presented separately above as they are not meaningful; however, the results are included in the Total margin %'s above.
4Q15 Supplemental Financial Data and Non-GAAP Reconciliations 35 1/26/2016
E. I. DU PONT DE NEMOURS AND COMPANY AND CONSOLIDATED SUBSIDIARIES
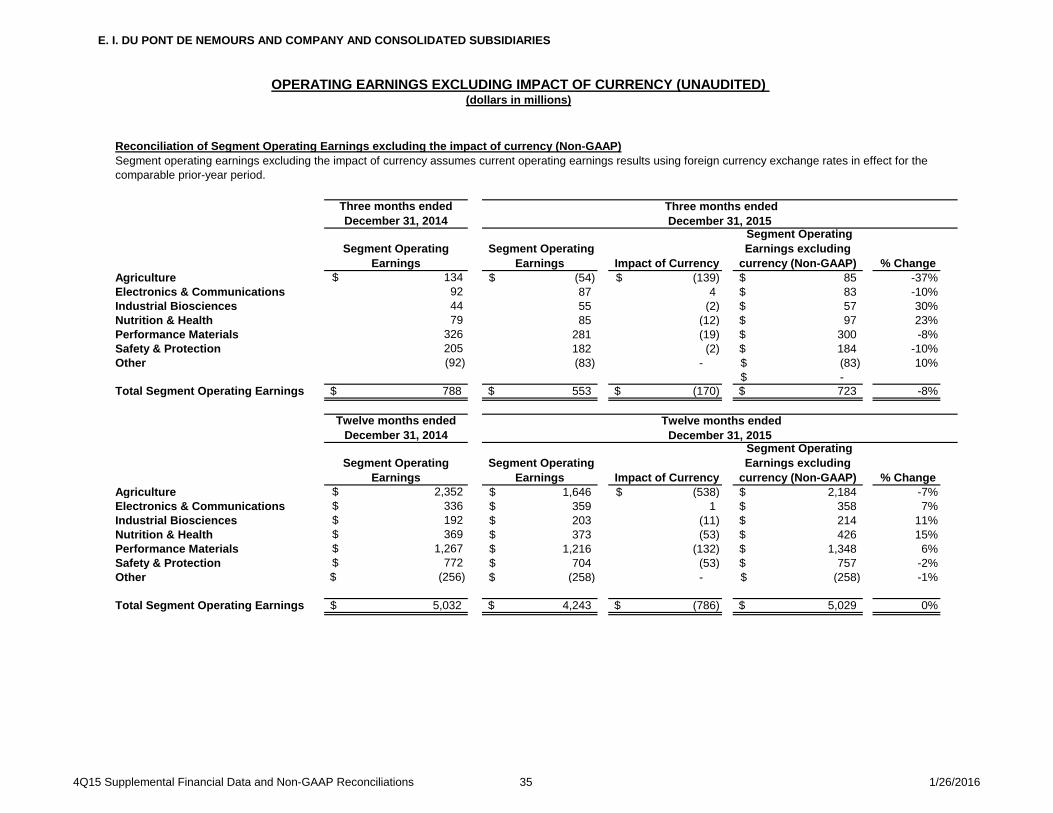
Reconciliation of Segment Operating Earnings excluding the impact of currency (Non-GAAP)
Three months endedDecember 31, 2014
Segment Operating Earnings
Segment Operating Earnings Impact of Currency
Segment Operating Earnings excluding
currency (Non-GAAP) % Change Agriculture $ 134 (54)$ (139)$ 85$ -37%Electronics & Communications 92 87 4 83$ -10%Industrial Biosciences 44 55 (2) 57$ 30%Nutrition & Health 79 85 (12) 97$ 23%Performance Materials 326 281 (19) 300$ -8%Safety & Protection 205 182 (2) 184$ -10%Other (92) (83) - (83)$ 10%
-$ Total Segment Operating Earnings 788$ 553$ (170)$ 723$ -8%
Twelve months ended
December 31, 2014
Segment Operating Earnings
Segment Operating Earnings Impact of Currency
Segment Operating Earnings excluding
currency (Non-GAAP) % Change Agriculture $ 2,352 1,646$ (538)$ 2,184$ -7%Electronics & Communications $ 336 359$ 1 358$ 7%Industrial Biosciences $ 192 203$ (11) 214$ 11%Nutrition & Health $ 369 373$ (53) 426$ 15%Performance Materials $ 1,267 1,216$ (132) 1,348$ 6%Safety & Protection $ 772 704$ (53) 757$ -2%Other $ (256) (258)$ - (258)$ -1%
Total Segment Operating Earnings 5,032$ 4,243$ (786)$ 5,029$ 0%
Three months ended December 31, 2015
OPERATING EARNINGS EXCLUDING IMPACT OF CURRENCY (UNAUDITED) (dollars in millions)
Segment operating earnings excluding the impact of currency assumes current operating earnings results using foreign currency exchange rates in effect for the comparable prior-year period.
Twelve months ended December 31, 2015
4Q15 Supplemental Financial Data and Non-GAAP Reconciliations 36 1/26/2016
E. I. DU PONT DE NEMOURS AND COMPANY AND CONSOLIDATED SUBSIDIARIES
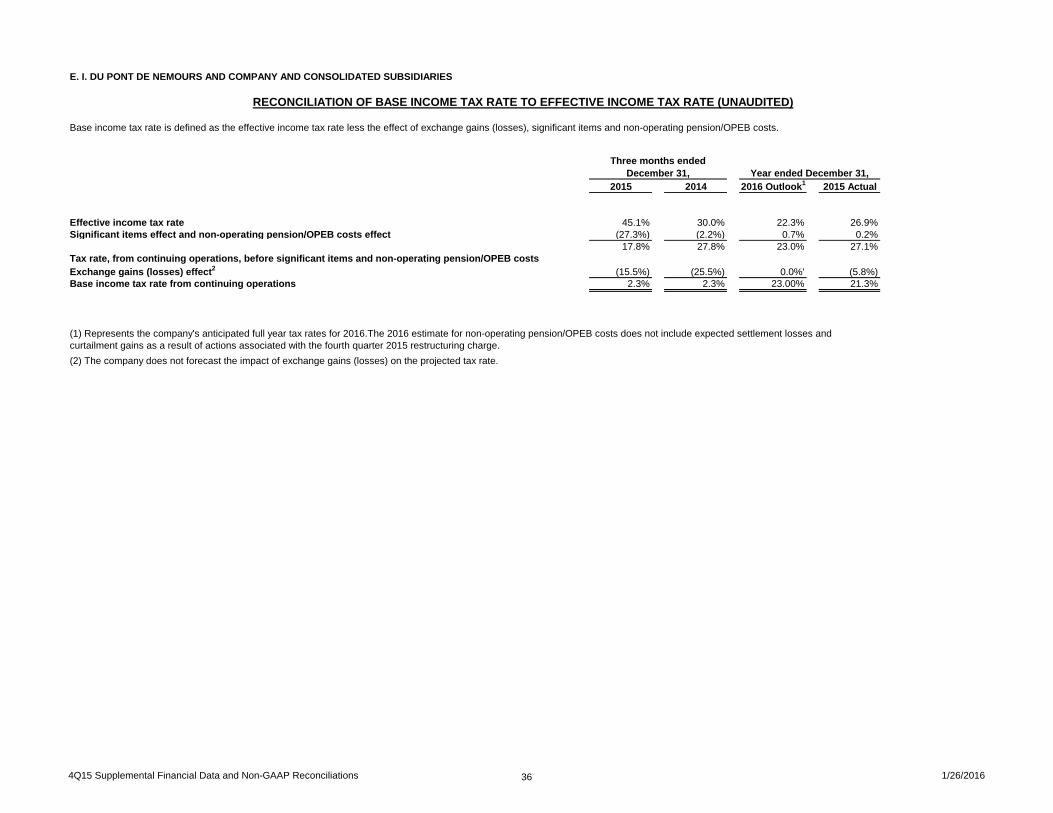
2015 2014 2016 Outlook1 2015 Actual
Effective income tax rate 45.1% 30.0% 22.3% 26.9%Significant items effect and non-operating pension/OPEB costs effect (27.3%) (2.2%) 0.7% 0.2%
17.8% 27.8% 23.0% 27.1%
Exchange gains (losses) effect2 (15.5%) (25.5%) 0.0%' (5.8%)Base income tax rate from continuing operations 2.3% 2.3% 23.00% 21.3%
(2) The company does not forecast the impact of exchange gains (losses) on the projected tax rate.
(1) Represents the company's anticipated full year tax rates for 2016.The 2016 estimate for non-operating pension/OPEB costs does not include expected settlement losses and curtailment gains as a result of actions associated with the fourth quarter 2015 restructuring charge.
Tax rate, from continuing operations, before significant items and non-operating pension/OPEB costs
Three months endedDecember 31,
RECONCILIATION OF BASE INCOME TAX RATE TO EFFECTIVE INCOME TAX RATE (UNAUDITED)
Base income tax rate is defined as the effective income tax rate less the effect of exchange gains (losses), significant items and non-operating pension/OPEB costs.
Year ended December 31,
APPENDIX 2:
DOWDUPONT MERGER OF EQUALS
1/25/2016
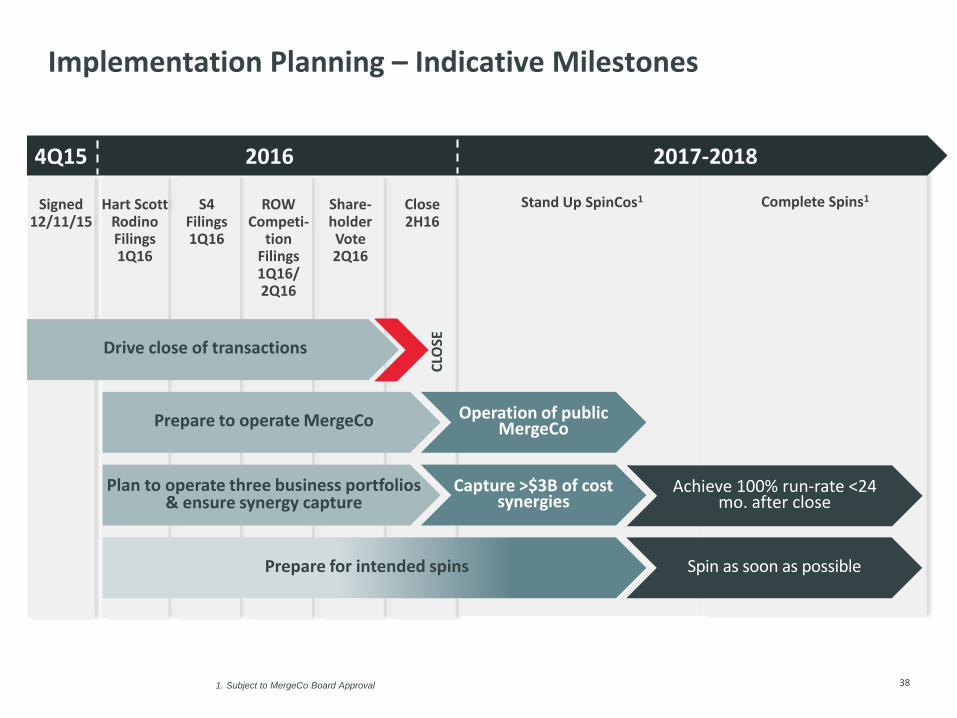
Close 2H16
Signed
12/11/15
Share-holder Vote 2Q16
S4
Filings 1Q16
Hart Scott
Rodino Filings 1Q16
ROW
Competi-tion
Filings 1Q16/ 2Q16
Complete Spins1
Stand Up SpinCos1
Capture >$3B of cost synergies
Implementation Planning – Indicative Milestones
38
Drive close of transactions
4Q15 2016 2017-2018
Prepare to operate MergeCo
Plan to operate three business portfolios & ensure synergy capture
Prepare for intended spins
CLO
SE
Operation of public MergeCo
Spin as soon as possible
Achieve 100% run-rate <24 mo. after close
1. Subject to MergeCo Board Approval
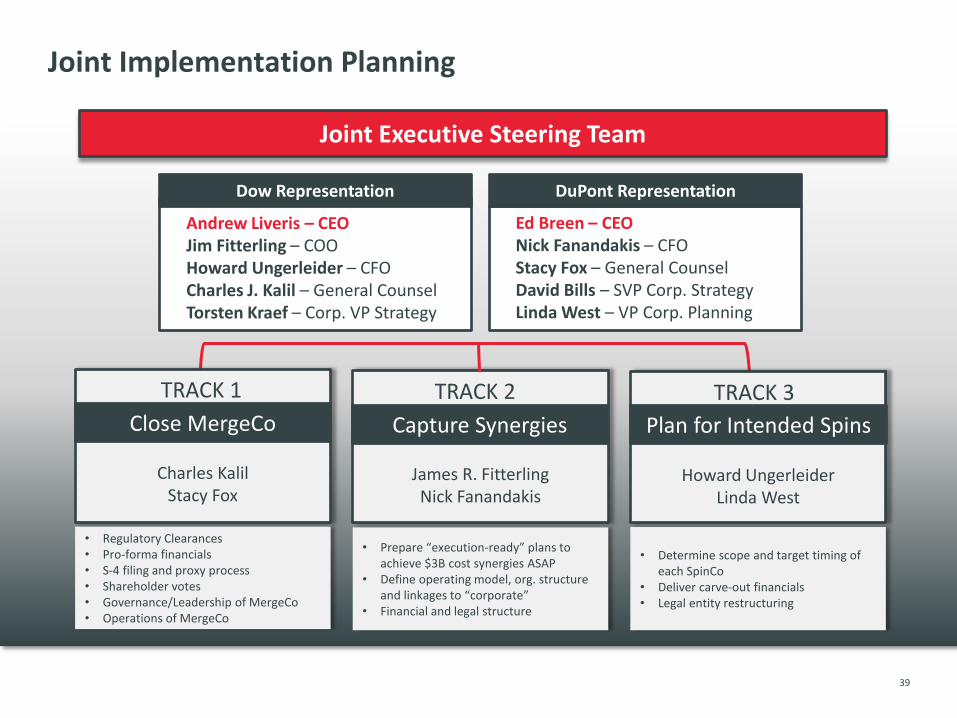
Joint Implementation Planning
Joint Executive Steering Team
• Prepare “execution-ready” plans to achieve $3B cost synergies ASAP
• Define operating model, org. structure and linkages to “corporate”
• Financial and legal structure
James R. Fitterling Nick Fanandakis
TRACK 2
Capture Synergies
• Regulatory Clearances • Pro-forma financials • S-4 filing and proxy process • Shareholder votes • Governance/Leadership of MergeCo • Operations of MergeCo
TRACK 1
Close MergeCo
Charles Kalil Stacy Fox
• Determine scope and target timing of each SpinCo
• Deliver carve-out financials • Legal entity restructuring
TRACK 3
Plan for Intended Spins
Howard Ungerleider Linda West
Dow Representation DuPont Representation
Ed Breen – CEO Nick Fanandakis – CFO Stacy Fox – General Counsel David Bills – SVP Corp. Strategy Linda West – VP Corp. Planning
Andrew Liveris – CEO Jim Fitterling – COO Howard Ungerleider – CFO Charles J. Kalil – General Counsel Torsten Kraef – Corp. VP Strategy
39
Disclaimer
Important Information About the Transaction and Where to Find It
40
In connection with the proposed transaction, The Dow Chemical Company (“Dow”) and E. I. du Pont de Nemours and Company (“DuPont”) will cause Diamond-
Orion HoldCo, Inc. (“Diamond-Orion HoldCo”), to file with the Securities and Exchange Commission (“SEC”) a registration statement on Form S-4 that will
include a joint proxy statement of Dow and DuPont and that also will constitute a prospectus of Diamond-Orion HoldCo. Dow, DuPont and Diamond-Orion
HoldCo may also file other documents with the SEC regarding the proposed transaction. This document is not a substitute for the joint proxy
statement/prospectus or registration statement or any other document which Dow, DuPont or Diamond-Orion HoldCo may file with the SEC. INVESTORS AND
SECURITY HOLDERS OF DOW AND DUPONT ARE URGED TO READ THE REGISTRATION STATEMENT, THE JOINT PROXY
STATEMENT/PROSPECTUS AND ANY OTHER RELEVANT DOCUMENTS THAT ARE FILED OR WILL BE FILED WITH THE SEC, AS WELL AS ANY
AMENDMENTS OR SUPPLEMENTS TO THESE DOCUMENTS, CAREFULLY AND IN THEIR ENTIRETY BECAUSE THEY CONTAIN OR WILL CONTAIN
IMPORTANT INFORMATION ABOUT THE PROPOSED TRANSACTION AND RELATED MATTERS. Investors and security holders may obtain free copies of
the registration statement and the joint proxy statement/prospectus (when available) and other documents filed with the SEC by Dow, DuPont and Diamond-
Orion HoldCo through the web site maintained by the SEC at www.sec.gov or by contacting the investor relations department of Dow or DuPont at the following:
Dow DuPont
2030 Dow Center 974 Centre Road
Midland, MI 48674 Wilmington, DE 19805
Attention: Investor Relations Attention: Investor Relations
1-989-636-1463 1-302-774-4994
Participants in the Solicitation
Dow, DuPont, Diamond-Orion HoldCo and their respective directors and executive officers may be deemed to be participants in the solicitation of proxies in
respect of the proposed transaction. Information regarding Dow’s directors and executive officers, including a description of their direct interests, by security
holdings or otherwise, is contained in Dow’s Form 10-K for the year ended December 31, 2014 and its proxy statement filed on March 27, 2015, which are filed
with the SEC. Information regarding DuPont’s directors and executive officers, including a description of their direct interests, by security holdings or otherwise,
is contained in DuPont’s Form 10-K for the year ended December 31, 2014 and its proxy statement filed on March 23, 2015, which are filed with the SEC. A
more complete description will be available in the registration statement on Form S-4 and the joint proxy statement/prospectus.
No Offer or Solicitation
The materials on this website are not intended to be and shall not constitute an offer to sell or the solicitation of an offer to sell or the solicitation of an offer to buy
any securities or a solicitation of any vote of approval, nor shall there be any sale of securities in any jurisdiction in which such offer, solicitation or sale would be
unlawful prior to registration or qualification under the securities laws of any such jurisdiction. No offer of securities shall be made except by means of a
prospectus meeting the requirements of Section 10 of the Securities Act of 1933, as amended.
Disclaimer Cont’d
Important Information About the Transaction and Where to Find It
41
Cautionary Notes on Forward Looking Statements
This communication contains “forward-looking statements” within the meaning of the federal securities laws, including Section 27A of the Securities Act of
1933, as amended, and Section 21E of the Securities Exchange Act of 1934, as amended. In this context, forward-looking statements often address expected
future business and financial performance and financial condition, and often contain words such as “expect,” “anticipate,” “intend,” “plan,” “believe,” “seek,”
“see,” “will,” “would,” “target,” similar expressions, and variations or negatives of these words. Forward-looking statements by their nature address matters that
are, to different degrees, uncertain, such as statements about the consummation of the proposed transaction and the anticipated benefits thereof. These and
other forward-looking statements, including the failure to consummate the proposed transaction or to make or take any filing or other action required to
consummate such transaction on a timely matter or at all, are not guarantees of future results and are subject to risks, uncertainties and assumptions that could
cause actual results to differ materially from those expressed in any forward-looking statements. Important risk factors that may cause such a difference
include, but are not limited to, (i) the completion of the proposed transaction on anticipated terms and timing, including obtaining shareholder and regulatory
approvals, anticipated tax treatment, unforeseen liabilities, future capital expenditures, revenues, expenses, earnings, synergies, economic performance,
indebtedness, financial condition, losses, future prospects, business and management strategies for the management, expansion and growth of the new
combined company’s operations and other conditions to the completion of the merger, (ii) the ability of Dow and DuPont to integrate the business successfully
and to achieve anticipated synergies, risks and costs and pursuit and/or implementation of the potential separation, including timing anticipated, any changes to
the configuration of businesses included in the potential separation if implemented, (iii) potential litigation relating to the proposed transaction that could be
instituted against Dow, DuPont or their respective directors, (iv) the risk that disruptions from the proposed transaction will harm Dow’s or DuPont’s business,
including current plans and operations, (v) the ability of Dow or DuPont to retain and hire key personnel, (vi) potential adverse reactions or changes to business
relationships resulting from the announcement or completion of the merger, (vii) uncertainty as to the long-term value of Diamond-Orion HoldCo common
stock, (viii) continued availability of capital and financing and rating agency actions, (ix) legislative, regulatory and economic developments and (x)
unpredictability and severity of catastrophic events, including, but not limited to, acts of terrorism or outbreak of war or hostilities, as well as management’s
response to any of the aforementioned factors. These risks, as well as other risks associated with the proposed merger, will be more fully discussed in the joint
proxy statement/prospectus that will be included in the registration statement on Form S-4 that will be filed with the SEC in connection with the proposed
merger. While the list of factors presented here is, and the list of factors to be presented in the registration statement on Form S-4 are, considered
representative, no such list should be considered to be a complete statement of all potential risks and uncertainties. Unlisted factors may present significant
additional obstacles to the realization of forward looking statements. Consequences of material differences in results as compared with those anticipated in the
forward-looking statements could include, among other things, business disruption, operational problems, financial loss, legal liability to third parties and similar
risks, any of which could have a material adverse effect on Dow’s or DuPont’s consolidated financial condition, results of operations, credit rating or liquidity.
Neither Dow nor DuPont assumes any obligation to publicly provide revisions or updates to any forward looking statements, whether as a result of new
information, future developments or otherwise, should circumstances change, except as otherwise required by securities and other applicable laws.
Third Party Information
This website may contain or refer to news, commentary and other information relating to Dow, DuPont or Diamond-Orion HoldCo generated by, or sourced
from, persons or companies that are not affiliated with Dow, DuPont or Diamond-Orion HoldCo. The author and source of any third party information and the
date of its publication are clearly and prominently identified. Dow, DuPont and Diamond-Orion HoldCo have neither sought nor obtained permission to use or
quote such third party information. Dow, DuPont and Diamond-Orion HoldCo have not assisted in the preparation of the third party information, cannot
guarantee the accuracy, timeliness, completeness or availability of the third party information, and do not explicitly or implicitly endorse or approve such
information.

Copyright © 2014 DuPont or its affiliates. All rights reserved. The DuPont Oval Logo, DuPont™, The miracles of science™ and all products denoted with ™ or ® are registered trademarks or trademarks of E. I. du Pont de Nemours and Company or its affiliates.
Images reproduced by E. I. du Pont de Nemours and Company under license from the National Geographic Society.
Copyright © 2016 DuPont. All rights reserved. The DuPont Oval Logo, DuPontTM, The miracles of scienceTM, and all products denoted with ® or M are trademarks or registered trademarks of E. I. du Pont de Nemours and Company.
+Images reproduced by E. I. du Pont de Nemours and Company under license from the National Geographic Society.
© National Geographic Image