Embed Size (px)
Citation preview
Savills Studley Report Austin office sector Q4 2015
Savills Studley Research Austin
SUMMARYMarket Highlights
AVAILABILITY RATES STABLE
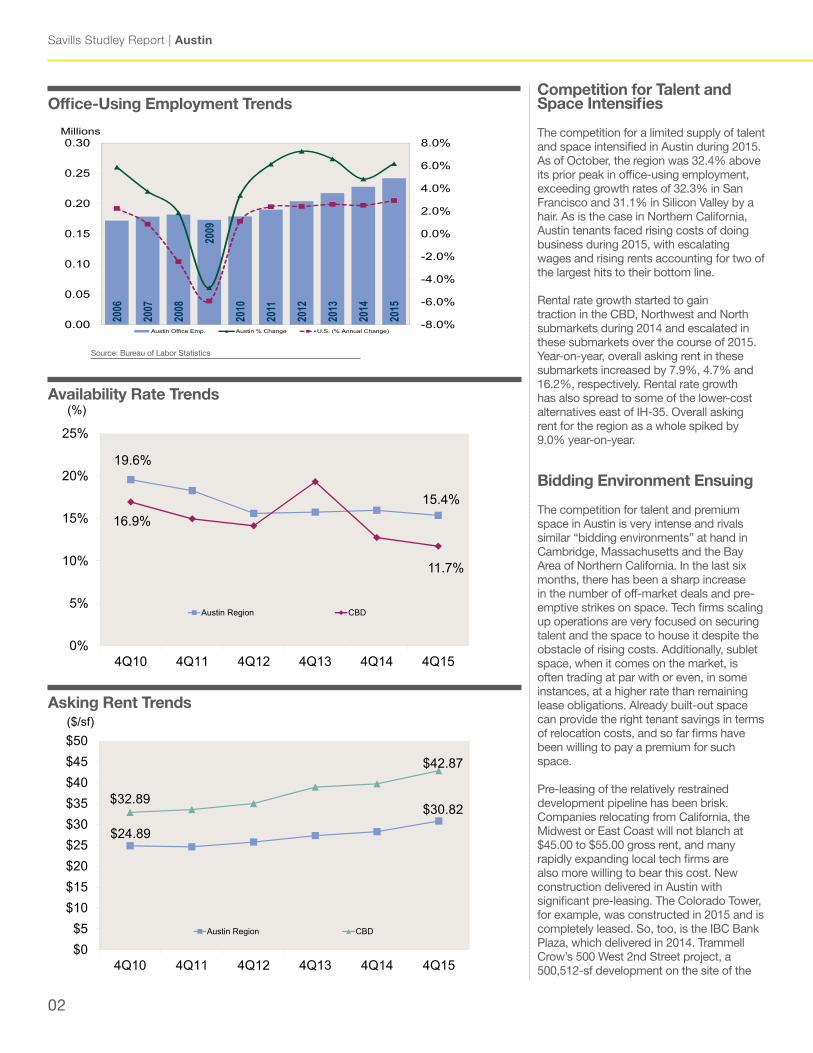
The region's overall availability rate inched down by 0.1 pp to 15.4% during the fourth quarter and fell by 0.6 pp year-on-year. The Class A rate was unchanged for the quarter at 17.7% but decreased by 1.7 pp compared to year-end 2014. Class A rates in the CBD (14.7%) and South (6.6%) submarkets remained well below market norms.
LEASING DECLINES
Tenants leased 6.5 msf in the region during 2015. Compared to 2014, when 7.7 msf was leased, activity has plunged by 15.2%.
RENTAL RATE RISES
The Austin region's overall average asking rent rose by 1.2% to $30.82 during the quarter and spiked by 9.0% year-on-year.
Class A asking rent ($35.69) jumped by 0.6% in the quarter and $8.9% year-on-year.
"Austin is in the midst of a fierce competition among tech firms for talent and space. The intensity of the race to secure these resources rivals similar bidding environments occurring in the Bay Area of Northern California and Cambridge, Massachusetts." Tim Wingfield, Research Manager
02
Savills Studley Report | Austin
Competition for Talent and Space Intensifies
The competition for a limited supply of talent and space intensified in Austin during 2015. As of October, the region was 32.4% above its prior peak in office-using employment, exceeding growth rates of 32.3% in San Francisco and 31.1% in Silicon Valley by a hair. As is the case in Northern California, Austin tenants faced rising costs of doing business during 2015, with escalating wages and rising rents accounting for two of the largest hits to their bottom line.
Rental rate growth started to gain traction in the CBD, Northwest and North submarkets during 2014 and escalated in these submarkets over the course of 2015. Year-on-year, overall asking rent in these submarkets increased by 7.9%, 4.7% and 16.2%, respectively. Rental rate growth has also spread to some of the lower-cost alternatives east of IH-35. Overall asking rent for the region as a whole spiked by 9.0% year-on-year.
Bidding Environment Ensuing
The competition for talent and premium space in Austin is very intense and rivals similar “bidding environments” at hand in Cambridge, Massachusetts and the Bay Area of Northern California. In the last six months, there has been a sharp increase in the number of off-market deals and pre-emptive strikes on space. Tech firms scaling up operations are very focused on securing talent and the space to house it despite the obstacle of rising costs. Additionally, sublet space, when it comes on the market, is often trading at par with or even, in some instances, at a higher rate than remaining lease obligations. Already built-out space can provide the right tenant savings in terms of relocation costs, and so far firms have been willing to pay a premium for such space.
Pre-leasing of the relatively restrained development pipeline has been brisk. Companies relocating from California, the Midwest or East Coast will not blanch at $45.00 to $55.00 gross rent, and many rapidly expanding local tech firms are also more willing to bear this cost. New construction delivered in Austin with significant pre-leasing. The Colorado Tower, for example, was constructed in 2015 and is completely leased. So, too, is the IBC Bank Plaza, which delivered in 2014. Trammell Crow’s 500 West 2nd Street project, a 500,512-sf development on the site of the
Source: Bureau of Labor Statistics
2006
2007
2008
2009
2010
2011
2012
2013
2014
2015
-8.0%
-6.0%
-4.0%
-2.0%
0.0%
2.0%
4.0%
6.0%
8.0%
0.00
0.05
0.10
0.15
0.20
0.25
0.30Millions
Austin Office Emp. Austin % Change U.S. (% Annual Change)
Office-Using Employment Trends
$30.82
$24.89
$42.87
$32.89
$0$5
$10$15$20$25$30$35$40$45$50
4Q154Q144Q134Q124Q114Q10
($/sf) Rental Rate Trends
Austin Region CBD
Asking Rent Trends
15.4%
19.6%
11.7%
16.9%
0%
5%
10%
15%
20%
25%
4Q154Q144Q134Q124Q114Q10
(%) Availability Rate Trends
Austin Region CBD
Availability Rate Trends
savills-studley.com/research 03
Q4 2015
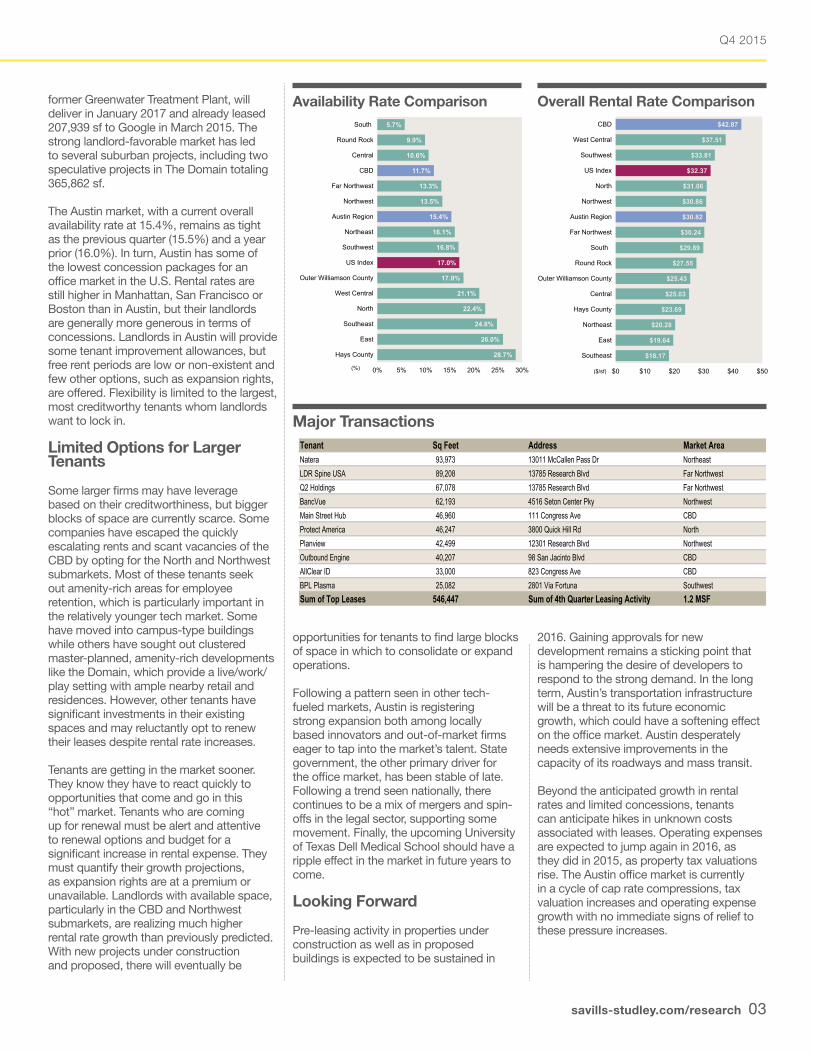
Tenant Sq Feet Address Market AreaNatera 93,973 13011 McCallen Pass Dr NortheastLDR Spine USA 89,208 13785 Research Blvd Far NorthwestQ2 Holdings 67,078 13785 Research Blvd Far NorthwestBancVue 62,193 4516 Seton Center Pky NorthwestMain Street Hub 46,960 111 Congress Ave CBDProtect America 46,247 3800 Quick Hill Rd NorthPlanview 42,499 12301 Research Blvd NorthwestOutbound Engine 40,207 98 San Jacinto Blvd CBDAllClear ID 33,000 823 Congress Ave CBDBPL Plasma 25,082 2801 Via Fortuna SouthwestSum of Top Leases 546,447 Sum of 4th Quarter Leasing Activity 1.2 MSF
former Greenwater Treatment Plant, will deliver in January 2017 and already leased 207,939 sf to Google in March 2015. The strong landlord-favorable market has led to several suburban projects, including two speculative projects in The Domain totaling 365,862 sf.
The Austin market, with a current overall availability rate at 15.4%, remains as tight as the previous quarter (15.5%) and a year prior (16.0%). In turn, Austin has some of the lowest concession packages for an office market in the U.S. Rental rates are still higher in Manhattan, San Francisco or Boston than in Austin, but their landlords are generally more generous in terms of concessions. Landlords in Austin will provide some tenant improvement allowances, but free rent periods are low or non-existent and few other options, such as expansion rights, are offered. Flexibility is limited to the largest, most creditworthy tenants whom landlords want to lock in.
Limited Options for Larger Tenants
Some larger firms may have leverage based on their creditworthiness, but bigger blocks of space are currently scarce. Some companies have escaped the quickly escalating rents and scant vacancies of the CBD by opting for the North and Northwest submarkets. Most of these tenants seek out amenity-rich areas for employee retention, which is particularly important in the relatively younger tech market. Some have moved into campus-type buildings while others have sought out clustered master-planned, amenity-rich developments like the Domain, which provide a live/work/play setting with ample nearby retail and residences. However, other tenants have significant investments in their existing spaces and may reluctantly opt to renew their leases despite rental rate increases.
Tenants are getting in the market sooner. They know they have to react quickly to opportunities that come and go in this “hot” market. Tenants who are coming up for renewal must be alert and attentive to renewal options and budget for a significant increase in rental expense. They must quantify their growth projections, as expansion rights are at a premium or unavailable. Landlords with available space, particularly in the CBD and Northwest submarkets, are realizing much higher rental rate growth than previously predicted. With new projects under construction and proposed, there will eventually be
opportunities for tenants to find large blocks of space in which to consolidate or expand operations.
Following a pattern seen in other tech-fueled markets, Austin is registering strong expansion both among locally based innovators and out-of-market firms eager to tap into the market’s talent. State government, the other primary driver for the office market, has been stable of late. Following a trend seen nationally, there continues to be a mix of mergers and spin-offs in the legal sector, supporting some movement. Finally, the upcoming University of Texas Dell Medical School should have a ripple effect in the market in future years to come.
Looking Forward
Pre-leasing activity in properties under construction as well as in proposed buildings is expected to be sustained in
2016. Gaining approvals for new development remains a sticking point that is hampering the desire of developers to respond to the strong demand. In the long term, Austin’s transportation infrastructure will be a threat to its future economic growth, which could have a softening effect on the office market. Austin desperately needs extensive improvements in the capacity of its roadways and mass transit.
Beyond the anticipated growth in rental rates and limited concessions, tenants can anticipate hikes in unknown costs associated with leases. Operating expenses are expected to jump again in 2016, as they did in 2015, as property tax valuations rise. The Austin office market is currently in a cycle of cap rate compressions, tax valuation increases and operating expense growth with no immediate signs of relief to these pressure increases.
Availability Rate Comparison Overall Rental Rate Comparison
Major Transactions
$42.87
$37.51
$33.81
$32.37
$31.06
$30.86
$30.82
$30.24
$29.89
$27.55
$25.43
$25.03
$23.69
$20.28
$19.64
$18.17
$0 $10 $20 $30 $40 $50
CBD
West Central
Southwest
US Index
North
Northwest
Austin Region
Far Northwest
South
Round Rock
Outer Williamson County
Central
Hays County
Northeast
East
Southeast
($/sf)
Overall Rental Rate Comparison5.7%
9.9%
10.6%
11.7%
13.3%
13.5%
15.4%
16.1%
16.8%
17.0%
17.9%
21.1%
22.4%
24.8%
26.0%
28.7%
0% 5% 10% 15% 20% 25% 30%
South
Round Rock
Central
CBD
Far Northwest
Northwest
Austin Region
Northeast
Southwest
US Index
Outer Williamson County
West Central
North
Southeast
East
Hays County
(%)
Availability Rate Comparison
Savills Studley Report | Austin
04
Submarket Total
InventorySF
(1000's)
Last12
Months
ThisQtr. This Quarter
%Change
fromLast Qtr.
YearAgo
ThisQuarter
ppChange
fromLast Qtr. (1)
YearAgo
ThisQuarter
%Change
fromLast Qtr.
YearAgo
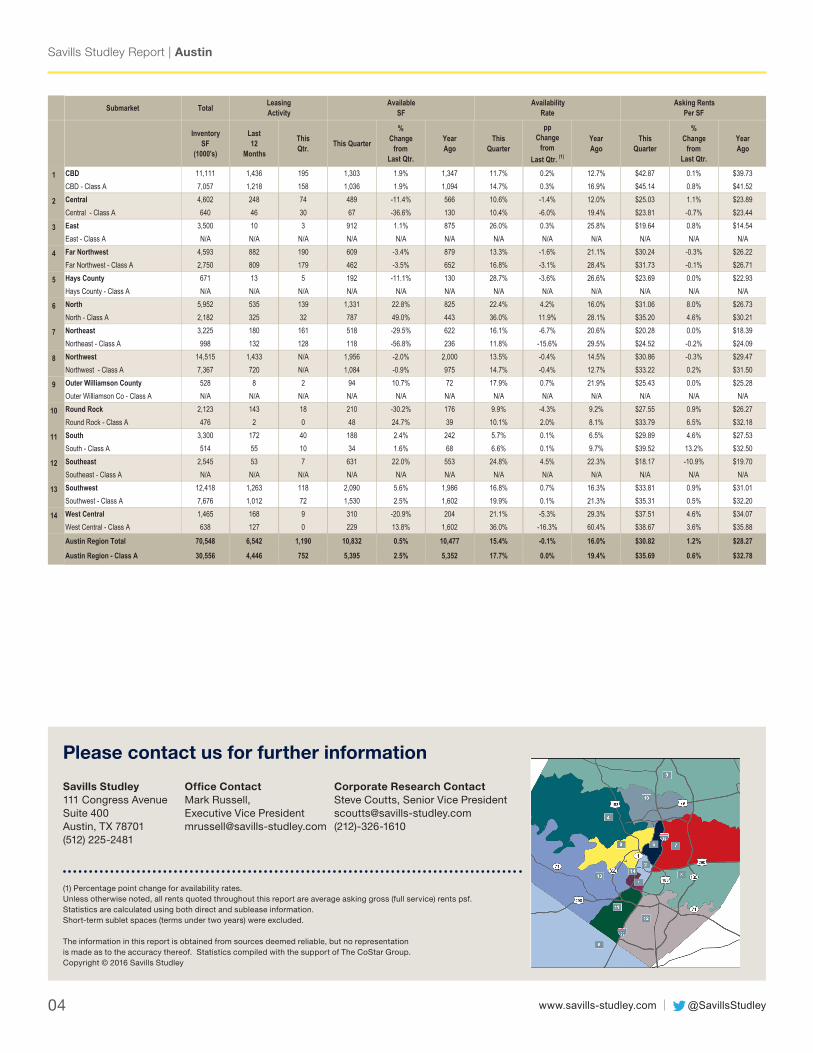
1 CBD 11,111 1,436 195 1,303 1.9% 1,347 11.7% 0.2% 12.7% $42.87 0.1% $39.73CBD - Class A 7,057 1,218 158 1,036 1.9% 1,094 14.7% 0.3% 16.9% $45.14 0.8% $41.52
2 Central 4,602 248 74 489 -11.4% 566 10.6% -1.4% 12.0% $25.03 1.1% $23.89Central - Class A 640 46 30 67 -36.6% 130 10.4% -6.0% 19.4% $23.81 -0.7% $23.44
3 East 3,500 10 3 912 1.1% 875 26.0% 0.3% 25.8% $19.64 0.8% $14.54East - Class A N/A N/A N/A N/A N/A N/A N/A N/A N/A N/A N/A N/A
4 Far Northwest 4,593 882 190 609 -3.4% 879 13.3% -1.6% 21.1% $30.24 -0.3% $26.22Far Northwest - Class A 2,750 809 179 462 -3.5% 652 16.8% -3.1% 28.4% $31.73 -0.1% $26.71
5 Hays County 671 13 5 192 -11.1% 130 28.7% -3.6% 26.6% $23.69 0.0% $22.93Hays County - Class A N/A N/A N/A N/A N/A N/A N/A N/A N/A N/A N/A N/A
6 North 5,952 535 139 1,331 22.8% 825 22.4% 4.2% 16.0% $31.06 8.0% $26.73North - Class A 2,182 325 32 787 49.0% 443 36.0% 11.9% 28.1% $35.20 4.6% $30.21
7 Northeast 3,225 180 161 518 -29.5% 622 16.1% -6.7% 20.6% $20.28 0.0% $18.39Northeast - Class A 998 132 128 118 -56.8% 236 11.8% -15.6% 29.5% $24.52 -0.2% $24.09
8 Northwest 14,515 1,433 N/A 1,956 -2.0% 2,000 13.5% -0.4% 14.5% $30.86 -0.3% $29.47Northwest - Class A 7,367 720 N/A 1,084 -0.9% 975 14.7% -0.4% 12.7% $33.22 0.2% $31.50
9 Outer Williamson County 528 8 2 94 10.7% 72 17.9% 0.7% 21.9% $25.43 0.0% $25.28Outer Williamson Co - Class A N/A N/A N/A N/A N/A N/A N/A N/A N/A N/A N/A N/A
10 Round Rock 2,123 143 18 210 -30.2% 176 9.9% -4.3% 9.2% $27.55 0.9% $26.27Round Rock - Class A 476 2 0 48 24.7% 39 10.1% 2.0% 8.1% $33.79 6.5% $32.18
11 South 3,300 172 40 188 2.4% 242 5.7% 0.1% 6.5% $29.89 4.6% $27.53South - Class A 514 55 10 34 1.6% 68 6.6% 0.1% 9.7% $39.52 13.2% $32.50
12 Southeast 2,545 53 7 631 22.0% 553 24.8% 4.5% 22.3% $18.17 -10.9% $19.70Southeast - Class A N/A N/A N/A N/A N/A N/A N/A N/A N/A N/A N/A N/A
13 Southwest 12,418 1,263 118 2,090 5.6% 1,986 16.8% 0.7% 16.3% $33.81 0.9% $31.01Southwest - Class A 7,676 1,012 72 1,530 2.5% 1,602 19.9% 0.1% 21.3% $35.31 0.5% $32.20
14 West Central 1,465 168 9 310 -20.9% 204 21.1% -5.3% 29.3% $37.51 4.6% $34.07West Central - Class A 638 127 0 229 13.8% 1,602 36.0% -16.3% 60.4% $38.67 3.6% $35.88
16 3%Austin Region Total 70,548 6,542 1,190 10,832 0.5% 10,477 15.4% -0.1% 16.0% $30.82 1.2% $28.27
Austin Region - Class A 30,556 4,446 752 5,395 2.5% 5,352 17.7% 0.0% 19.4% $35.69 0.6% $32.78
LeasingActivity
AvailableSF
AvailabilityRate
Asking RentsPer SF
@SavillsStudleywww.savills-studley.com
Please contact us for further information
(1) Percentage point change for availability rates. Unless otherwise noted, all rents quoted throughout this report are average asking gross (full service) rents psf. Statistics are calculated using both direct and sublease information. Short-term sublet spaces (terms under two years) were excluded.
The information in this report is obtained from sources deemed reliable, but no representation is made as to the accuracy thereof. Statistics compiled with the support of The CoStar Group. Copyright © 2016 Savills Studley
Savills Studley111 Congress Avenue Suite 400Austin, TX 78701(512) 225-2481
Office ContactMark Russell, Executive Vice [email protected]
Corporate Research ContactSteve Coutts, Senior Vice [email protected](212)-326-1610