Embed Size (px)
Citation preview
JP Omega Ltd.
Discussion Document
Berlin,
February 3, 2015
JP Omega Ltd.
JP Omega Ltd.
An Introduction
The Johnson Omega Performance Measure

Limitations of Sharpe and Gauss Distribution
Characteristic Moments of Assets and Asset Classes
Summary of Stylized Economic Facts
Johnson distributions
Johnson Omega
Johnson Omega joins and extends Markowitz's MPT and Black-Scholes-Merton option prices to arbitrary skewness and kurtosis
Johnson Omega intuition & Chart
Johnson Omega optimization transparency through Expected Marginal Attribution (EMA) analysis
Addendum - Johnson Omega and 1st order stochastic dominance
Competing Performance Measures
Review of Johnson Omega development
Some Citations of Omega and Johnson Omega from Academia & Practice
Conclusion
JP Omega Ltd.
X.
XI.
XII.
XIII.
V.
VI.
VII.
VIII.
IX.
Table of Contents
I.
II.
III.
IV.

90% of Fund of Hedge Funds construct their portfolios based on mean variance optimization (EDHEC, Lille-Nice).
1. Up- and downside risk are not distinguished. Discrimination of volatility destroys upside potential.
2. Capture of extreme events is very limited (fat tails and asymmetry), although their occurrance from time to time is a stylized fact
i.e. asymmetry (skewness) and "fat tails" (excess kurtosis) are not taken into account:
a) Strategy or asset class specific skewness and kurtosis.
b) Cross-asset class specific co-skewness and co-kurtosis.
c) No capability to account comprehensively and non-discretionarily for all central and co-moments up to order 4.
JP Omega Ltd.
Those flaws were motivating the development of Johnson Omega introduced subsequently as alternative measures such as the Sortino ratio and e.g. expected tail loss solved only parts of the weaknesses or even introduced new issues.
I. Limitations of Sharpe and Gauss Distribution
The Sharpe Ratio (Sharpe, 1994) is defined as
Some weaknesses of the Sharpe Ratio and Normal distribution:
f
f
RR
RRES

Return p.a. comp. Stdev Skewness p-value
Kurtosis (Excess) p-value
1.
HFRI ED: Distressed/Restructuring Index 11,7% 6,4% -1,00 0,8% 4,85 0,0%2.
HFRI ED: Merger Arbitrage Index 8,1% 1,1% -2,02 0,0% 8,82 0,0%
HFRI Event-Driven (Total) Index 11,2% 1,9% -1,27 0,0% 4,08 0,1%
HFRI EH: Equity Market Neutral Index 6,6% 0,9% -0,23 17,9% 1,71 0,0%
HFRI EH: Quantitative Directional Index 11,6% 3,6% -0,43 1,4% 0,97 2,4%
HFRI EH: Short Bias Index -1,5% 5,2% 0,27 22,2% 2,50 0,1%
HFRI Equity Hedge (Total) Index 12,3% 2,6% -0,24 21,7% 1,93 0,1%2.
HFRI Emerging Markets: Asia ex-Japan Index 9,5% 3,8% -0,10 31,7% 0,95 0,3%
HFRI Emerging Markets (Total) Index 11,7% 4,0% -0,83 3,3% 3,85 1,7%3.
HFRI Macro: Systematic Diversified Index 10,2% 2,1% 0,16 7,9% -0,28 3,8%
HFRI Macro (Total) Index 11,3% 2,1% 0,60 0,1% 1,15 0,1%
HFRI RV: Fixed Income-Convertible Arbitrage Index 8,3% 1,9% -3,06 1,4% 29,72 0,0%4.
HFRI RV: Fixed Income-Corporate Index 7,7% 1,8% -1,34 2,6% 8,42 0,0%
HFRI RV: Multi-Strategy Index 8,3% 1,2% -2,07 0,7% 13,77 0,1%
HFRI Relative Value (Total) Index 9,9% 1,2% -2,11 0,3% 13,92 0,0%
HFRI FOF: Conservative Index 6,2% 1,1% -1,70 0,0% 7,85 0,0%5.
HFRI FOF: Diversified Index 6,8% 1,7% -0,45 17,3% 4,26 0,0%
HFRI FOF: Market Defensive Index 7,3% 1,7% 0,25 15,6% 1,02 5,5%
HFRI FOF: Strategic Index 9,3% 2,4% -0,45 16,3% 3,67 0,9%
HFRI Fund of Funds Composite Index 7,2% 1,6% -0,66 6,3% 4,11 0,0%
HFRI Fund Weighted Composite Index 10,6% 2,0% -0,67 2,8% 2,58 1,1%
HFRI Data from January 1990 until October 2014
JP Omega Ltd.
II. Characteristic Moments of Assets and Asset Classes
Event Driven: Again very low volatility in line with large tail fatness towards the downside.
1.
Equity Hedge: Still insificant skewness, but significant excess kurtosis. Thus outliers may happen towards upside and downside.
Emerging Markets: High risk in traditional sense is amplified by fat tail towards the downside, due to significant negative skewness and excess kurtosis.
FOF: Conservative is pretending to be low risk due to a low volatility. In fact high risk due to significant and substantial negative asymmetry and tail fatness towards the downside.
6.
Macro: Not low volatility, but extremely favorable fat tail properties. Significant positive skewness joint with moderate positive excess kurtosis. Usually positive / neutral impact in market dislocations. Further, Macro possesses positive co-moment properties.
Relative Value: As ED low volatility, jointly with significant negative skewness and significant excess kurtosis. Thus, large fat tail to downside, which has to be taken into account for a risk analysis and portfolio construction.
Table of HFRI Hedge Fund Strategies: Stable Skewness and Kurtosis CharacteristicsAll strategies show similar patterns as already seen in Risk article from 2005. Remain stable over decades.Typical and significant "tail fatness" and asymmetry characteristics were exploitable already before LTCM and Lehman collapse.
Analysis of Strategies

Order Moment Type Moment NameStylized Economic Facts, relating to moment
1 Central Mean
2 Central Volatility
2 Co Correlation
3 Central Skewness
3 Co Co-Skewness
4 Central Kurtosis
4 Co Co-Kurtosis
1. Extreme events, 9-11, Lehman collapse, LTCM / Russia crisis are not reflected in asset volatility (those few days are completely diluted).
2. Extreme event co-movement, such as correlation to 1 phenomena in stocks are not captured in correlation (also completely diluted).
3. Higher central and co-moments are only weakly diluted over time and remain visible for decades due to impact of 3rd and 4th order.
4. Higher moments jointly with variance and co-variance are capable to account for risk appropriately as information remains visible.
5. Higher moments allow to construct portfolios where diversification holds when needed as rare events are taken under consideration with appropriate likelihoods.
JP Omega Ltd.
III. Summary of Stylized Economic Facts
Input of Portfolio Moments for Optimization exclusively motivated by economic stylized factsG
auss
John
son
No, High dilution over time
Extreme Event Memory
None
Yes, due to low dilution over time
Some Comments on "Rare Events":
The Johnson distribution framework introduced subsequently will fulfill all these criteria and allows to derive a perfomance measure, which is able to account appropriately for all possible outcomes, by attributing reasonable probabilities in calm, boom or bust markets.
Trend / Momentum / Herding behavior (e.g. ARIMA, Factor Models, proprietary forecasting)
Market sentiment, Asset characteristic, Volatility clustering etc. (historic standard deviation or GARCH models)
Asset constituents interaction over the long term (historic long-term correlation or GARCH type models)
Asymmetry, which means the characteristic direction of outliers in case of extreme events.
Downside- or Upside co-movements (or neutral) in extreme market situations.
Tail Fatness, which is the charateristic magnitute of outliers in case of extreme events.
Mutual amplification or mitigation of returns in extreme market movements through asset interaction.

The density
with the derivative g', whereas:
Moments of HFRI strategies estimated prior to Lehman Collapse
a) Cover entire skewness and kurtosis space and therefore able to account for
strategy specific asymmetry and fat tail characteristics.
b) No influence by "noise" as no estimation of instable moments of order 5 or higher.
c) Contain Normal and Log-Normal distributions as special cases.
d) Independent to economically and statistically insignificant moments of order >=5.
e) Cover bi-modal, but no economically meaning less multi-modal distributions.
f) Much more flexible than Weibull, student-t or two-sided t distributions.
g) c2-tests indicate appropriateness (available upon requrest).
JP Omega Ltd.
IV. Johnson distributions - Basics & Features
1. Johnson distributions cover the entire Skewness and Kurtosis Space 2. Definition of Johnson distributions
3. Johnson densities of HFRI Strategies (Linear) 4. Conclusion & Features of Johnson distributions:
i.e. Johnson distributions are transformed versions of Gauss distributions. The 4 parameters g, d, m and l uniquely depend on 4 moments.
BoundedJohnson SB
Log-Normal SL (negatively
skewed)
UnboundedJohnson SU
Normal SN
Log-Normal SL(positively skewed)
Event Driven
Equity Hedge
Emerging Markets
Macro
Relative Value
0
3
6
9
12
-2,0 -1,5 -1,0 -0,5 0,0 0,5 1,0 1,5 2,0
Kurt
osis
Skewness
lmd
lmdg
xgexj
xg
2
2
2
1)(
)(:1ln
)(:1
ln
)(:ln
:
:)(
2 SUJohnsonUnboundedifyy
SBJohnsonBoundedify
ySLNormalLogify
SNNormalify
yg
05
101520253035404550
-10% -5% 0% 5% 10%Return
HFRI Event-Driven
HFRI Equity Hedge
HFRI Emerging Markets
HFRI Macro
HFRI Relative Value

The density
with the derivative g', whereas:
Moments of HFRI strategies estimated prior to Lehman Collapse
a) Cover entire skewness and kurtosis space and therefore able to account for
strategy specific asymmetry and fat tail characteristics.
b) No influence by "noise" as no estimation of instable moments of order 5 or higher.
c) Contain Normal and Log-Normal distributions as special cases.
d) Independent to economically and statistically insignificant moments of order >=5.
e) Cover bi-modal, but no economically meaning less multi-modal distributions.
f) Much more flexible than Weibull, student-t or two-sided t distributions.
g) c2-tests indicate appropriateness (available upon requrest).
JP Omega Ltd.
IV. Johnson distributions - Basics & Features
1. Johnson distributions cover the entire Skewness and Kurtosis Space 2. Definition of Johnson distributions
3. Johnson densities of HFRI Strategies (Logarithmic) 4. Conclusion & Features of Johnson distributions:
i.e. Johnson distributions are transformed versions of Gauss distributions. The 4 parameters g, d, m and l uniquely depend on 4 moments.
BoundedJohnson SB
Log-Normal SL (negatively
skewed)
UnboundedJohnson SU
Normal SN
Log-Normal SL(positively skewed)
Event Driven
Equity Hedge
Emerging Markets
Macro
Relative Value
0
3
6
9
12
-2,0 -1,5 -1,0 -0,5 0,0 0,5 1,0 1,5 2,0
Kurt
osis
Skewness
lmd
lmdg
xgexj
xg
2
2
2
1)(
0,00001
0,0001
0,001
0,01
0,1
1
10
100
-10% -5% 0% 5% 10%
Return
HFRI Event-Driven
HFRI Equity Hedge
HFRI Emerging Markets
HFRI Macro
HFRI Relative Value
)(:1ln
)(:1
ln
)(:ln
:
:)(
2 SUJohnsonUnboundedifyy
SBJohnsonBoundedify
ySLNormalLogify
SNNormalify
yg
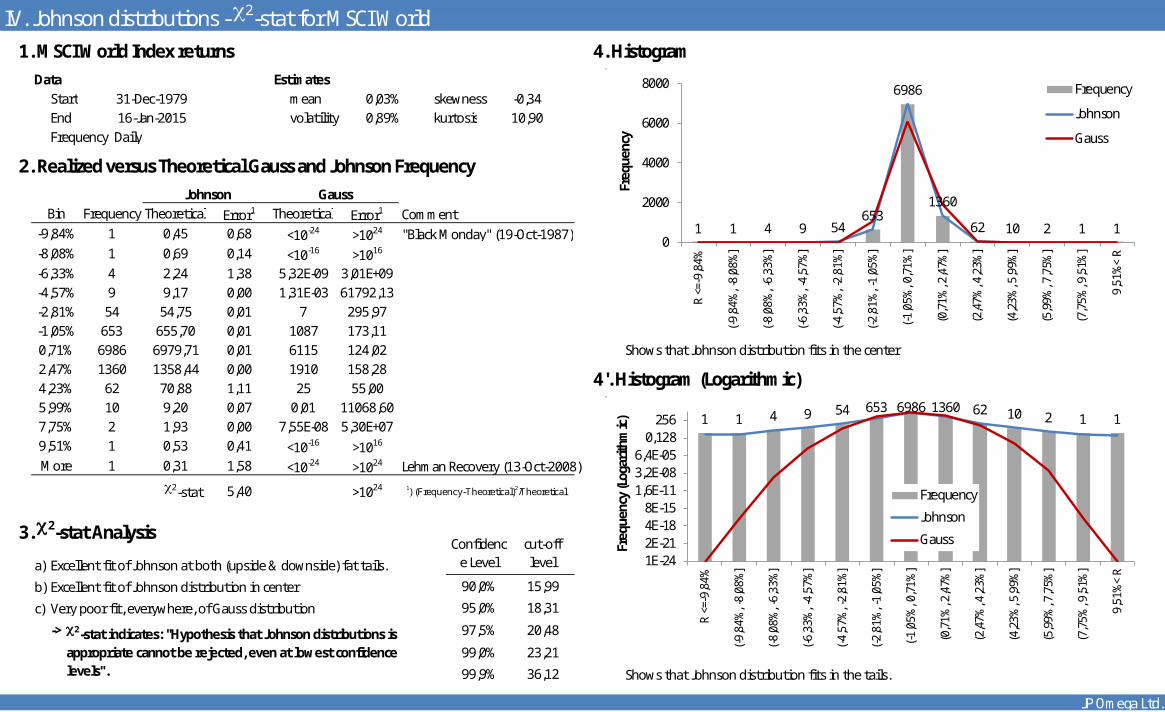
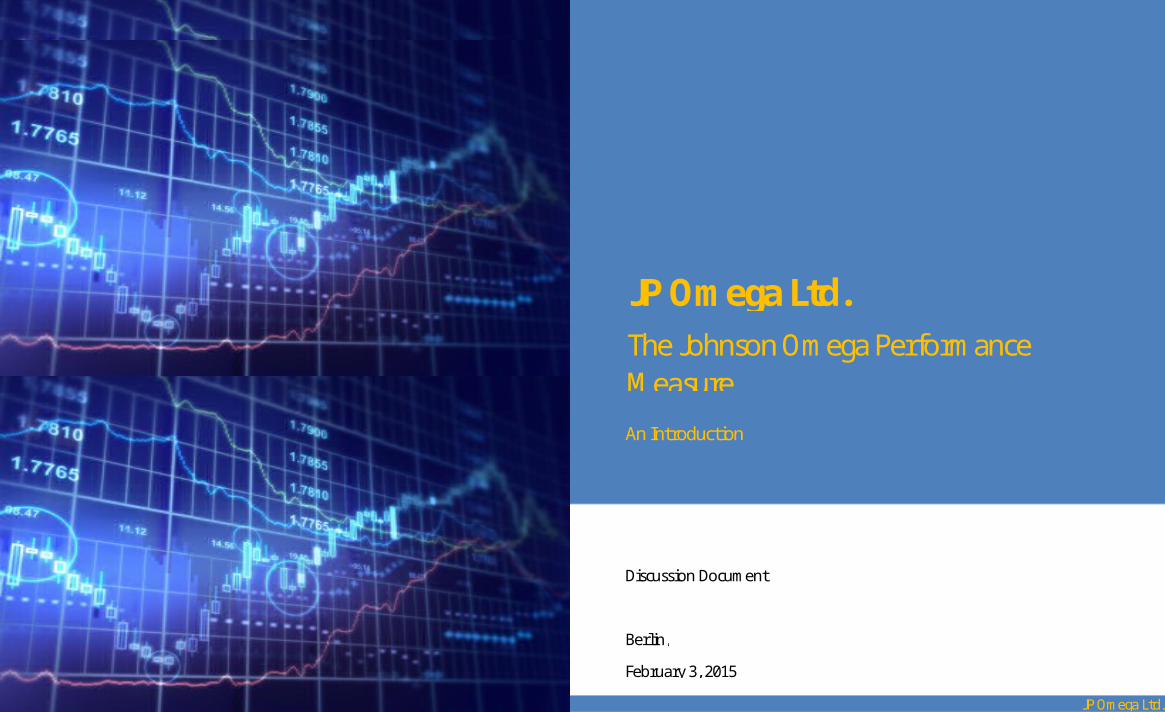
Data EstimatesStart mean skewnessEnd volatility kurtosisFrequency Daily
Comment"Black Monday" (19-Oct-1987)
Shows that Johnson distribution fits in the center
Lehman Recovery (13-Oct-2008)
a) Excellent fit of Johnson at both (upside & downside) fat tails.
b) Excellent fit of Johnson distribution in center.
c) Very poor fit, everywhere, of Gauss distribution.
->
Shows that Johnson distribution fits in the tails.
JP Omega Ltd.
36,12
c2-stat 1) (Frequency-Theoretical)2/Theoretical
90,0% 15,99
95,0% 18,31
c2-stat indicates: "Hypothesis that Johnson distributions is appropriate cannot be rejected, even at lowest confidence levels".
97,5% 20,48
99,0% 23,21
99,9%
5,40 >1024
3. c2-stat AnalysisConfidenc
e Levelcut-off level
More 1 0,31 1,58 <10-24 >1024
9,51% 1 0,53 0,41 <10-16 >1016
7,75% 2 1,93 0,00 7,55E-08 5,30E+075,99% 10 9,20 0,07 0,01 11068,60
4'. Histogram (Logarithmic)4,23% 62 70,88 1,11 25 55,002,47% 1360 1358,44 0,00 1910 158,280,71% 6986 6979,71 0,01 6115 124,02-1,05% 653 655,70 0,01 1087 173,11-2,81% 54 54,75 0,01 7 295,97-4,57% 9 9,17 0,00 1,31E-03 61792,13-6,33% 4 2,24 1,38 5,32E-09 3,01E+09-8,08% 1 0,69 0,14 <10-16 >1016
2. Realized versus Theoretical Gauss and Johnson Frequency
Johnson Gauss
1. MSCI World Index returns 4. Histogram
-9,84% 1 0,45 0,68 <10-24 >1024
Bin Frequency Theoretical Error1 Theoretical Error1
IV. Johnson distributions - c2-stat for MSCI World
31-Dec-1979 0,03% -0,3416-Jan-2015 0,89% 10,90
1 1 4 9 54653
6986
1360
62 10 2 1 10
2000
4000
6000
8000
R <=
-9,8
4%
(-9,8
4%, -
8,08
%]
(-8,0
8%, -
6,33
%]
(-6,3
3%, -
4,57
%]
(-4,5
7%, -
2,81
%]
(-2,8
1%, -
1,05
%]
(-1,0
5%, 0
,71%
]
(0,7
1%, 2
,47%
]
(2,4
7%, 4
,23%
]
(4,2
3%, 5
,99%
]
(5,9
9%, 7
,75%
]
(7,7
5%, 9
,51%
]
9,51
%<
R
Freq
uenc
y
Frequency
Johnson
Gauss
1 1 4 9 54 653 6986 1360 62 10 2 1 1
1E-242E-214E-188E-15
1,6E-113,2E-086,4E-05
0,128256
R <=
-9,8
4%
(-9,8
4%, -
8,08
%]
(-8,0
8%, -
6,33
%]
(-6,3
3%, -
4,57
%]
(-4,5
7%, -
2,81
%]
(-2,8
1%, -
1,05
%]
(-1,0
5%, 0
,71%
]
(0,7
1%, 2
,47%
]
(2,4
7%, 4
,23%
]
(4,2
3%, 5
,99%
]
(5,9
9%, 7
,75%
]
(7,7
5%, 9
,51%
]
9,51
%<
R
Freq
uenc
y (L
ogar
ithm
ic)
Frequency
Johnson
Gauss

1. Mean, mn a) Constituent's (Co-) Moments (1A) and Weights2. (Co-) Variance, S=(covmn) (1B) uniquely determine portfolio moments (2).3. (Co-) Skewness, co-sklmn b) Portfolio moments (2) uniquely determine4. (Co-) Kurtosis, co-kuklmn Johnson density (3) , which is able to capture
k,l,m and n=1,…5 any "asymmetry" and "fat tail" properties.c) JP Formulas uniquely determine call (blue)
These moments are estimated, fix and put (red) prices and its Omega ratio (black).and not subject to optimization. These weights are subject to optimization. d) Johnson Omega ratio (3') is optimized w.r.t.
portfolio weights w.e) Johnson distribution (3) provides minimum
expected returns (4) at each confidence level.
a) mean higher and positive.b) volatility lower.c) skewness ("asymmetry") is positived) kurtosis ("fat tail" magnitude) low, insignificant.
-> optimized portfolio with reduced risk andmaintained upside potential by bending and shifting return distribution.
Johnson Omega(w) is equivalent to
using closed form representations for call and put prices.
JP Omega Ltd.
Improvement through optimization:
V. Johnson Omega1.A) Constituent Moments 1.B) Constituent Weights (w) The logic:
HFRI Event Driven HFRI Equity HedgeHFRI Emerging
Markets HFRI MacroHFRI Relative
Value
2) Portfolio Moments (depending on constituents weights)
2.a) Mean, m(w)=wTmm 2.b) Variance, 2(w)=wTSw 2.c) Skewness, sk(w) 2.d) Kurtosis (excess), ku(w)
3) Cumulative Johnson Return Density (depending on portfolio moments and thus on constituents weights)
3') Optimization setup:
maxw.r.t. w
max Johnson Call(mean(winit),mean(w),var(w),skew(w),kurt(w))w.r.t. w
4) Minimum Expected Return at given C.L. (depending on portfolio moments and thus on constituents weights)
Johnson Put(mean(winit),mean(w),var(w),skew(w),kurt(w))
via ratio:0,1% 1% 2,5% 5% 10%
Initial:0,73%
=190% 95% 97,5% 99% 99,9% 0,73%
Johnson Omega(winit)=
Optimized:1,15%
=10,660,11%Johnson Omega(wopt)=
0%
100%
Prob
. to
be b
elow
ret
urn
-0,79%
0,26%
-1,0%
-0,5%
0,0%
0,5% 1,97%
1,19%
0%
1%
2%
-0,65
0,33
-1,0
-0,5
0,0
0,5 3,06
0,220
2
4
-10,5%
-6,5% -5,1% -4,1% -3,2%
1,4% 2,1% 2,8% 3,6%6,1%
-2,9% -2,2% -1,9% -1,6% -1,2%
1,8% 2,3% 2,8% 3,3% 4,5%
-15%
-10%
-5%
0%
5%
10%
Min
. exp
. ret
urn
@ C
L
20% 20% 20% 20% 20%21%0%
-30%
34%
75%
-30%
0%
30%
60%
90%Initial (Equi) JP Omega
0,73%
0,11%
0,0%
0,4%
0,8%
1,2%
Johnson Put
0,73%1,15%
0,0%
0,4%
0,8%
1,2%
Johnson Call
1,00
10,66
0
5
10
15
Omega
Initial Optimized- -1,6%
5%
95%
-4,1%

Mean-Variance efficient frontier Call-Put efficient frontier
Mean
Volatility
Skewness Mean
Kurtosis (Excess) Volatility
Sharpe Skewness
JP Call Kurtosis (Excess)
JP Put Sharpe
JP Omega JP Call
JP Put
JP Omega
Riskfree
i.e. Rf
Sharpe Efficient frontier accounts only for mean and variance. Johnson Omega Efficient frontier accounts for mean, variance, skewness and kurtosis.
1. Strong bias towards low volatility strategies (ow risk in mean-variance framework). 1. Remains in the center of Put and Call spectra. No bias, e.g. towards low/high volatility.
2. Substantial negative Skewness and excess Kurtosis, i.e. "fat tail" to downside. 2. Moderate negative Skew, widely eliminated excess Kurtosis, i.e. no downside fat-tail.
3. High Sharpe Ratio. 3. Lower, but more realistic Sharpe Ratio (no 4-5 StDev. events to be expected frequently).
4. Both Johnson Call and Johnson Put with equal and low amounts (low upside / low downside) 4. Johnson Call clearly more precious than Johnson Put, i.e. increased Johnson Omega ratio.
JP Omega Ltd.
1. Markowitz's Modern Portfolio Theory and Sharpe Ratio 2. Johnson Omega Efficient Portfolio
VI. Johnson Omega joins and extends Markowitz's MPT and Black-Scholes-Merton option prices to arbitrary skewness and kurtosis
0,83%
1,21%
-1,13
6,83
0,29%
2,30
0,43%
1,01%
2,63%
-0,34
2,10
1,03%
0,95
Comments on Sharpe optimized portfolio: Comments on Johnson Omega optimized portfolio:
R-Rfslope=0,43%
1,0
slope=CallPut
0,95%
1,08
HFRI Event-Driven
HFRI Macro
HFRI Relative Value
JP efficient frontier
JP Omega Portfolio
consisting of 93% Equity Hedge and
7% Emerging Markets
Capital Market Line
HFRI Equity Hedge
HFRI Emerging Markets
0,0%
0,2%
0,4%
0,6%
0,8%
1,0%
1,2%
1,4%
1,6%
1,8%
0,0% 0,2% 0,4% 0,6% 0,8% 1,0% 1,2% 1,4% 1,6%
JP C
all
JP Put
HFRI Event-DrivenHFRI Macro Markowitz
Efficient Frontier
Capital Market Line
Sharpe Portfolio conssting of 21% Macro and 79% Relative Value
HFRI Relative Value
HFRI Equity Hedge
HFRI Emerging Markets
0,0%
0,5%
1,0%
1,5%
2,0%
2,5%
0,0% 0,5% 1,0% 1,5% 2,0% 2,5% 3,0% 3,5% 4,0% 4,5%
Retu
rn
Volatility

Assume a portfolio has the following mean variance characteristics (monthly excess returns vs riskfree):
1. Hurdle
2. Mean 2. Johnson Omega is monotonously increasing with respect to skewness.
3. Volatility
Assuming a Riskfree Rate of 3% p.a. this would result in an annualized Sharpe ratio of 0.64.
This can be understood by looking at the (logarithmic) CDF chart:
JP Omega Ltd.
3.
4.
The complexity of moment interaction demanding for a rigorous treatment of upside versus downside becomes apparent from the finding that a large negative skewness and high kurtosis is on isokline to Normal distribution (skewness=0 and kurtosis=3). For a better understanding the call and put prices are considered:
Optimum with respect to skewness and kurtosis, potentially without sacrificing mean-variance optimum.
0,0%
Johnson Omega can distinguish portfolios looking identical for Sharpe
Defined in the entire Johnson distributions support, i.e. kurtosis>1+skewness2. The blue enveloping parabola curve in the contourplot limits this feasible region (it can be shown that no distributions below that curve are feasible at all, please refer to Kendall & Ord, Advanced Statistic - Distribution Theory).
2,02
1,95 -1
0
SkewnessJohnson
Type
Unbounded
Gauss
Kurtosis (Excess)
5
3
Johnson Omega
Johnson Call
Johnson Put
0,78%
0,84%
1,58%
Johnson Omega is able to distinguish the performance measurement by taking skewness and kurtosis into account.
1.
VII. Johnson Omega IntuitionJohnson Omega Performance Measure Some Comments on Johnson Omega
0,8%
3,0%
Not necessarily the portfolio with lowest volatility is least risky. Risk adjusted Johnson Omega performance measure can be higher just subject to favorable skewness and kurtosis properties.
5.
Returns of below hurdle are expected to happen in around 33% of the cases for the negatively skewed distribution (due to the mode greater than the mean). In contrast, when assuming Gauss distribution 0% is expected to be undershoot in 50% of the cases. The poor tail properties of the negatively skewed distribution comes only when returns below -5% are considered. Downside is not the same as tails. Therefore one may look at MaxGainLoss Ratio.
0,51
1,231,64%
Max GainLos
s
1,E-04
1,E-03
1,E-02
1,E-01
1,E+00-10% -8% -6% -4% -2% 0% 2% 4% 6% 8% 10%
Unbounded Johnson
Gauss

MeanStdevSkewnessKurtosis (Excess)Johnson Call (Upside)Johnson Put (Risk)Johnson Omega
Interpretation & Remarks:a) Marginal attribution w.r.t. equally weighted portfolio shows impact of increase of particular strategy to portfolio moments, JP Call,JP Put and JP Omega at first iteration. b) Proprietary closed form solutions of EMA, i.e. gradients and Greeks available.
i) HFRI Event DrivenPositive attribution to return, however, incease of volatility. Worsen tail fatness and asymmetry towards downside fat tail.-> Increase of both call and put (mitigated through increase of mean). Overall, slight increase of Omega ratio.
ii) HFRI Equity HedgeNegative attribution to Mean, further increase of volatility. However, positive tail properties (increases skewness and reduces kurtosis). Bending distribution towards outliers toupside rather than downside. -> Decrease of call and increase of put (mitigated through favorible tail properties). Overall, decreasing impact on Omega ratio.
iii) HFRI Emerging Markets
-> Substantial decrease of call and massive increase of put (only weakly mitigated through favorable correlation-diversification impact). Overall, highly bad impact on Omega ratio.iv) HFRI Macro
Positive attribution to return, reduction of volatility. Thus, improvement in traditional sense. Further, massively reduces tail fatness and also bends asymmetry towards upside.-> Increase of both call and put (mitigated through increase of mean). Overall, slight increase of Omega ratio.
v) HFRI Relative Value
-> Increase of call and reduction of put (worsening of tail is compensated by reduced volatility and substantial increase of expected mean). Overall, clear increase of Omega ratio.
JP Omega Ltd.
Highly negative attribution to Mean, and slight increase of volatility. However, very poor tail properties (makes skewness more negative and substantially increases kurtosis). Bending distribution towards a "big fat tail".
Highest attribution to return and favorable impact portfolio volatility. Excellent diversifier in the mean variance space. However, substantially increased tail fatness & bending asymmetry towards higher downside risk. Contrary picture to Macro: Both have mitigating influence on volatility but opposite impact on tail fatness and direction.
VIII. Johnson Omega optimization transparency through Expected Marginal Attribution (EMA) analysis
2. Interpretation of Expected Marginal Attribution:
1. EMA of HFRI Strategies ax ante Lehman Collapse (31-Aug-2008)
HFRI Equity Hedge-0,16%0,10%0,87
EMA to JP Omega indicates short Emerging Market as it reduces call and incrices put.
EMA to portfolio options (joined impact of portfolio moments): e.g. adding to Emerging Markets reduces upside (call) and reduces downside (put), by 1% x (-0.85%)=-0.85bps and
EMA to portfolio moments. E.g. adding 1% to Macro (while reducing the remaining strategies by 0,25% each) causes an increase of portfolio skewness by 1% x 1.77=0.017. Therefore adding to Macro bends the distribution from negative to positive skewness. Tail fatness massively reduced.
HFRI Relative Value0,79%-0,13%-0,694,11
0,35%-0,45%1,57
-4,09
-0,21%0,85
-7,380,22%-0,02%
0,14%-0,31
-1,55%0,02%-0,99
0,43%-0,13%
1,77
0,30%-0,17%0,94
EMA w.r.t. equally weighted portfolio
Interpretation (examples)HFRI Event-Driven
0,48%0,14%-0,961,60 5,76
-0,85%0,69%-3,05
HFRI MacroHFRI Emerging
Markets

Indication that Johnson Omega optimized may even 1st order stochastically dominate Sharpe optimal portfolio, i.e. simultaneously better upside potential and better downside protection.
a)HFRI Event-DrivenHFRI Equity Hedge b)HFRI Emerging MarketsHFRI MacroHFRI Relative ValueMean (excess vs Rf) a) The Johnson Omega has higher return, however, with a higher volatility.Volatility b) Overall, the Johnson Omega portfolio has a lower Sharpe ratio.Skewness
p-valueKurtosis (Excess) a) The Johnson Omega has an improved asymmetry and reduced tail fatness of returns.
p-value b)Johnson Call (Upside)Johnson Put (Risk)SharpeJohnson Omega
a)
b)
c)
2) Basis for estimating HFRI strategy moments are Index data from Jan-1990 to Oct-2014.
JP Omega Ltd.
4. Decision which portfolio is superior is implied by CDF
At each level of confidence the Johnson Omega optimized has a higher minimum expected return than the Sharpe optimal portfolio, i.e. Johnson Omega 1st order stochastically dominates Sharpe Portfolio.
Johnson Omega portfolio may be superior to Sharpe optimal portfolio for each rational investor (irrespective whether risk averse, or risk tolerant, irrespective of his utility function).
-3,1%0,4%8,5%
Johnson Omega portfolios are potentiall superior as they can comprehensively and non-discretionarily account for asymmetry (skew) and tail-fatness (kurtosis) of the return distribution.
1. Constituent Analysis (affirm results from LTCM investigation in Risk, 2005 and 2008):
5. Conclusion:4,5%7,5%
0,0%1,7%2,5%3,3%
0%19%-3%
0,5%0,4%0,93 improved
asymmetry
meager tails
Ambivalence
2,39%1,28
5,2%1,9%1,0%0,4%
Johnson Omega has lower overall downside potential (Put) and lower likelihood of extremely negative returns (see CDF).
Sharpe (as minimum variance) optimized portfolios have a tendency to allocate towards negatively skewed Event Driven and Relative Value strategies.
99,9%
5%10%50% 8,5%
17,6%19,6%22,3%29,3%
15,1%16,3%17,8%21,8%
0,4%
13,7% 15,4%
Portfolio optimized w.r.t.
Johnson Omega has higher overall upside potential (call) and likelyhood of extremely positive returns (see CDF).
Ambi
vale
nce
betw
een
trad
ition
al a
nd a
dvan
ced
perf
orm
ance
eva
luati
on.
Johnson Omega
Sharpe
3,3%-3,45 3,3%
-21,1%-9,8%-5,7%-2,7%
-56%40%
all differences are positive: Indication for
1st order stochastic
dominance. (resolves
above ambivalence)
Comments on Johnson
Omega
call & put improved
1,25
0,53%-0,01%
-0,01 0,25
0,0%
1,29
Minimum expected return at
given confidenc
e level (CDF)
75%0%0%0%
25%7,6%5,9%
-1,47 0,01%
5,590,01%1,86%2,40%
95%97,5%
99%
-26,3%-11,7%
-6,7%
90%
0,1%1%
2,5%
Example: Comparison of Johnson Omega and Sharpe optimized HFRI strategy portfolios
IX. Addendum - Johnson Omega and 1st order stochastic dominance
1,0
3,3%
Difference
19%40%
0%19%22%
Johnson Omega optimized portfolios have a tendency towards more volatilile, but neutral/positively skewed strategies such as Equity Hedge and Macro.
8,1%6,3%
-0,54 3,3%2,14
Weights
Portfolio Moments
3. Portfolio Moment Analysis - Advanced: Including Skew and Kurtosis
Overall, the Johnson Omega portfolio - taking into account mean, variance, skewness and kurtosis - has a higher Johnson Omega ratio.
2. Portfolio Moment Analysis - Traditional: Only Mean Variance based
Portfolio Options
Ratios
2,39%

* Potentially insignificant and 'noisy' or instable moments of order 5 and higher included. * Requires Market Capitalization and discretionary views.
* Higher portfolio turnover and transaction cost. * Based on mean-variance assumption and quadratic utility.
* * This is basically a mean-variance optimization
* Asymmetry and tail fatness of specific assets not taken into account
*
* This is just a degree Fahrenheit-Celsius like affince transformation:
* Requires the discretionary choice of a conficence level
* Yields portfolios with inferior risk-adjusted returns as risk not taken into account.
* Throughout all backtests larger maximum drawdowns (available upon request).
*
* Ignores the widely accepted rule to beware of "grabbing a falling knife".
* Yields the same ranking as Omega.
* Does not take trend- a well established stylized fact - into account.
* Descretionary moment weighting required (for mean, variance, skewness and kurtosis) *
**
* Outcomes very sensitive to discretionary weightings of moments.
JP Omega Ltd.
6.
Black-Litterman & Bayesian Updating
Michaud Optimization
8. Trend-Follower (Maximum Return)
9. Minimum Variance
Yielding inferior portfolios w.r.t. absolute and risk adjusted returns as trend - a major stylized economic fact - is not taken into account at all.
5.
Volatility and Kurtosis are generally discriminated, reducing risk but also upside potential.
Multiple Objective Approach (Kat & Lu)
2.
4.
In-transparent and discretionary as weighting of upside and downside required ("black-box")
Omega Function (Shadwick & Keating)
X. Competing Performance Measures
1. Empirical Omega
3. Sharpe Omega (Kazemi, Schneeweis & Gupta)
7.
Experience of direction and magnitude of co-movements in case of market dislocations not taken into account.
cVaR or Expected Tail Loss based performance measures
10. 1/N Portfolios (Uppal et al)
This benchmark is persistantly outperformed in all back-test on both absolute and risk-adjusted return levels, e.g. larger drawdowns despite of low volatility.
Inferior diversified portfolios, despite of "maximum diversification" as co-skew and co-kurtosis are not considered. "Correlation to 1" experience not reflected.
11)(
1)(
)0,max()0,max(
1)(
)()()(
)(
..:
SeHPut
HREe
HPut
RHEeHREeHPut
HPutHCallHPut
HCall
ff
ff
R
OmegaSharpeeiS
R
RR

* Omega measure introduced by W. Shadwick & C. Keating 'A Universal Performance Measure', 2002
* Sharpe-Omega by H. Kazemi, T. Schneeweis & R. Gupta 'Omega as Performance Measure', 2003
*
* Working paper approved by Prof. Salih Neftci (City University, New York) in July 2004 and suggested for publication in Risk Magazine 'Cutting Edge' section.
* Publication in Risk Magazine 'Cutting Edge' Section "Omega Portfolio Construction with Johnson Distributions", April 2005 (mathematical formulas not published).
*
* Swiss doctoral workshop presentation refereed by Prof. R. Stulz (Ohio State University), June 2004.
* Invited by C. Keating to meet at 4th Annual Conference "The European Investment Review" (Cass, London) and to discuss Johnson-Omega, September 2004.
* Invited speaker for "European Bond Commission Meeting" in Zürich (Switzerland), October 2004.
* Presentation at Gottex Fund Management in Boston (USA), January 2005.
* Swiss doctoral workshop presentation refereed by Prof. J. Detemple (Boston University), June 2005.
* 4th General Conference "Advanced Mathematical Methods in Finance (AMaMeF)" in Aalesund (Norway), May 2009.
* Invited speaker for "Mathematical Finance Seminar" Imperial College, London (UK), June 2009.
* Various Testing within Gottex, Deutsche Bank and Capital Edge
* Development of proprietary software related to Johnson distribution based portfolio construction, option pricing and risk management in the framework of Johnson Omega Ltd.
JP Omega Ltd.
2. Johnson Omega by Alexander Passow
Developed in the course of PhD studies in finance at the "International Centre of Financial Asset Management and Engineering (FAME)", now Swiss Finance Institute (SFI), HEC Lausanne from 2002 to 2005
Risk article (April 2005) selected by Prof. B. Scherer (Birkbeck University, Morgan Stanley) for the Risk Book "Portfolio Management: Groundbreaking Technical Papers", August 2008.
3. Presentations of Johnson Omega concept (without disclosure of formulas)
XI. Review of Johnson Omega development
1. History of Omega
4. Practical Experience

* 2003 in European Alternative Multimanagement Survey: "… 82 of responders consider Shar and only 4% calculate an Omega ratio, despite of the fact that the latter is more appropriate for the alternative universe".
* 2004 in 'Fund of Hedge Fund Reporting': "… 53 of them (Fund of Hedge Funds) consider Omega to be an important or very important indicator…"
* 2005 in 'Fund of Hedge Fund Reporting': "… the Omega ratio is now required by 57% of fund managers and 48% of investors…"
*
*
*
*
*
* Successfully applied in hedge fund industry and tested for hedge fund indices, cross asset class and equty sector indices.
* A US pension fund with investments in bond & stocks, currently managed by Barclays was outperformed at high confidence level with respect to absolute and risk adjusted returns.
* Many presentations to institutional clients have received positive feedback.
* Explicit Johnson-Omega representations are undisclosed todate and private knowledge.
JP Omega Ltd.
2005 in Editorial by Prof. Lionel Martini: "… Passow (2004) suggests modelling higher order moments applying the Johnson cumulated densities to calculate the so-called Johnson-Omega. The advantage of Johnson-Omega is to extract persistent information from track record and exploit the persistence of higher moments (i.e. up to 4). It therefore overcomes the instabilities with non-parametric approaches to Omega and allows for more reliable portfolios".
2007 in 'Funds of Hedge Fund Reporting Survey': "… However, it is worth noting that new performance measures, which are better suited for alternative investments, are gaining acceptance, demonstrating the interest of market participants in rationalising the performance evaluation and attribution process. Indeed, the Omega ratio is already considered to be important to very important by 57% of fund managers and 48% of investors.
2. Further Quotes and Applications
XII. Some Citations of Omega and Johnson Omega from Academia & Practice
1. EDHEC Business School (Lille-Nice)
Winton Capital Management (AuM >USD12Bn) in an application to CTA performance (2003): "… we conclude that, owing to ist superior handling of the higher moments of returns distributions, Omega provides a superior risk/return measure of the more commonly used mean/variance metrics....".
Mausser, Saunders & Seco in Risk Magazine 'Cutting Edge' (2006): "… The parametric approach to optimizing Omega discussed in Passow (2005) offers an interesting alternative to the (non-parametric) approach taken in this article…".
Riskmetrics Group (2007): "… The Omega ratio is a new measure of performance. It overcomes the inadequacy of many performance measures when applied to investments that do not have normally distributed returns by taking the entire distribution into account..."
3. A few further remarks related to the state of Johnson-Omega:

For more information please contact [email protected] or phone +44 77 9555 0733 (Dr. Alexander Passow, Johnson Omega Ltd.). Thank You!
XIII. Conclusion
Accounts for economically stylized facts related to Mean, (Co-)Variance, (Co-)Skewness and (Co-)Kurtosis of (between) assets.1.
2. Able to account for each combination of asymmetry (skewness) and tail fatness (kurtosis).
Extends the theory of Markowitz (Modern Portfolio Theory) to call-put-space accounting for skewness and kurtosis.
Provides superior diversification, which holds when needed, by accounting for (only weakly diluted) skewness and kurtosis.
Uses proprietary Johnson Call and Johnson Put prices (and Greeks) generalizing Black-Scholes-Merton to any asymmetry and tail fatness.
Ignores and does not require other ("noisy") estimates and calibrations besides the input of stylized economic facts.
Avoides data-mining as non-discretionary because first 4 moments are uniquely and comprehensively merged.
Generates potentially 1st order stochastic dominating portfolios (preferable by each rational investor, irrespective of his utility function)
Allows to naturally include Riskfree asset in optimization for the non-discretionar determination of leverage.
15. Allows to be applied to all kind of portfolios, e.g. Long-Only, Long-Bias, Long-Short, etc.
Consistent with traditional performance ratios such as Sharpe, Sortino, Treynor and Information Ratio.
Links intuitive and naturally both Nobel Prize awarded theories through put-call-parity.
13.
Reduced model risk as Johnson Omega directly utilizes CDF. Idea is just bend & shift CDF to higher risk-adjusted, potentially 1st order SD returns.9.
18. Unified and consistent theory covering key disciplines: Portfolio Construction, Option Pricing and Risk Management.
14.
Allows higher upside potential as volatility not discriminated per se. Risk, i.e. Johnson Put price is just cost of insurance below hurdle.11.
12.
Naturally given hurdle (benchmark portfolio) may be modified for e.g. pension funds, which must generate guaranteed returns.
16. Allows to optimize fast and unique due to availability of closed form solution of performance measure.
17. Tested practically on various universes (traditional & alternative assets) showing significant absolute and risk-adjusted Outperformance.
8.
10.
3.
4.
5.
6.
7.