Embed Size (px)
Citation preview
2015 SecondQuarterAugust 6, 2015
2
Safe Harbor DisclaimerForward-Looking StatementsWe have made statements in this document that are forward-looking statements within the meaning of the federal securities laws, including the Private Securities Litigation Reform Act of 1995. You can identify forward-looking statements by the use of forward-looking terminology such as “believes,” “expects,” “could,” “would,” “may,” “might,” “will,” “should,” “seeks,” “likely,” “intends,” “plans,” “projects,” “predicts,” “estimates,” “forecast” or “anticipates” or the negative of these words and phrases or similar words or phrases that are predictions of or indicate future events or trends and that do not relate solely to historical matters. You can also identify forward-looking statements by discussions of strategy, plans or intentions related to our REIT status and our capital resources, portfolio performance and results of operations. Forward-looking statements involve numerous risks and uncertainties and you should not rely on them as predictions of future events. Forward-looking statements depend on assumptions, data or methods that may be incorrect or imprecise and may not be able to be realized. We do not guarantee that the transactions and events described will happen as described (or that they will happen at all). The following factors, among others, could cause actual results and future events to differ materially from those set forth or contemplated in the forward-looking statements: declines in advertising and general economic conditions; competition; government regulation; our inability to increase the number of digital advertising displays in our portfolio; taxes, fees and registration requirements; our ability to obtain and renew key municipal concessions on favorable terms; decreased government compensation for the removal of lawful billboards; content-based restrictions on outdoor advertising; environmental, health and safety laws and regulations; seasonal variations; acquisitions and other strategic transactions that we may pursue could have a negative effect on our results of operations; dependence on our management team and advertising executives; the ability of our board of directors to cause us to issue additional shares of stock without stockholder approval; certain provisions of Maryland law may limit the ability of a third party to acquire control of us; our rights and the rights of our stockholders to take action against our directors and officers are limited; our substantial indebtedness; restrictions in the agreements governing our indebtedness; incurrence of additional debt; interest rate risk exposure from our variable-rate indebtedness; our ability to generate cash to service our indebtedness; hedging transactions; establishing an operating partnership; asset impairment charges for goodwill; diverse risks in our international business; a breach of our security measures; failure to comply with regulations regarding privacy and data protection; failing to establish in a timely manner “OUTFRONT” as an independently recognized brand name with a strong reputation; the financial information included in our filings with the Securities and Exchange Commission (the “SEC”) may not be a reliable indicator of our future results; cash available for distributions; legislative, administrative, regulatory or other actions affecting REITs, including positions taken by the Internal Revenue Service (the “IRS”); our failure to remain qualified to be taxed as a REIT; REIT ownership limits; REIT distribution requirements; availability of external sources of capital; we may face other tax liabilities even if we remain qualified to be taxed as a REIT; complying with REIT requirements may cause us to liquidate investments or forgo otherwise attractive opportunities; our ability to contribute certain contracts to a taxable REIT subsidiary (“TRS”); our planned use of TRSs may cause us to fail to remain qualified to be taxed as a REIT; our ability to hedge effectively; failure to meet the REIT income tests as a result of receiving non-qualifying income; even if we remain qualified to be taxed as a REIT, and we sell assets, we could be subject to tax on any unrealized net built-in gains in the assets held before electing to be treated as a REIT; the IRS may deem the gains from sales of our outdoor advertising assets to be subject to a 100% prohibited transaction tax; our lack of an operating history as a REIT; we may not be able to engage in desirable strategic or capital-raising transactions as a result of our separation from CBS Corporation, and we could be liable for adverse tax consequences resulting from engaging in significant strategic or capital-raising transactions; and other factors described in our filings with the SEC, including but not limited to the section entitled “Risk Factors” in our Annual Report on Form 10-K for the year ended December 31, 2014, filed with the SEC on March 6, 2015. All forward-looking statements in this document apply as of the date of this document or as of the date they were made and, except as required by applicable law, we disclaim any obligation to publicly update or revise any forward-looking statement to reflect changes in underlying assumptions or factors of new information, data or methods, future events or other changes.
Non-GAAP Financial MeasuresThis presentation includes certain non‐GAAP financial measures intended to supplement, not substitute for, comparable GAAP financial measures. Reconciliations of non‐GAAP financial measures to GAAP financial measures are provided in the Appendix of this presentation.
Numbers in this presentation may not sum due to rounding.

Jeremy MaleCEO
3
4
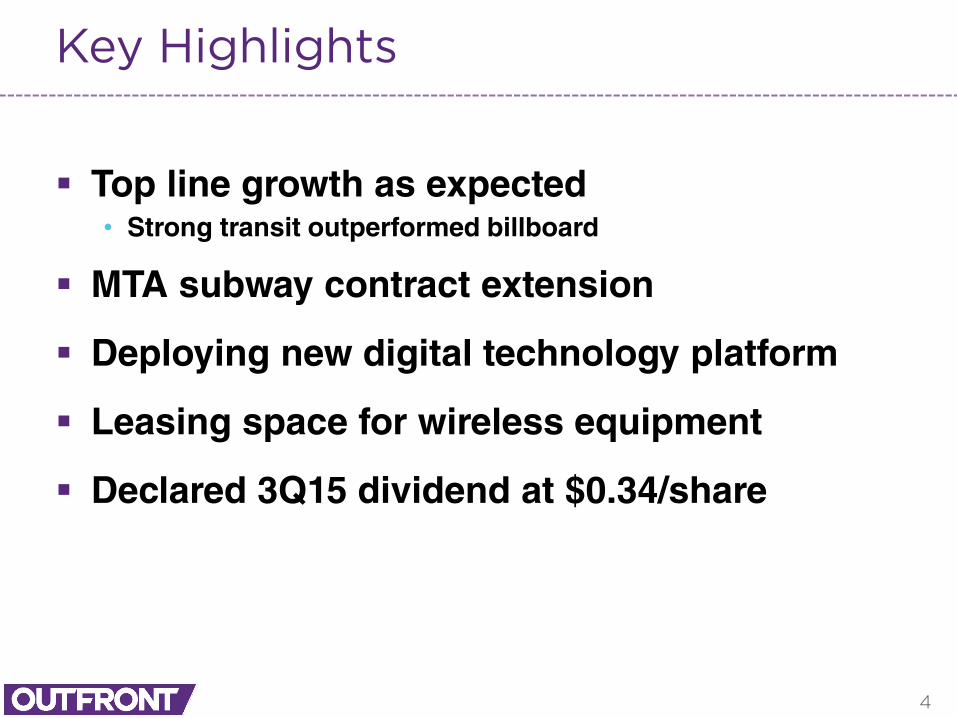
Key Highlights
Top line growth as expected• Strong transit outperformed billboard
MTA subway contract extension
Deploying new digital technology platform
Leasing space for wireless equipment
Declared 3Q15 dividend at $0.34/share

Donald ShassianEVP & CFO
5
6
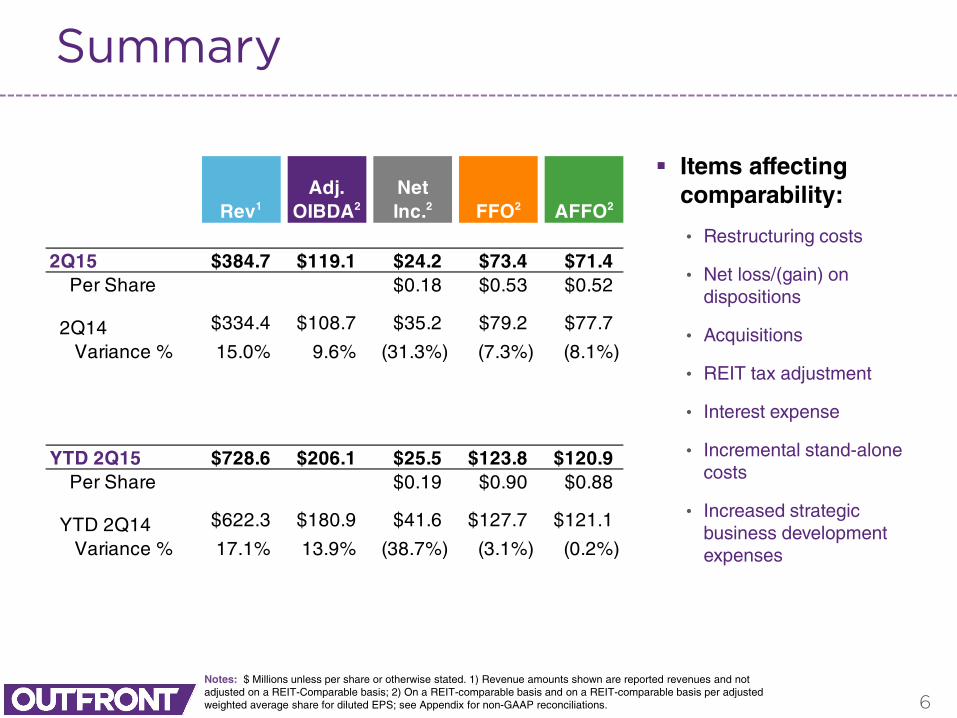
Summary
Items affecting comparability:
• Restructuring costs
• Net loss/(gain) on dispositions
• Acquisitions
• REIT tax adjustment
• Interest expense
• Incremental stand-alone costs
• Increased strategic business development expenses
Notes: $ Millions unless per share or otherwise stated. 1) Revenue amounts shown are reported revenues and not adjusted on a REIT-Comparable basis; 2) On a REIT-comparable basis and on a REIT-comparable basis per adjusted weighted average share for diluted EPS; see Appendix for non-GAAP reconciliations.
Rev1Adj.
OIBDA2Net Inc.2 FFO2 AFFO2
2Q15 $384.7 $119.1 $24.2 $73.4 $71.4 Per Share $0.18 $0.53 $0.52
2Q14 $334.4 $108.7 $35.2 $79.2 $77.7
Variance % 15.0% 9.6% (31.3%) (7.3%) (8.1%)
YTD 2Q15 $728.6 $206.1 $25.5 $123.8 $120.9 Per Share $0.19 $0.90 $0.88
YTD 2Q14 $622.3 $180.9 $41.6 $127.7 $121.1
Variance % 17.1% 13.9% (38.7%) (3.1%) (0.2%)
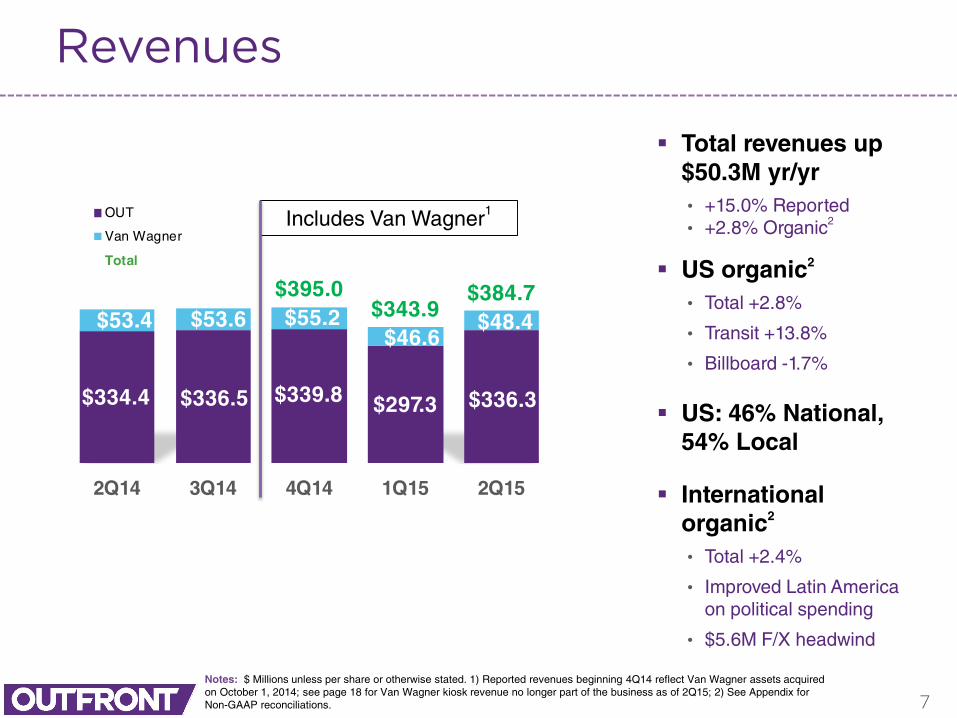
$334.4 $336.5 $339.8 $297.3 $336.3
$53.4 $53.6 $55.2$46.6
$48.4
$395.0 $343.9
$384.7
2Q14 3Q14 4Q14 1Q15 2Q15
OUT
Van Wagner
Total
7
Revenues
Total revenues up $50.3M yr/yr• +15.0% Reported• +2.8% Organic2
US organic2
• Total +2.8%
• Transit +13.8%
• Billboard -1.7%
US: 46% National, 54% Local
International organic2
• Total +2.4%
• Improved Latin America on political spending
• $5.6M F/X headwind
Notes: $ Millions unless per share or otherwise stated. 1) Reported revenues beginning 4Q14 reflect Van Wagner assets acquired on October 1, 2014; see page 18 for Van Wagner kiosk revenue no longer part of the business as of 2Q15; 2) See Appendix for Non-GAAP reconciliations.
Includes Van Wagner1
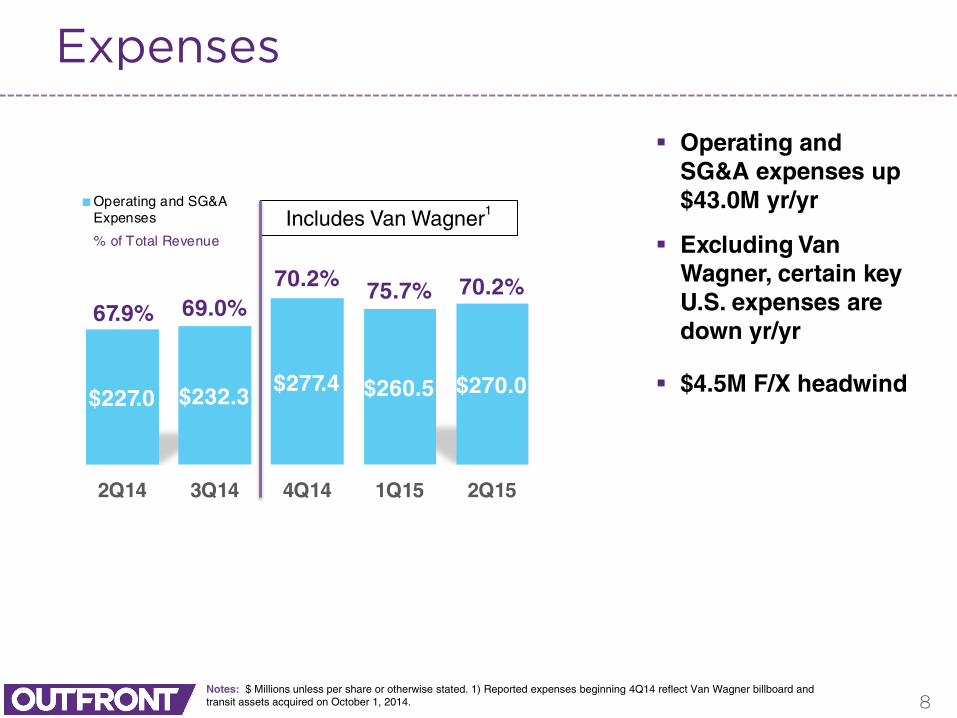
$227.0 $232.3$277.4 $260.5 $270.0
67.9% 69.0%70.2% 75.7% 70.2%
2Q14 3Q14 4Q14 1Q15 2Q15
Operating and SG&AExpenses
% of Total Revenue
8
Expenses
Operating and SG&A expenses up $43.0M yr/yr
Excluding Van Wagner, certain key U.S. expenses are down yr/yr
$4.5M F/X headwind
Notes: $ Millions unless per share or otherwise stated. 1) Reported expenses beginning 4Q14 reflect Van Wagner billboard and transit assets acquired on October 1, 2014.
Includes Van Wagner1
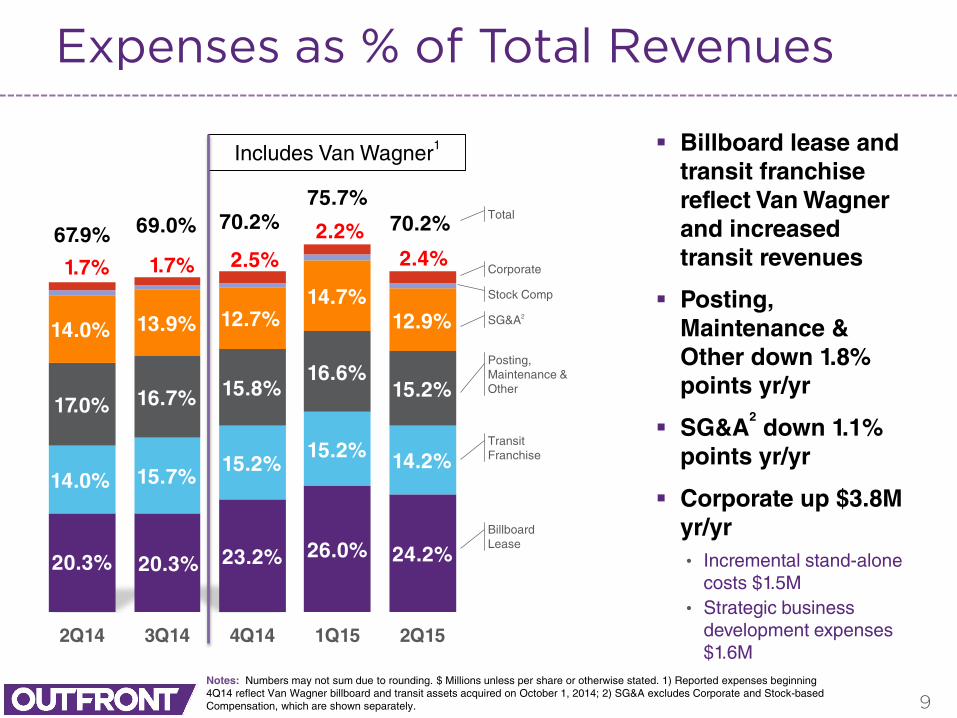
20.3% 20.3% 23.2% 26.0% 24.2%
14.0% 15.7%15.2%
15.2% 14.2%
17.0% 16.7% 15.8%16.6%
15.2%
14.0% 13.9% 12.7%14.7%
12.9%
1.7% 1.7% 2.5%2.2%
2.4%67.9% 69.0% 70.2%
75.7%70.2%
2Q14 3Q14 4Q14 1Q15 2Q15
9
Expenses as % of Total Revenues
Billboard lease and transit franchise reflect Van Wagner and increased transit revenues
Posting, Maintenance & Other down 1.8% points yr/yr
SG&A2
down 1.1% points yr/yr
Corporate up $3.8M yr/yr• Incremental stand-alone
costs $1.5M• Strategic business
development expenses $1.6M
Notes: Numbers may not sum due to rounding. $ Millions unless per share or otherwise stated. 1) Reported expenses beginning 4Q14 reflect Van Wagner billboard and transit assets acquired on October 1, 2014; 2) SG&A excludes Corporate and Stock-based Compensation, which are shown separately.
Includes Van Wagner1
Corporate
SG&A2
Posting, Maintenance &Other
TransitFranchise
BillboardLease
Stock Comp
Total
10
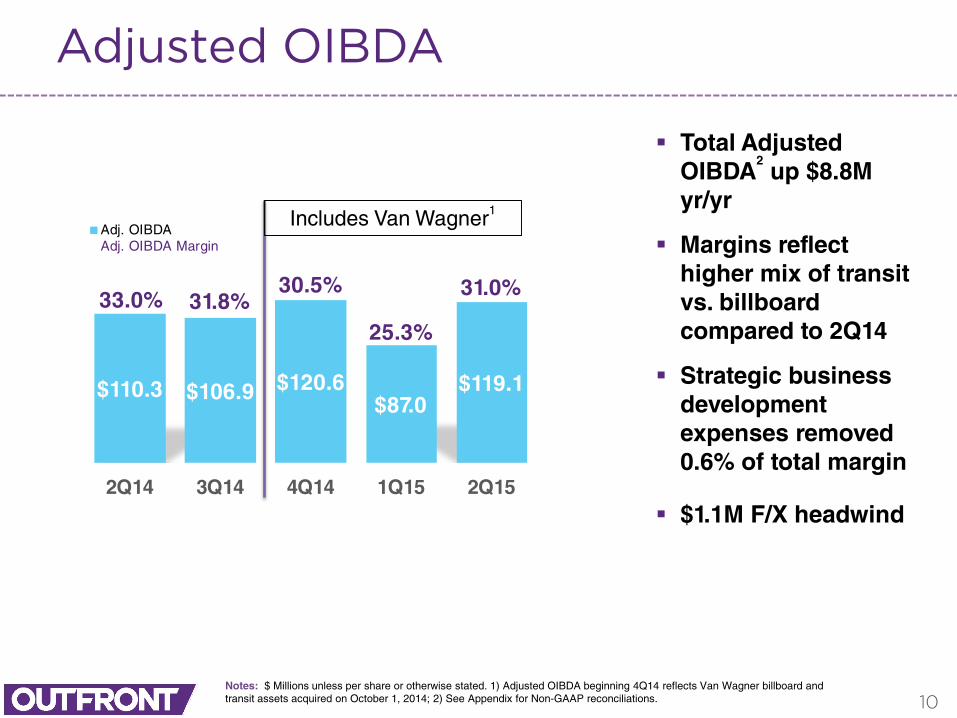
Adjusted OIBDA
Total Adjusted OIBDA
2up $8.8M
yr/yr
Margins reflect higher mix of transit vs. billboard compared to 2Q14
Strategic business development expenses removed 0.6% of total margin
$1.1M F/X headwind
Notes: $ Millions unless per share or otherwise stated. 1) Adjusted OIBDA beginning 4Q14 reflects Van Wagner billboard and transit assets acquired on October 1, 2014; 2) See Appendix for Non-GAAP reconciliations.
$110.3 $106.9 $120.6$87.0
$119.1
33.0% 31.8%30.5%
25.3%
31.0%
2Q14 3Q14 4Q14 1Q15 2Q15
Adj. OIBDAAdj. OIBDA Margin
Includes Van Wagner1
11
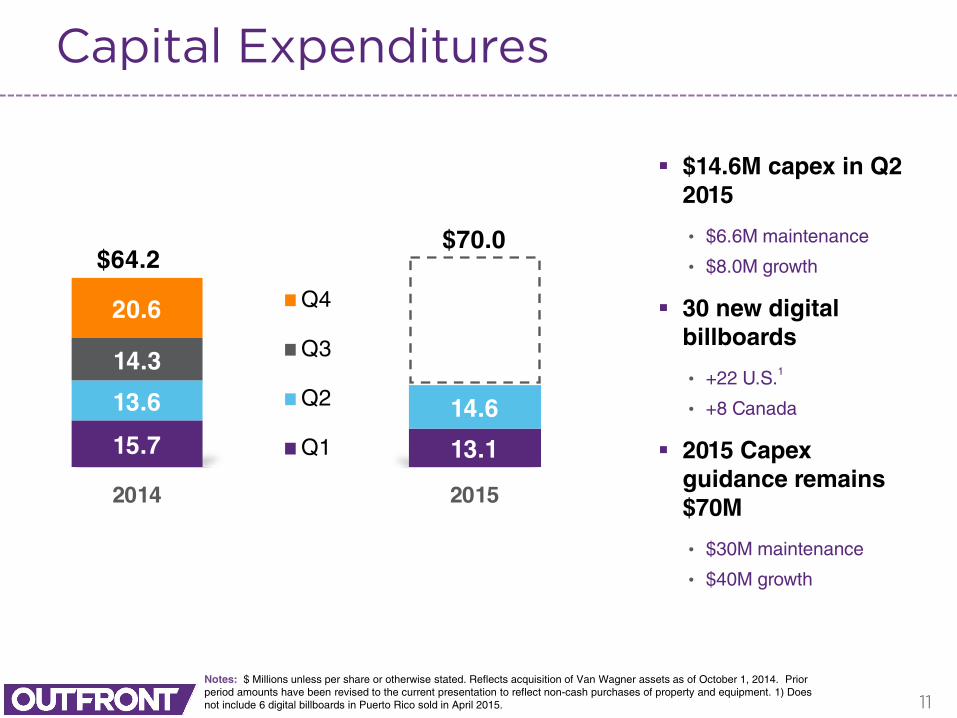
Capital Expenditures
$14.6M capex in Q2 2015
• $6.6M maintenance
• $8.0M growth
30 new digital billboards
• +22 U.S.1
• +8 Canada
2015 Capex guidance remains $70M
• $30M maintenance
• $40M growth
Notes: $ Millions unless per share or otherwise stated. Reflects acquisition of Van Wagner assets as of October 1, 2014. Prior period amounts have been revised to the current presentation to reflect non-cash purchases of property and equipment. 1) Does not include 6 digital billboards in Puerto Rico sold in April 2015.
15.7 13.1
13.6 14.6
14.3
20.6
$64.2 $70.0
2014 2015
Q4
Q3
Q2
Q1
12
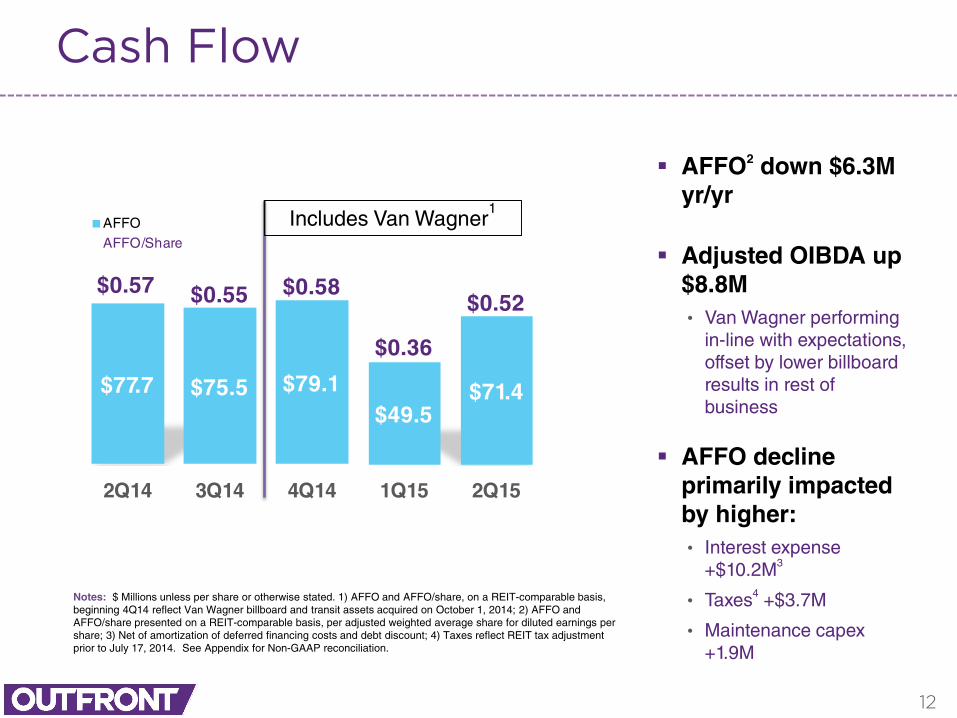
Cash Flow
AFFO2 down $6.3M yr/yr
Adjusted OIBDA up $8.8M • Van Wagner performing
in-line with expectations, offset by lower billboard results in rest of business
AFFO decline primarily impacted by higher:• Interest expense
+$10.2M3
• Taxes4 +$3.7M
• Maintenance capex +1.9M
Notes: $ Millions unless per share or otherwise stated. 1) AFFO and AFFO/share, on a REIT-comparable basis, beginning 4Q14 reflect Van Wagner billboard and transit assets acquired on October 1, 2014; 2) AFFO and AFFO/share presented on a REIT-comparable basis, per adjusted weighted average share for diluted earnings per share; 3) Net of amortization of deferred financing costs and debt discount; 4) Taxes reflect REIT tax adjustment prior to July 17, 2014. See Appendix for Non-GAAP reconciliation.
$0.57 $0.55 $0.58
$0.36
$0.52
$77.7 $75.5 $79.1$49.5
$71.4
2Q14 3Q14 4Q14 1Q15 2Q15
AFFOAFFO/Share
Includes Van Wagner1
13
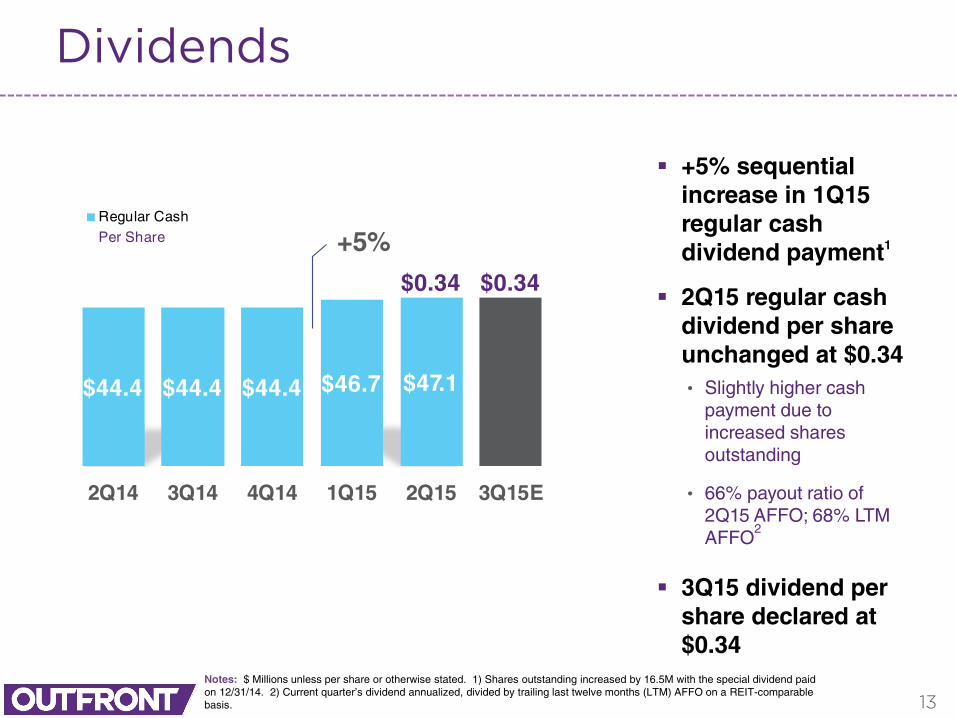
Dividends
+5% sequential increase in 1Q15 regular cash dividend payment1
2Q15 regular cash dividend per share unchanged at $0.34• Slightly higher cash
payment due to increased shares outstanding
• 66% payout ratio of 2Q15 AFFO; 68% LTM AFFO
2
3Q15 dividend per share declared at $0.34
Notes: $ Millions unless per share or otherwise stated. 1) Shares outstanding increased by 16.5M with the special dividend paid on 12/31/14. 2) Current quarter’s dividend annualized, divided by trailing last twelve months (LTM) AFFO on a REIT-comparable basis.
$0.34 $0.34
$44.4 $44.4 $44.4 $46.7 $47.1
2Q14 3Q14 4Q14 1Q15 2Q15 3Q15E
Regular CashPer Share +5%
14
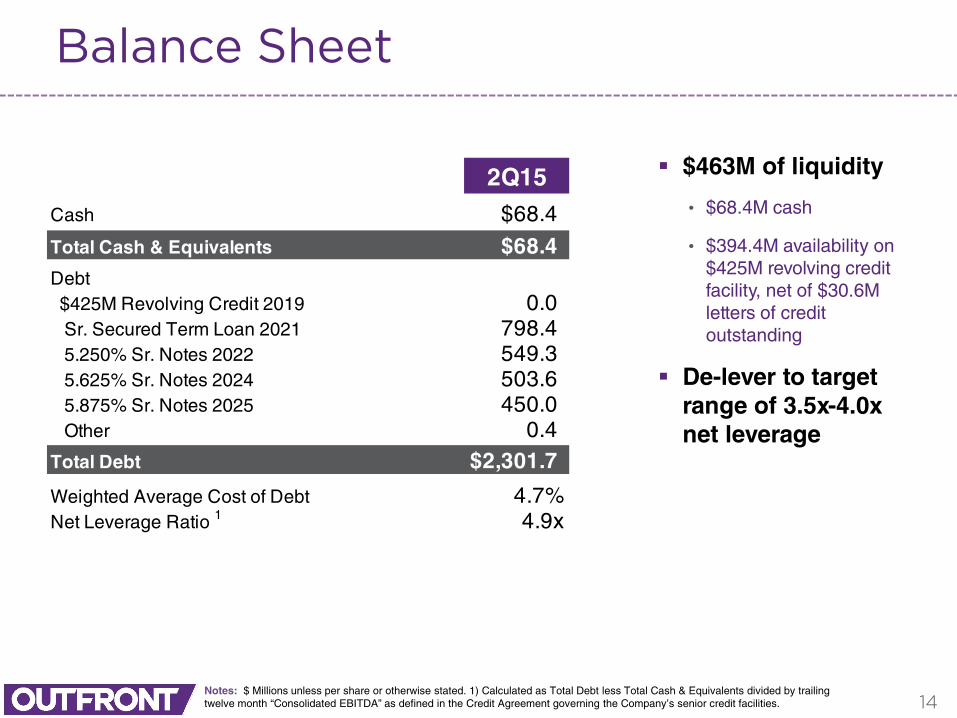
Balance Sheet
$463M of liquidity
• $68.4M cash
• $394.4M availability on $425M revolving credit facility, net of $30.6M letters of credit outstanding
De-lever to target range of 3.5x-4.0x net leverage
Notes: $ Millions unless per share or otherwise stated. 1) Calculated as Total Debt less Total Cash & Equivalents divided by trailing twelve month “Consolidated EBITDA” as defined in the Credit Agreement governing the Company’s senior credit facilities.
2Q15Cash $68.4
Total Cash & Equivalents $68.4Debt $425M Revolving Credit 2019 0.0 Sr. Secured Term Loan 2021 798.4 5.250% Sr. Notes 2022 549.3 5.625% Sr. Notes 2024 503.6 5.875% Sr. Notes 2025 450.0 Other 0.4Total Debt $2,301.7
Weighted Average Cost of Debt 4.7%Net Leverage Ratio 1 4.9x

Jeremy MaleCEO
15
16
Outlook
Q3 2015 revenue growth expectation

Appendix
17
18
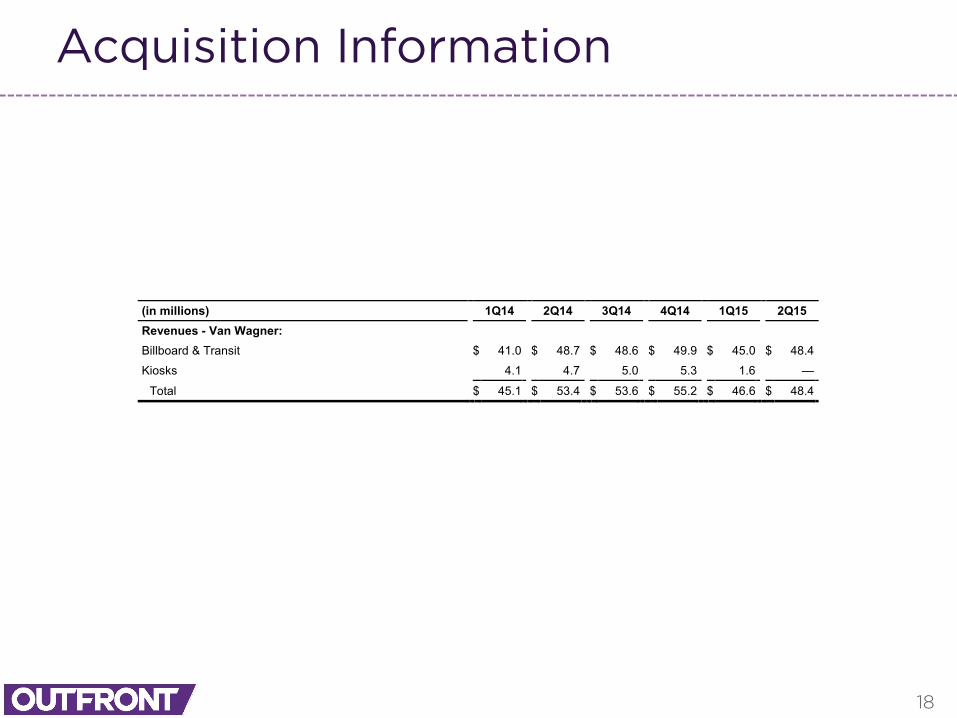
Acquisition Information
(in millions) 1Q14 2Q14 3Q14 4Q14 1Q15 2Q15 Revenues - Van Wagner: Billboard & Transit $ 41.0 $ 48.7 $ 48.6 $ 49.9 $ 45.0 $ 48.4
Kiosks 4.1 4.7 5.0 5.3 1.6 —
Total $ 45.1 $ 53.4 $ 53.6 $ 55.2 $ 46.6 $ 48.4
19
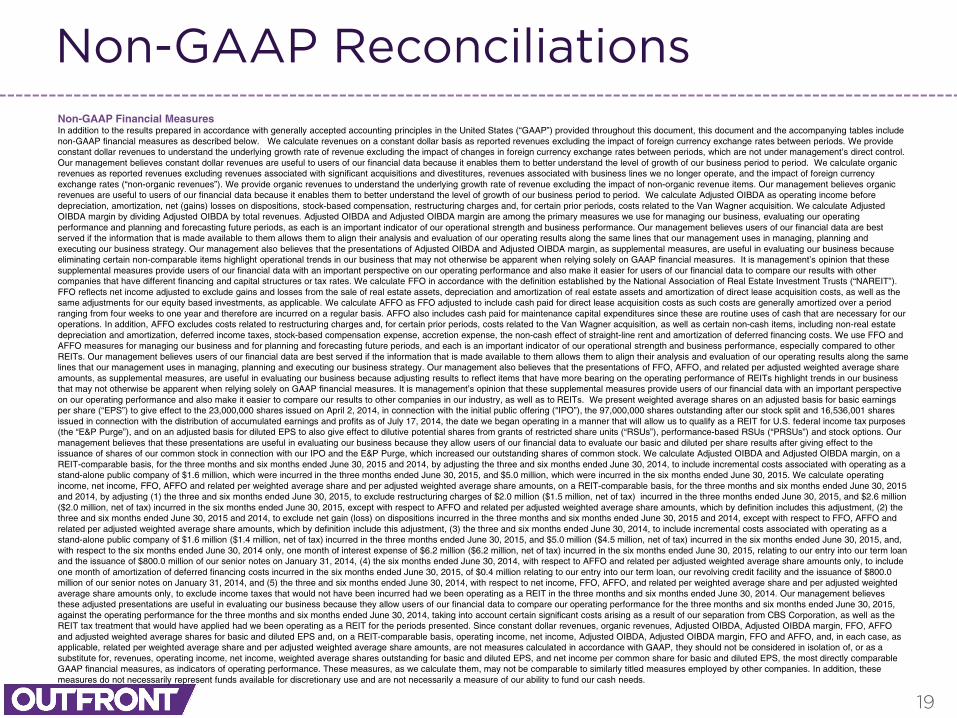
Non-GAAP ReconciliationsNon-GAAP Financial MeasuresIn addition to the results prepared in accordance with generally accepted accounting principles in the United States (“GAAP”) provided throughout this document, this document and the accompanying tables include non-GAAP financial measures as described below. We calculate revenues on a constant dollar basis as reported revenues excluding the impact of foreign currency exchange rates between periods. We provide constant dollar revenues to understand the underlying growth rate of revenue excluding the impact of changes in foreign currency exchange rates between periods, which are not under management’s direct control. Our management believes constant dollar revenues are useful to users of our financial data because it enables them to better understand the level of growth of our business period to period. We calculate organic revenues as reported revenues excluding revenues associated with significant acquisitions and divestitures, revenues associated with business lines we no longer operate, and the impact of foreign currency exchange rates (“non-organic revenues”). We provide organic revenues to understand the underlying growth rate of revenue excluding the impact of non-organic revenue items. Our management believes organic revenues are useful to users of our financial data because it enables them to better understand the level of growth of our business period to period. We calculate Adjusted OIBDA as operating income before depreciation, amortization, net (gains) losses on dispositions, stock-based compensation, restructuring charges and, for certain prior periods, costs related to the Van Wagner acquisition. We calculate Adjusted OIBDA margin by dividing Adjusted OIBDA by total revenues. Adjusted OIBDA and Adjusted OIBDA margin are among the primary measures we use for managing our business, evaluating our operating performance and planning and forecasting future periods, as each is an important indicator of our operational strength and business performance. Our management believes users of our financial data are best served if the information that is made available to them allows them to align their analysis and evaluation of our operating results along the same lines that our management uses in managing, planning and executing our business strategy. Our management also believes that the presentations of Adjusted OIBDA and Adjusted OIBDA margin, as supplemental measures, are useful in evaluating our business because eliminating certain non-comparable items highlight operational trends in our business that may not otherwise be apparent when relying solely on GAAP financial measures. It is management’s opinion that these supplemental measures provide users of our financial data with an important perspective on our operating performance and also make it easier for users of our financial data to compare our results with other companies that have different financing and capital structures or tax rates. We calculate FFO in accordance with the definition established by the National Association of Real Estate Investment Trusts (“NAREIT”). FFO reflects net income adjusted to exclude gains and losses from the sale of real estate assets, depreciation and amortization of real estate assets and amortization of direct lease acquisition costs, as well as the same adjustments for our equity based investments, as applicable. We calculate AFFO as FFO adjusted to include cash paid for direct lease acquisition costs as such costs are generally amortized over a period ranging from four weeks to one year and therefore are incurred on a regular basis. AFFO also includes cash paid for maintenance capital expenditures since these are routine uses of cash that are necessary for our operations. In addition, AFFO excludes costs related to restructuring charges and, for certain prior periods, costs related to the Van Wagner acquisition, as well as certain non-cash items, including non-real estate depreciation and amortization, deferred income taxes, stock-based compensation expense, accretion expense, the non-cash effect of straight-line rent and amortization of deferred financing costs. We use FFO and AFFO measures for managing our business and for planning and forecasting future periods, and each is an important indicator of our operational strength and business performance, especially compared to other REITs. Our management believes users of our financial data are best served if the information that is made available to them allows them to align their analysis and evaluation of our operating results along the same lines that our management uses in managing, planning and executing our business strategy. Our management also believes that the presentations of FFO, AFFO, and related per adjusted weighted average share amounts, as supplemental measures, are useful in evaluating our business because adjusting results to reflect items that have more bearing on the operating performance of REITs highlight trends in our business that may not otherwise be apparent when relying solely on GAAP financial measures. It is management’s opinion that these supplemental measures provide users of our financial data with an important perspective on our operating performance and also make it easier to compare our results to other companies in our industry, as well as to REITs. We present weighted average shares on an adjusted basis for basic earnings per share (“EPS”) to give effect to the 23,000,000 shares issued on April 2, 2014, in connection with the initial public offering ("IPO”), the 97,000,000 shares outstanding after our stock split and 16,536,001 shares issued in connection with the distribution of accumulated earnings and profits as of July 17, 2014, the date we began operating in a manner that will allow us to qualify as a REIT for U.S. federal income tax purposes (the “E&P Purge”), and on an adjusted basis for diluted EPS to also give effect to dilutive potential shares from grants of restricted share units (“RSUs”), performance-based RSUs (“PRSUs”) and stock options. Our management believes that these presentations are useful in evaluating our business because they allow users of our financial data to evaluate our basic and diluted per share results after giving effect to the issuance of shares of our common stock in connection with our IPO and the E&P Purge, which increased our outstanding shares of common stock. We calculate Adjusted OIBDA and Adjusted OIBDA margin, on a REIT-comparable basis, for the three months and six months ended June 30, 2015 and 2014, by adjusting the three and six months ended June 30, 2014, to include incremental costs associated with operating as a stand-alone public company of $1.6 million, which were incurred in the three months ended June 30, 2015, and $5.0 million, which were incurred in the six months ended June 30, 2015. We calculate operating income, net income, FFO, AFFO and related per weighted average share and per adjusted weighted average share amounts, on a REIT-comparable basis, for the three months and six months ended June 30, 2015 and 2014, by adjusting (1) the three and six months ended June 30, 2015, to exclude restructuring charges of $2.0 million ($1.5 million, net of tax) incurred in the three months ended June 30, 2015, and $2.6 million ($2.0 million, net of tax) incurred in the six months ended June 30, 2015, except with respect to AFFO and related per adjusted weighted average share amounts, which by definition includes this adjustment, (2) the three and six months ended June 30, 2015 and 2014, to exclude net gain (loss) on dispositions incurred in the three months and six months ended June 30, 2015 and 2014, except with respect to FFO, AFFO and related per adjusted weighted average share amounts, which by definition include this adjustment, (3) the three and six months ended June 30, 2014, to include incremental costs associated with operating as a stand-alone public company of $1.6 million ($1.4 million, net of tax) incurred in the three months ended June 30, 2015, and $5.0 million ($4.5 million, net of tax) incurred in the six months ended June 30, 2015, and, with respect to the six months ended June 30, 2014 only, one month of interest expense of $6.2 million ($6.2 million, net of tax) incurred in the six months ended June 30, 2015, relating to our entry into our term loan and the issuance of $800.0 million of our senior notes on January 31, 2014, (4) the six months ended June 30, 2014, with respect to AFFO and related per adjusted weighted average share amounts only, to include one month of amortization of deferred financing costs incurred in the six months ended June 30, 2015, of $0.4 million relating to our entry into our term loan, our revolving credit facility and the issuance of $800.0 million of our senior notes on January 31, 2014, and (5) the three and six months ended June 30, 2014, with respect to net income, FFO, AFFO, and related per weighted average share and per adjusted weighted average share amounts only, to exclude income taxes that would not have been incurred had we been operating as a REIT in the three months and six months ended June 30, 2014. Our management believes these adjusted presentations are useful in evaluating our business because they allow users of our financial data to compare our operating performance for the three months and six months ended June 30, 2015, against the operating performance for the three months and six months ended June 30, 2014, taking into account certain significant costs arising as a result of our separation from CBS Corporation, as well as the REIT tax treatment that would have applied had we been operating as a REIT for the periods presented. Since constant dollar revenues, organic revenues, Adjusted OIBDA, Adjusted OIBDA margin, FFO, AFFO and adjusted weighted average shares for basic and diluted EPS and, on a REIT-comparable basis, operating income, net income, Adjusted OIBDA, Adjusted OIBDA margin, FFO and AFFO, and, in each case, as applicable, related per weighted average share and per adjusted weighted average share amounts, are not measures calculated in accordance with GAAP, they should not be considered in isolation of, or as a substitute for, revenues, operating income, net income, weighted average shares outstanding for basic and diluted EPS, and net income per common share for basic and diluted EPS, the most directly comparable GAAP financial measures, as indicators of operating performance. These measures, as we calculate them, may not be comparable to similarly titled measures employed by other companies. In addition, these measures do not necessarily represent funds available for discretionary use and are not necessarily a measure of our ability to fund our cash needs.
20
Non-GAAP Reconciliations
Notes: See Notes on Page 28
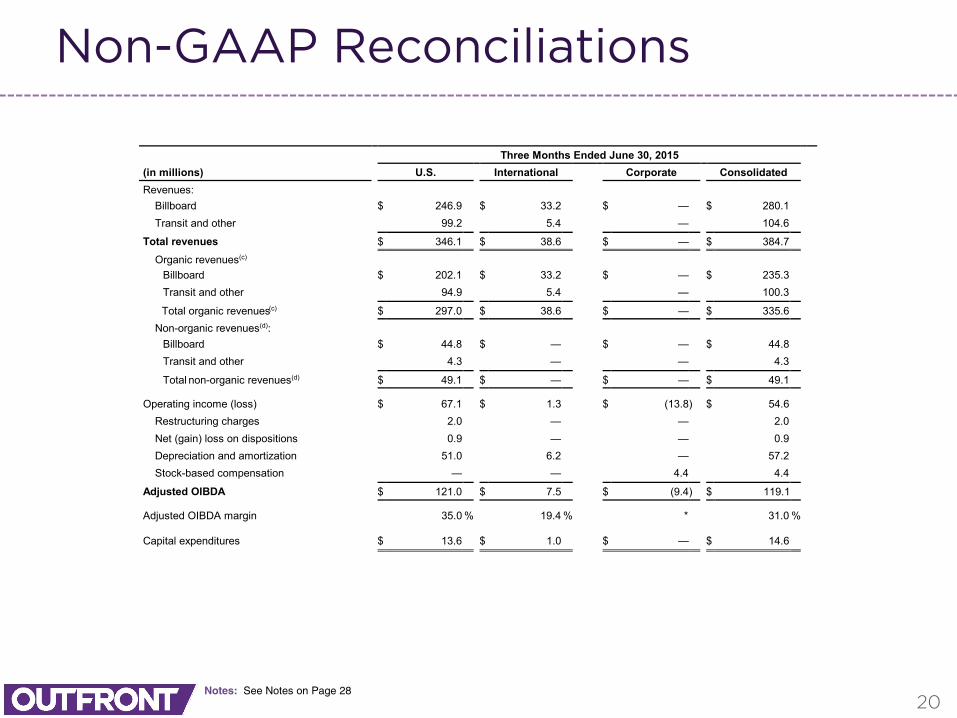
Three Months Ended June 30, 2015 (in millions) U.S. International Corporate Consolidated Revenues:
Billboard $ 246.9 $ 33.2 $ — $ 280.1 Transit and other 99.2 5.4 — 104.6
Total revenues $ 346.1 $ 38.6 $ — $ 384.7 Organic revenues(c)
Billboard $ 202.1 $ 33.2 $ — $ 235.3 Transit and other 94.9 5.4 — 100.3
Total organic revenues(c) $ 297.0 $ 38.6 $ — $ 335.6 Non-organic revenues(d):
Billboard $ 44.8 $ — $ — $ 44.8 Transit and other 4.3 — — 4.3 Total non-organic revenues(d) $ 49.1 $ — $ — $ 49.1
Operating income (loss) $ 67.1 $ 1.3 $ (13.8 ) $ 54.6 Restructuring charges 2.0 — — 2.0 Net (gain) loss on dispositions 0.9 — — 0.9 Depreciation and amortization 51.0 6.2 — 57.2 Stock-based compensation — — 4.4 4.4
Adjusted OIBDA $ 121.0 $ 7.5 $ (9.4 ) $ 119.1 Adjusted OIBDA margin 35.0 % 19.4 % * 31.0 % Capital expenditures $ 13.6 $ 1.0 $ — $ 14.6
21
Non-GAAP Reconciliations
Notes: See Notes on Page 28
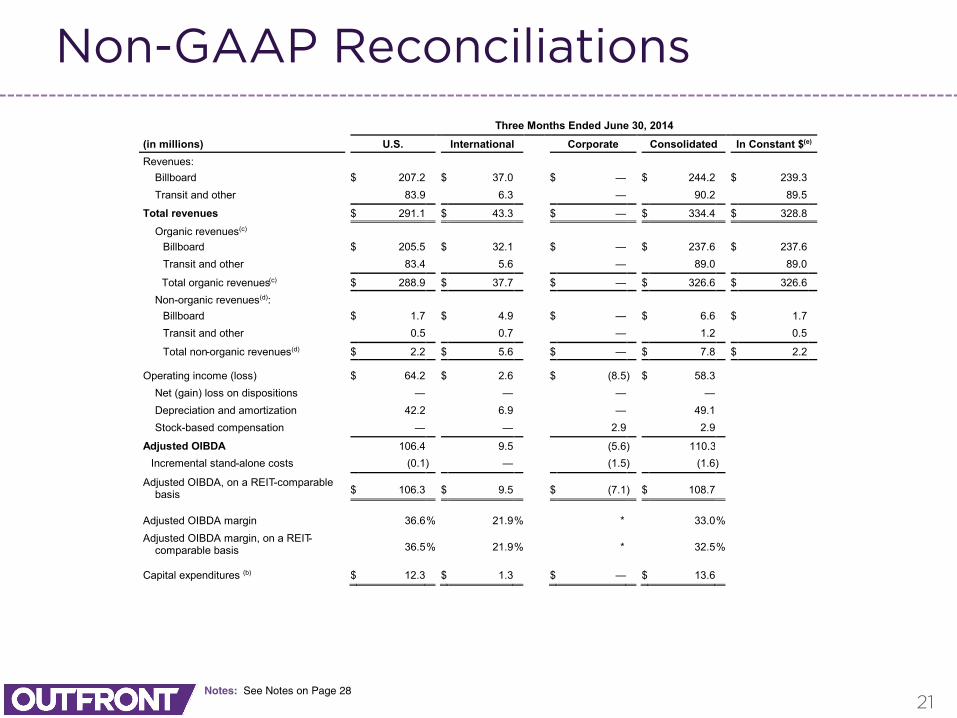
Three Months Ended June 30, 2014
(in millions) U.S. International Corporate Consolidated In Constant $(e) Revenues:
Billboard $ 207.2 $ 37.0 $ — $ 244.2 $ 239.3 Transit and other 83.9 6.3 — 90.2 89.5
Total revenues $ 291.1 $ 43.3 $ — $ 334.4 $ 328.8 Organic revenues(c)
Billboard $ 205.5 $ 32.1 $ — $ 237.6 $ 237.6 Transit and other 83.4 5.6 — 89.0 89.0
Total organic revenues(c) $ 288.9 $ 37.7 $ — $ 326.6 $ 326.6 Non-organic revenues(d):
Billboard $ 1.7 $ 4.9 $ — $ 6.6 $ 1.7 Transit and other 0.5 0.7 — 1.2 0.5 Total non-organic revenues(d) $ 2.2 $ 5.6 $ — $ 7.8 $ 2.2
Operating income (loss) $ 64.2 $ 2.6 $ (8.5 ) $ 58.3 Net (gain) loss on dispositions — — — — Depreciation and amortization 42.2 6.9 — 49.1 Stock-based compensation — — 2.9 2.9
Adjusted OIBDA 106.4 9.5 (5.6 ) 110.3 Incremental stand-alone costs (0.1 ) — (1.5 ) (1.6 )
Adjusted OIBDA, on a REIT-comparable basis $ 106.3
$ 9.5 $ (7.1 ) $ 108.7
Adjusted OIBDA margin 36.6 % 21.9 % * 33.0 % Adjusted OIBDA margin, on a REIT-
comparable basis 36.5 % 21.9 % * 32.5 % Capital expenditures (b) $ 12.3 $ 1.3 $ — $ 13.6
22
Non-GAAP Reconciliations
Notes: See Notes on Page 28
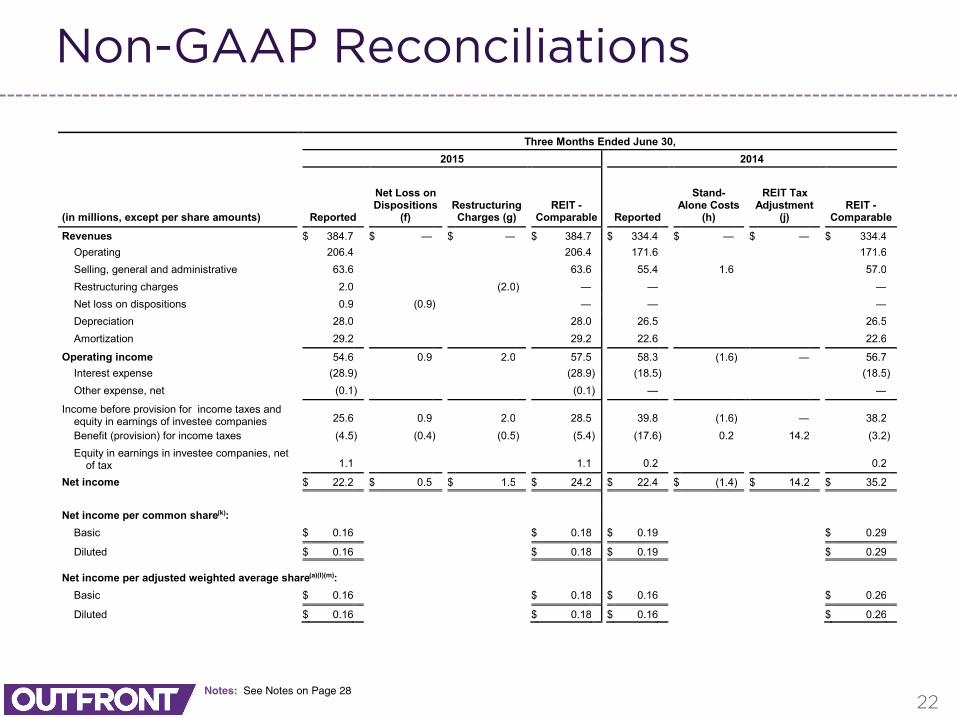
Three Months Ended June 30,
2015 2014
(in millions, except per share amounts) Reported
Net Loss on Dispositions
(f) Restructuring Charges (g)
REIT -Comparable Reported
Stand-Alone Costs
(h)
REIT Tax Adjustment
(j) REIT -
Comparable
Revenues $ 384.7 $ — $ — $ 384.7 $ 334.4 $ — $ — $ 334.4 Operating 206.4 206.4 171.6 171.6 Selling, general and administrative 63.6 63.6 55.4 1.6 57.0 Restructuring charges 2.0 (2.0 ) — — — Net loss on dispositions 0.9 (0.9 ) — — — Depreciation 28.0 28.0 26.5 26.5 Amortization 29.2 29.2 22.6 22.6
Operating income 54.6 0.9 2.0 57.5 58.3 (1.6 ) — 56.7 Interest expense (28.9 ) (28.9 ) (18.5 ) (18.5 ) Other expense, net (0.1 ) (0.1 ) — —
Income before provision for income taxes and equity in earnings of investee companies 25.6
0.9
2.0
28.5
39.8
(1.6 ) —
38.2
Benefit (provision) for income taxes (4.5 ) (0.4 ) (0.5 ) (5.4 ) (17.6 ) 0.2 14.2 (3.2 ) Equity in earnings in investee companies, net
of tax 1.1
1.1
0.2
0.2
Net income $ 22.2 $ 0.5 $ 1.5 $ 24.2 $ 22.4 $ (1.4 ) $ 14.2 $ 35.2 Net income per common share(k):
Basic $ 0.16 $ 0.18 $ 0.19 $ 0.29 Diluted $ 0.16 $ 0.18 $ 0.19 $ 0.29
Net income per adjusted weighted average share(a)(l)(m): Basic $ 0.16 $ 0.18 $ 0.16 $ 0.26 Diluted $ 0.16 $ 0.18 $ 0.16 $ 0.26
23
Non-GAAP Reconciliations
Notes: See Notes on Page 28
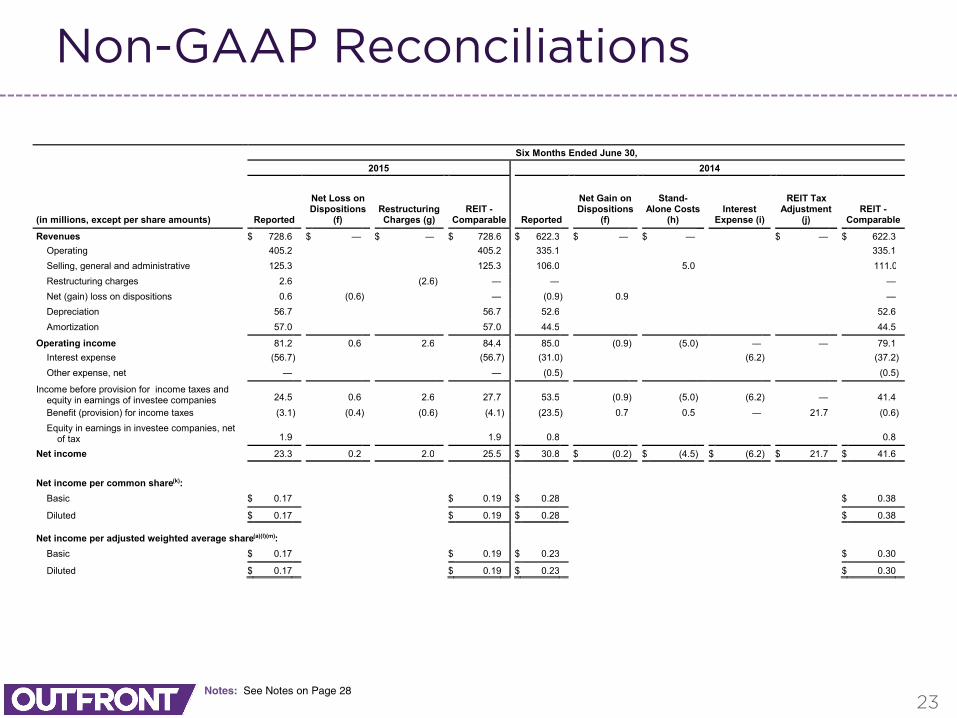
Six Months Ended June 30,
2015 2014
(in millions, except per share amounts) Reported
Net Loss on Dispositions
(f) Restructuring Charges (g)
REIT -Comparable Reported
Net Gain on Dispositions
(f)
Stand-Alone Costs
(h) Interest
Expense (i)
REIT Tax Adjustment
(j) REIT -
Comparable
Revenues $ 728.6 $ — $ — $ 728.6 $ 622.3 $ — $ — $ — $ 622.3 Operating 405.2 405.2 335.1 335.1 Selling, general and administrative 125.3 125.3 106.0 5.0 111.0 Restructuring charges 2.6 (2.6 ) — — — Net (gain) loss on dispositions 0.6 (0.6 ) — (0.9 ) 0.9 — Depreciation 56.7 56.7 52.6 52.6 Amortization 57.0 57.0 44.5 44.5
Operating income 81.2 0.6 2.6 84.4 85.0 (0.9 ) (5.0 ) — — 79.1 Interest expense (56.7 ) (56.7 ) (31.0 ) (6.2 ) (37.2 ) Other expense, net — — (0.5 ) (0.5 )
Income before provision for income taxes and equity in earnings of investee companies 24.5
0.6
2.6
27.7
53.5
(0.9 ) (5.0 ) (6.2 ) —
41.4
Benefit (provision) for income taxes (3.1 ) (0.4 ) (0.6 ) (4.1 ) (23.5 ) 0.7 0.5 — 21.7 (0.6 ) Equity in earnings in investee companies, net
of tax 1.9
1.9
0.8
0.8
Net income 23.3 0.2 2.0 25.5 $ 30.8 $ (0.2 ) $ (4.5 ) $ (6.2 ) $ 21.7 $ 41.6 Net income per common share(k):
Basic $ 0.17 $ 0.19 $ 0.28 $ 0.38 Diluted $ 0.17 $ 0.19 $ 0.28 $ 0.38
Net income per adjusted weighted average share(a)(l)(m): Basic $ 0.17 $ 0.19 $ 0.23 $ 0.30 Diluted $ 0.17 $ 0.19 $ 0.23 $ 0.30
24
Non-GAAP Reconciliations
Notes: See Notes on Page 28
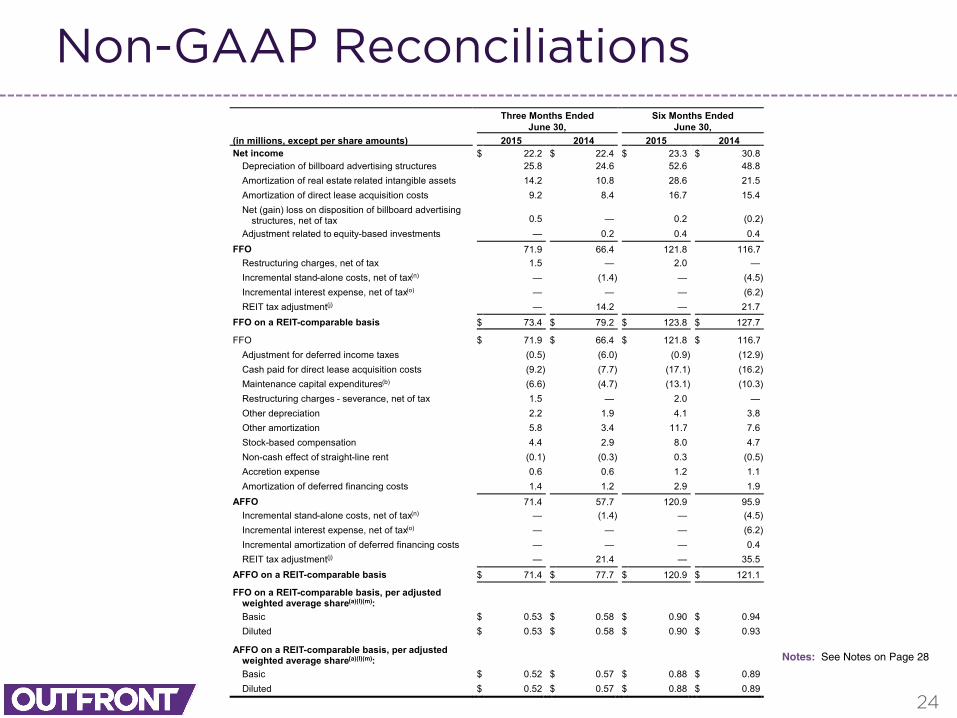
Three Months Ended Six Months Ended June 30, June 30, (in millions, except per share amounts) 2015 2014 2015 2014 Net income $ 22.2 $ 22.4 $ 23.3 $ 30.8
Depreciation of billboard advertising structures 25.8 24.6 52.6 48.8 Amortization of real estate related intangible assets 14.2 10.8 28.6 21.5 Amortization of direct lease acquisition costs 9.2 8.4 16.7 15.4 Net (gain) loss on disposition of billboard advertising
structures, net of tax 0.5 —
0.2
(0.2 )
Adjustment related to equity-based investments — 0.2 0.4 0.4 FFO 71.9 66.4 121.8 116.7
Restructuring charges, net of tax 1.5 — 2.0 — Incremental stand-alone costs, net of tax(n) — (1.4 ) — (4.5 ) Incremental interest expense, net of tax(o) — — — (6.2 ) REIT tax adjustment(j) — 14.2 — 21.7
FFO on a REIT-comparable basis $ 73.4 $ 79.2 $ 123.8 $ 127.7 FFO $ 71.9 $ 66.4 $ 121.8 $ 116.7
Adjustment for deferred income taxes (0.5 ) (6.0 ) (0.9 ) (12.9 ) Cash paid for direct lease acquisition costs (9.2 ) (7.7 ) (17.1 ) (16.2 ) Maintenance capital expenditures(b) (6.6 ) (4.7 ) (13.1 ) (10.3 ) Restructuring charges - severance, net of tax 1.5 — 2.0 — Other depreciation 2.2 1.9 4.1 3.8 Other amortization 5.8 3.4 11.7 7.6 Stock-based compensation 4.4 2.9 8.0 4.7 Non-cash effect of straight-line rent (0.1 ) (0.3 ) 0.3 (0.5 ) Accretion expense 0.6 0.6 1.2 1.1 Amortization of deferred financing costs 1.4 1.2 2.9 1.9
AFFO 71.4 57.7 120.9 95.9 Incremental stand-alone costs, net of tax(n) — (1.4 ) — (4.5 ) Incremental interest expense, net of tax(o) — — — (6.2 ) Incremental amortization of deferred financing costs — — — 0.4 REIT tax adjustment(j) — 21.4 — 35.5
AFFO on a REIT-comparable basis $ 71.4 $ 77.7 $ 120.9 $ 121.1 FFO on a REIT-comparable basis, per adjusted
weighted average share(a)(l)(m): Basic $ 0.53 $ 0.58 $ 0.90 $ 0.94 Diluted $ 0.53 $ 0.58 $ 0.90 $ 0.93
AFFO on a REIT-comparable basis, per adjusted weighted average share(a)(l)(m): Basic $ 0.52 $ 0.57 $ 0.88 $ 0.89 Diluted $ 0.52 $ 0.57 $ 0.88 $ 0.89
25
Non-GAAP Reconciliations
Notes: See Notes on Page 28
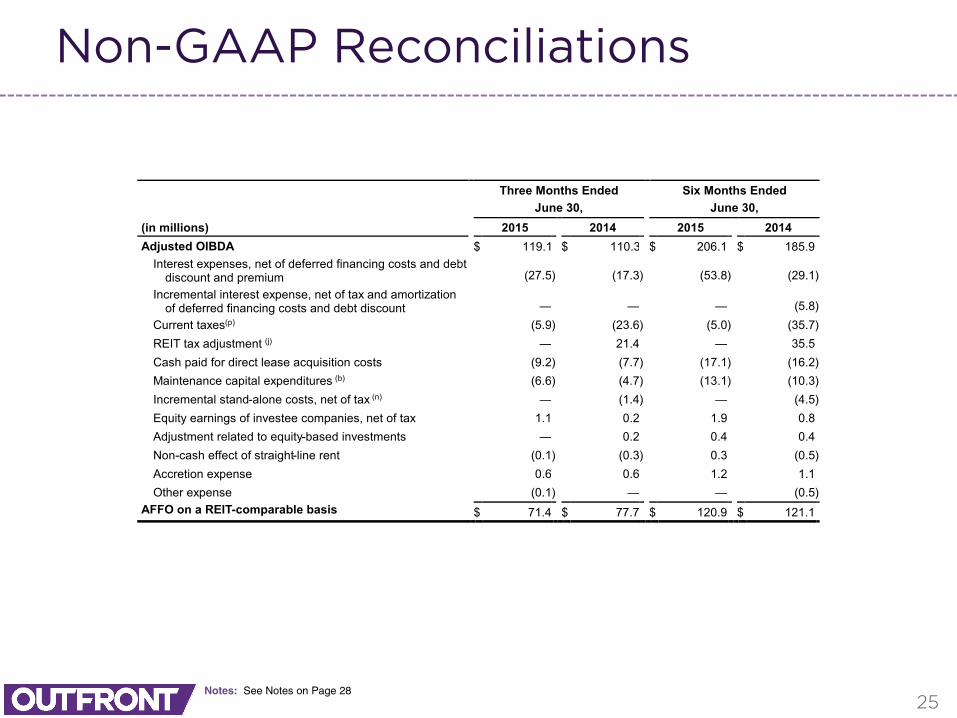
Three Months Ended Six Months Ended June 30, June 30, (in millions) 2015 2014 2015 2014 Adjusted OIBDA $ 119.1 $ 110.3 $ 206.1 $ 185.9
Interest expenses, net of deferred financing costs and debt discount and premium (27.5 ) (17.3 ) (53.8 ) (29.1 )
Incremental interest expense, net of tax and amortization of deferred financing costs and debt discount —
—
—
(5.8 )
Current taxes(p) (5.9 ) (23.6 ) (5.0 ) (35.7 ) REIT tax adjustment (j) — 21.4 — 35.5 Cash paid for direct lease acquisition costs (9.2 ) (7.7 ) (17.1 ) (16.2 ) Maintenance capital expenditures (b) (6.6 ) (4.7 ) (13.1 ) (10.3 ) Incremental stand-alone costs, net of tax (n) — (1.4 ) — (4.5 ) Equity earnings of investee companies, net of tax 1.1 0.2 1.9 0.8 Adjustment related to equity-based investments — 0.2 0.4 0.4 Non-cash effect of straight-line rent (0.1 ) (0.3 ) 0.3 (0.5 ) Accretion expense 0.6 0.6 1.2 1.1 Other expense (0.1 ) — — (0.5 )
AFFO on a REIT-comparable basis
$ 71.4 $ 77.7 $ 120.9 $ 121.1
26
Non-GAAP Reconciliations
Notes: See Notes on Page 28
Three Months Ended
(in millions) June 30,
2014 September 30,
2014 December 31,
2014 March 31,
2015 June 30,
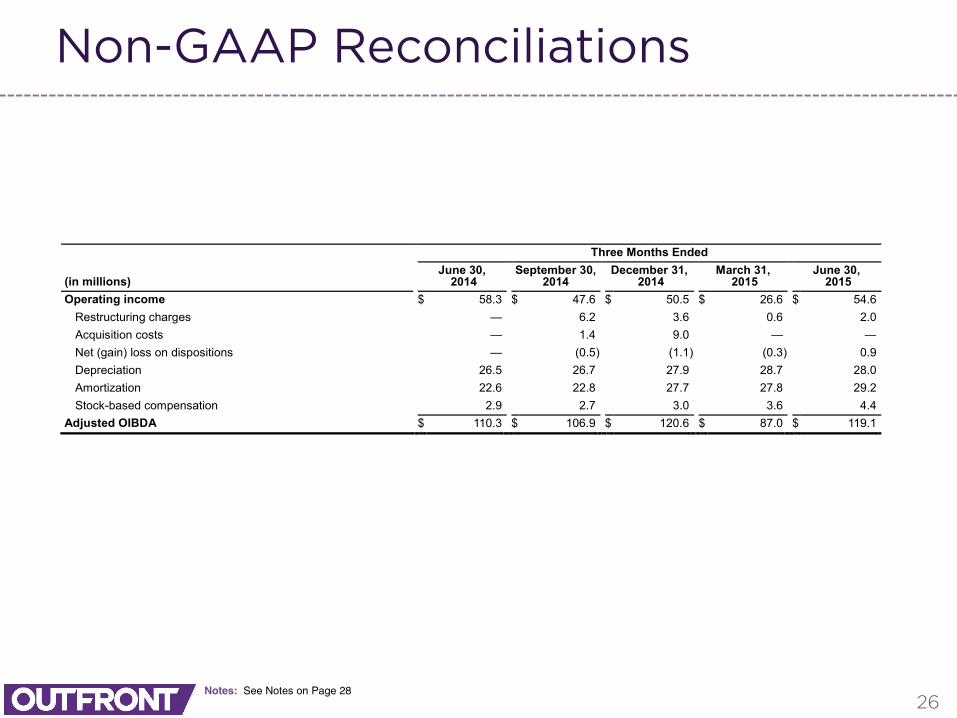
2015 Operating income $ 58.3 $ 47.6 $ 50.5 $ 26.6 $ 54.6
Restructuring charges — 6.2 3.6 0.6 2.0
Acquisition costs — 1.4 9.0 — —
Net (gain) loss on dispositions — (0.5 ) (1.1 ) (0.3 ) 0.9
Depreciation 26.5 26.7 27.9 28.7 28.0
Amortization 22.6 22.8 27.7 27.8 29.2
Stock-based compensation 2.9 2.7 3.0 3.6 4.4
Adjusted OIBDA $ 110.3 $ 106.9 $ 120.6 $ 87.0 $ 119.1
27
Non-GAAP Reconciliations
Notes: See Notes on Page 28
Three Months Ended
(in millions, except per share amounts) June 30,
2014 September 30,
2014 December 31,
2014 March 31,
2015 June 30,
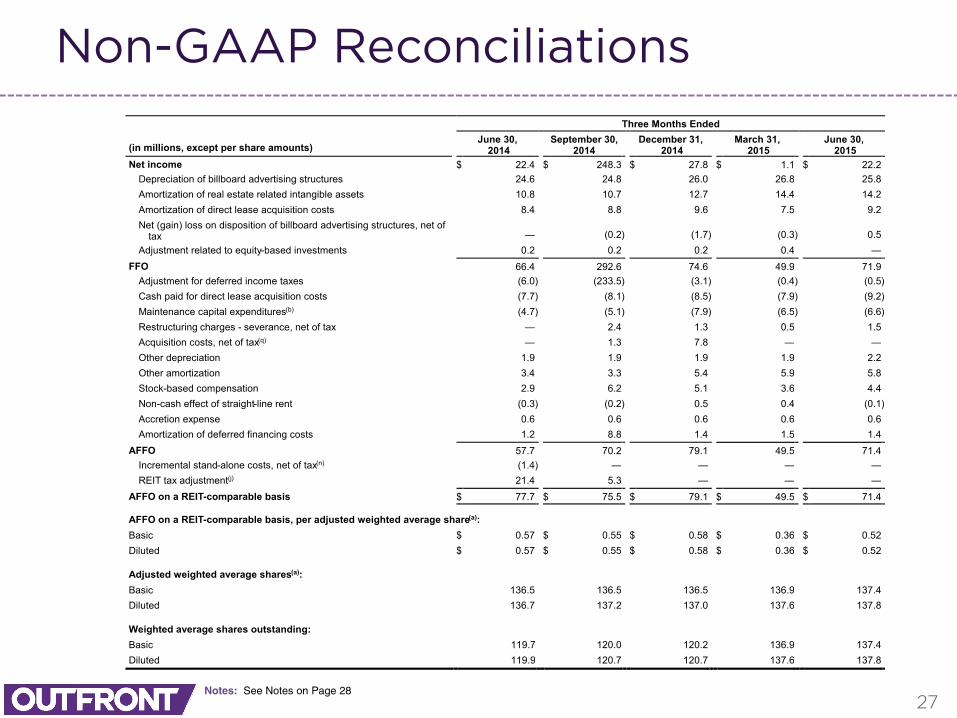
2015 Net income $ 22.4 $ 248.3 $ 27.8 $ 1.1 $ 22.2
Depreciation of billboard advertising structures 24.6 24.8 26.0 26.8 25.8 Amortization of real estate related intangible assets 10.8 10.7 12.7 14.4 14.2 Amortization of direct lease acquisition costs 8.4 8.8 9.6 7.5 9.2 Net (gain) loss on disposition of billboard advertising structures, net of
tax — (0.2 ) (1.7 ) (0.3 ) 0.5
Adjustment related to equity-based investments 0.2 0.2 0.2 0.4 — FFO 66.4 292.6 74.6 49.9 71.9
Adjustment for deferred income taxes (6.0 ) (233.5 ) (3.1 ) (0.4 ) (0.5 ) Cash paid for direct lease acquisition costs (7.7 ) (8.1 ) (8.5 ) (7.9 ) (9.2 ) Maintenance capital expenditures(b) (4.7 ) (5.1 ) (7.9 ) (6.5 ) (6.6 ) Restructuring charges - severance, net of tax — 2.4 1.3 0.5 1.5 Acquisition costs, net of tax(q) — 1.3 7.8 — — Other depreciation 1.9 1.9 1.9 1.9 2.2 Other amortization 3.4 3.3 5.4 5.9 5.8 Stock-based compensation 2.9 6.2 5.1 3.6 4.4 Non-cash effect of straight-line rent (0.3 ) (0.2 ) 0.5 0.4 (0.1 ) Accretion expense 0.6 0.6 0.6 0.6 0.6 Amortization of deferred financing costs 1.2 8.8 1.4 1.5 1.4
AFFO 57.7 70.2 79.1 49.5 71.4 Incremental stand-alone costs, net of tax(n) (1.4 ) — — — — REIT tax adjustment(j) 21.4 5.3 — — —
AFFO on a REIT-comparable basis $ 77.7 $ 75.5 $ 79.1 $ 49.5 $ 71.4
AFFO on a REIT-comparable basis, per adjusted weighted average share(a): Basic $ 0.57 $ 0.55 $ 0.58 $ 0.36 $ 0.52 Diluted $ 0.57 $ 0.55 $ 0.58 $ 0.36 $ 0.52 Adjusted weighted average shares(a): Basic 136.5 136.5 136.5 136.9 137.4 Diluted 136.7 137.2 137.0 137.6 137.8 Weighted average shares outstanding: Basic 119.7 120.0 120.2 136.9 137.4 Diluted 119.9 120.7 120.7 137.6 137.8
28
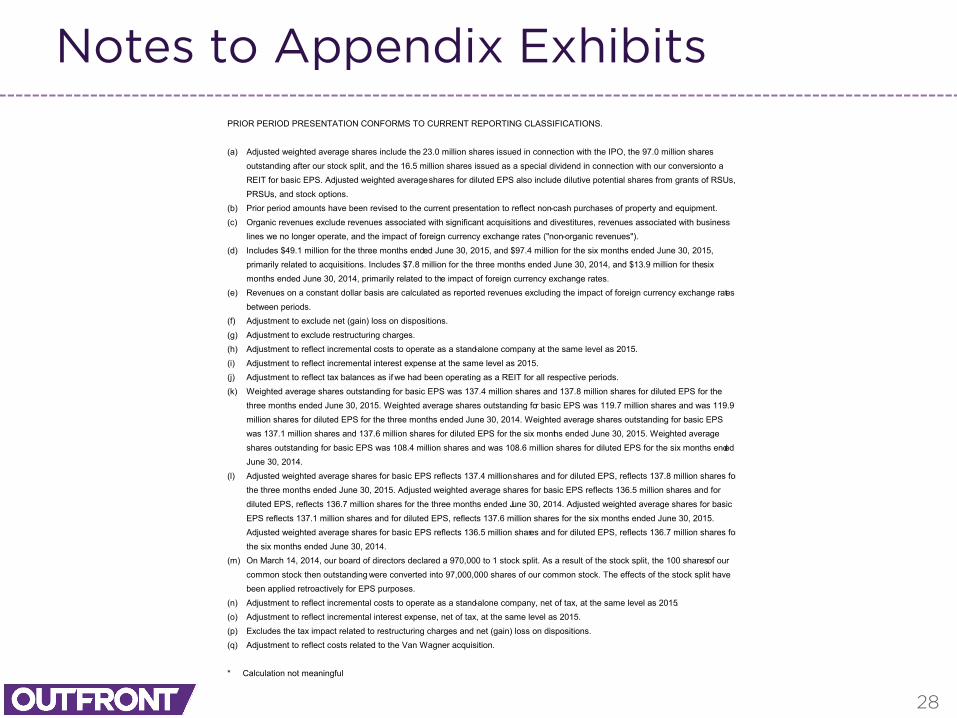
Notes to Appendix ExhibitsPRIOR PERIOD PRESENTATION CONFORMS TO CURRENT REPORTING CLASSIFICATIONS. (a) Adjusted weighted average shares include the 23.0 million shares issued in connection with the IPO, the 97.0 million shares
outstanding after our stock split, and the 16.5 million shares issued as a special dividend in connection with our conversion to a REIT for basic EPS. Adjusted weighted average shares for diluted EPS also include dilutive potential shares from grants of RSUs, PRSUs, and stock options.
(b) Prior period amounts have been revised to the current presentation to reflect non-cash purchases of property and equipment. (c) Organic revenues exclude revenues associated with significant acquisitions and divestitures, revenues associated with business
lines we no longer operate, and the impact of foreign currency exchange rates ("non-organic revenues"). (d) Includes $49.1 million for the three months ended June 30, 2015, and $97.4 million for the six months ended June 30, 2015,
primarily related to acquisitions. Includes $7.8 million for the three months ended June 30, 2014, and $13.9 million for the six months ended June 30, 2014, primarily related to the impact of foreign currency exchange rates.
(e) Revenues on a constant dollar basis are calculated as reported revenues excluding the impact of foreign currency exchange rates between periods.
(f) Adjustment to exclude net (gain) loss on dispositions. (g) Adjustment to exclude restructuring charges. (h) Adjustment to reflect incremental costs to operate as a stand-alone company at the same level as 2015. (i) Adjustment to reflect incremental interest expense at the same level as 2015. (j) Adjustment to reflect tax balances as if we had been operating as a REIT for all respective periods. (k) Weighted average shares outstanding for basic EPS was 137.4 million shares and 137.8 million shares for diluted EPS for the
three months ended June 30, 2015. Weighted average shares outstanding for basic EPS was 119.7 million shares and was 119.9 million shares for diluted EPS for the three months ended June 30, 2014. Weighted average shares outstanding for basic EPS was 137.1 million shares and 137.6 million shares for diluted EPS for the six months ended June 30, 2015. Weighted average shares outstanding for basic EPS was 108.4 million shares and was 108.6 million shares for diluted EPS for the six months ended June 30, 2014.
(l) Adjusted weighted average shares for basic EPS reflects 137.4 million shares and for diluted EPS, reflects 137.8 million shares for the three months ended June 30, 2015. Adjusted weighted average shares for basic EPS reflects 136.5 million shares and for diluted EPS, reflects 136.7 million shares for the three months ended June 30, 2014. Adjusted weighted average shares for basic EPS reflects 137.1 million shares and for diluted EPS, reflects 137.6 million shares for the six months ended June 30, 2015. Adjusted weighted average shares for basic EPS reflects 136.5 million shares and for diluted EPS, reflects 136.7 million shares for the six months ended June 30, 2014.
(m) On March 14, 2014, our board of directors declared a 970,000 to 1 stock split. As a result of the stock split, the 100 shares of our common stock then outstanding were converted into 97,000,000 shares of our common stock. The effects of the stock split have been applied retroactively for EPS purposes.
(n) Adjustment to reflect incremental costs to operate as a stand-alone company, net of tax, at the same level as 2015. (o) Adjustment to reflect incremental interest expense, net of tax, at the same level as 2015. (p) Excludes the tax impact related to restructuring charges and net (gain) loss on dispositions. (q) Adjustment to reflect costs related to the Van Wagner acquisition. * Calculation not meaningful

About OUTFRONT Media Inc.
OUTFRONT Media (NYSE: OUT), formerlyCBS Outdoor, is one of the largest out-of-homemedia companies in the Americas and has amajor presence in top markets throughout theUnited States, Canada, Mexico and SouthAmerica. With billboard and transit properties,a prime asset focus, and a growing network ofdigital displays, OUTFRONT Media givesadvertisers both breadth and depth ofaudience across key geographies, as well asengaging ways to connect with increasinglymobile consumers.