Embed Size (px)
Citation preview

The Venetian Macao Marina Bay Sands, Singapore
Sands Macao Four Seasons Macao Sands Bethlehem The Venetian Las Vegas The Palazzo, Las Vegas
2Q15 Earnings Call PresentationJuly 22, 2015
The Parisian MacaoSands Cotai Central, Macao
This presentation contains forward-looking statements that are made pursuant to the Safe Harbor Provisions of the Private Securities Litigation Reform Act of 1995. Forward-looking statements involve a number of risks, uncertainties or other factors beyond the company’s control, which may cause material differences in actual results, performance or other expectations. These factors include, but are not limited to, general economic conditions, competition, new development, construction and ventures, substantial leverage and debt service, government regulation, tax law changes, legalization of gaming, interest rates, future terrorist acts, influenza, insurance, gaming promoters, risks relating to our gaming licenses, certificate and subconcession, infrastructure in Macao, our ability to meet certain development deadlines, our subsidiaries’ ability to make distribution payments to us, and other factors detailed in the reports filed by Las Vegas Sands Corp. with the Securities and Exchange Commission. Readers are cautioned not to place undue reliance on these forward-looking statements, which speak only as of the date thereof. Las Vegas Sands Corp. assumes no obligation to update such information.
Forward Looking Statements
2
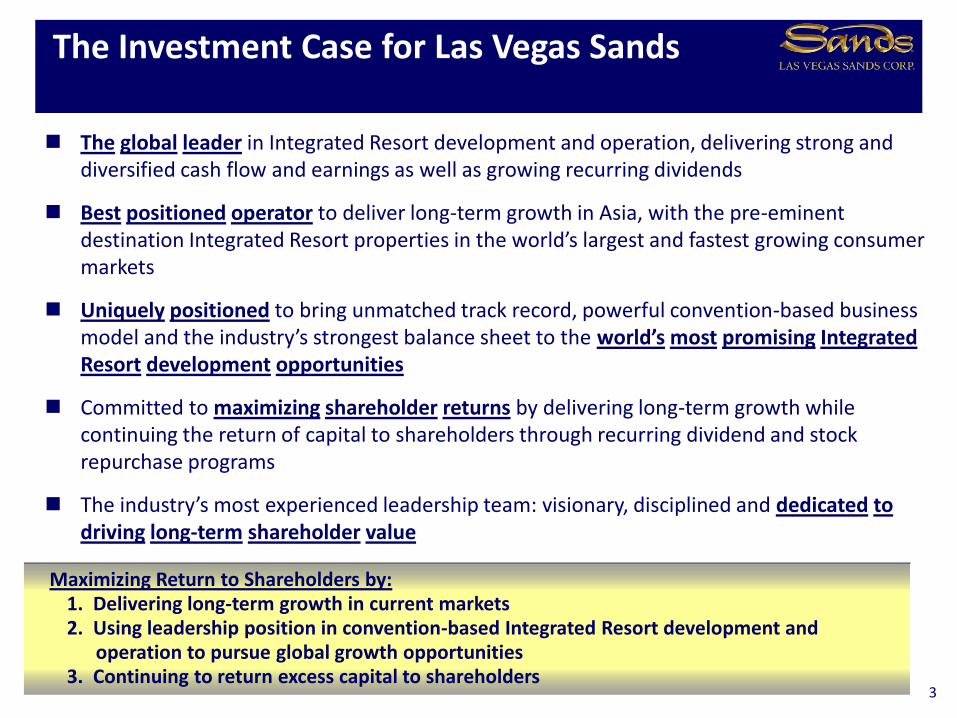
The global leader in Integrated Resort development and operation, delivering strong and diversified cash flow and earnings as well as growing recurring dividends
Best positioned operator to deliver long-term growth in Asia, with the pre-eminent destination Integrated Resort properties in the world’s largest and fastest growing consumer markets
Uniquely positioned to bring unmatched track record, powerful convention-based business model and the industry’s strongest balance sheet to the world’s most promising IntegratedResort development opportunities
Committed to maximizing shareholder returns by delivering long-term growth while continuing the return of capital to shareholders through recurring dividend and stock repurchase programs
The industry’s most experienced leadership team: visionary, disciplined and dedicated todriving long-term shareholder value
The Investment Case for Las Vegas Sands
3
Maximizing Return to Shareholders by:1. Delivering long-term growth in current markets 2. Using leadership position in convention-based Integrated Resort development and
operation to pursue global growth opportunities3. Continuing to return excess capital to shareholders
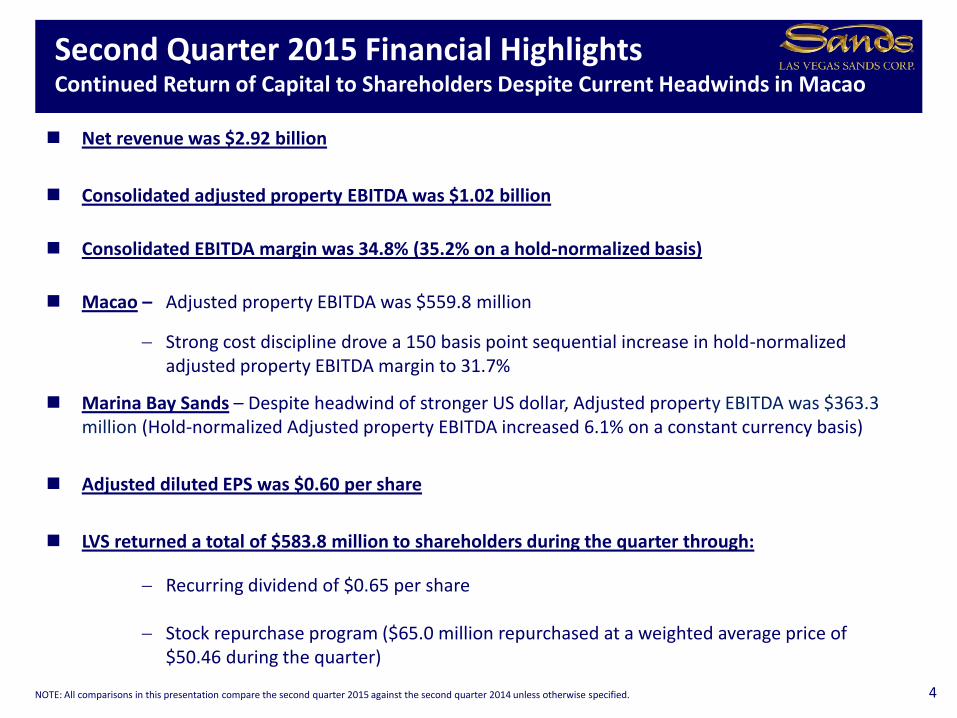
Net revenue was $2.92 billion
Consolidated adjusted property EBITDA was $1.02 billion
Consolidated EBITDA margin was 34.8% (35.2% on a hold-normalized basis)
Macao – Adjusted property EBITDA was $559.8 million
Strong cost discipline drove a 150 basis point sequential increase in hold-normalized adjusted property EBITDA margin to 31.7%
Marina Bay Sands – Despite headwind of stronger US dollar, Adjusted property EBITDA was $363.3 million (Hold-normalized Adjusted property EBITDA increased 6.1% on a constant currency basis)
Adjusted diluted EPS was $0.60 per share
LVS returned a total of $583.8 million to shareholders during the quarter through:
Recurring dividend of $0.65 per share
Stock repurchase program ($65.0 million repurchased at a weighted average price of $50.46 during the quarter)
Second Quarter 2015 Financial HighlightsContinued Return of Capital to Shareholders Despite Current Headwinds in Macao
4NOTE: All comparisons in this presentation compare the second quarter 2015 against the second quarter 2014 unless otherwise specified.
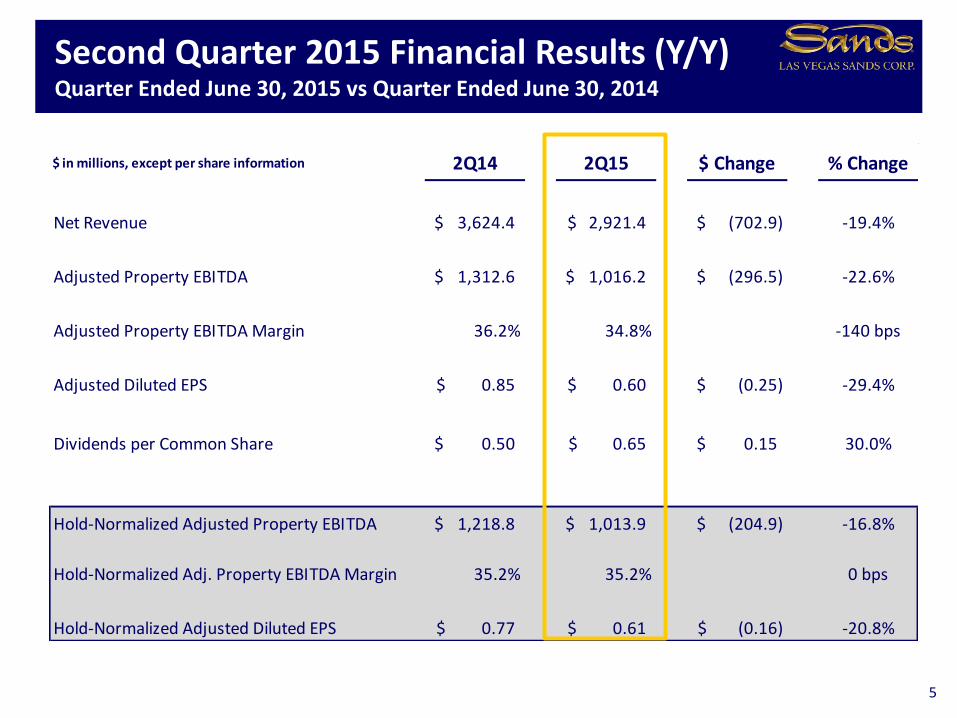
$ in millions, except per share information 2Q14 2Q15 $ Change % Change
Net Revenue 3,624.4$ 2,921.4$ (702.9)$ -19.4%
Adjusted Property EBITDA 1,312.6$ 1,016.2$ (296.5)$ -22.6%
Adjusted Property EBITDA Margin 36.2% 34.8% -140 bps
Adjusted Diluted EPS 0.85$ 0.60$ (0.25)$ -29.4%
Dividends per Common Share 0.50$ 0.65$ 0.15$ 30.0%
Hold-Normalized Adjusted Property EBITDA 1,218.8$ 1,013.9$ (204.9)$ -16.8%
Hold-Normalized Adj. Property EBITDA Margin 35.2% 35.2% 0 bps
Hold-Normalized Adjusted Diluted EPS 0.77$ 0.61$ (0.16)$ -20.8%
Second Quarter 2015 Financial Results (Y/Y)Quarter Ended June 30, 2015 vs Quarter Ended June 30, 2014
5
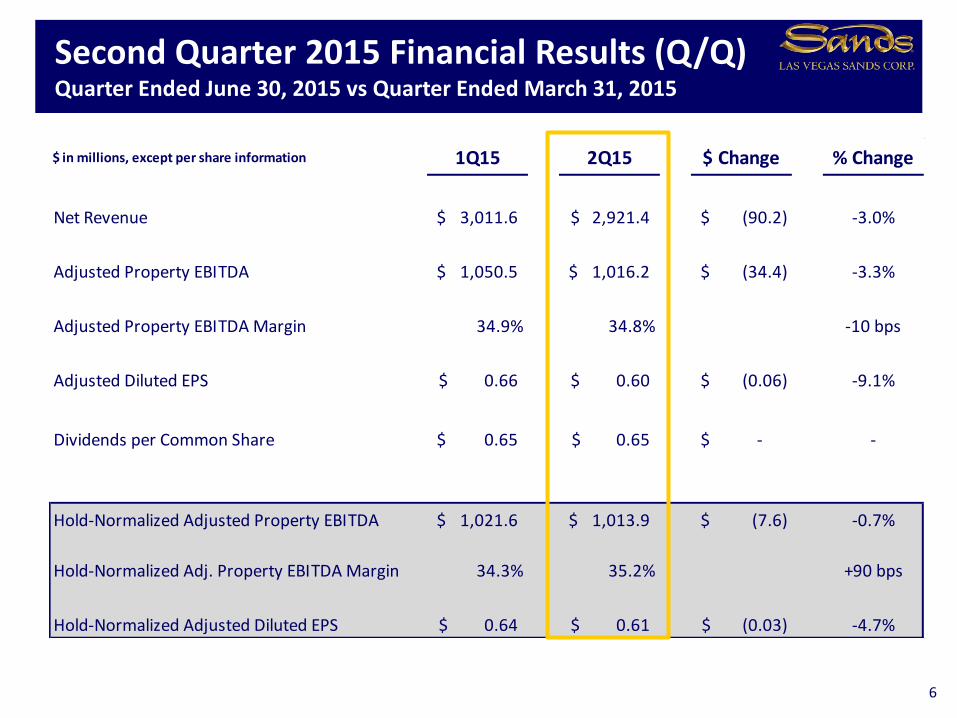
$ in millions, except per share information 1Q15 2Q15 $ Change % Change
Net Revenue 3,011.6$ 2,921.4$ (90.2)$ -3.0%
Adjusted Property EBITDA 1,050.5$ 1,016.2$ (34.4)$ -3.3%
Adjusted Property EBITDA Margin 34.9% 34.8% -10 bps
Adjusted Diluted EPS 0.66$ 0.60$ (0.06)$ -9.1%
Dividends per Common Share 0.65$ 0.65$ -$ -
Hold-Normalized Adjusted Property EBITDA 1,021.6$ 1,013.9$ (7.6)$ -0.7%
Hold-Normalized Adj. Property EBITDA Margin 34.3% 35.2% +90 bps
Hold-Normalized Adjusted Diluted EPS 0.64$ 0.61$ (0.03)$ -4.7%
Second Quarter 2015 Financial Results (Q/Q)Quarter Ended June 30, 2015 vs Quarter Ended March 31, 2015
6
Year Year Year Six Months
Ended Ended Ended Ended
$ in millions 12/31/2012 12/31/2013 12/31/2014 6/30/2015 Total
LVS Dividends Paid1 823$ 1,153$ 1,610$ 1,038$ 4,624$
LVS Special Dividend Paid 2,262 - - - 2,262
LVS Shares Repurchased - 570 1,665 65 2,300
Subtotal LVS 3,085$ 1,723$ 3,275$ 1,103$ 9,186$
SCL Dividends Paid2 357 411 538 308 1,614
SCL Special Dividend Paid - - 239 - 239
Subtotal SCL 357$ 411$ 777$ 308$ 1,853$
Total 3,442$ 2,134$ 4,052$ 1,411$ 11,039$
$1.00
$1.40
$2.00
$2.60
$0.00
$0.50
$1.00
$1.50
$2.00
$2.50
$3.00
2012 2013 2014 2015
7
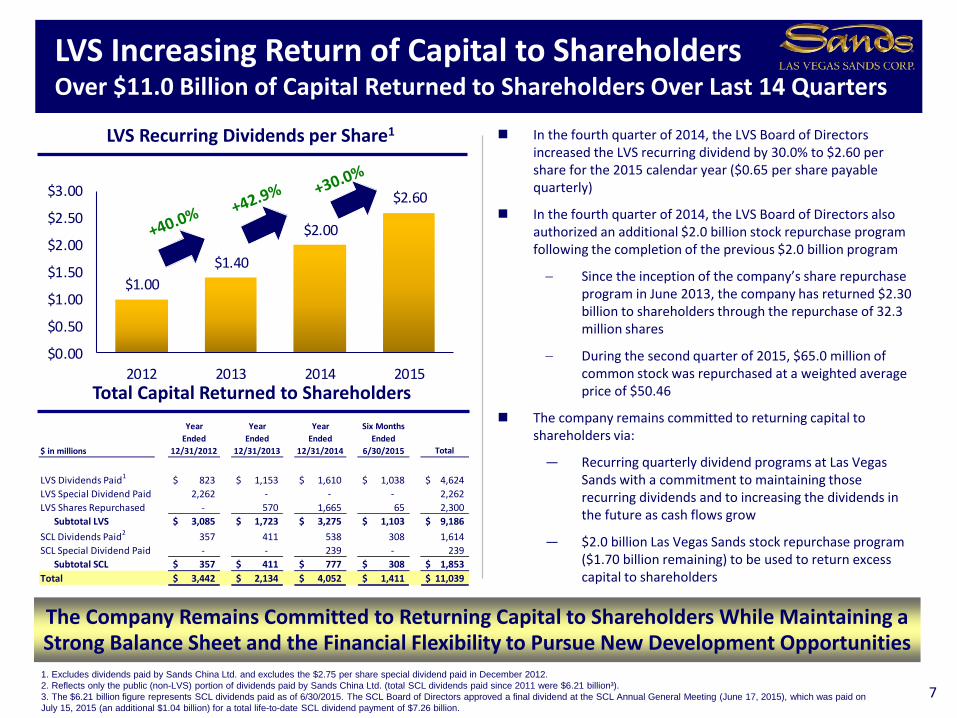
LVS Increasing Return of Capital to ShareholdersOver $11.0 Billion of Capital Returned to Shareholders Over Last 14 Quarters
LVS Recurring Dividends per Share1 In the fourth quarter of 2014, the LVS Board of Directors increased the LVS recurring dividend by 30.0% to $2.60 per share for the 2015 calendar year ($0.65 per share payable quarterly)
In the fourth quarter of 2014, the LVS Board of Directors also authorized an additional $2.0 billion stock repurchase program following the completion of the previous $2.0 billion program
Since the inception of the company’s share repurchase program in June 2013, the company has returned $2.30 billion to shareholders through the repurchase of 32.3 million shares
During the second quarter of 2015, $65.0 million of common stock was repurchased at a weighted average price of $50.46
The company remains committed to returning capital to shareholders via:
— Recurring quarterly dividend programs at Las Vegas Sands with a commitment to maintaining those recurring dividends and to increasing the dividends in the future as cash flows grow
— $2.0 billion Las Vegas Sands stock repurchase program ($1.70 billion remaining) to be used to return excess capital to shareholders
1. Excludes dividends paid by Sands China Ltd. and excludes the $2.75 per share special dividend paid in December 2012.
2. Reflects only the public (non-LVS) portion of dividends paid by Sands China Ltd. (total SCL dividends paid since 2011 were $6.21 billion³).
3. The $6.21 billion figure represents SCL dividends paid as of 6/30/2015. The SCL Board of Directors approved a final dividend at the SCL Annual General Meeting (June 17, 2015), which was paid on
July 15, 2015 (an additional $1.04 billion) for a total life-to-date SCL dividend payment of $7.26 billion.
The Company Remains Committed to Returning Capital to Shareholders While Maintaining aStrong Balance Sheet and the Financial Flexibility to Pursue New Development Opportunities
Total Capital Returned to Shareholders
US$ in millions Interim Final Interim Final Interim Final Interim Final² Total
SCL Dividends Paid1
600$ 602$ 696$ 685$ 906$ 894$ 1,030$ $1,041² 6,454$
SCL Special Dividend Paid - - - - 801 - - - 801
Total 600$ 602$ 696$ 685$ 1,707$ 894$ 1,030$ 1,041$ $7,255 ³
Year-to-Date
7/15/201512/31/2012
Year Ended Year Ended Year Ended
12/31/2013 12/31/2014
$1.16$1.33
$1.73$1.99
$0.00
$0.50
$1.00
$1.50
$2.00
$2.50
$3.00
2012 2013 2014 2015²
8
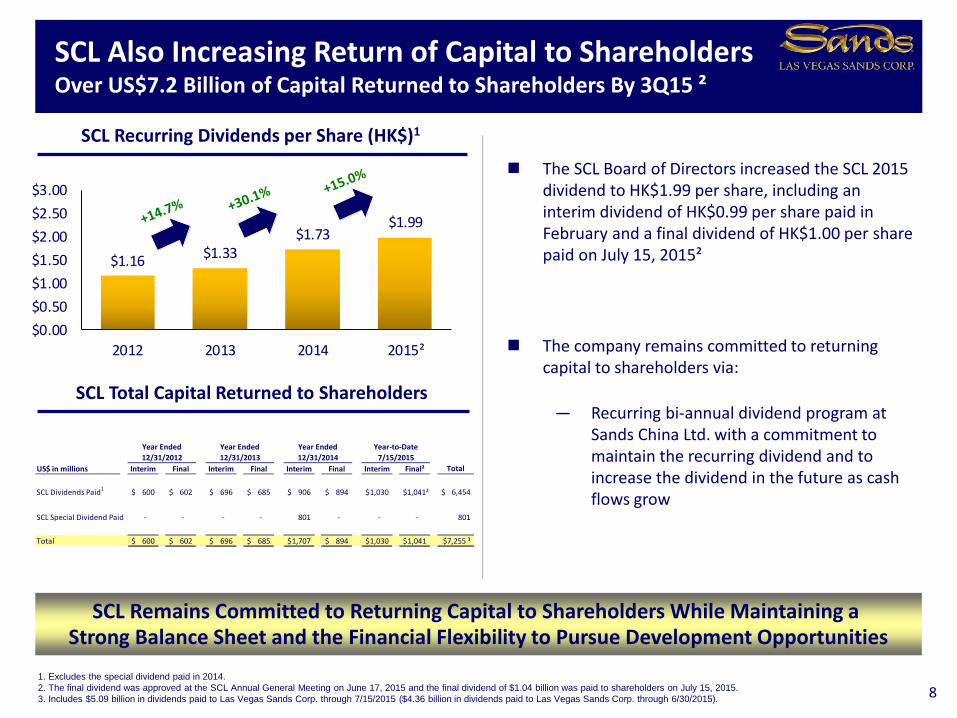
SCL Also Increasing Return of Capital to ShareholdersOver US$7.2 Billion of Capital Returned to Shareholders By 3Q15 ²
SCL Recurring Dividends per Share (HK$)1
The SCL Board of Directors increased the SCL 2015 dividend to HK$1.99 per share, including an interim dividend of HK$0.99 per share paid in February and a final dividend of HK$1.00 per share paid on July 15, 2015²
The company remains committed to returning capital to shareholders via:
— Recurring bi-annual dividend program at Sands China Ltd. with a commitment to maintain the recurring dividend and to increase the dividend in the future as cash flows grow
1. Excludes the special dividend paid in 2014.
2. The final dividend was approved at the SCL Annual General Meeting on June 17, 2015 and the final dividend of $1.04 billion was paid to shareholders on July 15, 2015.
3. Includes $5.09 billion in dividends paid to Las Vegas Sands Corp. through 7/15/2015 ($4.36 billion in dividends paid to Las Vegas Sands Corp. through 6/30/2015).
SCL Remains Committed to Returning Capital to Shareholders While Maintaining a Strong Balance Sheet and the Financial Flexibility to Pursue Development Opportunities
SCL Total Capital Returned to Shareholders
4.7%
2.2%
0.0%
0.5%
1.0%
1.5%
2.0%
2.5%
3.0%
3.5%
4.0%
4.5%
5.0%
5.5%
LVS S&P500
5.2%
4.7%
4.3%
3.7%
3.3%
2.9%
0.0%
0.5%
1.0%
1.5%
2.0%
2.5%
3.0%
3.5%
4.0%
4.5%
5.0%
5.5%
$50.00 $54.83 $60.00 $70.00 $80.00 $90.00
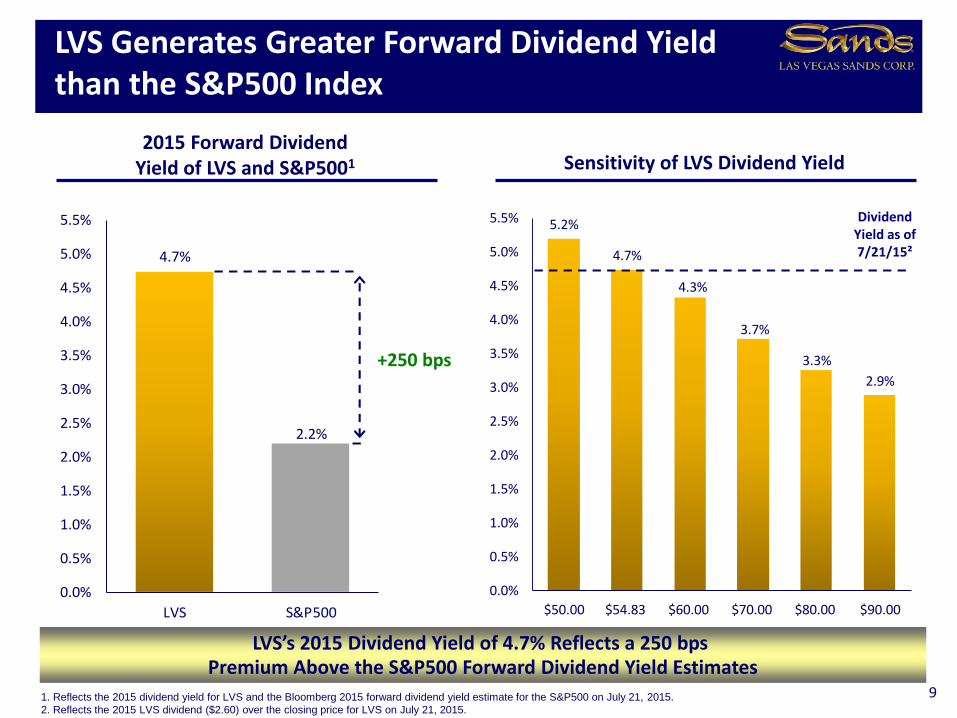
LVS Generates Greater Forward Dividend Yield than the S&P500 Index
2015 Forward Dividend Yield of LVS and S&P5001
1. Reflects the 2015 dividend yield for LVS and the Bloomberg 2015 forward dividend yield estimate for the S&P500 on July 21, 2015.
2. Reflects the 2015 LVS dividend ($2.60) over the closing price for LVS on July 21, 2015.
LVS’s 2015 Dividend Yield of 4.7% Reflects a 250 bps Premium Above the S&P500 Forward Dividend Yield Estimates
Sensitivity of LVS Dividend Yield
Dividend Yield as of 7/21/15²
+250 bps
9
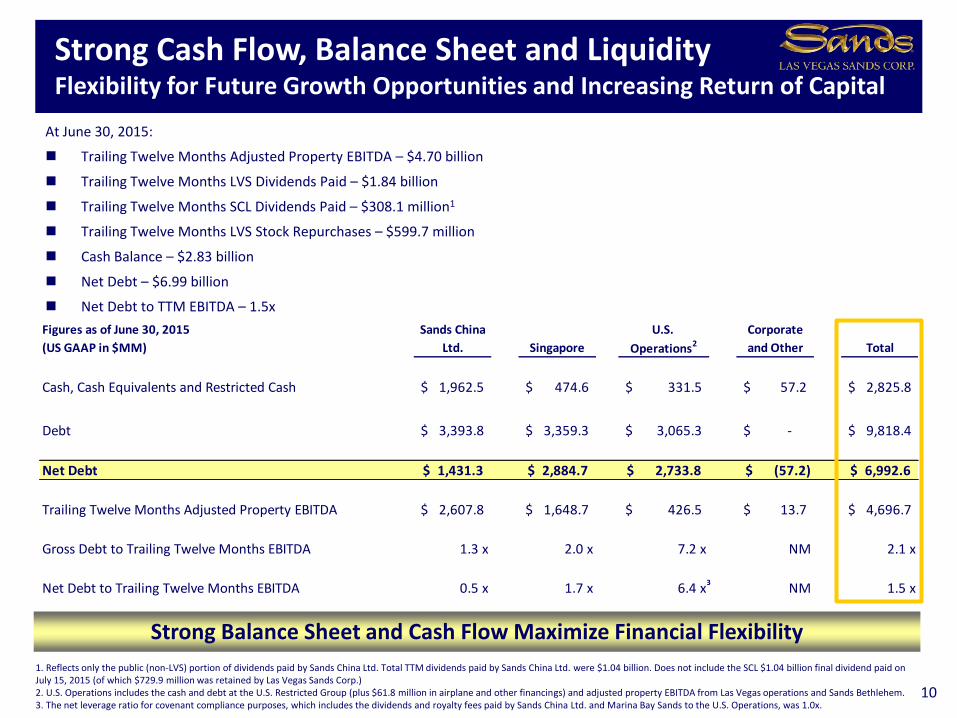
Figures as of June 30, 2015 Sands China U.S. Corporate
(US GAAP in $MM) Ltd. Singapore Operations2 and Other Total
Cash, Cash Equivalents and Restricted Cash 1,962.5$ 474.6$ 331.5$ 57.2$ 2,825.8$
Debt 3,393.8$ 3,359.3$ 3,065.3$ -$ 9,818.4$
Net Debt 1,431.3$ 2,884.7$ 2,733.8$ (57.2)$ 6,992.6$
Trailing Twelve Months Adjusted Property EBITDA 2,607.8$ 1,648.7$ 426.5$ 13.7$ 4,696.7$
Gross Debt to Trailing Twelve Months EBITDA 1.3 x 2.0 x 7.2 x NM 2.1 x
Net Debt to Trailing Twelve Months EBITDA 0.5 x 1.7 x 6.4 x NM 1.5 x
At June 30, 2015:
Trailing Twelve Months Adjusted Property EBITDA – $4.70 billion
Trailing Twelve Months LVS Dividends Paid – $1.84 billion
Trailing Twelve Months SCL Dividends Paid – $308.1 million1
Trailing Twelve Months LVS Stock Repurchases – $599.7 million
Cash Balance – $2.83 billion
Net Debt – $6.99 billion
Net Debt to TTM EBITDA – 1.5x
Strong Cash Flow, Balance Sheet and LiquidityFlexibility for Future Growth Opportunities and Increasing Return of Capital
10
1. Reflects only the public (non-LVS) portion of dividends paid by Sands China Ltd. Total TTM dividends paid by Sands China Ltd. were $1.04 billion. Does not include the SCL $1.04 billion final dividend paid on July 15, 2015 (of which $729.9 million was retained by Las Vegas Sands Corp.)2. U.S. Operations includes the cash and debt at the U.S. Restricted Group (plus $61.8 million in airplane and other financings) and adjusted property EBITDA from Las Vegas operations and Sands Bethlehem.3. The net leverage ratio for covenant compliance purposes, which includes the dividends and royalty fees paid by Sands China Ltd. and Marina Bay Sands to the U.S. Operations, was 1.0x.
Strong Balance Sheet and Cash Flow Maximize Financial Flexibility
3
$801.3
$559.8
$752.5
$526.534.0%
32.2% 33.3%31.7%
0%
10%
20%
30%
40%
50%
60%
$0
$100
$200
$300
$400
$500
$600
$700
$800
$900
$1,000
2Q14 2Q15 2Q14 2Q15
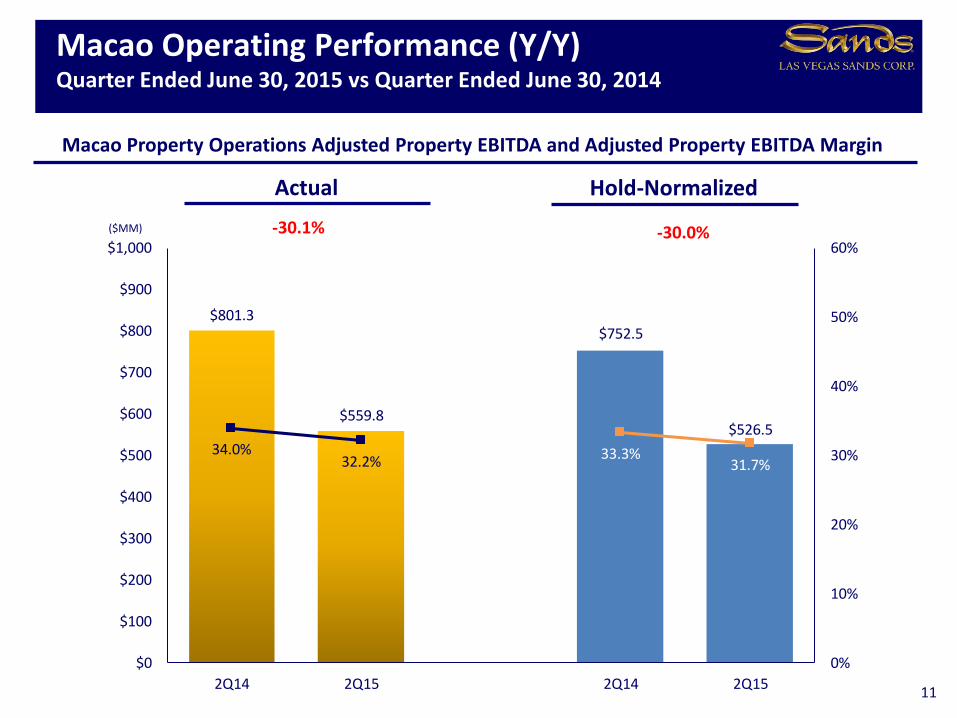
Macao Operating Performance (Y/Y)Quarter Ended June 30, 2015 vs Quarter Ended June 30, 2014
11
($MM)
Macao Property Operations Adjusted Property EBITDA and Adjusted Property EBITDA Margin
Actual Hold-Normalized
-30.0%-30.1%
$527.7$559.8
$527.7 $526.5
30.2%32.2%
30.2%31.7%
0%
10%
20%
30%
40%
50%
60%
$0
$100
$200
$300
$400
$500
$600
$700
1Q15 2Q15 1Q15 2Q15
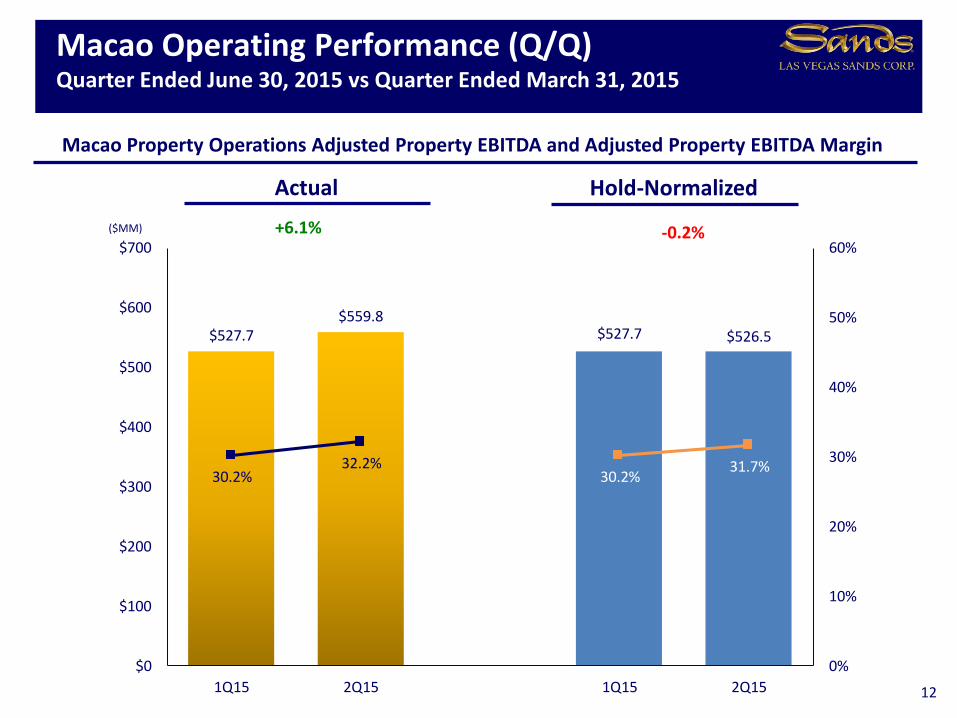
Macao Operating Performance (Q/Q)Quarter Ended June 30, 2015 vs Quarter Ended March 31, 2015
12
($MM)
Macao Property Operations Adjusted Property EBITDA and Adjusted Property EBITDA Margin
Actual Hold-Normalized
-0.2%+6.1%
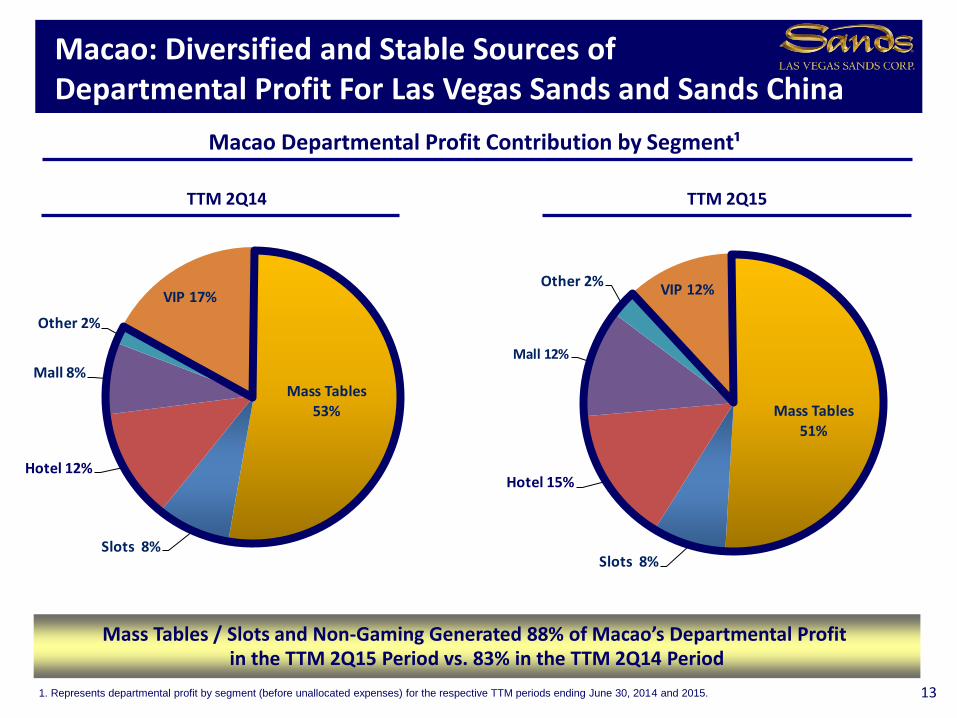
Mass Tables53%
Slots 8%
Hotel 12%
Mall 8%
Other 2%
VIP 17%
Mass Tables51%
Slots 8%
Hotel 15%
Mall 12%
Other 2%VIP 12%
TTM 2Q14
Macao: Diversified and Stable Sources of Departmental Profit For Las Vegas Sands and Sands China
13
Mass Tables / Slots and Non-Gaming Generated 88% of Macao’s Departmental Profit in the TTM 2Q15 Period vs. 83% in the TTM 2Q14 Period
Macao Departmental Profit Contribution by Segment¹
TTM 2Q15
1. Represents departmental profit by segment (before unallocated expenses) for the respective TTM periods ending June 30, 2014 and 2015.
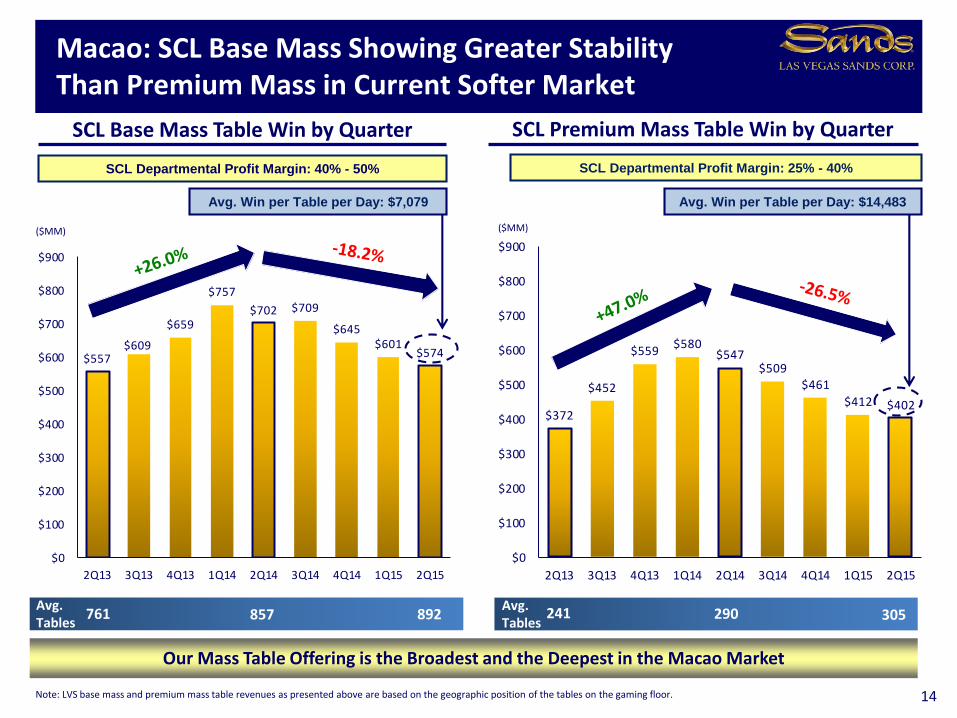
$372
$452
$559$580
$547$509
$461
$412 $402
$0
$100
$200
$300
$400
$500
$600
$700
$800
$900
2Q13 3Q13 4Q13 1Q14 2Q14 3Q14 4Q14 1Q15 2Q15
$557$609
$659
$757
$702 $709
$645$601
$574
$0
$100
$200
$300
$400
$500
$600
$700
$800
$900
2Q13 3Q13 4Q13 1Q14 2Q14 3Q14 4Q14 1Q15 2Q15
14
SCL Base Mass Table Win by Quarter
Macao: SCL Base Mass Showing Greater Stability Than Premium Mass in Current Softer Market
Note: LVS base mass and premium mass table revenues as presented above are based on the geographic position of the tables on the gaming floor.
Our Mass Table Offering is the Broadest and the Deepest in the Macao Market
($MM)
SCL Premium Mass Table Win by Quarter
SCL Departmental Profit Margin: 40% - 50% SCL Departmental Profit Margin: 25% - 40%
($MM)
241Avg.Tables
290 305761Avg.Tables
857 892
Avg. Win per Table per Day: $7,079 Avg. Win per Table per Day: $14,483
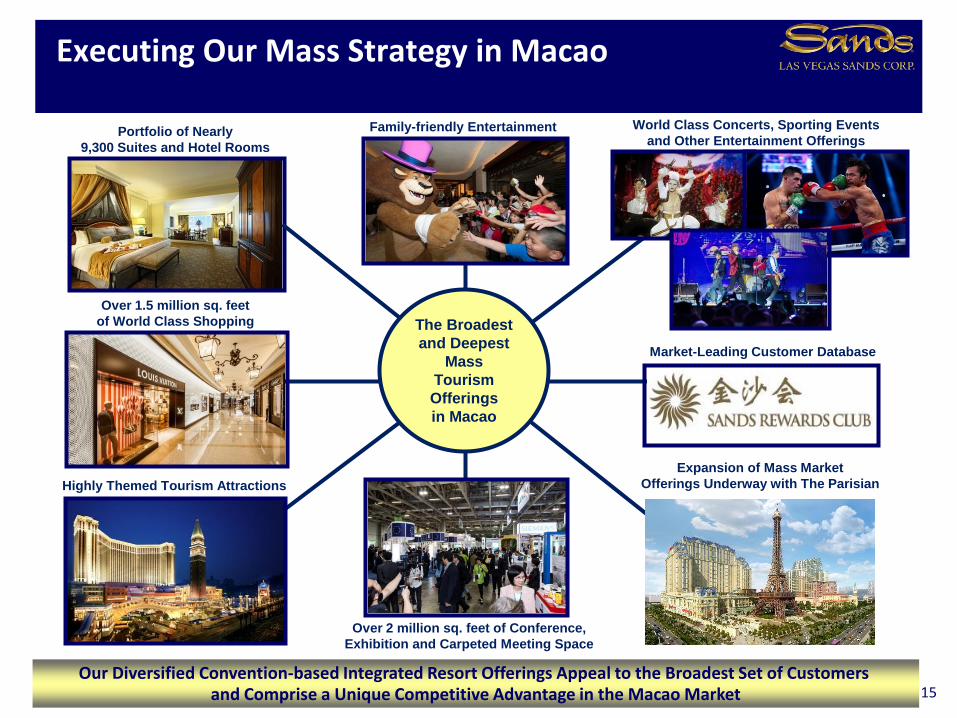
Executing Our Mass Strategy in Macao
Expansion of Mass Market
Offerings Underway with The Parisian
Family-friendly Entertainment World Class Concerts, Sporting Events
and Other Entertainment Offerings
Over 1.5 million sq. feet
of World Class Shopping
Market-Leading Customer Database
Highly Themed Tourism Attractions
Portfolio of Nearly
9,300 Suites and Hotel Rooms
Over 2 million sq. feet of Conference,
Exhibition and Carpeted Meeting Space
The Broadest
and Deepest
Mass
Tourism
Offerings
in Macao
Our Diversified Convention-based Integrated Resort Offerings Appeal to the Broadest Set of Customers and Comprise a Unique Competitive Advantage in the Macao Market 15
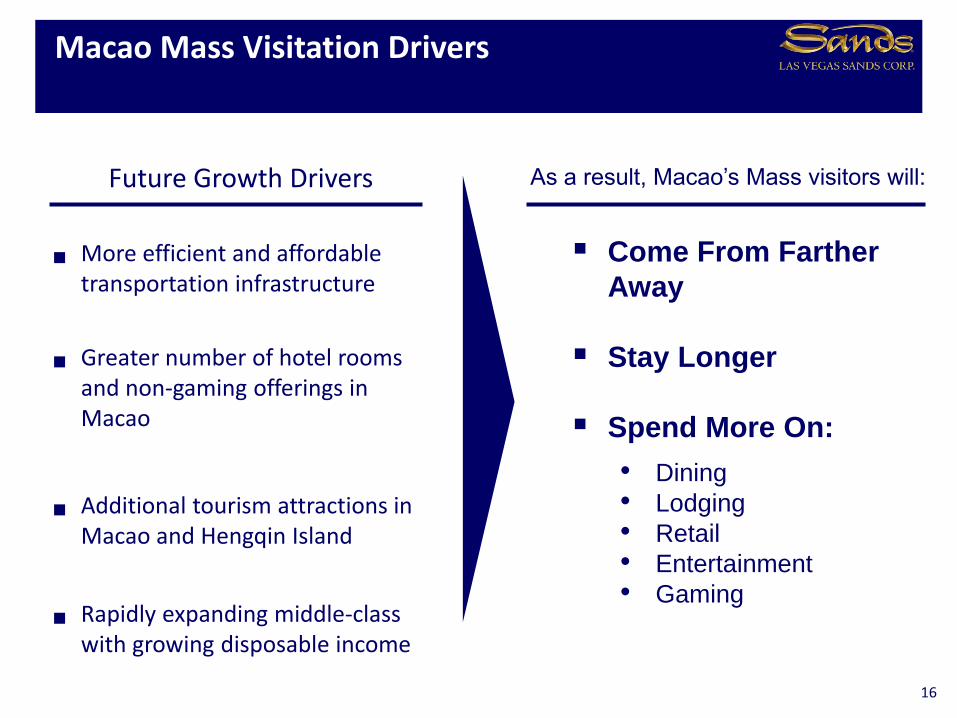
Macao Mass Visitation Drivers
Future Growth Drivers
More efficient and affordable transportation infrastructure
Greater number of hotel rooms and non-gaming offerings in Macao
Additional tourism attractions in Macao and Hengqin Island
Rapidly expanding middle-class with growing disposable income
16
As a result, Macao’s Mass visitors will:
Come From Farther
Away
Stay Longer
Spend More On:
• Dining
• Lodging
• Retail
• Entertainment
• Gaming
Xinjiang
Tibet
Qinghai
SichuanChongqing
Henan
Hubei
ShanxiHebei
Shandong
Beijing
Liaoning
Jilin
Heilongjiang
Jiangsu
Anhui
Hunan Jiangxi
Zhejiang
Guangxi
Guizhou
Yunnan
Ningxia
Shaanxi
Inner Mongolia
Gansu
Guangdong
Fujian
Shanghai
Tianjin
Hong Kong
Macao
Twelve Months Ended May 31, Population GDP Per Penetration
Province 2014 2015 % Change (MM) Capita (US$) Rate
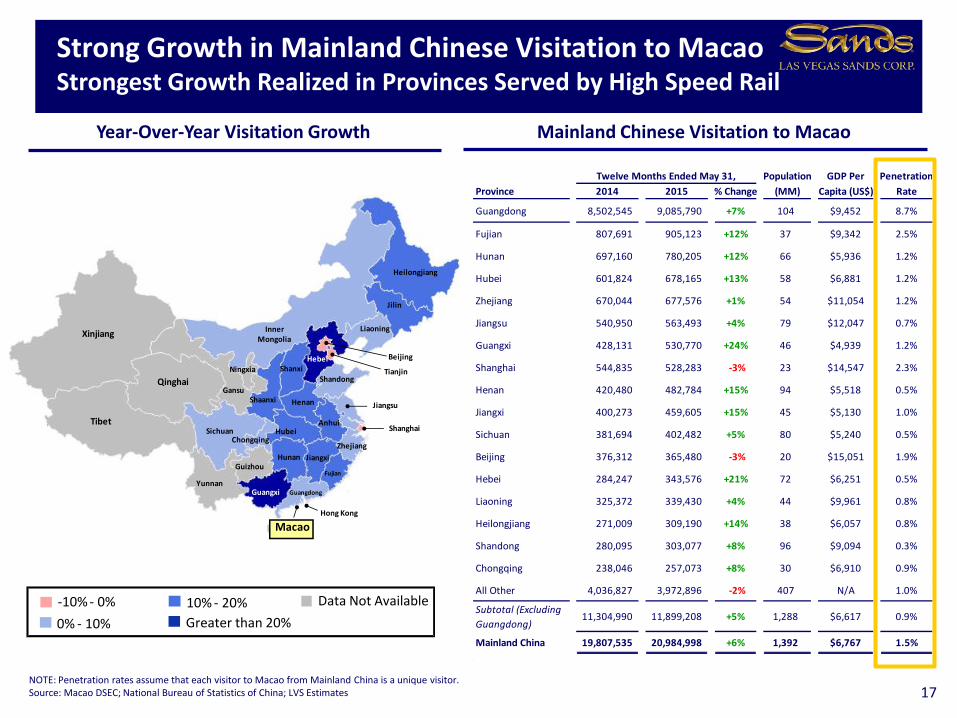
Guangdong 8,502,545 9,085,790 +7% 104 $9,452 8.7%
Fujian 807,691 905,123 +12% 37 $9,342 2.5%
Hunan 697,160 780,205 +12% 66 $5,936 1.2%
Hubei 601,824 678,165 +13% 58 $6,881 1.2%
Zhejiang 670,044 677,576 +1% 54 $11,054 1.2%
Jiangsu 540,950 563,493 +4% 79 $12,047 0.7%
Guangxi 428,131 530,770 +24% 46 $4,939 1.2%
Shanghai 544,835 528,283 -3% 23 $14,547 2.3%
Henan 420,480 482,784 +15% 94 $5,518 0.5%
Jiangxi 400,273 459,605 +15% 45 $5,130 1.0%
Sichuan 381,694 402,482 +5% 80 $5,240 0.5%
Beijing 376,312 365,480 -3% 20 $15,051 1.9%
Hebei 284,247 343,576 +21% 72 $6,251 0.5%
Liaoning 325,372 339,430 +4% 44 $9,961 0.8%
Heilongjiang 271,009 309,190 +14% 38 $6,057 0.8%
Shandong 280,095 303,077 +8% 96 $9,094 0.3%
Chongqing 238,046 257,073 +8% 30 $6,910 0.9%
All Other 4,036,827 3,972,896 -2% 407 N/A 1.0%
Subtotal (Excluding
Guangdong)11,304,990 11,899,208 +5% 1,288 $6,617 0.9%
Mainland China 19,807,535 20,984,998 +6% 1,392 $6,767 1.5%
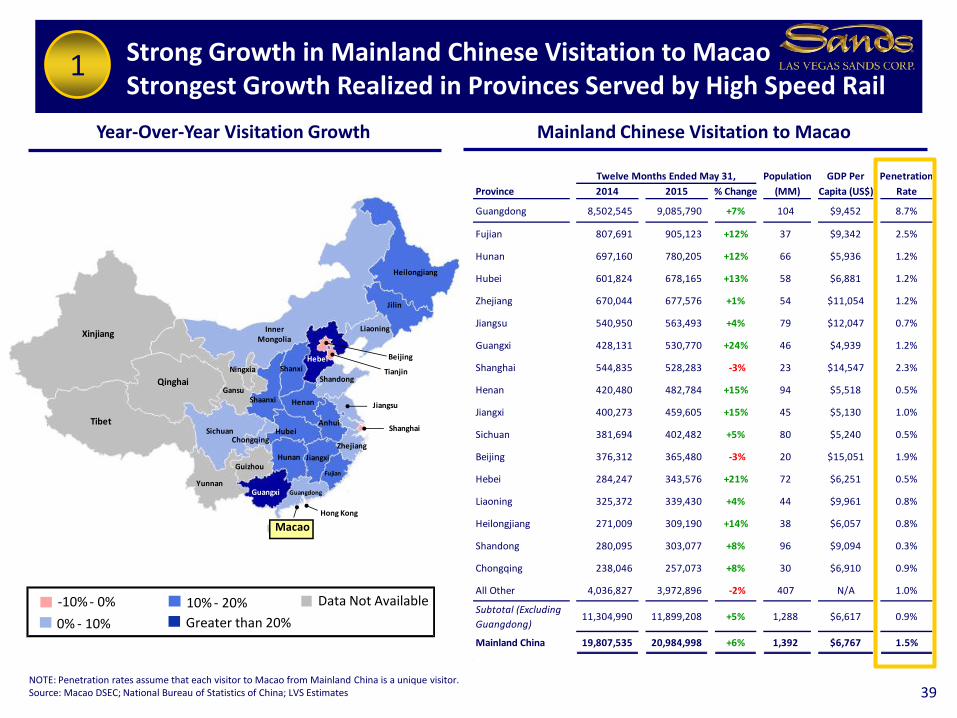
17NOTE: Penetration rates assume that each visitor to Macao from Mainland China is a unique visitor.Source: Macao DSEC; National Bureau of Statistics of China; LVS Estimates
Year-Over-Year Visitation Growth Mainland Chinese Visitation to Macao
Greater than 20%
Data Not Available-10% - 0%
0% - 10%
10% - 20%
Strong Growth in Mainland Chinese Visitation to MacaoStrongest Growth Realized in Provinces Served by High Speed Rail
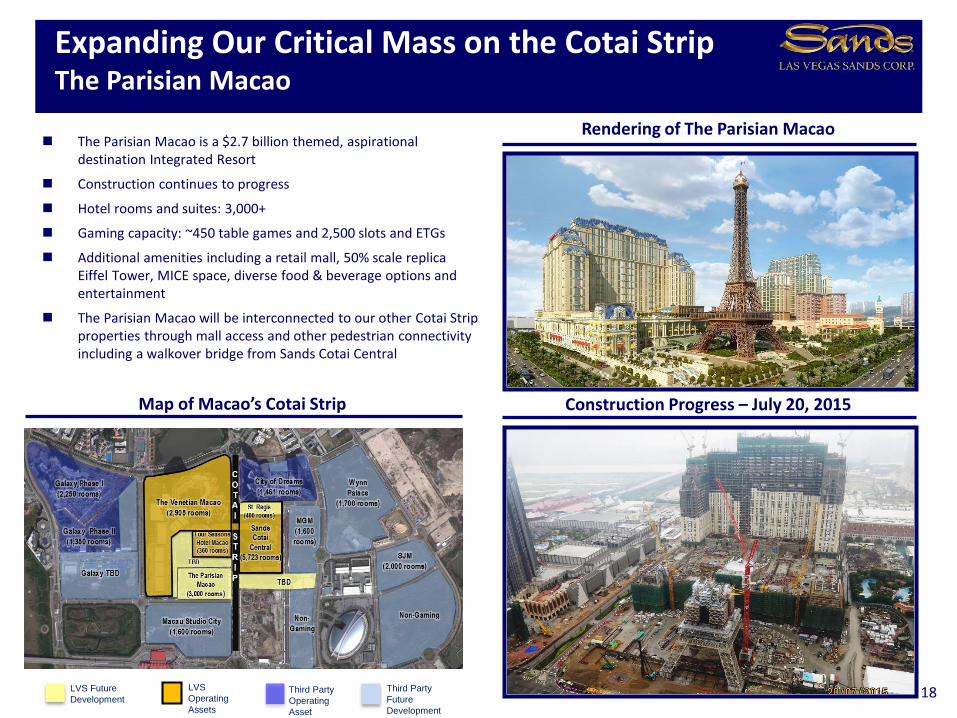
Expanding Our Critical Mass on the Cotai StripThe Parisian Macao
18LVS
Operating
Assets
Third Party
Operating
Asset
Third Party
Future
Development
Construction Progress – July 20, 2015Map of Macao’s Cotai Strip
The Parisian Macao is a $2.7 billion themed, aspirational destination Integrated Resort
Construction continues to progress
Hotel rooms and suites: 3,000+
Gaming capacity: ~450 table games and 2,500 slots and ETGs
Additional amenities including a retail mall, 50% scale replica Eiffel Tower, MICE space, diverse food & beverage options and entertainment
The Parisian Macao will be interconnected to our other Cotai Strip properties through mall access and other pedestrian connectivity including a walkover bridge from Sands Cotai Central
Rendering of The Parisian Macao
LVS Future
Development
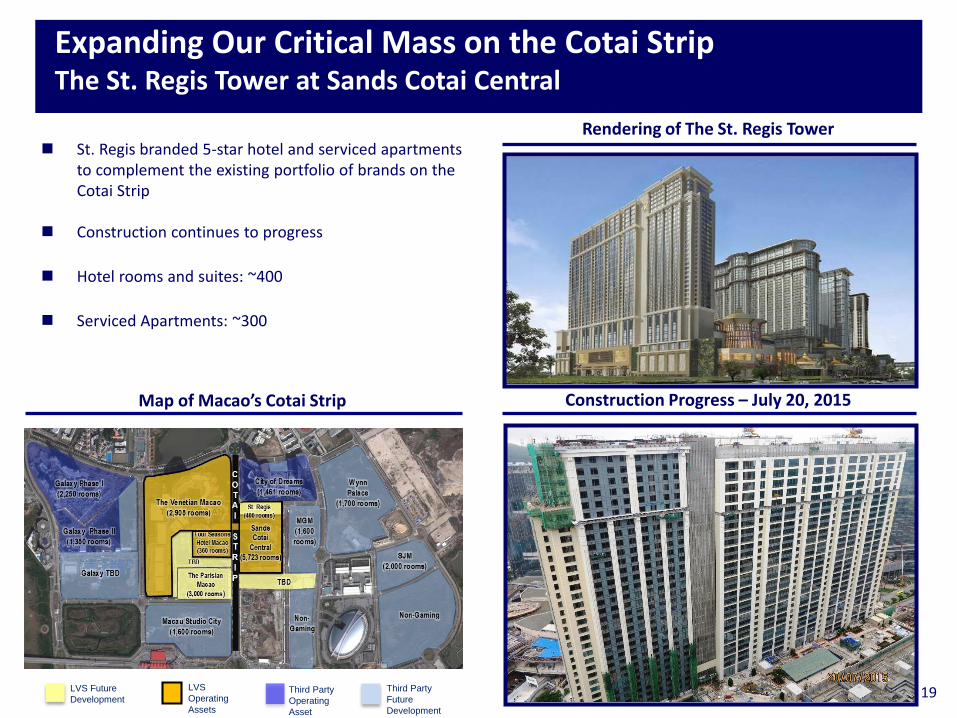
Expanding Our Critical Mass on the Cotai StripThe St. Regis Tower at Sands Cotai Central
19
Construction Progress – July 20, 2015Map of Macao’s Cotai Strip
St. Regis branded 5-star hotel and serviced apartments to complement the existing portfolio of brands on the Cotai Strip
Construction continues to progress
Hotel rooms and suites: ~400
Serviced Apartments: ~300
Rendering of The St. Regis Tower
LVS
Operating
Assets
Third Party
Operating
Asset
Third Party
Future
Development
LVS Future
Development
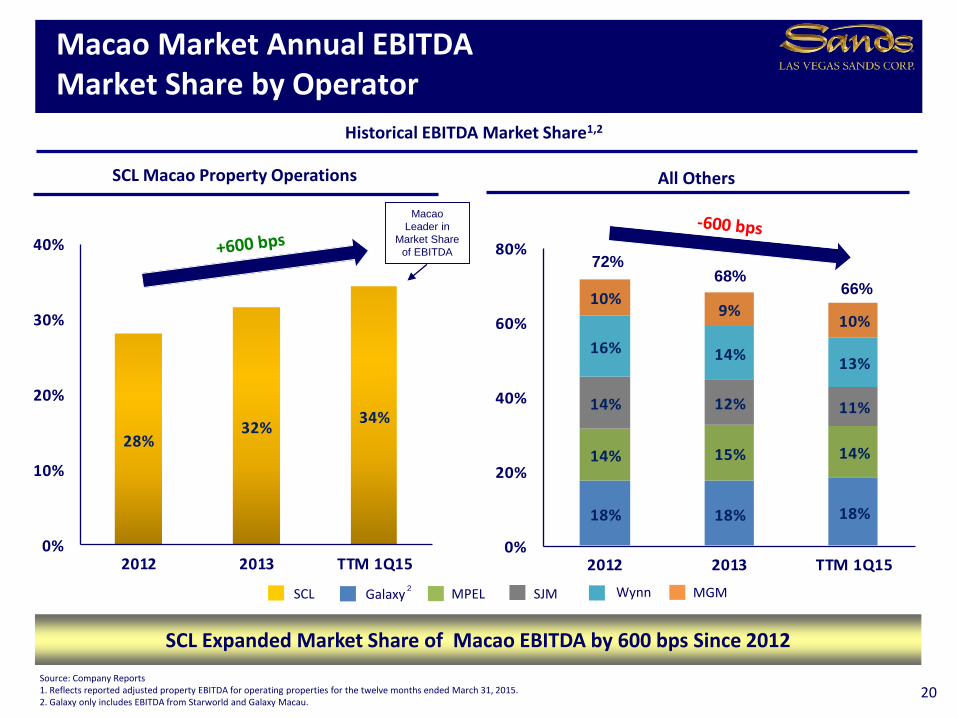
18% 18% 18%
14% 15% 14%
14% 12% 11%
16% 14%13%
10%9%
10%
0%
20%
40%
60%
80%
2012 2013 TTM 1Q15
28%32%
34%
0%
10%
20%
30%
40%
2012 2013 TTM 1Q15
Macao Market Annual EBITDA Market Share by Operator
SCL Expanded Market Share of Macao EBITDA by 600 bps Since 2012
Source: Company Reports1. Reflects reported adjusted property EBITDA for operating properties for the twelve months ended March 31, 2015.2. Galaxy only includes EBITDA from Starworld and Galaxy Macau.
Historical EBITDA Market Share1,2
20
Galaxy MPELSCL2
SJM Wynn MGM
SCL Macao Property Operations All Others
Macao
Leader in
Market Share
of EBITDA72%
68%66%
$3.02 $3.16
$1.66 $1.57
$4.68 $4.73
$0.0
$2.0
$4.0
$6.0
2Q14 2Q15
Non-Rolling Tables Slot Machines
$417.8$363.3 $368.5 $363.3
51.9% 50.9% 49.6% 50.9%
20%
30%
40%
50%
60%
70%
80%
$0
$100
$200
$300
$400
$500
$600
2Q14 2Q15 2Q14 2Q15
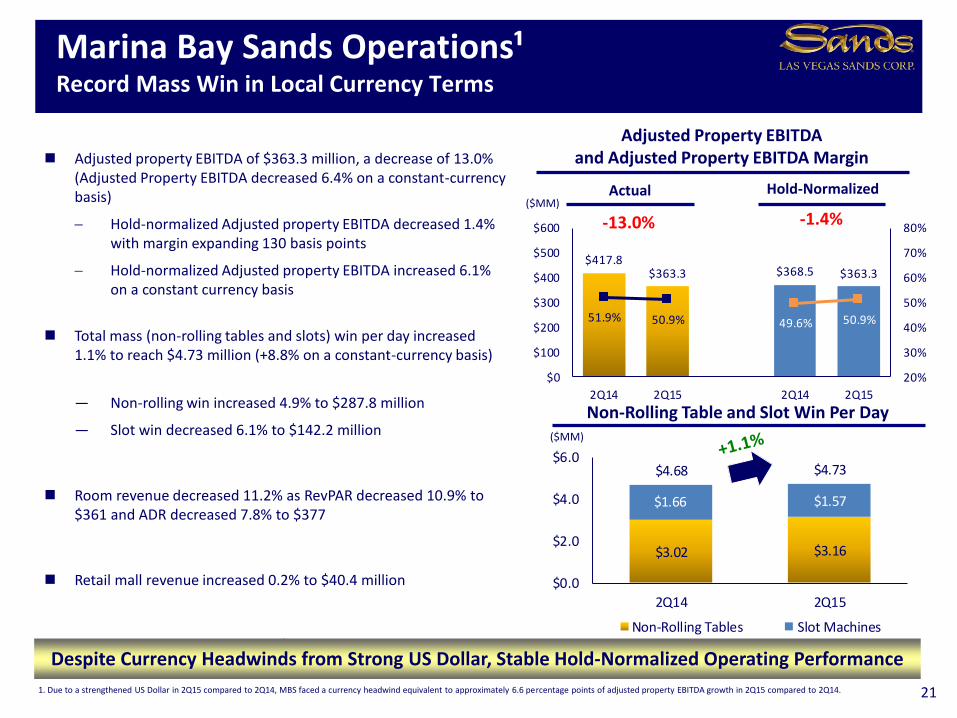
Marina Bay Sands Operations¹Record Mass Win in Local Currency Terms
21
Actual
Adjusted property EBITDA of $363.3 million, a decrease of 13.0% (Adjusted Property EBITDA decreased 6.4% on a constant-currency basis)
Hold-normalized Adjusted property EBITDA decreased 1.4% with margin expanding 130 basis points
Hold-normalized Adjusted property EBITDA increased 6.1% on a constant currency basis
Total mass (non-rolling tables and slots) win per day increased 1.1% to reach $4.73 million (+8.8% on a constant-currency basis)
— Non-rolling win increased 4.9% to $287.8 million
— Slot win decreased 6.1% to $142.2 million
Room revenue decreased 11.2% as RevPAR decreased 10.9% to $361 and ADR decreased 7.8% to $377
Retail mall revenue increased 0.2% to $40.4 million
Rolling win decreased 26.6% to $264.5 million (rolling volume decreased 9.0% to $9.51 billion)
($MM)
($MM)
Adjusted Property EBITDA and Adjusted Property EBITDA Margin
Despite Currency Headwinds from Strong US Dollar, Stable Hold-Normalized Operating Performance
Non-Rolling Table and Slot Win Per Day
Hold-Normalized
1. Due to a strengthened US Dollar in 2Q15 compared to 2Q14, MBS faced a currency headwind equivalent to approximately 6.6 percentage points of adjusted property EBITDA growth in 2Q15 compared to 2Q14.
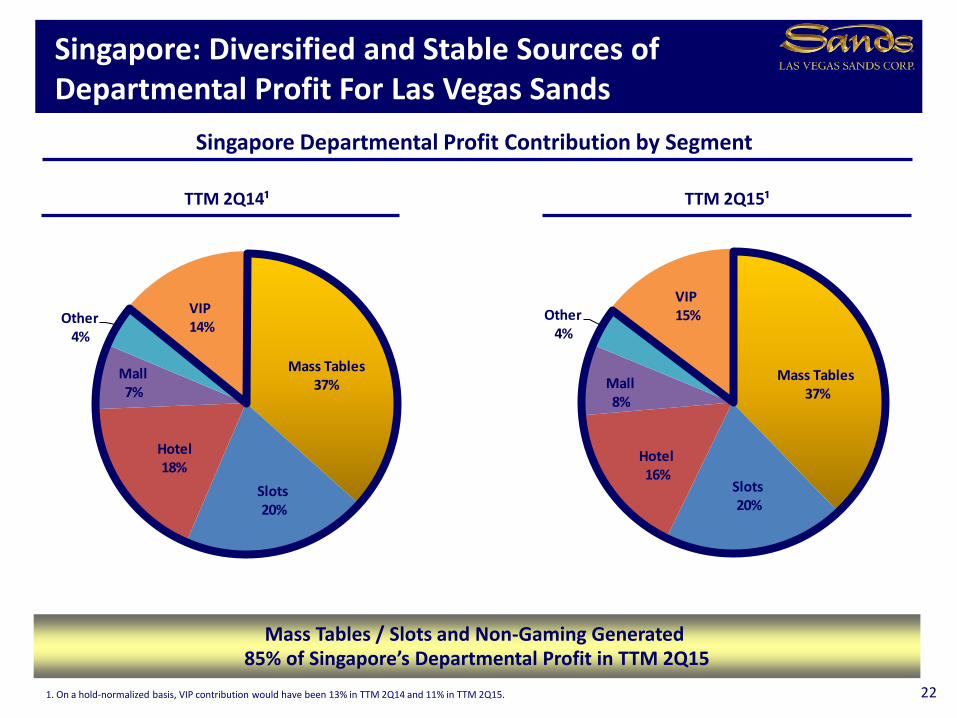
VIP15%
Mass Tables37%
Slots20%
Hotel16%
Mall8%
Other4%
VIP14%
Mass Tables37%
Slots20%
Hotel18%
Mall7%
Other4%
TTM 2Q14¹
Singapore: Diversified and Stable Sources of Departmental Profit For Las Vegas Sands
22
Mass Tables / Slots and Non-Gaming Generated 85% of Singapore’s Departmental Profit in TTM 2Q15
Singapore Departmental Profit Contribution by Segment
TTM 2Q15¹
1. On a hold-normalized basis, VIP contribution would have been 13% in TTM 2Q14 and 11% in TTM 2Q15.
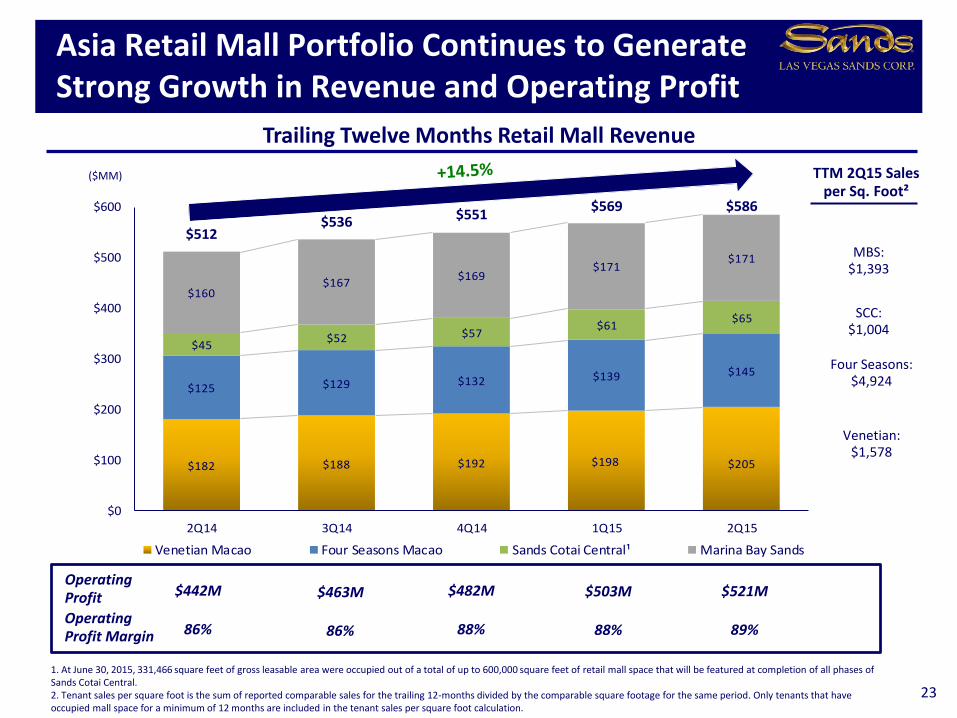
$182 $188 $192 $198 $205
$125 $129 $132 $139 $145
$45$52 $57
$61$65
$160$167
$169$171
$171
$512$536 $551
$569 $586
$0
$100
$200
$300
$400
$500
$600
2Q14 3Q14 4Q14 1Q15 2Q15
Venetian Macao Four Seasons Macao Sands Cotai Central¹ Marina Bay Sands
Asia Retail Mall Portfolio Continues to Generate Strong Growth in Revenue and Operating Profit
23
($MM)
Trailing Twelve Months Retail Mall Revenue
88% 89%86% 86%Operating Profit Margin 88%
1. At June 30, 2015, 331,466 square feet of gross leasable area were occupied out of a total of up to 600,000 square feet of retail mall space that will be featured at completion of all phases of Sands Cotai Central. 2. Tenant sales per square foot is the sum of reported comparable sales for the trailing 12-months divided by the comparable square footage for the same period. Only tenants that have occupied mall space for a minimum of 12 months are included in the tenant sales per square foot calculation.
$503M $521M$442M $463MOperating Profit $482M
TTM 2Q15 Sales per Sq. Foot²
MBS:$1,393
SCC:$1,004
Four Seasons:$4,924
Venetian:$1,578
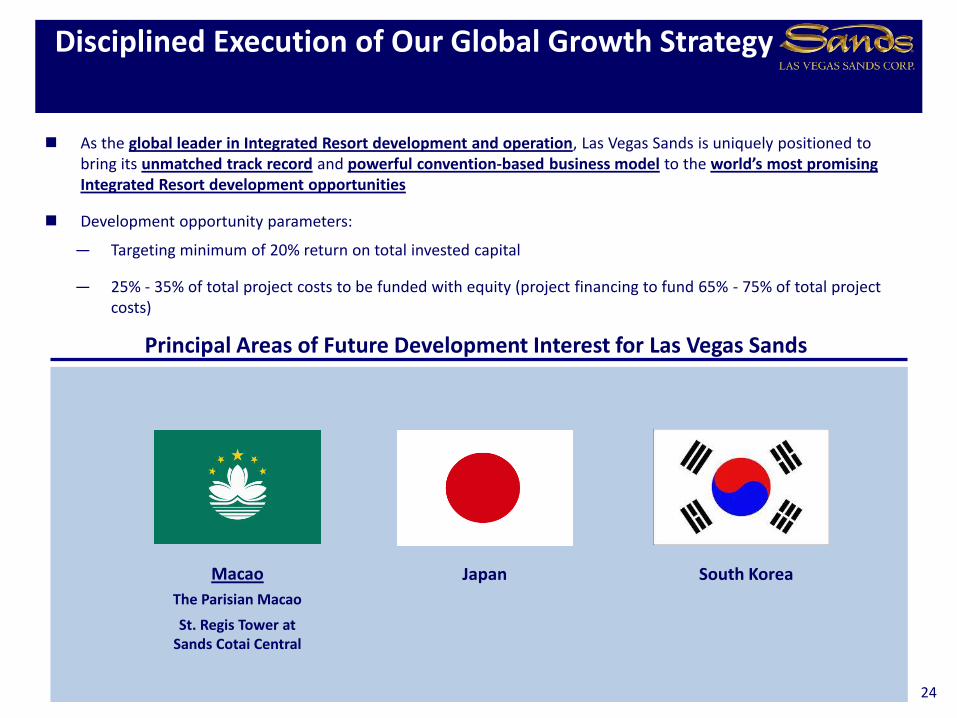
South Korea
Principal Areas of Future Development Interest for Las Vegas Sands
Japan
As the global leader in Integrated Resort development and operation, Las Vegas Sands is uniquely positioned to bring its unmatched track record and powerful convention-based business model to the world’s most promising Integrated Resort development opportunities
Development opportunity parameters:
— Targeting minimum of 20% return on total invested capital
— 25% - 35% of total project costs to be funded with equity (project financing to fund 65% - 75% of total project costs)
Disciplined Execution of Our Global Growth Strategy
24
Macao
The Parisian Macao
St. Regis Tower atSands Cotai Central

Appendix
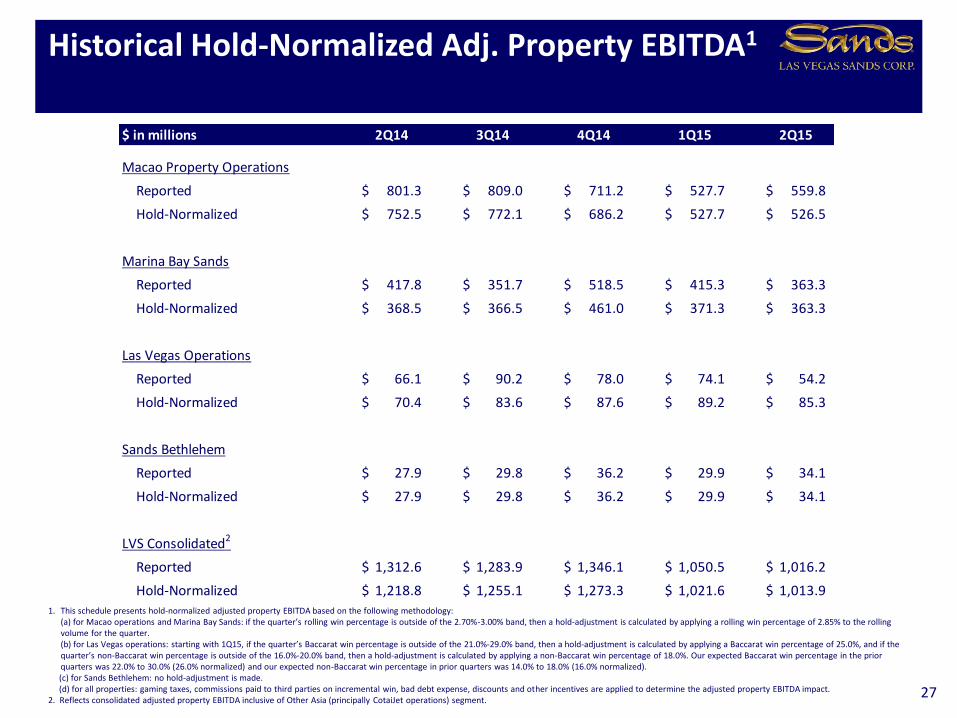
$ in millions 2Q14 3Q14 4Q14 1Q15 2Q15
Macao Property Operations
Reported 801.3$ 809.0$ 711.2$ 527.7$ 559.8$
Hold-Normalized 752.5$ 772.1$ 686.2$ 527.7$ 526.5$
Marina Bay Sands
Reported 417.8$ 351.7$ 518.5$ 415.3$ 363.3$
Hold-Normalized 368.5$ 366.5$ 461.0$ 371.3$ 363.3$
Las Vegas Operations
Reported 66.1$ 90.2$ 78.0$ 74.1$ 54.2$
Hold-Normalized 70.4$ 83.6$ 87.6$ 89.2$ 85.3$
Sands Bethlehem
Reported 27.9$ 29.8$ 36.2$ 29.9$ 34.1$
Hold-Normalized 27.9$ 29.8$ 36.2$ 29.9$ 34.1$
LVS Consolidated2
Reported 1,312.6$ 1,283.9$ 1,346.1$ 1,050.5$ 1,016.2$
Hold-Normalized 1,218.8$ 1,255.1$ 1,273.3$ 1,021.6$ 1,013.9$
Historical Hold-Normalized Adj. Property EBITDA1
27
1. This schedule presents hold-normalized adjusted property EBITDA based on the following methodology:(a) for Macao operations and Marina Bay Sands: if the quarter’s rolling win percentage is outside of the 2.70%-3.00% band, then a hold-adjustment is calculated by applying a rolling win percentage of 2.85% to the rolling volume for the quarter.(b) for Las Vegas operations: starting with 1Q15, if the quarter’s Baccarat win percentage is outside of the 21.0%-29.0% band, then a hold-adjustment is calculated by applying a Baccarat win percentage of 25.0%, and if the quarter’s non-Baccarat win percentage is outside of the 16.0%-20.0% band, then a hold-adjustment is calculated by applying a non-Baccarat win percentage of 18.0%. Our expected Baccarat win percentage in the prior quarters was 22.0% to 30.0% (26.0% normalized) and our expected non-Baccarat win percentage in prior quarters was 14.0% to 18.0% (16.0% normalized).(c) for Sands Bethlehem: no hold-adjustment is made.(d) for all properties: gaming taxes, commissions paid to third parties on incremental win, bad debt expense, discounts and other incentives are applied to determine the adjusted property EBITDA impact.
2. Reflects consolidated adjusted property EBITDA inclusive of Other Asia (principally CotaiJet operations) segment.
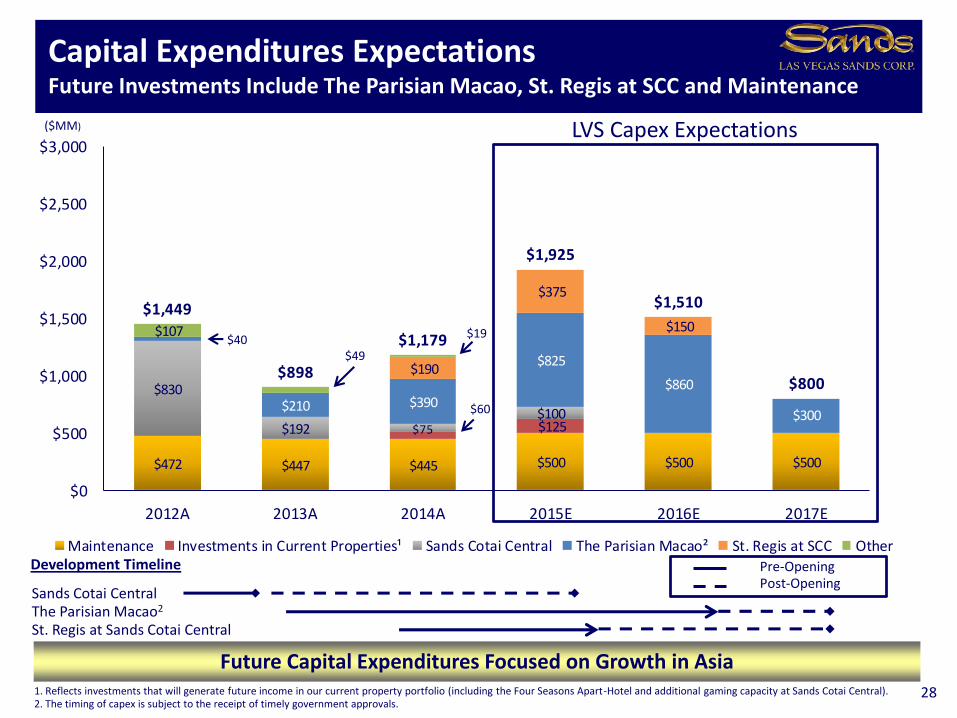
$472 $447 $445 $500 $500 $500
$125
$830
$192 $75$100
$210 $390
$825
$860
$300
$190
$375
$150 $107
$1,449
$898
$1,179
$1,925
$1,510
$800
$0
$500
$1,000
$1,500
$2,000
$2,500
$3,000
2012A 2013A 2014A 2015E 2016E 2017E
Maintenance Investments in Current Properties¹ Sands Cotai Central The Parisian Macao² St. Regis at SCC Other
Capital Expenditures ExpectationsFuture Investments Include The Parisian Macao, St. Regis at SCC and Maintenance
Future Capital Expenditures Focused on Growth in Asia
($MM)
1. Reflects investments that will generate future income in our current property portfolio (including the Four Seasons Apart-Hotel and additional gaming capacity at Sands Cotai Central). 2. The timing of capex is subject to the receipt of timely government approvals.
Sands Cotai CentralThe Parisian Macao2
St. Regis at Sands Cotai Central
LVS Capex Expectations
Development Timeline Pre-OpeningPost-Opening
28
$40$49
$60
$19
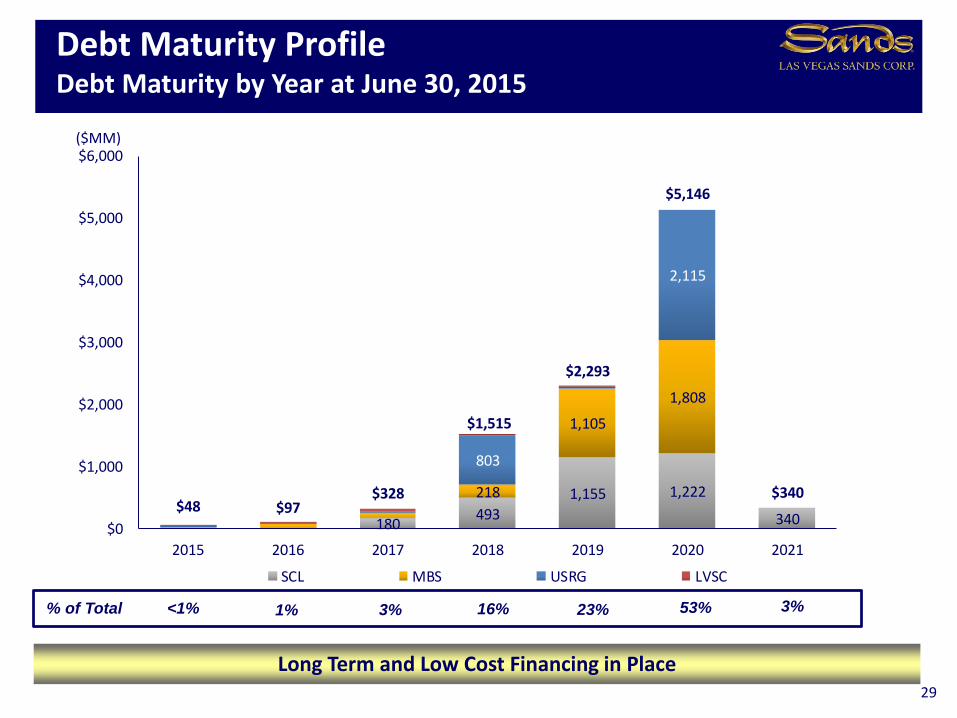
180 493
1,155 1,222
340
218
1,105
1,808
803
2,115
$48 $97$328
$1,515
$2,293
$5,146
$340
$0
$1,000
$2,000
$3,000
$4,000
$5,000
$6,000
2015 2016 2017 2018 2019 2020 2021
SCL MBS USRG LVSC
Debt Maturity ProfileDebt Maturity by Year at June 30, 2015
Long Term and Low Cost Financing in Place
($MM)
<1% 1% 16%% of Total 3% 23% 53%
29
3%
$70
$208$285
$361$510
$561$656
$780$822 $896
$1,045$1,087 $1,059 $1,120
$1,016$1,068 $1,028 $984 $1,001 $1,011 $994
0.0% 8.4% 9.6%12.9% 11.3%
14.6%18.2% 19.8%
23.4%26.8% 26.7% 27.8%
30.3% 32.0%
37.2% 37.5%40.9% 41.9% 40.0%
37.6% 38.5%
0.0%
10.0%
20.0%
30.0%
40.0%
50.0%
$0
$300
$600
$900
$1,200
2Q10 3Q10 4Q10 1Q11 2Q11 3Q11 4Q11 1Q12 2Q12 3Q12 4Q12 1Q13 2Q13 3Q13 4Q13 1Q14 2Q14 3Q14 4Q14 1Q15 2Q15
Gross Casino A/R Balance at End of Period Reserve Against Casino A/R Balance
$40
$146
$203$250 $271
$345$314
$418
$311 $317
$378 $368$408
$342
$403
$326$361
$281 $272 $291 $281
$0
$75
$150
$225
$300
$375
$450
2Q10 3Q10 4Q10 1Q11 2Q11 3Q11 4Q11 1Q12 2Q12 3Q12 4Q12 1Q13 2Q13 3Q13 4Q13 1Q14 2Q14 3Q14 4Q14 1Q15 2Q15
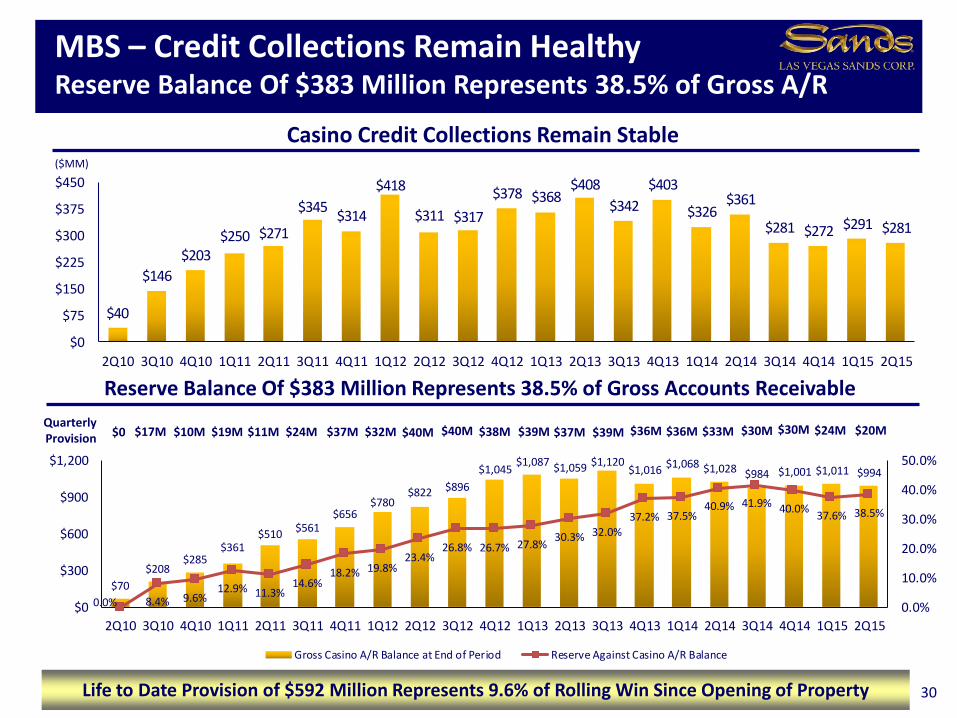
MBS – Credit Collections Remain Healthy Reserve Balance Of $383 Million Represents 38.5% of Gross A/R
30
($MM)
Reserve Balance Of $383 Million Represents 38.5% of Gross Accounts Receivable
Casino Credit Collections Remain Stable
$0Quarterly Provision
$17M $24M $37M $32M $40M $40M$11M$19M$10M
Life to Date Provision of $592 Million Represents 9.6% of Rolling Win Since Opening of Property
$38M $39M $37M $39M $36M $36M $33M $30M $30M $24M $20M
$252 $225
$188 $242
$440 $467
$0
$100
$200
$300
$400
$500
$600
$700
2Q14 2Q15
Baccarat Non-Baccarat
$66.1
$54.2
$70.4
$85.3
18.7%15.7%
19.6%22.2%
0%
10%
20%
30%
40%
$0
$20
$40
$60
$80
$100
2Q14 2Q15 2Q14 2Q15
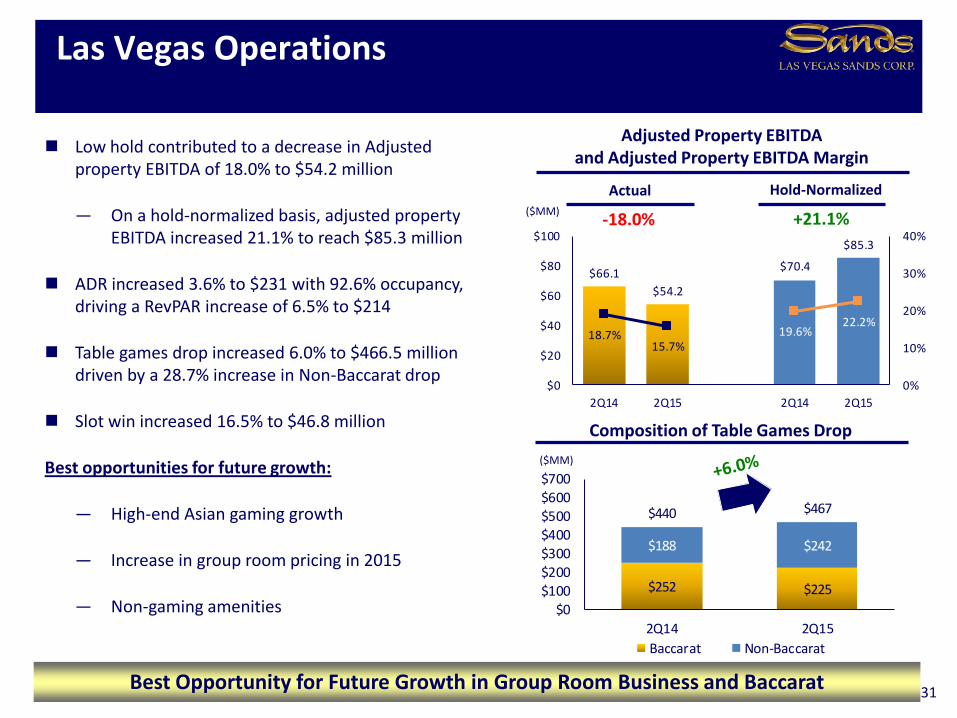
Las Vegas Operations
31
Composition of Table Games Drop
Low hold contributed to a decrease in Adjusted property EBITDA of 18.0% to $54.2 million
— On a hold-normalized basis, adjusted property EBITDA increased 21.1% to reach $85.3 million
ADR increased 3.6% to $231 with 92.6% occupancy, driving a RevPAR increase of 6.5% to $214
Table games drop increased 6.0% to $466.5 million driven by a 28.7% increase in Non-Baccarat drop
Slot win increased 16.5% to $46.8 million
Best opportunities for future growth:
— High-end Asian gaming growth
— Increase in group room pricing in 2015
— Non-gaming amenities
($MM)
Adjusted Property EBITDA and Adjusted Property EBITDA Margin
Best Opportunity for Future Growth in Group Room Business and Baccarat
Actual($MM)
Hold-Normalized
$27.9
$34.1
22.1%24.8%
0%
10%
20%
30%
40%
$0
$10
$20
$30
$40
2Q14 2Q15
$128 $139
$133$148
$261 $287
$0
$100
$200
$300
2Q14 2Q15
Baccarat Non-Baccarat
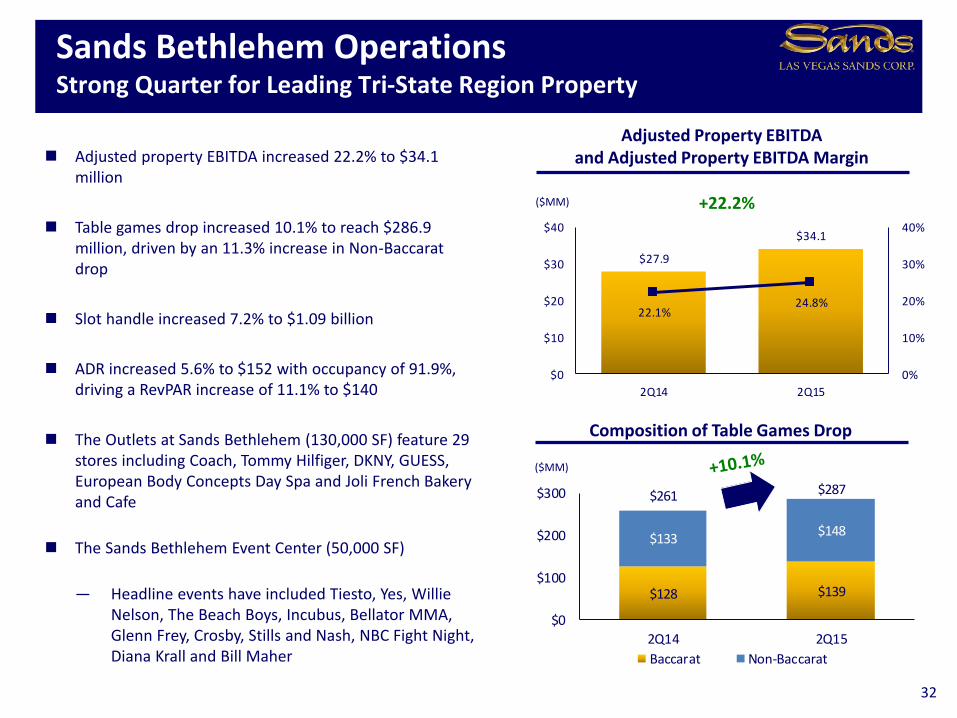
Sands Bethlehem OperationsStrong Quarter for Leading Tri-State Region Property
32
Adjusted property EBITDA increased 22.2% to $34.1 million
Table games drop increased 10.1% to reach $286.9 million, driven by an 11.3% increase in Non-Baccarat drop
Slot handle increased 7.2% to $1.09 billion
ADR increased 5.6% to $152 with occupancy of 91.9%, driving a RevPAR increase of 11.1% to $140
The Outlets at Sands Bethlehem (130,000 SF) feature 29 stores including Coach, Tommy Hilfiger, DKNY, GUESS, European Body Concepts Day Spa and Joli French Bakery and Cafe
The Sands Bethlehem Event Center (50,000 SF)
— Headline events have included Tiesto, Yes, Willie Nelson, The Beach Boys, Incubus, Bellator MMA, Glenn Frey, Crosby, Stills and Nash, NBC Fight Night, Diana Krall and Bill Maher
($MM)
($MM)
Adjusted Property EBITDA and Adjusted Property EBITDA Margin
Composition of Table Games Drop
Macao Market Background and Infrastructure Slides
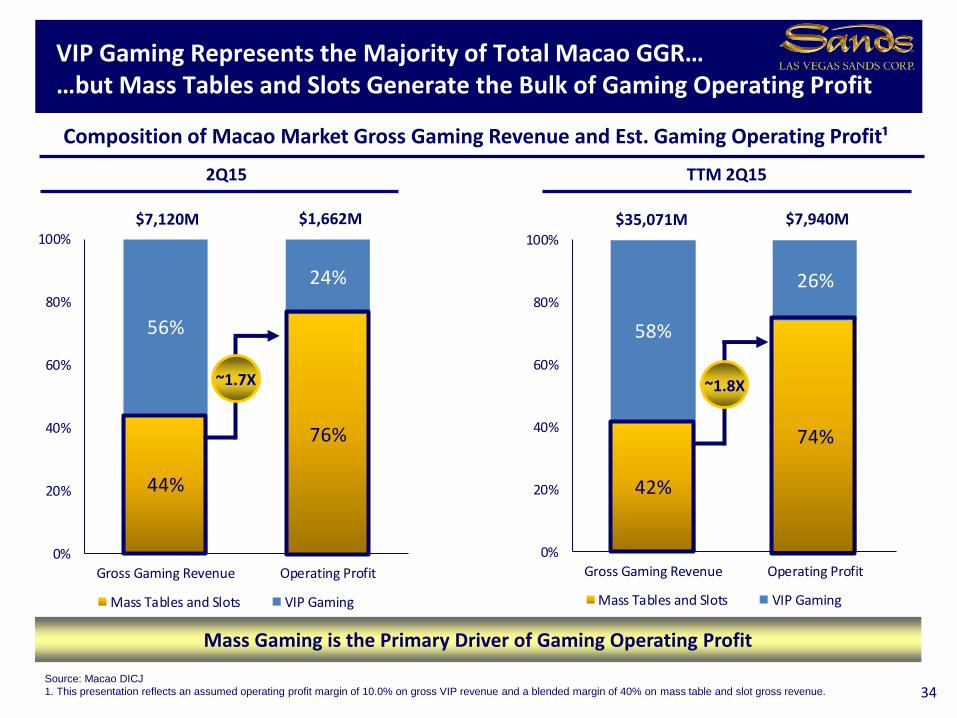
42%
74%
58%
26%
0%
20%
40%
60%
80%
100%
Gross Gaming Revenue Operating Profit
Mass Tables and Slots VIP Gaming
VIP Gaming Represents the Majority of Total Macao GGR……but Mass Tables and Slots Generate the Bulk of Gaming Operating Profit
Composition of Macao Market Gross Gaming Revenue and Est. Gaming Operating Profit¹
Source: Macao DICJ
1. This presentation reflects an assumed operating profit margin of 10.0% on gross VIP revenue and a blended margin of 40% on mass table and slot gross revenue.
Mass Gaming is the Primary Driver of Gaming Operating Profit
34
~1.8X
2Q15 TTM 2Q15
44%
76%
56%
24%
0%
20%
40%
60%
80%
100%
Gross Gaming Revenue Operating Profit
Mass Tables and Slots VIP Gaming
~1.7X
$35,071M $7,940M$7,120M $1,662M
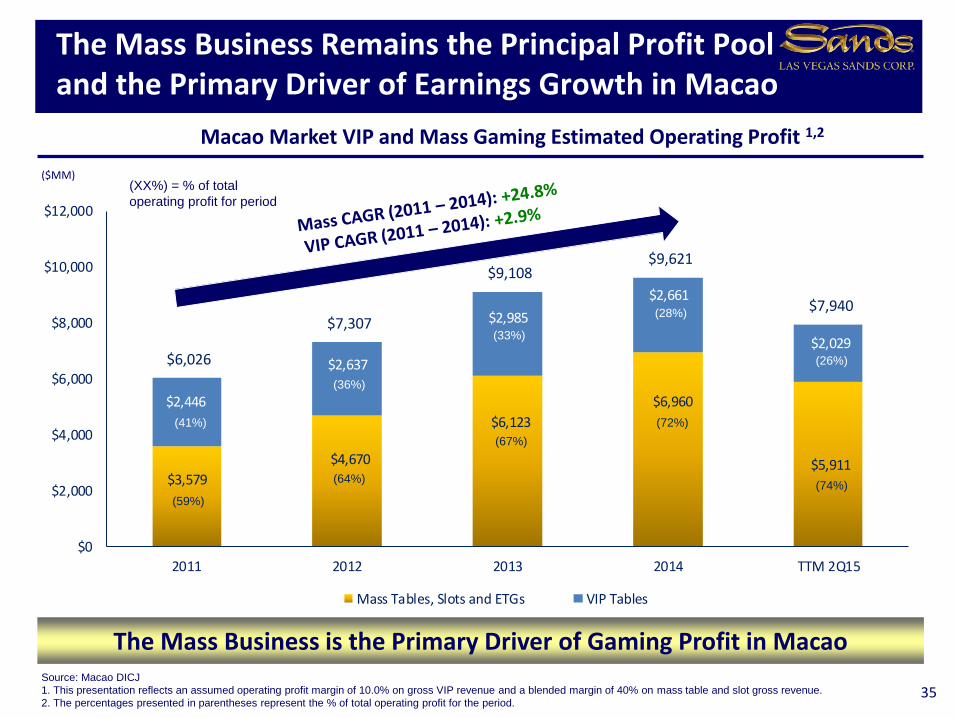
$3,579
$4,670
$6,123
$6,960
$5,911
$2,446
$2,637
$2,985
$2,661
$2,029 $6,026
$7,307
$9,108 $9,621
$7,940
$0
$2,000
$4,000
$6,000
$8,000
$10,000
$12,000
2011 2012 2013 2014 TTM 2Q15
Mass Tables, Slots and ETGs VIP Tables
Macao Market VIP and Mass Gaming Estimated Operating Profit 1,2
The Mass Business Remains the Principal Profit Pool and the Primary Driver of Earnings Growth in Macao
($MM)
Source: Macao DICJ
1. This presentation reflects an assumed operating profit margin of 10.0% on gross VIP revenue and a blended margin of 40% on mass table and slot gross revenue.
2. The percentages presented in parentheses represent the % of total operating profit for the period.
The Mass Business is the Primary Driver of Gaming Profit in Macao
35
(59%)
(64%)
(67%)
(72%)(41%)
(36%)
(33%)
(28%)
(XX%) = % of total
operating profit for period
(74%)
(26%)
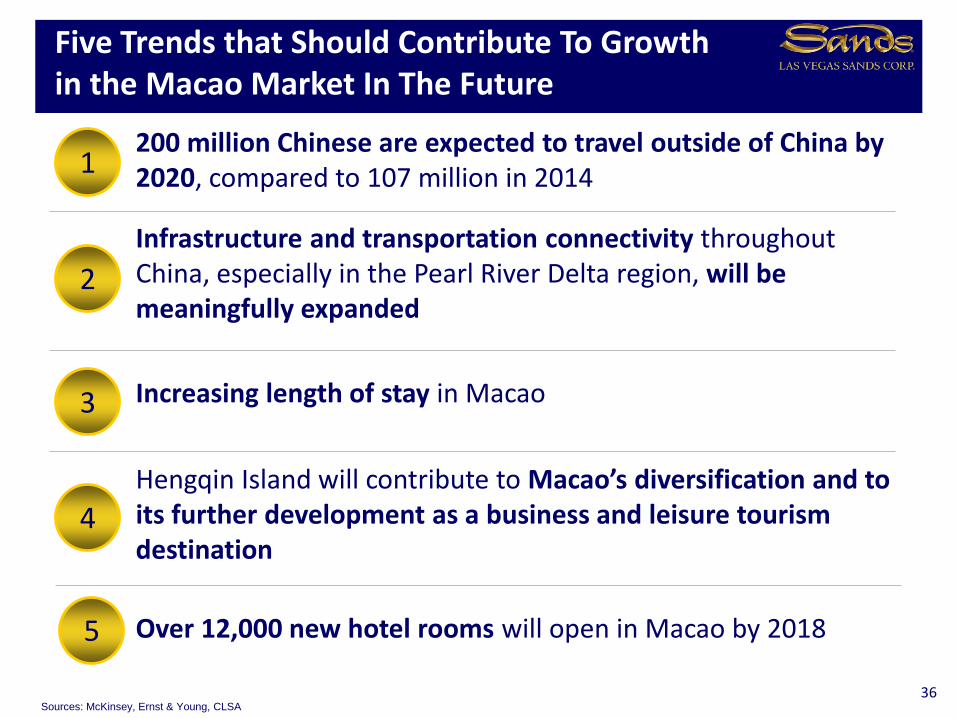
Five Trends that Should Contribute To Growth in the Macao Market In The Future
1
2
3
4
5
200 million Chinese are expected to travel outside of China by 2020, compared to 107 million in 2014
Infrastructure and transportation connectivity throughout China, especially in the Pearl River Delta region, will be meaningfully expanded
Increasing length of stay in Macao
Hengqin Island will contribute to Macao’s diversification and to its further development as a business and leisure tourism destination
Over 12,000 new hotel rooms will open in Macao by 2018
Sources: McKinsey, Ernst & Young, CLSA
36
0%
5%
10%
15%
20%
25%
30%
35%
40%
45%
50%
'56 '60 '64 '68 '72 '76 '80 '84 '88 '92 '96 '00 '04 '08 '12$4
$8 $11 $14
$15 $22
$30 $44
$55
$70
$102
$120
5
5 9 12
2031
414857
73
8397
108119
132
147
163
180
200
$138
$157
$179
$205
$234
$268
$306
0
50
100
150
200
250
300
350
'95 '97 '99 '01 '03 '05 '07 '09 '11 '13 '15 '17 '19
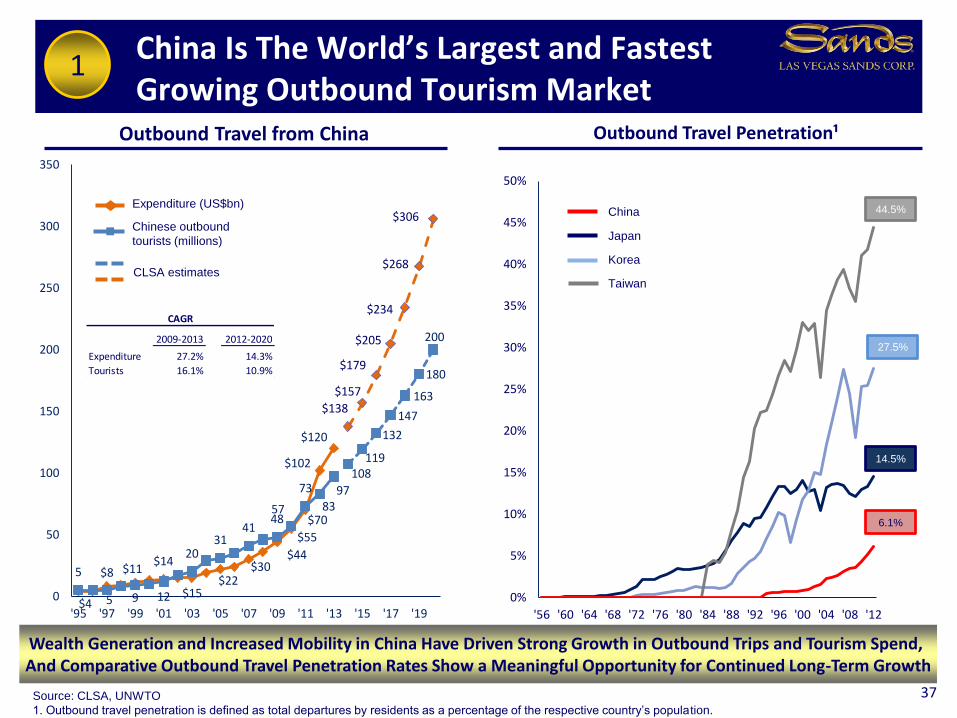
Outbound Travel from China
China Is The World’s Largest and Fastest Growing Outbound Tourism Market
37
Outbound Travel Penetration¹
Wealth Generation and Increased Mobility in China Have Driven Strong Growth in Outbound Trips and Tourism Spend, And Comparative Outbound Travel Penetration Rates Show a Meaningful Opportunity for Continued Long-Term Growth
Expenditure (US$bn)
Chinese outbound
tourists (millions)
CLSA estimates
Source: CLSA, UNWTO
1. Outbound travel penetration is defined as total departures by residents as a percentage of the respective country’s population.
1
China
Japan
Taiwan
Korea
2009-2013 2012-2020
Expenditure 27.2% 14.3%
Tourists 16.1% 10.9%
CAGR
44.5%
27.5%
14.5%
6.1%
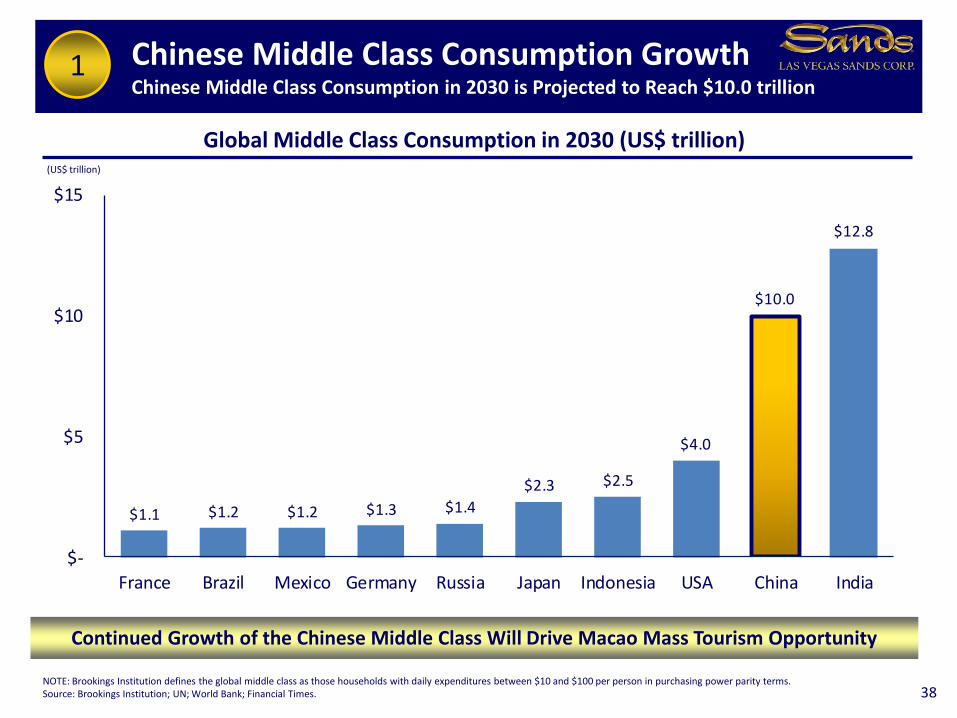
$1.1 $1.2 $1.2 $1.3 $1.4
$2.3 $2.5
$4.0
$10.0
$12.8
$-
$5
$10
$15
France Brazil Mexico Germany Russia Japan Indonesia USA China India
Chinese Middle Class Consumption GrowthChinese Middle Class Consumption in 2030 is Projected to Reach $10.0 trillion
38
Global Middle Class Consumption in 2030 (US$ trillion)
NOTE: Brookings Institution defines the global middle class as those households with daily expenditures between $10 and $100 per person in purchasing power parity terms.Source: Brookings Institution; UN; World Bank; Financial Times.
Continued Growth of the Chinese Middle Class Will Drive Macao Mass Tourism Opportunity
1
(US$ trillion)
Xinjiang
Tibet
Qinghai
SichuanChongqing
Henan
Hubei
ShanxiHebei
Shandong
Beijing
Liaoning
Jilin
Heilongjiang
Jiangsu
Anhui
Hunan Jiangxi
Zhejiang
Guangxi
Guizhou
Yunnan
Ningxia
Shaanxi
Inner Mongolia
Gansu
Guangdong
Fujian
Shanghai
Tianjin
Hong Kong
Macao
Twelve Months Ended May 31, Population GDP Per Penetration
Province 2014 2015 % Change (MM) Capita (US$) Rate
Guangdong 8,502,545 9,085,790 +7% 104 $9,452 8.7%
Fujian 807,691 905,123 +12% 37 $9,342 2.5%
Hunan 697,160 780,205 +12% 66 $5,936 1.2%
Hubei 601,824 678,165 +13% 58 $6,881 1.2%
Zhejiang 670,044 677,576 +1% 54 $11,054 1.2%
Jiangsu 540,950 563,493 +4% 79 $12,047 0.7%
Guangxi 428,131 530,770 +24% 46 $4,939 1.2%
Shanghai 544,835 528,283 -3% 23 $14,547 2.3%
Henan 420,480 482,784 +15% 94 $5,518 0.5%
Jiangxi 400,273 459,605 +15% 45 $5,130 1.0%
Sichuan 381,694 402,482 +5% 80 $5,240 0.5%
Beijing 376,312 365,480 -3% 20 $15,051 1.9%
Hebei 284,247 343,576 +21% 72 $6,251 0.5%
Liaoning 325,372 339,430 +4% 44 $9,961 0.8%
Heilongjiang 271,009 309,190 +14% 38 $6,057 0.8%
Shandong 280,095 303,077 +8% 96 $9,094 0.3%
Chongqing 238,046 257,073 +8% 30 $6,910 0.9%
All Other 4,036,827 3,972,896 -2% 407 N/A 1.0%
Subtotal (Excluding
Guangdong)11,304,990 11,899,208 +5% 1,288 $6,617 0.9%
Mainland China 19,807,535 20,984,998 +6% 1,392 $6,767 1.5%
39NOTE: Penetration rates assume that each visitor to Macao from Mainland China is a unique visitor.Source: Macao DSEC; National Bureau of Statistics of China; LVS Estimates
Year-Over-Year Visitation Growth Mainland Chinese Visitation to Macao
Greater than 20%
Data Not Available-10% - 0%
0% - 10%
10% - 20%
Strong Growth in Mainland Chinese Visitation to MacaoStrongest Growth Realized in Provinces Served by High Speed Rail
1
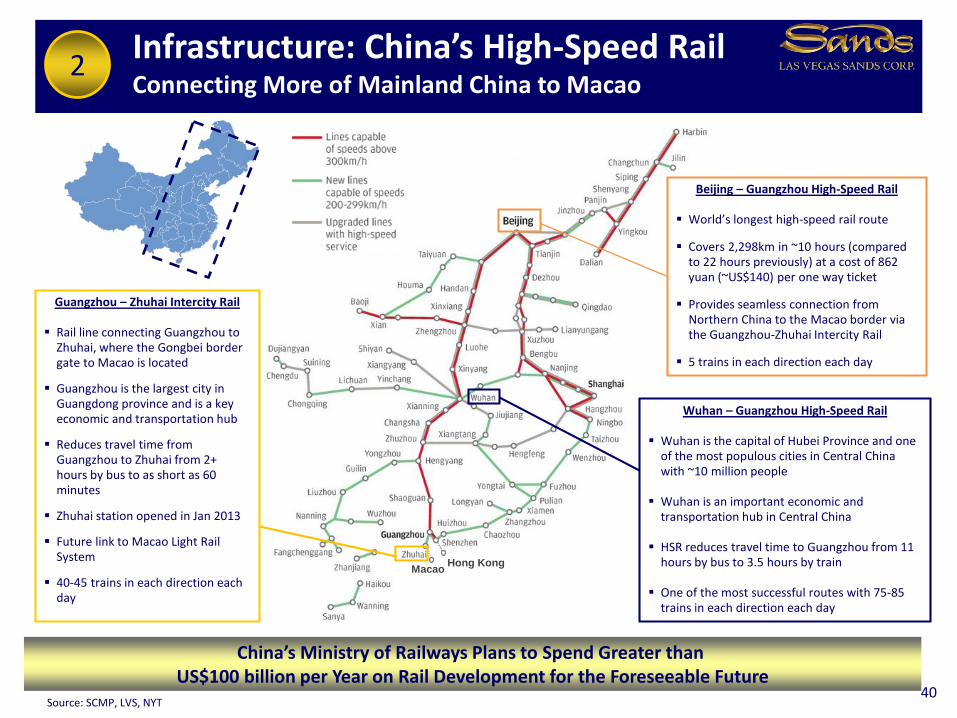
Infrastructure: China’s High-Speed RailConnecting More of Mainland China to Macao
Source: SCMP, LVS, NYT40
2
China’s Ministry of Railways Plans to Spend Greater than US$100 billion per Year on Rail Development for the Foreseeable Future
Beijing – Guangzhou High-Speed Rail
World’s longest high-speed rail route
Covers 2,298km in ~10 hours (compared to 22 hours previously) at a cost of 862 yuan (~US$140) per one way ticket
Provides seamless connection from Northern China to the Macao border via the Guangzhou-Zhuhai Intercity Rail
5 trains in each direction each day
Guangzhou – Zhuhai Intercity Rail
Rail line connecting Guangzhou to Zhuhai, where the Gongbei border gate to Macao is located
Guangzhou is the largest city in Guangdong province and is a key economic and transportation hub
Reduces travel time from Guangzhou to Zhuhai from 2+ hours by bus to as short as 60 minutes
Zhuhai station opened in Jan 2013
Future link to Macao Light Rail System
40-45 trains in each direction each day
Wuhan – Guangzhou High-Speed Rail
Wuhan is the capital of Hubei Province and one of the most populous cities in Central China with ~10 million people
Wuhan is an important economic and transportation hub in Central China
HSR reduces travel time to Guangzhou from 11 hours by bus to 3.5 hours by train
One of the most successful routes with 75-85 trains in each direction each day
Hong KongMacao
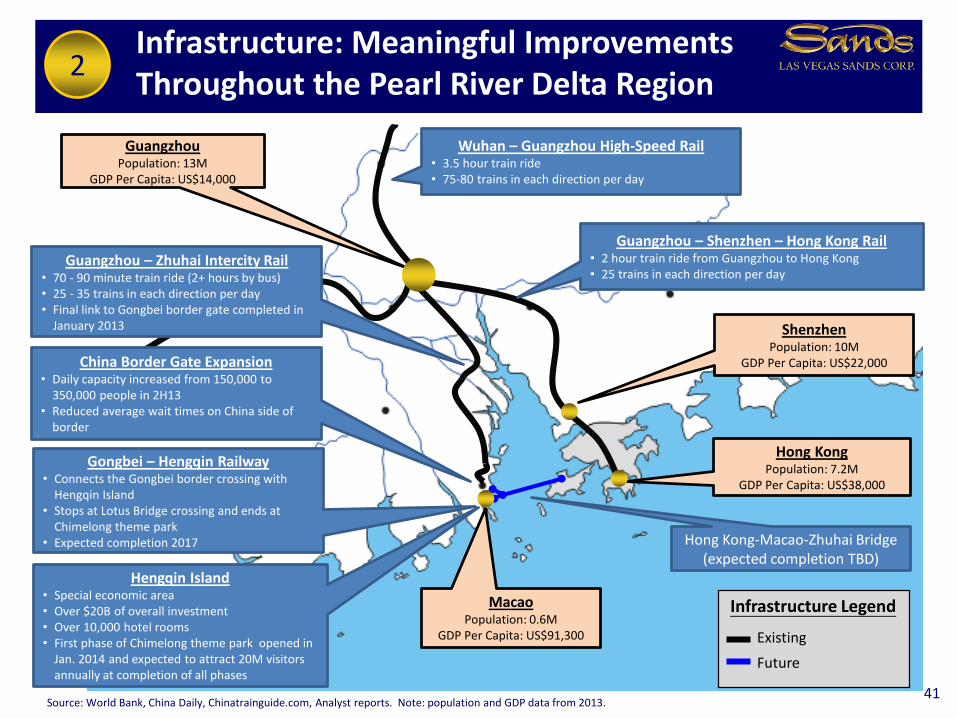
Infrastructure: Meaningful Improvements Throughout the Pearl River Delta Region
Source: World Bank, China Daily, Chinatrainguide.com, Analyst reports. Note: population and GDP data from 2013.41
GuangzhouPopulation: 13M
GDP Per Capita: US$14,000
MacaoPopulation: 0.6M
GDP Per Capita: US$91,300
Hengqin Island• Special economic area• Over $20B of overall investment• Over 10,000 hotel rooms• First phase of Chimelong theme park opened in
Jan. 2014 and expected to attract 20M visitors annually at completion of all phases
Hong KongPopulation: 7.2M
GDP Per Capita: US$38,000
Hong Kong-Macao-Zhuhai Bridge (expected completion TBD)
Wuhan – Guangzhou High-Speed Rail• 3.5 hour train ride• 75-80 trains in each direction per day
ShenzhenPopulation: 10M
GDP Per Capita: US$22,000China Border Gate Expansion• Daily capacity increased from 150,000 to
350,000 people in 2H13• Reduced average wait times on China side of
border
Guangzhou – Zhuhai Intercity Rail• 70 - 90 minute train ride (2+ hours by bus)• 25 - 35 trains in each direction per day• Final link to Gongbei border gate completed in
January 2013
Guangzhou – Shenzhen – Hong Kong Rail• 2 hour train ride from Guangzhou to Hong Kong• 25 trains in each direction per day
Infrastructure Legend
Existing
Future
Gongbei – Hengqin Railway• Connects the Gongbei border crossing with
Hengqin Island• Stops at Lotus Bridge crossing and ends at
Chimelong theme park• Expected completion 2017
2
5.2
6.3
7.3
8.1
8.9
9.79.4
0.0
2.0
4.0
6.0
8.0
10.0
12.0
2009 2010 2011 2012 2013 2014 TTM May
2015
5.8
6.9
8.8 8.8
9.7
11.5 11.6
0.0
2.0
4.0
6.0
8.0
10.0
12.0
14.0
2009 2010 2011 2012 2013 2014 TTM May
2015
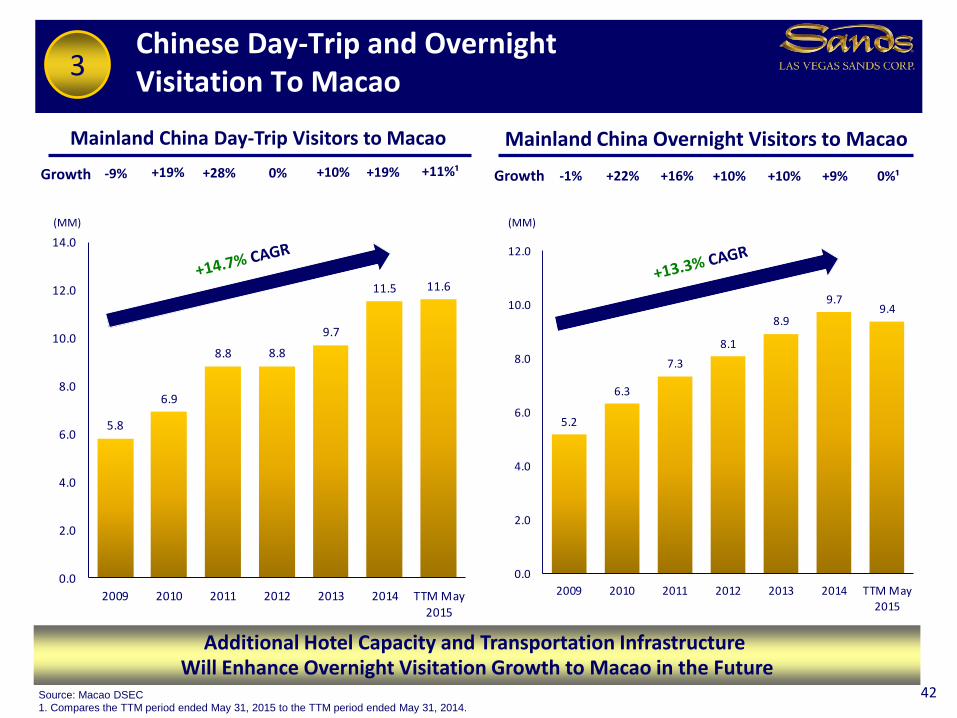
Mainland China Day-Trip Visitors to Macao Mainland China Overnight Visitors to Macao
Chinese Day-Trip and Overnight Visitation To Macao
(MM)
Source: Macao DSEC
1. Compares the TTM period ended May 31, 2015 to the TTM period ended May 31, 2014.
42
-9% +19% +28% 0%
(MM)
Growth -1% +22% +16% +10%Growth
Additional Hotel Capacity and Transportation Infrastructure Will Enhance Overnight Visitation Growth to Macao in the Future
+10% +10%
3
+19% +9%+11%¹ 0%¹
11.013.2
16.2 16.918.6
21.3
18.0
22.7
28.1
34.9
40.7
47.2
0.0
5.0
10.0
15.0
20.0
25.0
30.0
35.0
40.0
45.0
50.0
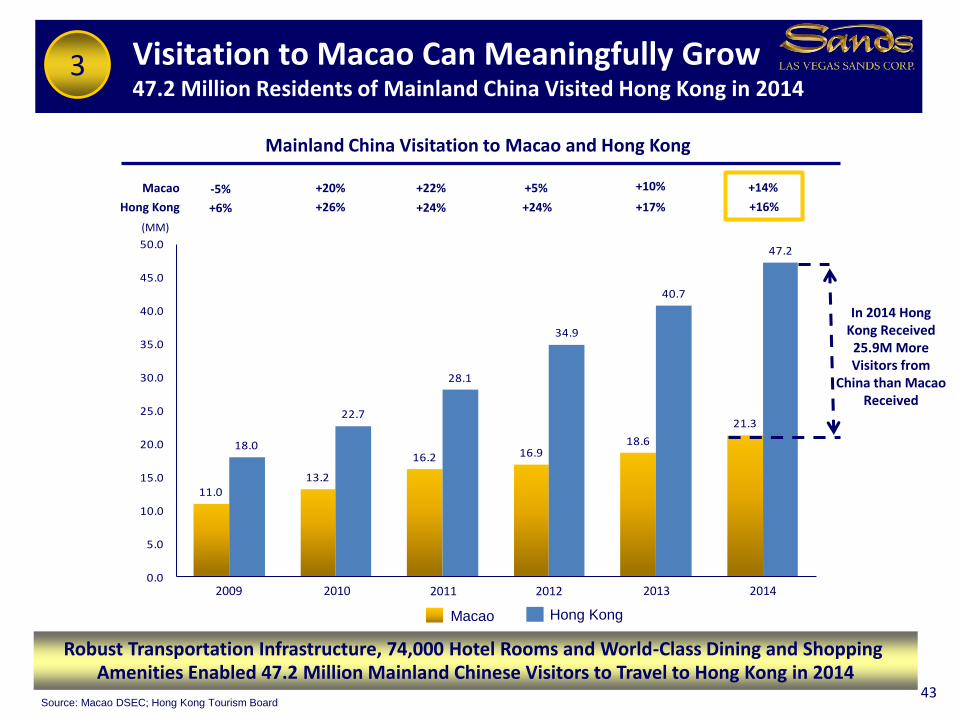
Mainland China Visitation to Macao and Hong Kong
Visitation to Macao Can Meaningfully Grow47.2 Million Residents of Mainland China Visited Hong Kong in 2014
(MM)
Source: Macao DSEC; Hong Kong Tourism Board43
-5% +20% +22% +5%Macao
+6%Hong Kong +26% +24% +24%
Robust Transportation Infrastructure, 74,000 Hotel Rooms and World-Class Dining and Shopping Amenities Enabled 47.2 Million Mainland Chinese Visitors to Travel to Hong Kong in 2014
In 2014 Hong Kong Received 25.9M More Visitors from
China than Macao Received
2009 2010 2011 2012 2013
+10%
+17%
3
Macao Hong Kong
2014
+14%
+16%
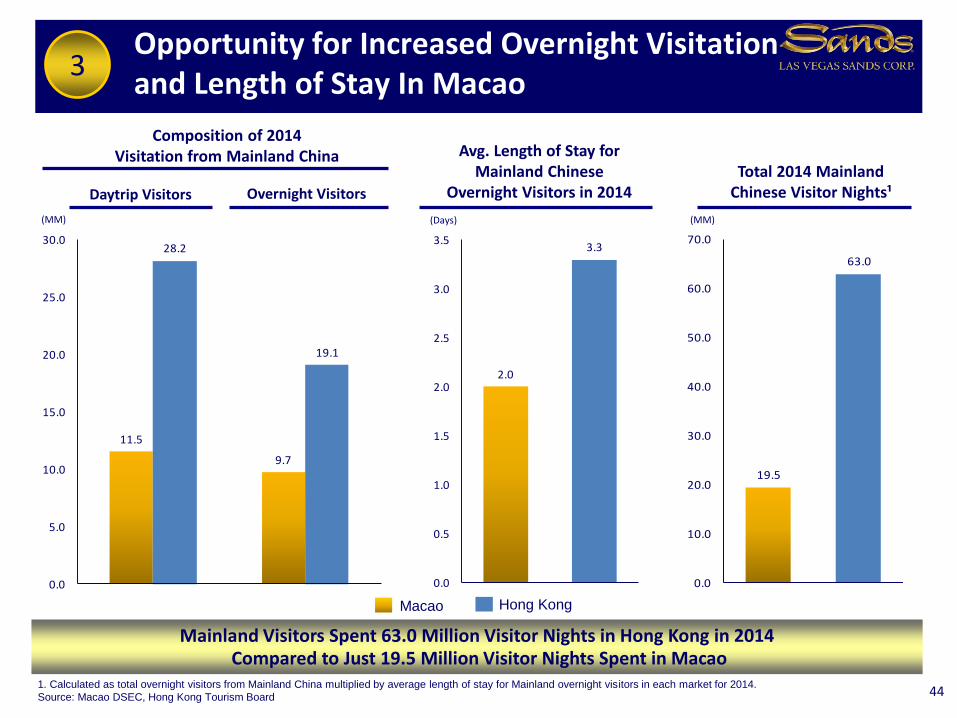
19.5
63.0
0.0
10.0
20.0
30.0
40.0
50.0
60.0
70.0
2.0
3.3
0.0
0.5
1.0
1.5
2.0
2.5
3.0
3.5
(Days)
Total 2014 Mainland Chinese Visitor Nights¹
(MM)(MM)
Daytrip Visitors
Opportunity for Increased Overnight Visitation and Length of Stay In Macao
441. Calculated as total overnight visitors from Mainland China multiplied by average length of stay for Mainland overnight visitors in each market for 2014.
Source: Macao DSEC, Hong Kong Tourism Board
Composition of 2014 Visitation from Mainland China
Mainland Visitors Spent 63.0 Million Visitor Nights in Hong Kong in 2014Compared to Just 19.5 Million Visitor Nights Spent in Macao
Overnight Visitors
Avg. Length of Stay for Mainland Chinese
Overnight Visitors in 2014
Macao Hong Kong
3
11.5
9.7
28.2
19.1
0.0
5.0
10.0
15.0
20.0
25.0
30.0
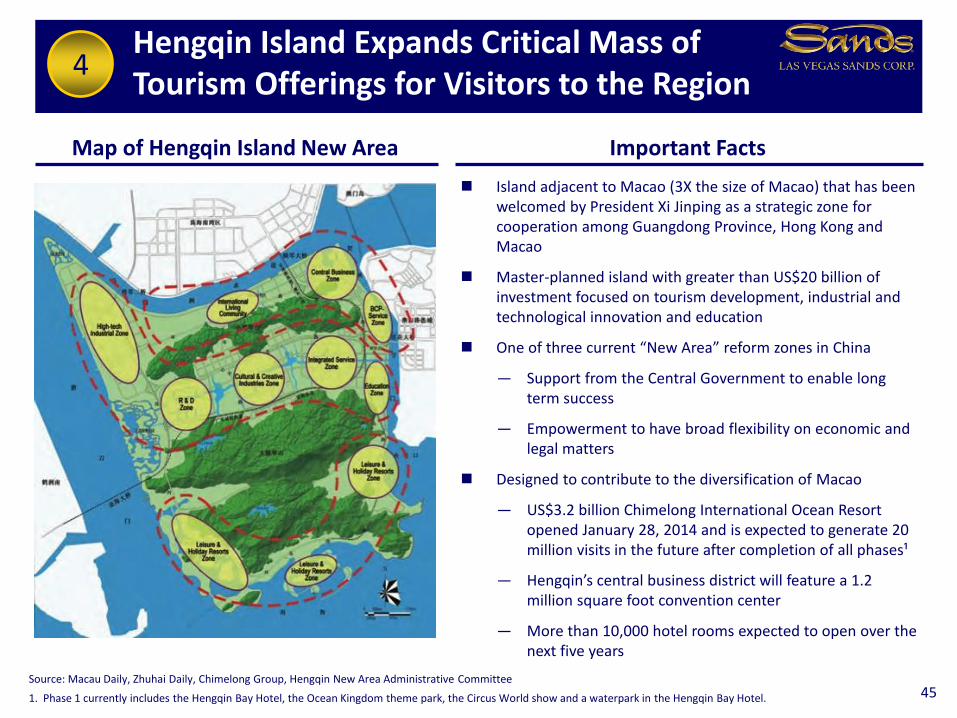
Hengqin Island Expands Critical Mass of Tourism Offerings for Visitors to the Region
45
Map of Hengqin Island New Area Important Facts
Island adjacent to Macao (3X the size of Macao) that has been welcomed by President Xi Jinping as a strategic zone for cooperation among Guangdong Province, Hong Kong and Macao
Master-planned island with greater than US$20 billion of investment focused on tourism development, industrial and technological innovation and education
One of three current “New Area” reform zones in China
— Support from the Central Government to enable long term success
— Empowerment to have broad flexibility on economic and legal matters
Designed to contribute to the diversification of Macao
— US$3.2 billion Chimelong International Ocean Resort opened January 28, 2014 and is expected to generate 20 million visits in the future after completion of all phases¹
— Hengqin’s central business district will feature a 1.2 million square foot convention center
— More than 10,000 hotel rooms expected to open over the next five years
Source: Macau Daily, Zhuhai Daily, Chimelong Group, Hengqin New Area Administrative Committee
1. Phase 1 currently includes the Hengqin Bay Hotel, the Ocean Kingdom theme park, the Circus World show and a waterpark in the Hengqin Bay Hotel.
4
Sands Cotai Central
5,723
The Venetian Macao
2,905
Sands Macao, 289
Galaxy Macau³
Phase I: 2,250Phase II: 1,350
Broadway Macau, 320Starworld, 509
City of Dreams1,461
Altira Macau, 216
Wynn Macau1,014 Grand Lisboa, 431
Sofitel Macau, 408MGM Grand, 587
9,277
4,429
1,677
1,014 839587
0
1,000
2,000
3,000
4,000
5,000
6,000
7,000
8,000
9,000
10,000
Sands China Galaxy Entertainment Melco Crown Wynn Resorts SJM Holdings² MGM China
Hotel % of Gaming % of Total
Gaming Operator Rooms Operators Market
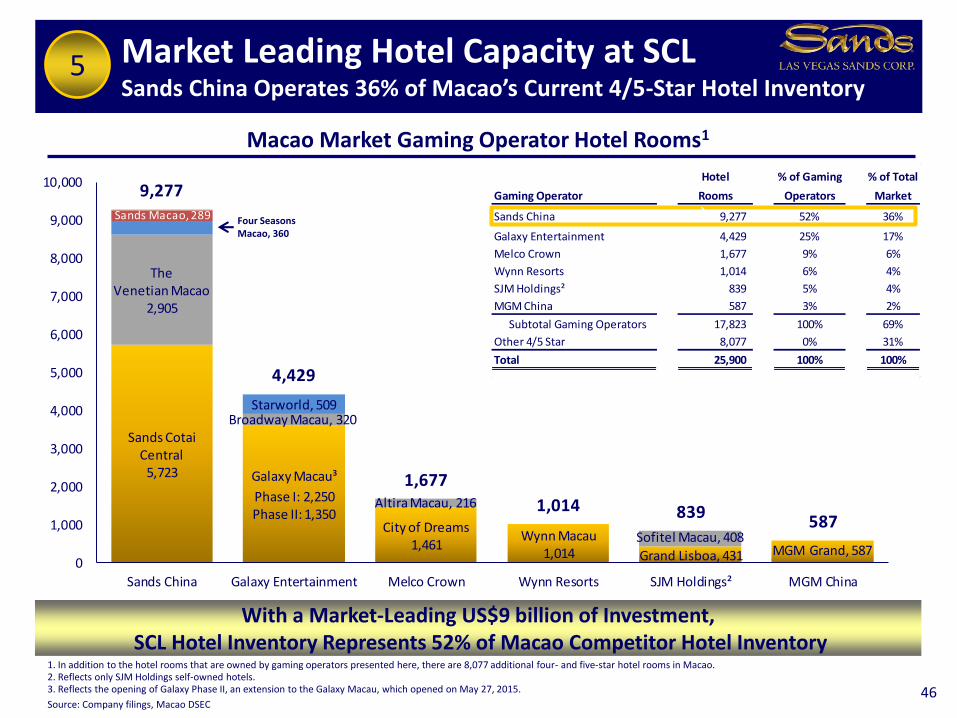
Sands China 9,277 52% 36%
Galaxy Entertainment 4,429 25% 17%
Melco Crown 1,677 9% 6%
Wynn Resorts 1,014 6% 4%
SJM Holdings² 839 5% 4%
MGM China 587 3% 2%
Subtotal Gaming Operators 17,823 100% 69%
Other 4/5 Star 8,077 0% 31%
Total 25,900 100% 100%
Market Leading Hotel Capacity at SCLSands China Operates 36% of Macao’s Current 4/5-Star Hotel Inventory
1. In addition to the hotel rooms that are owned by gaming operators presented here, there are 8,077 additional four- and five-star hotel rooms in Macao.2. Reflects only SJM Holdings self-owned hotels.3. Reflects the opening of Galaxy Phase II, an extension to the Galaxy Macau, which opened on May 27, 2015.
Source: Company filings, Macao DSEC46
With a Market-Leading US$9 billion of Investment,SCL Hotel Inventory Represents 52% of Macao Competitor Hotel Inventory
Macao Market Gaming Operator Hotel Rooms1
Four Seasons Macao, 360
5
`
Sands Cotai Central
5,723
The Venetian Macao
2,905
Sands Macao, 289
The Parisian Macao3,000
Galaxy Macau³
Phase I: 2,250Phase II: 1,350
Broadway Macau, 320Starworld, 509
City of Dreams1,461
Altira Macau, 216
Macau Studio City1,600
Grand Lisboa, 431Sofitel Macau, 408
SJM Cotai2,000
Wynn Macau, 1,014
Wynn Palace1,700
MGM Grand, 587
MGM Cotai1,600
12,677
4,429
3,277 2,839 2,7142,187
0
2,000
4,000
6,000
8,000
10,000
12,000
14,000
Sands China Galaxy Entertainment Melco Crown SJM Holdings² Wynn Resorts MGM China
Hotel % of Gaming % of Total
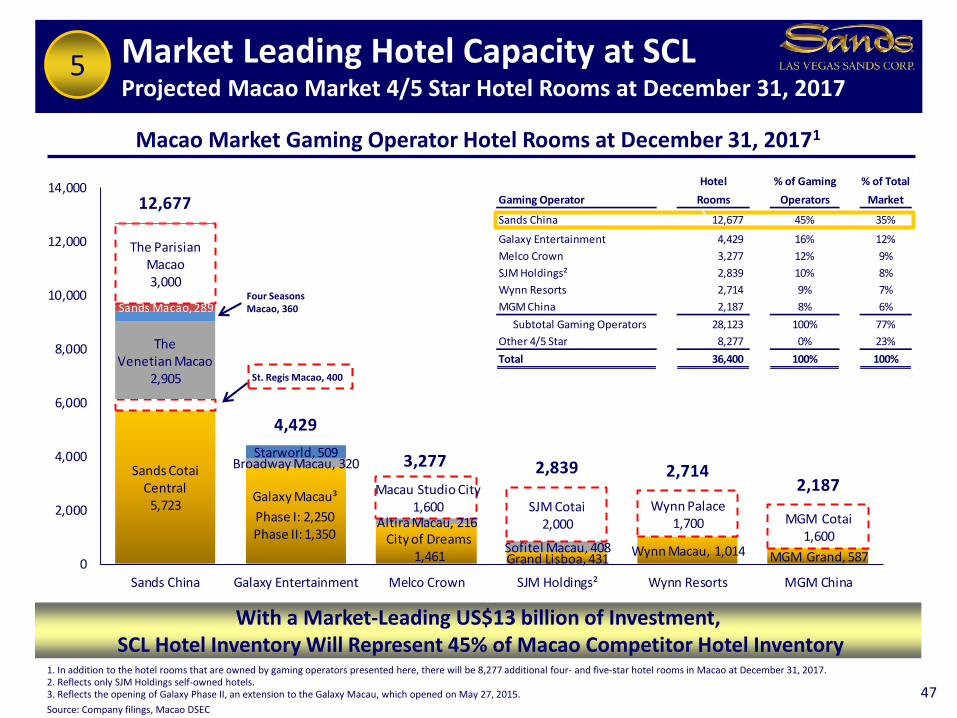
Gaming Operator Rooms Operators Market
Sands China 12,677 45% 35%
Galaxy Entertainment 4,429 16% 12%
Melco Crown 3,277 12% 9%
SJM Holdings² 2,839 10% 8%
Wynn Resorts 2,714 9% 7%
MGM China 2,187 8% 6%
Subtotal Gaming Operators 28,123 100% 77%
Other 4/5 Star 8,277 0% 23%
Total 36,400 100% 100%
1. In addition to the hotel rooms that are owned by gaming operators presented here, there will be 8,277 additional four- and five-star hotel rooms in Macao at December 31, 2017.2. Reflects only SJM Holdings self-owned hotels.3. Reflects the opening of Galaxy Phase II, an extension to the Galaxy Macau, which opened on May 27, 2015.
Source: Company filings, Macao DSEC
47
Macao Market Gaming Operator Hotel Rooms at December 31, 20171
Four Seasons Macao, 360
St. Regis Macao, 400
5
`
With a Market-Leading US$13 billion of Investment,SCL Hotel Inventory Will Represent 45% of Macao Competitor Hotel Inventory
Market Leading Hotel Capacity at SCLProjected Macao Market 4/5 Star Hotel Rooms at December 31, 2017
Supplemental Sands China Information
$7.0
$5.2
$1.0
$13.3
$2.4
$15.7
$5.3
$4.2
$0.7
$10.3
$1.9
$12.2
$0.0
$5.0
$10.0
$15.0
$20.0
VenetianMacao
Sands CotaiCentral
Plaza Casino(Four Seasons)
TotalCotai Strip
Sands Macao TotalMacao Ops
2Q14 2Q15
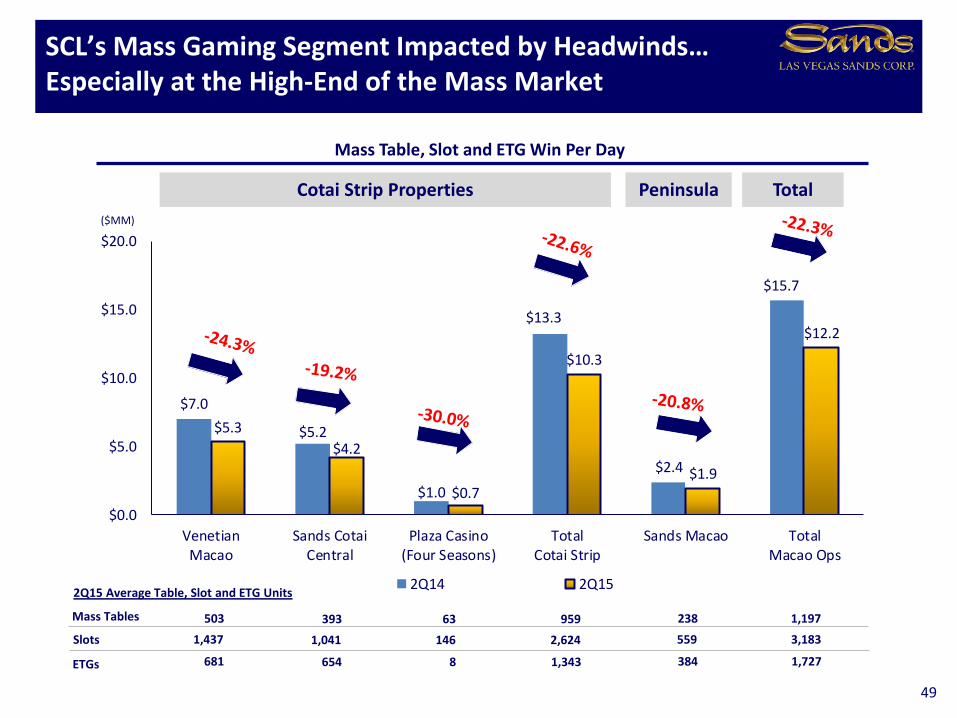
Mass Table, Slot and ETG Win Per Day
($MM)
SCL’s Mass Gaming Segment Impacted by Headwinds… Especially at the High-End of the Mass Market
49
Cotai Strip Properties Peninsula Total
Mass Tables 503 393 95963 238 1,197
Slots
ETGs
1,437 1,041 2,624146 559 3,183
681 654 1,3438 384 1,727
2Q15 Average Table, Slot and ETG Units
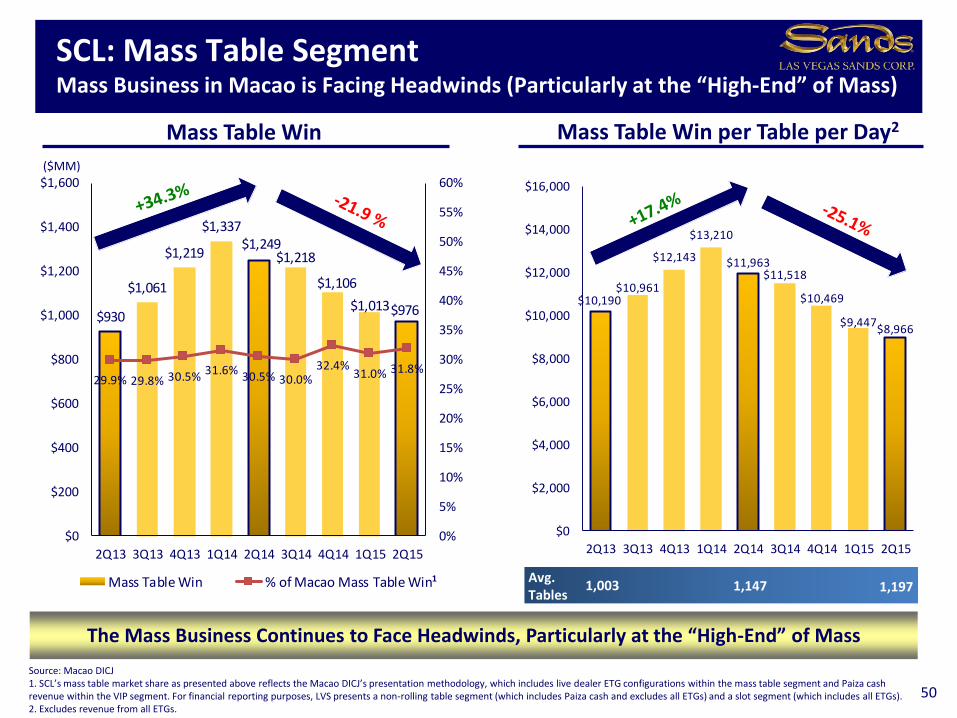
$10,190$10,961
$12,143
$13,210
$11,963$11,518
$10,469
$9,447$8,966
$0
$2,000
$4,000
$6,000
$8,000
$10,000
$12,000
$14,000
$16,000
2Q13 3Q13 4Q13 1Q14 2Q14 3Q14 4Q14 1Q15 2Q15
$930
$1,061
$1,219
$1,337$1,249
$1,218
$1,106
$1,013$976
29.9% 29.8% 30.5% 31.6% 30.5% 30.0%32.4%
31.0% 31.8%
0%
5%
10%
15%
20%
25%
30%
35%
40%
45%
50%
55%
60%
$0
$200
$400
$600
$800
$1,000
$1,200
$1,400
$1,600
2Q13 3Q13 4Q13 1Q14 2Q14 3Q14 4Q14 1Q15 2Q15
Mass Table Win % of Macao Mass Table Win
Mass Table Win Mass Table Win per Table per Day2
50
($MM)
1,197Avg. Tables
1,147
The Mass Business Continues to Face Headwinds, Particularly at the “High-End” of Mass
Source: Macao DICJ1. SCL’s mass table market share as presented above reflects the Macao DICJ’s presentation methodology, which includes live dealer ETG configurations within the mass table segment and Paiza cash revenue within the VIP segment. For financial reporting purposes, LVS presents a non-rolling table segment (which includes Paiza cash and excludes all ETGs) and a slot segment (which includes all ETGs).2. Excludes revenue from all ETGs.
SCL: Mass Table SegmentMass Business in Macao is Facing Headwinds (Particularly at the “High-End” of Mass)
11,003
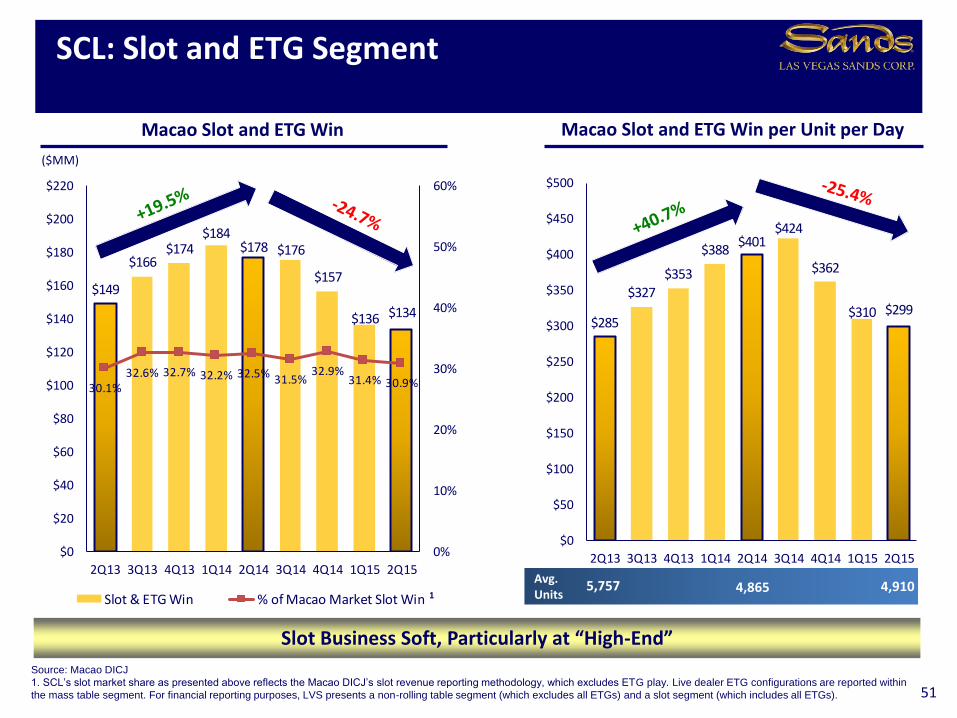
$285
$327
$353
$388$401
$424
$362
$310 $299
$0
$50
$100
$150
$200
$250
$300
$350
$400
$450
$500
2Q13 3Q13 4Q13 1Q14 2Q14 3Q14 4Q14 1Q15 2Q15
$149
$166$174
$184$178 $176
$157
$136 $134
30.1%32.6% 32.7% 32.2% 32.5% 31.5%
32.9%31.4% 30.9%
0%
10%
20%
30%
40%
50%
60%
$0
$20
$40
$60
$80
$100
$120
$140
$160
$180
$200
$220
2Q13 3Q13 4Q13 1Q14 2Q14 3Q14 4Q14 1Q15 2Q15
Slot & ETG Win % of Macao Market Slot Win
Macao Slot and ETG Win Macao Slot and ETG Win per Unit per Day
51
($MM)
4,910Avg. Units
4,865
Slot Business Soft, Particularly at “High-End”
Source: Macao DICJ
1. SCL’s slot market share as presented above reflects the Macao DICJ’s slot revenue reporting methodology, which excludes ETG play. Live dealer ETG configurations are reported within
the mass table segment. For financial reporting purposes, LVS presents a non-rolling table segment (which excludes all ETGs) and a slot segment (which includes all ETGs).
SCL: Slot and ETG Segment
15,757
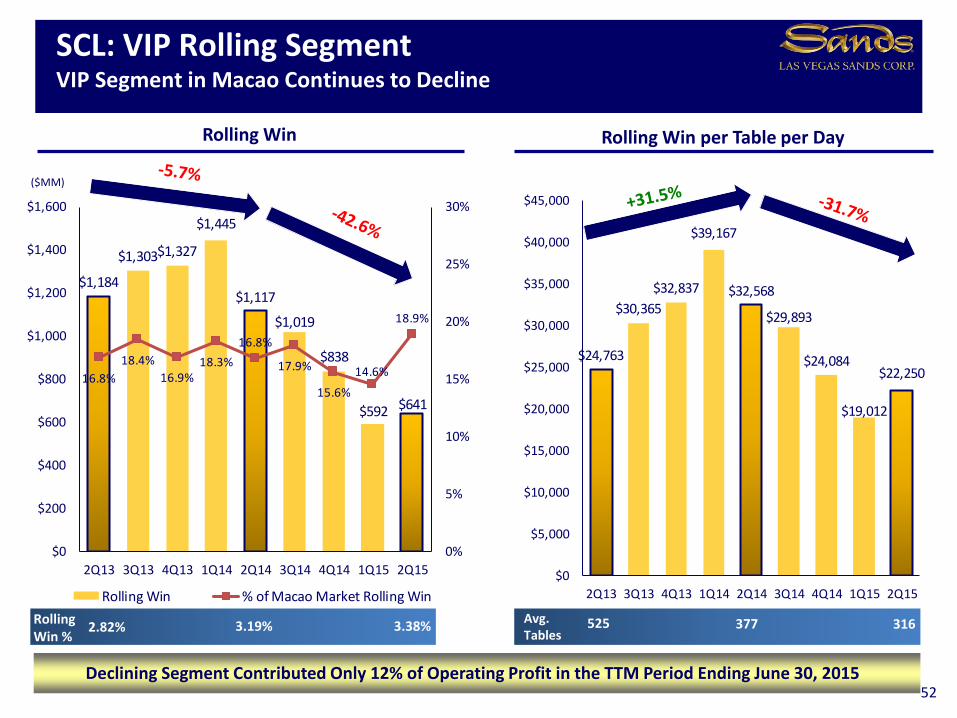
$24,763
$30,365
$32,837
$39,167
$32,568
$29,893
$24,084
$19,012
$22,250
$0
$5,000
$10,000
$15,000
$20,000
$25,000
$30,000
$35,000
$40,000
$45,000
2Q13 3Q13 4Q13 1Q14 2Q14 3Q14 4Q14 1Q15 2Q15
$1,184
$1,303$1,327
$1,445
$1,117
$1,019
$838
$592 $641
16.8%
18.4%
16.9%18.3%
16.8%
17.9%
15.6%
14.6%
18.9%
0%
5%
10%
15%
20%
25%
30%
$0
$200
$400
$600
$800
$1,000
$1,200
$1,400
$1,600
2Q13 3Q13 4Q13 1Q14 2Q14 3Q14 4Q14 1Q15 2Q15
Rolling Win % of Macao Market Rolling Win
Rolling Win per Table per Day
52
Rolling Win
316Avg. Tables
377
Declining Segment Contributed Only 12% of Operating Profit in the TTM Period Ending June 30, 2015
($MM)
SCL: VIP Rolling SegmentVIP Segment in Macao Continues to Decline
3.38%3.19%RollingWin %
5252.82%
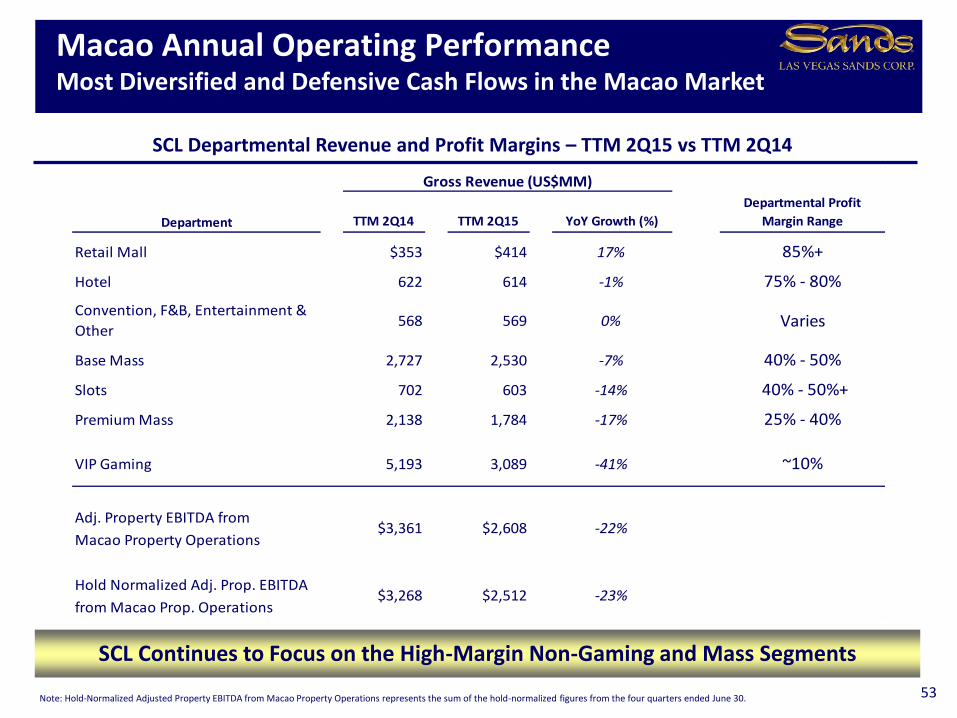
Department TTM 2Q14 TTM 2Q15 YoY Growth (%)
Departmental Profit
Margin Range
Retail Mall $353 $414 17% 85%+
Hotel 622 614 -1% 75% - 80%
Convention, F&B, Entertainment &
Other568 569 0% Varies
Base Mass 2,727 2,530 -7% 40% - 50%
Slots 702 603 -14% 40% - 50%+
Premium Mass 2,138 1,784 -17% 25% - 40%
VIP Gaming 5,193 3,089 -41% ~10%
Adj. Property EBITDA from
Macao Property Operations
Hold Normalized Adj. Prop. EBITDA
from Macao Prop. Operations-23%
Gross Revenue (US$MM)
$3,361 $2,608 -22%
$3,268 $2,512
Macao Annual Operating PerformanceMost Diversified and Defensive Cash Flows in the Macao Market
53
SCL Departmental Revenue and Profit Margins – TTM 2Q15 vs TTM 2Q14
SCL Continues to Focus on the High-Margin Non-Gaming and Mass Segments
Note: Hold-Normalized Adjusted Property EBITDA from Macao Property Operations represents the sum of the hold-normalized figures from the four quarters ended June 30.
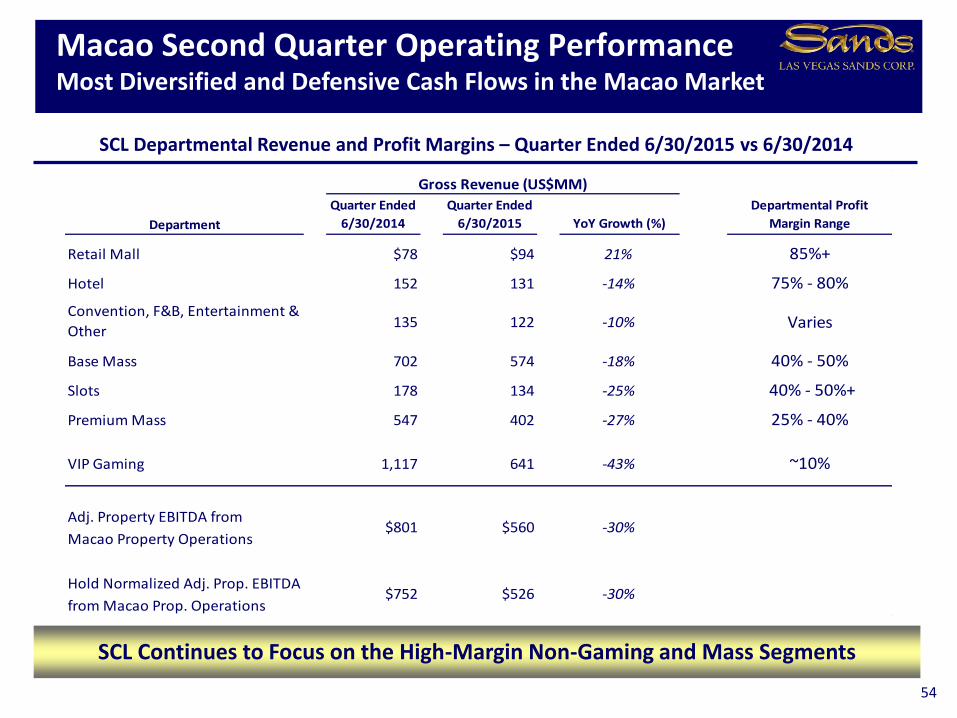
Department
Quarter Ended
6/30/2014
Quarter Ended
6/30/2015 YoY Growth (%)
Departmental Profit
Margin Range
Retail Mall $78 $94 21% 85%+
Hotel 152 131 -14% 75% - 80%
Convention, F&B, Entertainment &
Other135 122 -10% Varies
Base Mass 702 574 -18% 40% - 50%
Slots 178 134 -25% 40% - 50%+
Premium Mass 547 402 -27% 25% - 40%
VIP Gaming 1,117 641 -43% ~10%
Adj. Property EBITDA from
Macao Property Operations
Hold Normalized Adj. Prop. EBITDA
from Macao Prop. Operations
Gross Revenue (US$MM)
$801 $560 -30%
$752 $526 -30%
Macao Second Quarter Operating PerformanceMost Diversified and Defensive Cash Flows in the Macao Market
54
SCL Departmental Revenue and Profit Margins – Quarter Ended 6/30/2015 vs 6/30/2014
SCL Continues to Focus on the High-Margin Non-Gaming and Mass Segments
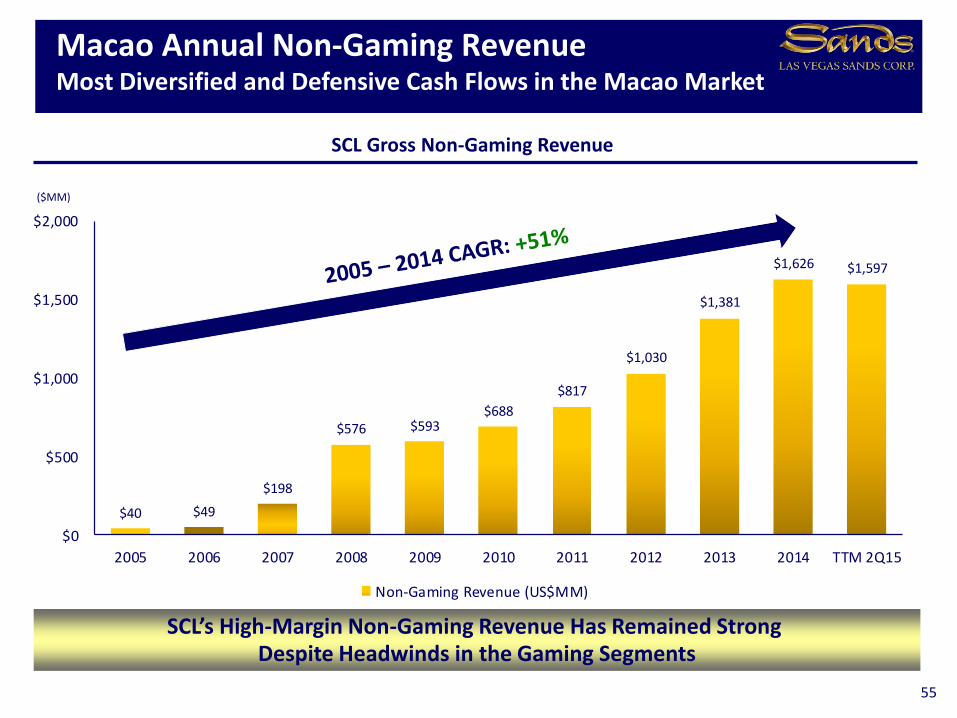
$40 $49
$198
$576 $593$688
$817
$1,030
$1,381
$1,626 $1,597
$0
$500
$1,000
$1,500
$2,000
2005 2006 2007 2008 2009 2010 2011 2012 2013 2014 TTM 2Q15
Non-Gaming Revenue (US$MM)
Macao Annual Non-Gaming RevenueMost Diversified and Defensive Cash Flows in the Macao Market
55
($MM)
SCL Gross Non-Gaming Revenue
SCL’s High-Margin Non-Gaming Revenue Has Remained Strong Despite Headwinds in the Gaming Segments