Embed Size (px)
Citation preview
CustomerExperienceModeling
Zbigniew Nowicki
Customer Experience Management
2
Key facts about opiniac.com platform
3
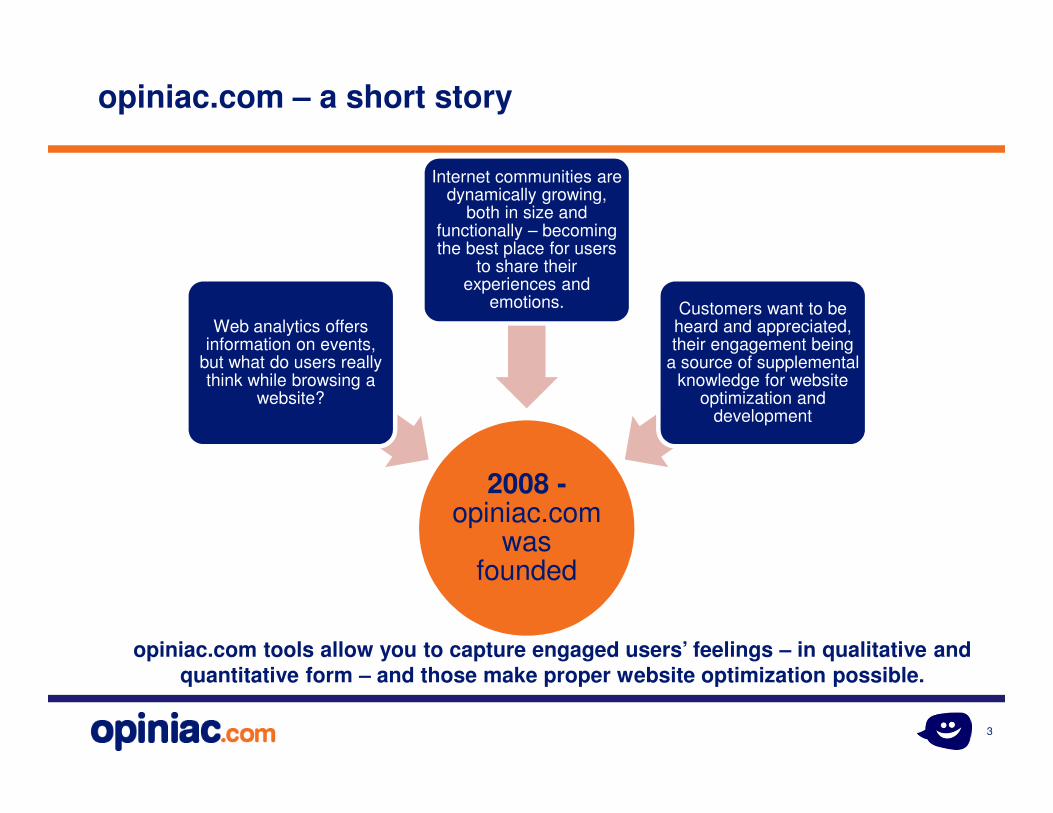
opiniac.com – a short story
2008 -opiniac.com
was founded
Web analytics offers information on events,
but what do users really think while browsing a
website?
Internet communities are dynamically growing,
both in size and functionally – becoming the best place for users
to share their experiences and
emotions. Customers want to be heard and appreciated, their engagement being
a source of supplemental knowledge for website
optimization and development
opiniac.com tools allow you to capture engaged users’ feelings – in qualitative and quantitative form – and those make proper website optimization possible.
4
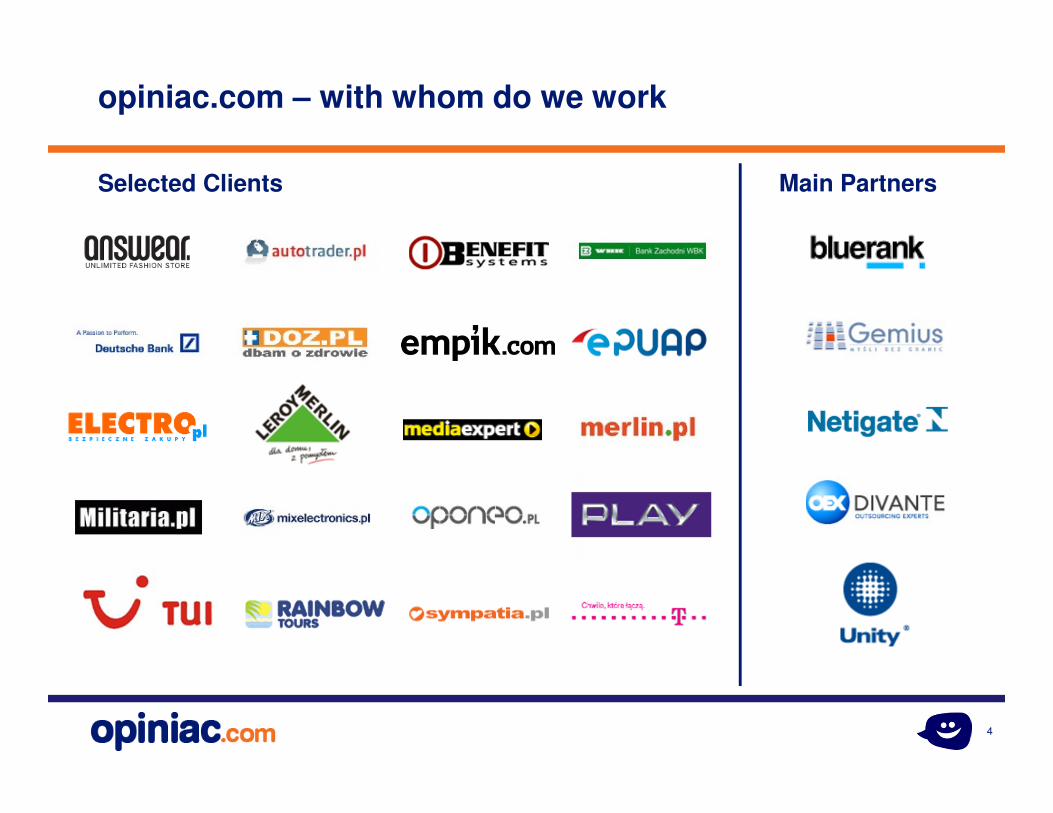
Selected Clients Main Partners
opiniac.com – with whom do we work
5
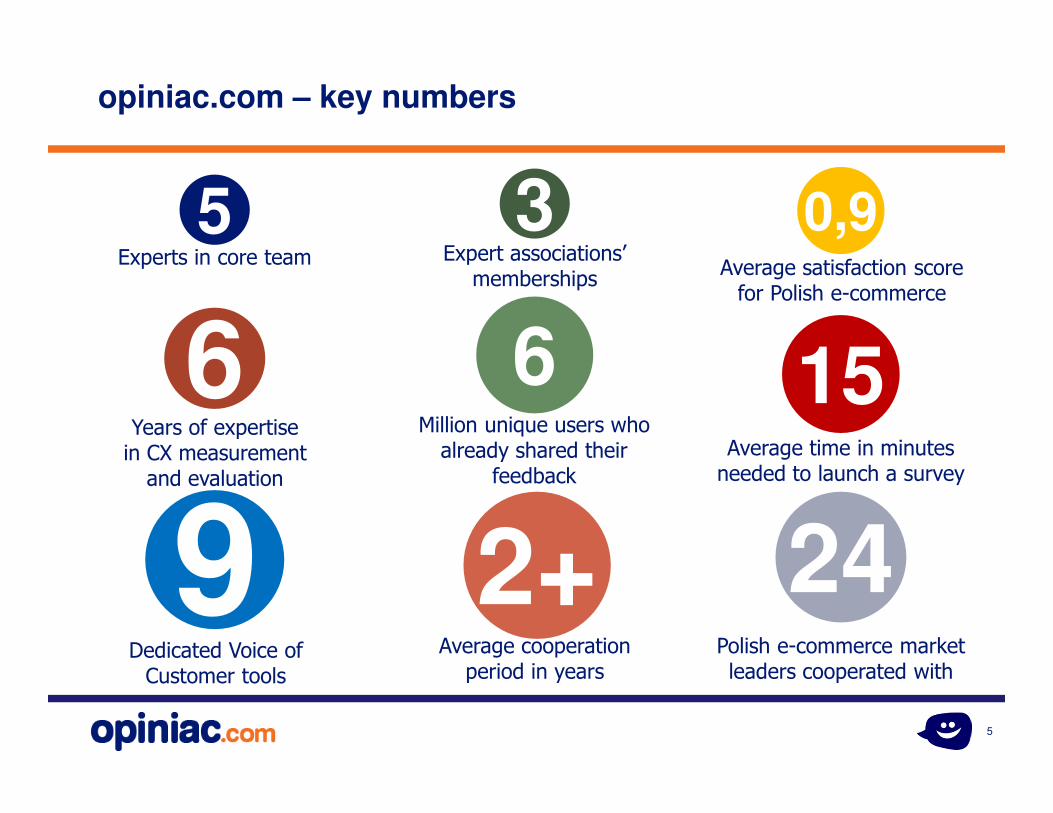
opiniac.com – key numbers
6Years of expertisein CX measurement
and evaluation of CX
5Experts in core team
24Polish e-commerce market leaders cooperated with
9Dedicated Voice of Customer tools
0,9Average satisfaction score for Polish e-commerce
2+Average cooperation
period in years
3Expert associations’
memberships
6Million unique users who
already shared their feedback
15Average time in minutes needed to launch a survey
6
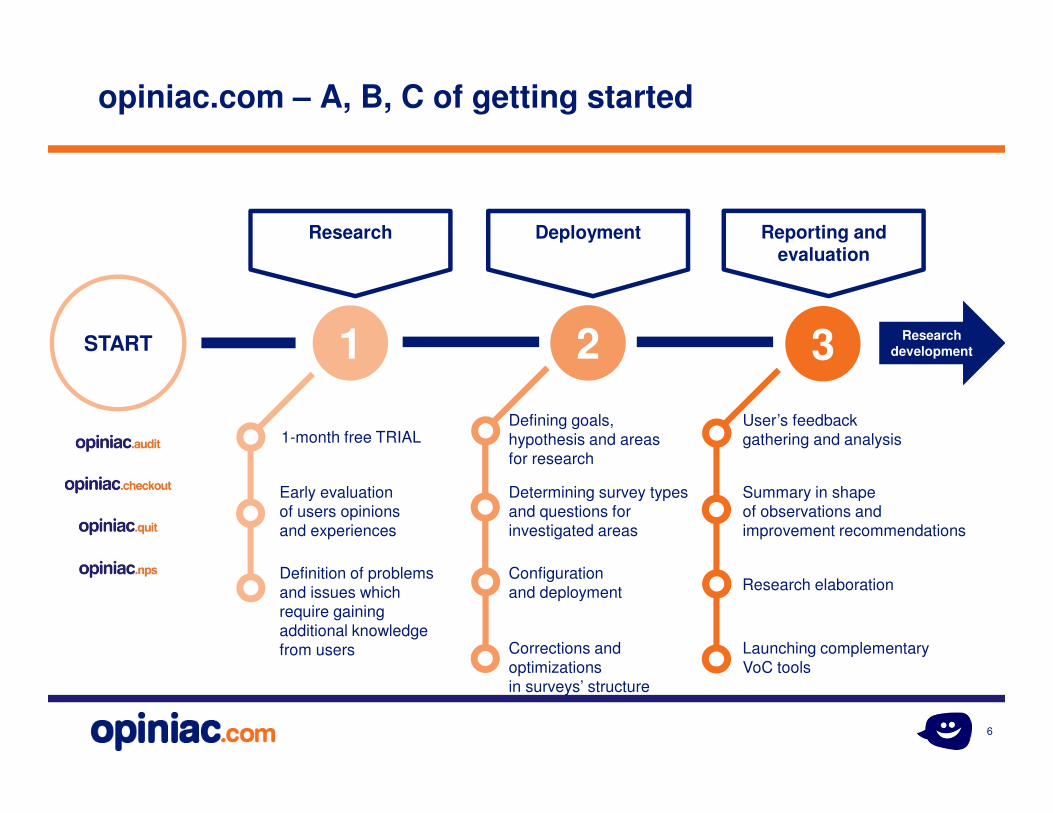
opiniac.com – A, B, C of getting started
START 1
Research
2
Deployment
3
Reporting and evaluation
1-month free TRIAL
Early evaluation
of users opinions
and experiences
Definition of problems
and issues which
require gaining
additional knowledge
from users
Defining goals,
hypothesis and areas
for research
Determining survey types
and questions for
investigated areas
Configuration
and deployment
Corrections and
optimizations
in surveys’ structure
User’s feedback
gathering and analysis
Summary in shape
of observations and
improvement recommendations
Research elaboration
Launching complementary
VoC tools
Research development
7
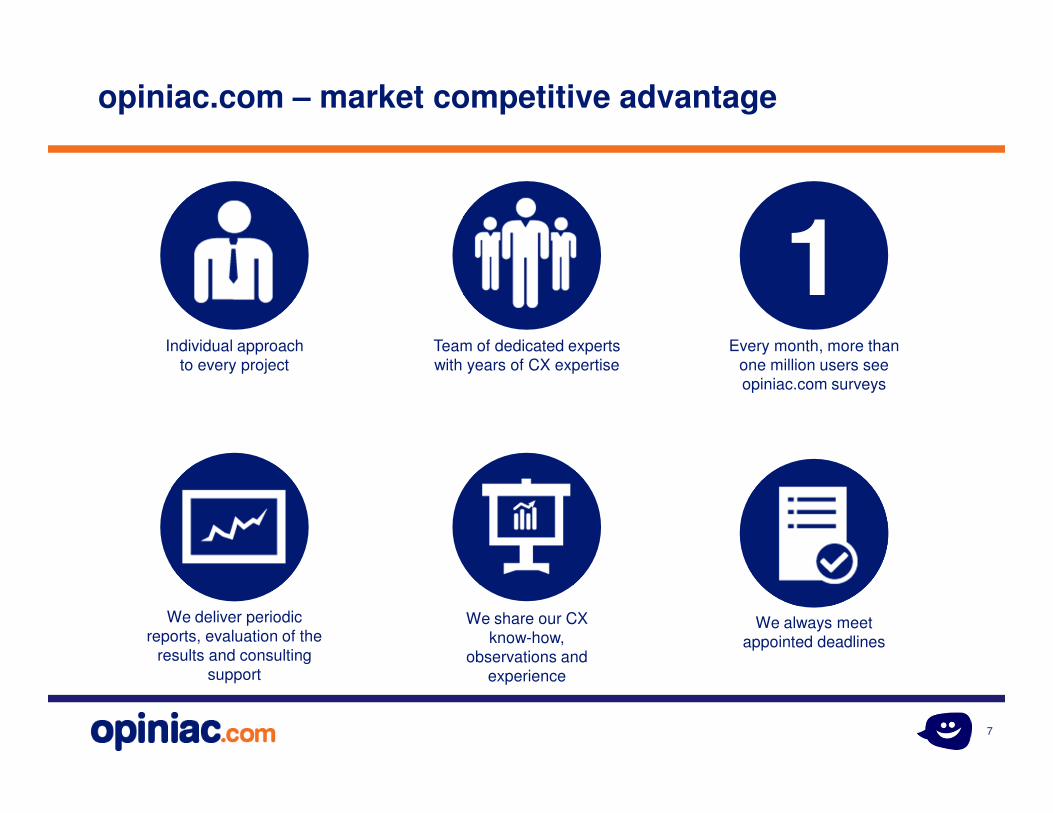
opiniac.com – market competitive advantage
1Every month, more than
one million users see
opiniac.com surveys
We always meet
appointed deadlines
Team of dedicated experts
with years of CX expertise
We share our CX
know-how,
observations and
experience
Individual approach
to every project
We deliver periodic
reports, evaluation of the
results and consulting
support
8
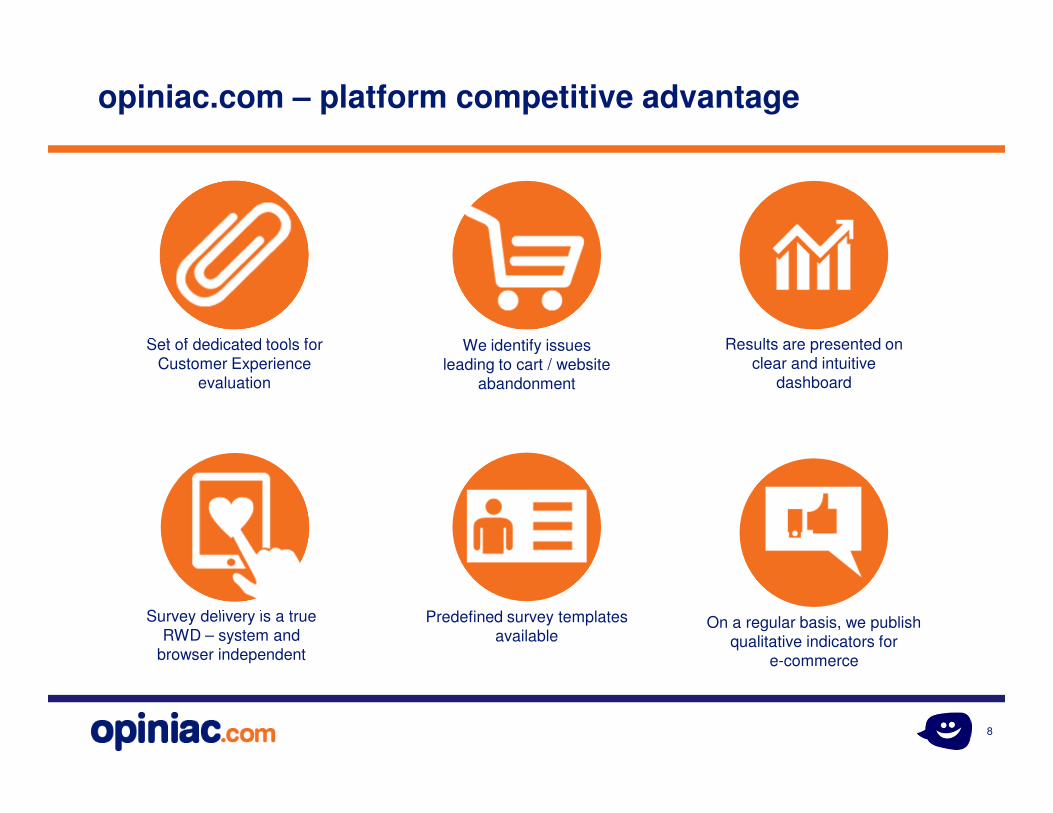
opiniac.com – platform competitive advantage
Results are presented on
clear and intuitive
dashboard
Set of dedicated tools for
Customer Experience
evaluation
Survey delivery is a true
RWD – system and
browser independent
Predefined survey templates
availableOn a regular basis, we publish
qualitative indicators for
e-commerce
We identify issues
leading to cart / website
abandonment
9
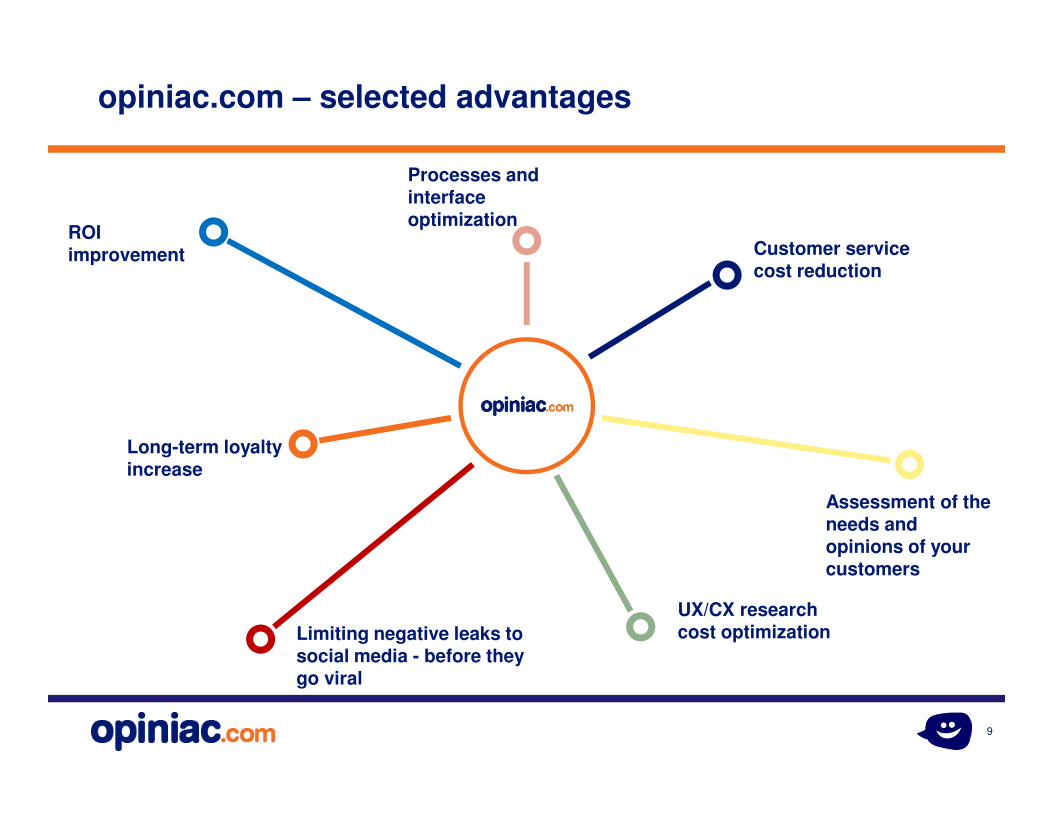
opiniac.com – selected advantages
ROI improvement
Processes and interface optimization
Customer service cost reduction
Assessment of the needs and opinions of your customers
UX/CX research cost optimization Limiting negative leaks to
social media - before they go viral
Long-term loyalty increase
10
More on what, how and why
11
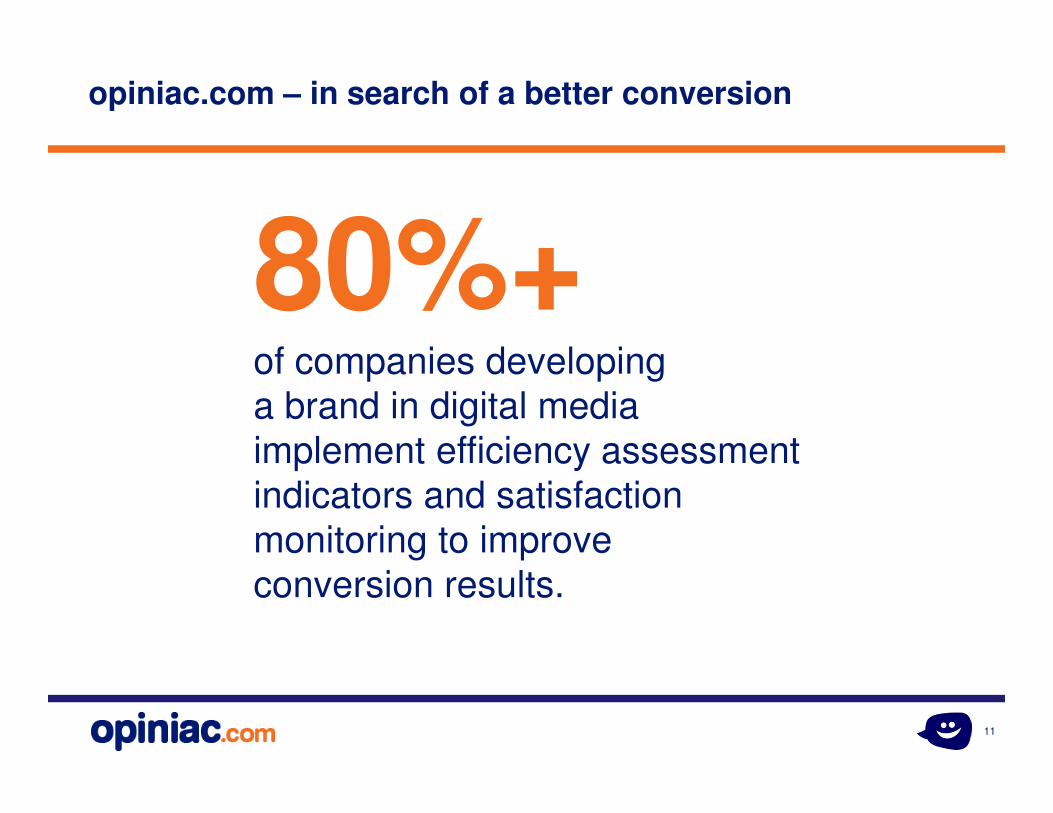
opiniac.com – in search of a better conversion
80%+of companies developing
a brand in digital media
implement efficiency assessment
indicators and satisfaction
monitoring to improve
conversion results.
12
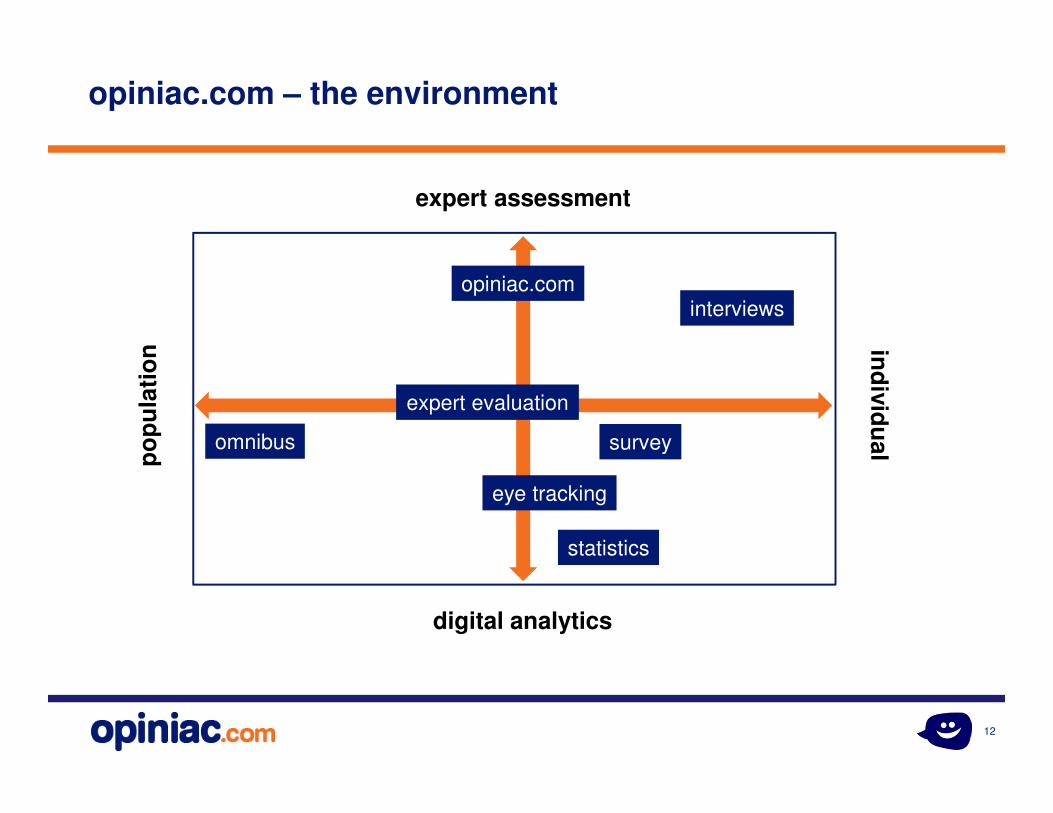
opiniac.com – the environment
expert assessment
digital analytics
po
pu
lati
on in
div
idu
alsurvey
statistics
interviews
eye tracking
opiniac.com
expert evaluation
omnibus
13
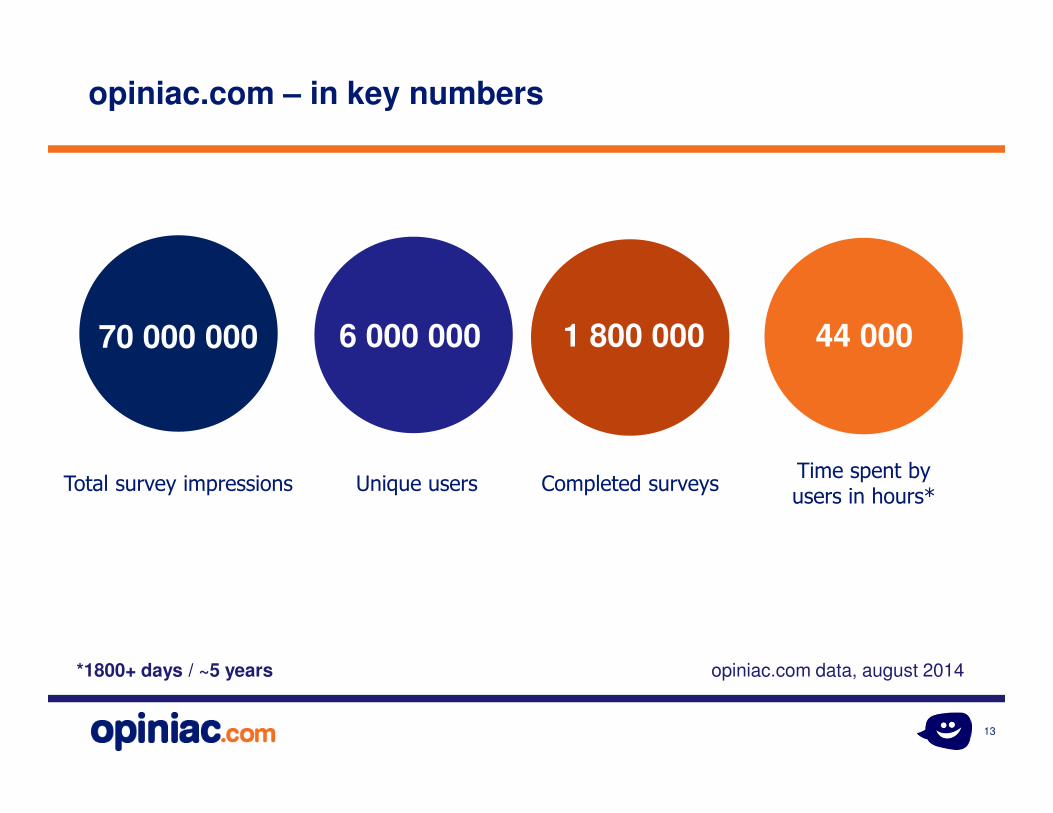
70 000 000
Total survey impressions Unique users
6 000 000 1 800 000 44 000
Completed surveysTime spent by users in hours*
*1800+ days / ~5 years opiniac.com data, august 2014
opiniac.com – in key numbers
14
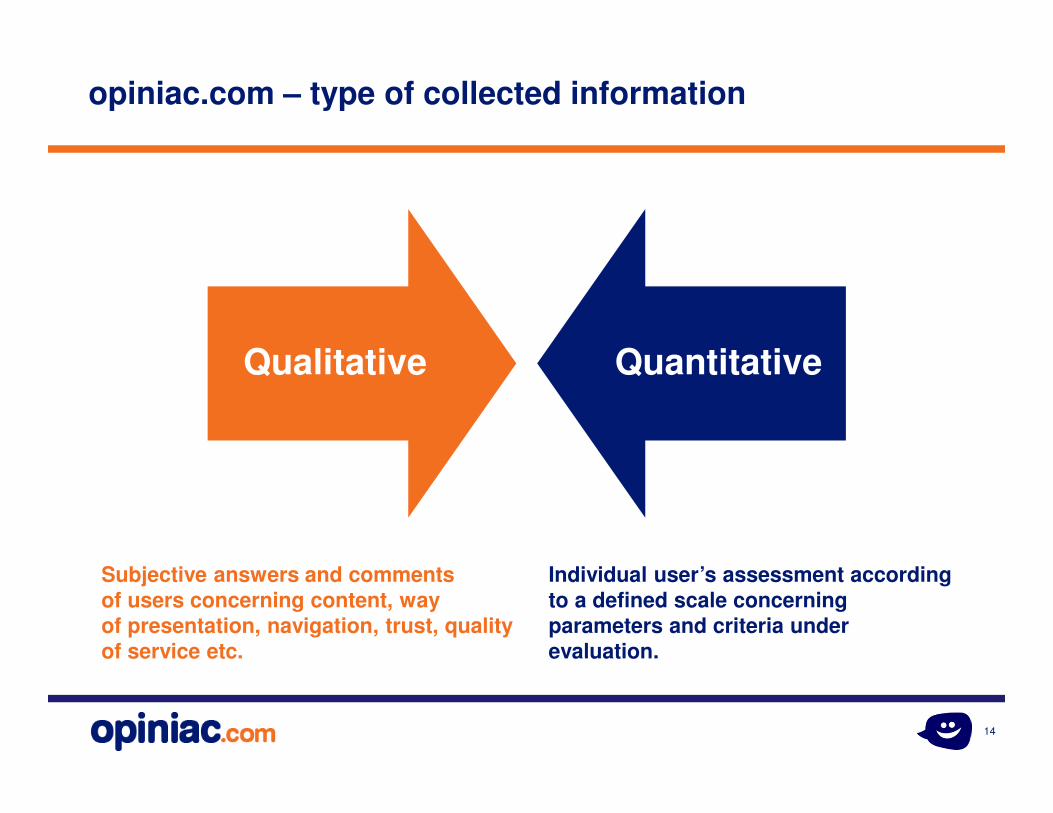
opiniac.com – type of collected information
Qualitative Quantitative
Subjective answers and commentsof users concerning content, wayof presentation, navigation, trust, quality of service etc.
Individual user’s assessment according to a defined scale concerning parameters and criteria under evaluation.
15
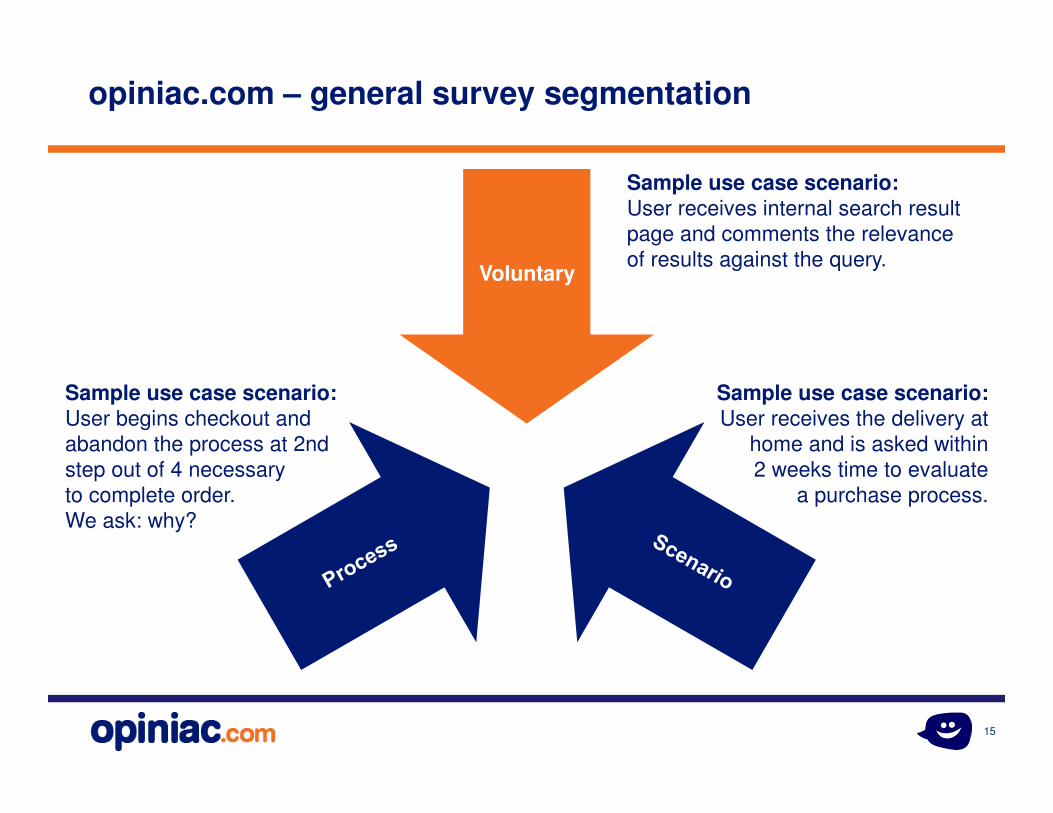
opiniac.com – general survey segmentation
Voluntary
Sample use case scenario:User receives internal search result
page and comments the relevance
of results against the query.
Sample use case scenario:User begins checkout and
abandon the process at 2nd
step out of 4 necessary
to complete order.
We ask: why?
Sample use case scenario:User receives the delivery at
home and is asked within
2 weeks time to evaluate
a purchase process.
16
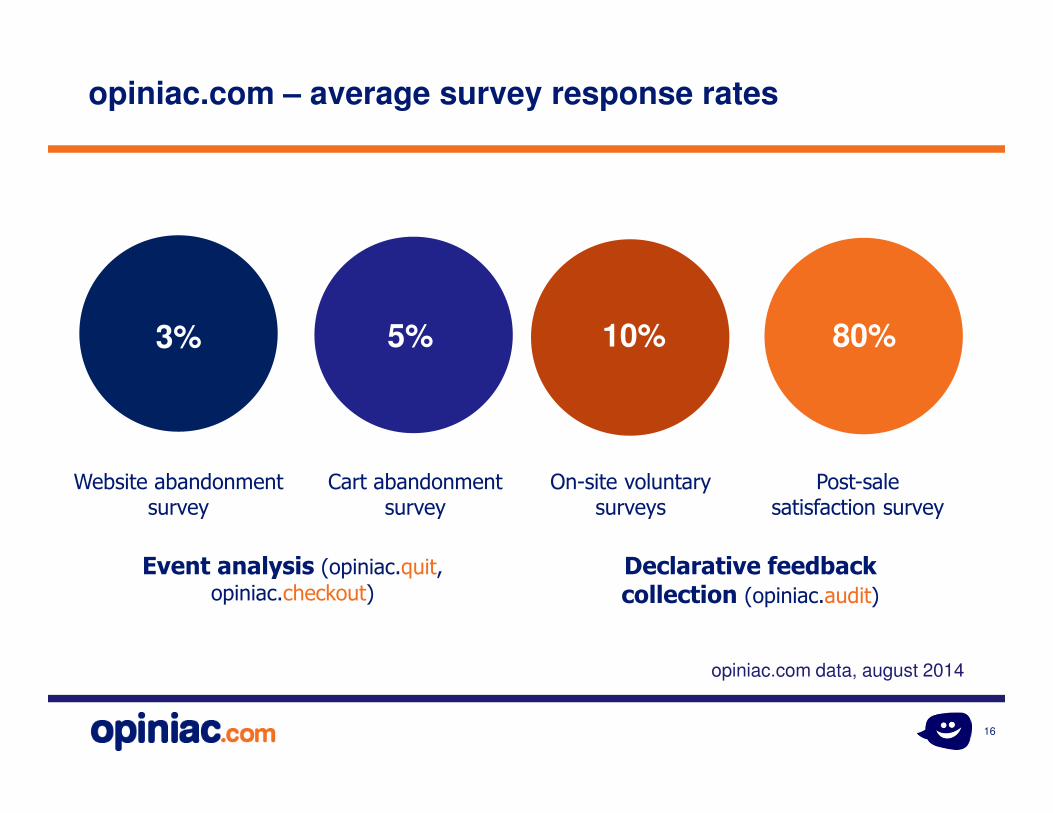
3% 5% 10% 80%
opiniac.com data, august 2014
Event analysis (opiniac.quit, opiniac.checkout)
Declarative feedback collection (opiniac.audit)
Website abandonment survey
Cart abandonment survey
On-site voluntary surveys
Post-sale satisfaction survey
opiniac.com – average survey response rates
17
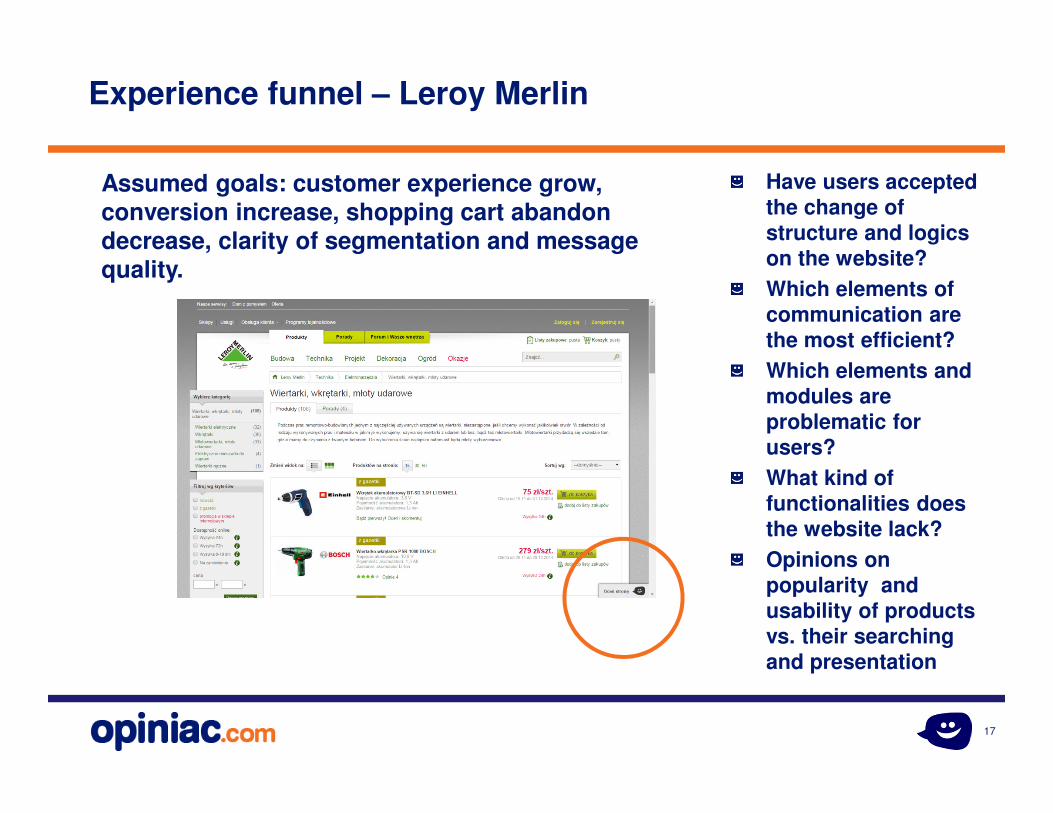
Experience funnel – Leroy Merlin
Assumed goals: customer experience grow, conversion increase, shopping cart abandon decrease, clarity of segmentation and message quality.
Have users accepted the change of structure and logics on the website?
Which elements of communication are the most efficient?
Which elements and modules are problematic for users?
What kind of functionalities does the website lack?
Opinions on popularity and usability of products vs. their searching and presentation
18
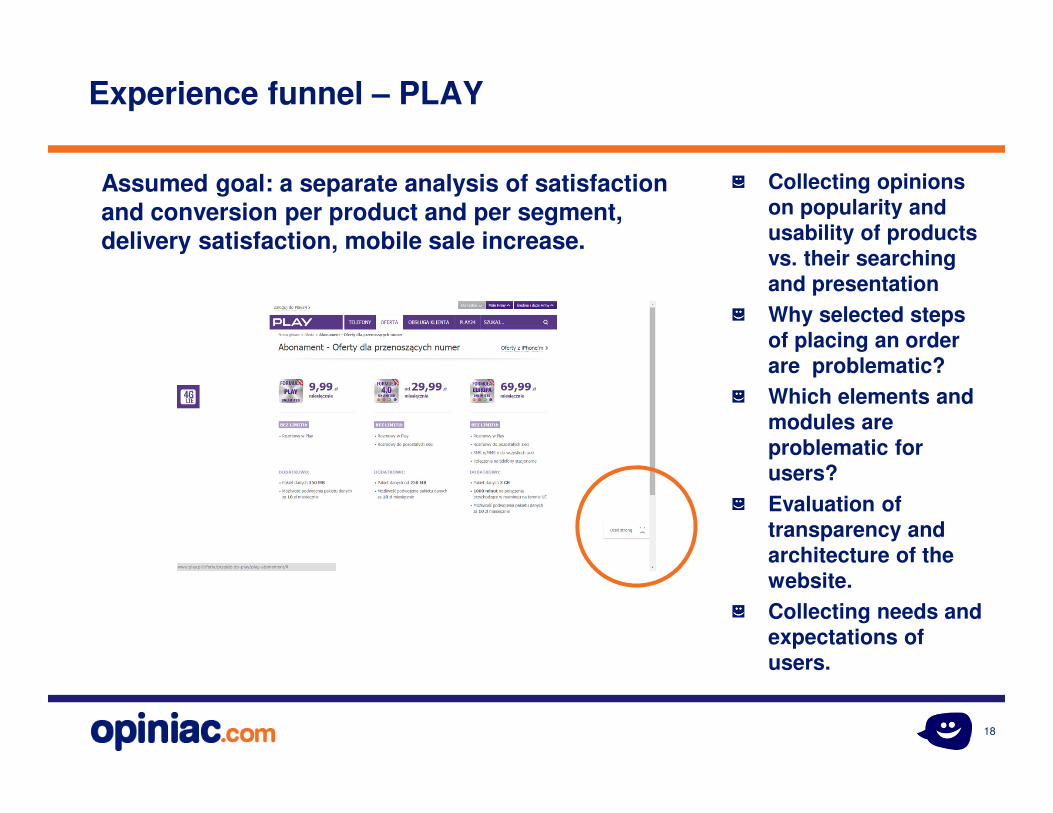
Experience funnel – PLAY
Collecting opinions on popularity and usability of products vs. their searching and presentation
Why selected steps of placing an order are problematic?
Which elements and modules are problematic for users?
Evaluation of transparency and architecture of the website.
Collecting needs and expectations of users.
Assumed goal: a separate analysis of satisfaction and conversion per product and per segment, delivery satisfaction, mobile sale increase.
19
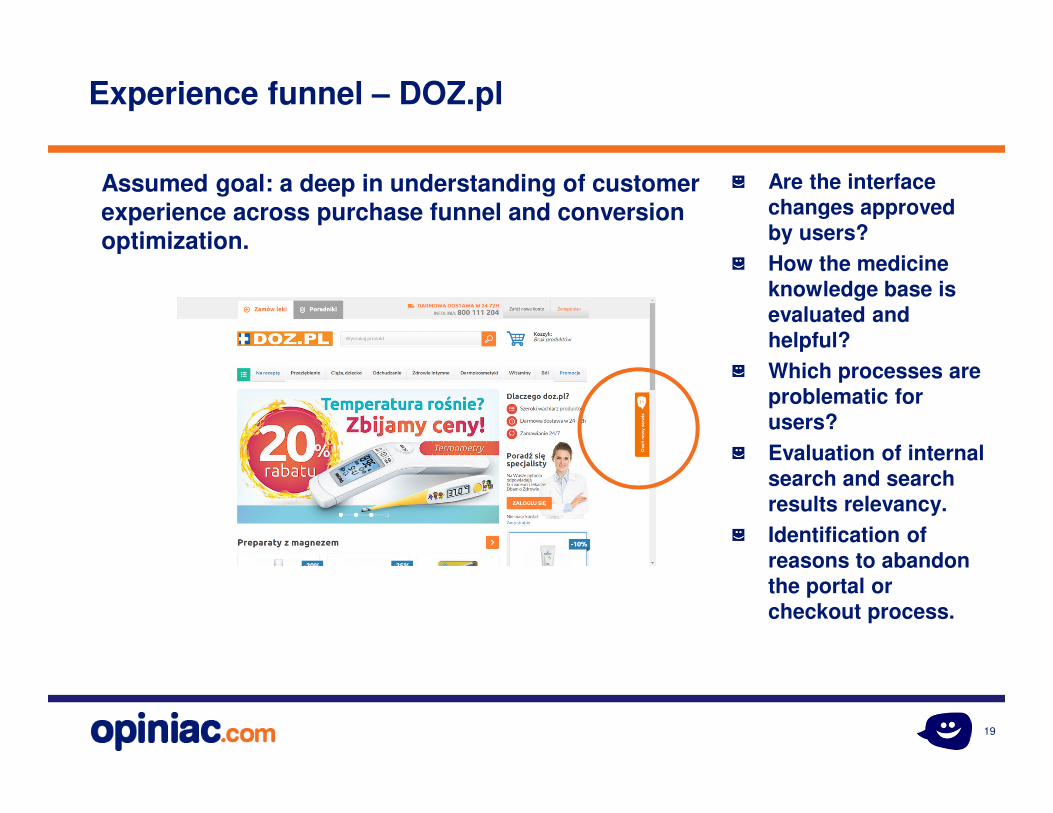
Experience funnel – DOZ.pl
Are the interface changes approved by users?
How the medicine knowledge base is evaluated and helpful?
Which processes are problematic for users?
Evaluation of internal search and search results relevancy.
Identification of reasons to abandon the portal or checkout process.
Assumed goal: a deep in understanding of customer experience across purchase funnel and conversion optimization.
20
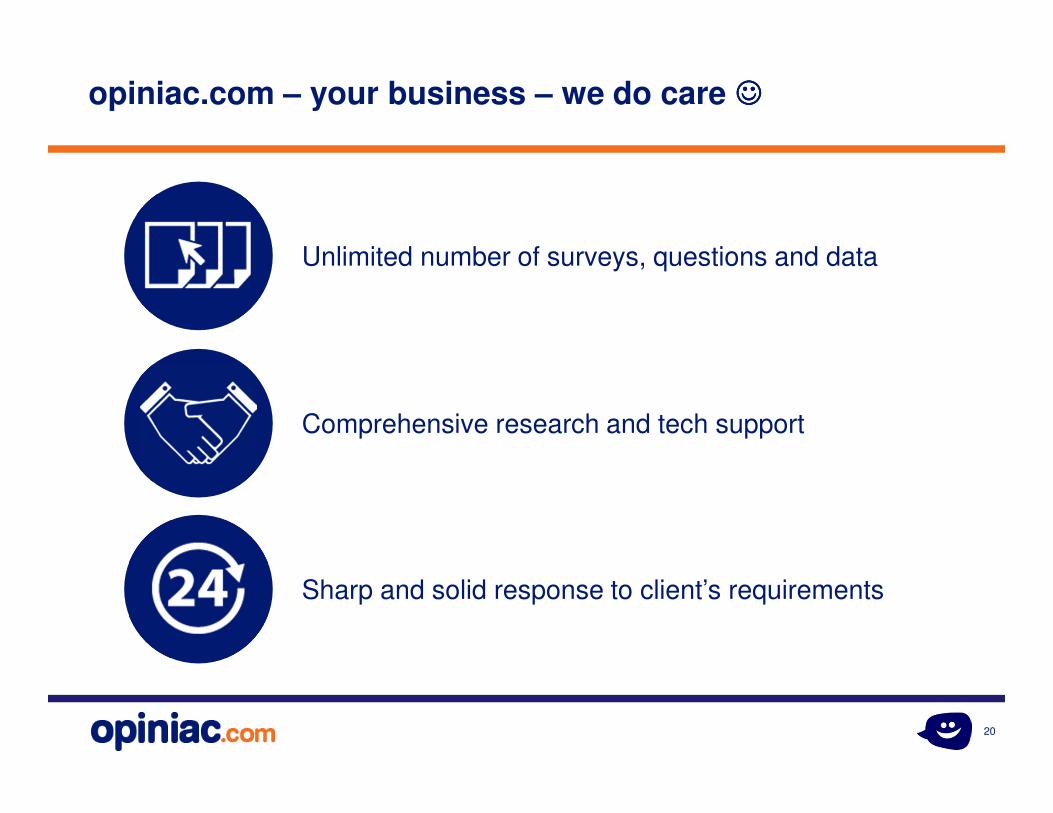
Unlimited number of surveys, questions and data
Comprehensive research and tech support
Sharp and solid response to client’s requirements
opiniac.com – your business – we do care ☺☺☺☺
21
Main advantages of implementing CX solution
22
Quantative data -
Google Analytics
Qualitative data –
opiniac.com CX platform
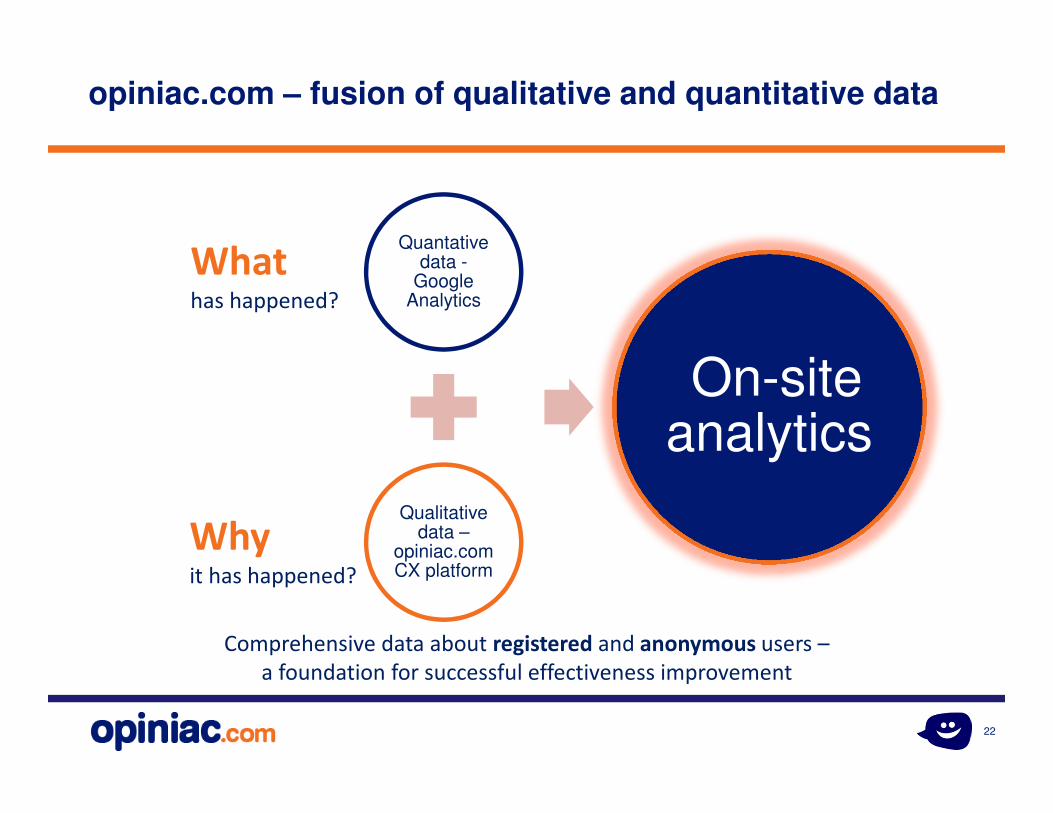
On-site analytics
Whathas happened?
Whyit has happened?
Comprehensive data about registered and anonymous users –
a foundation for successful effectiveness improvement
opiniac.com – fusion of qualitative and quantitative data
23
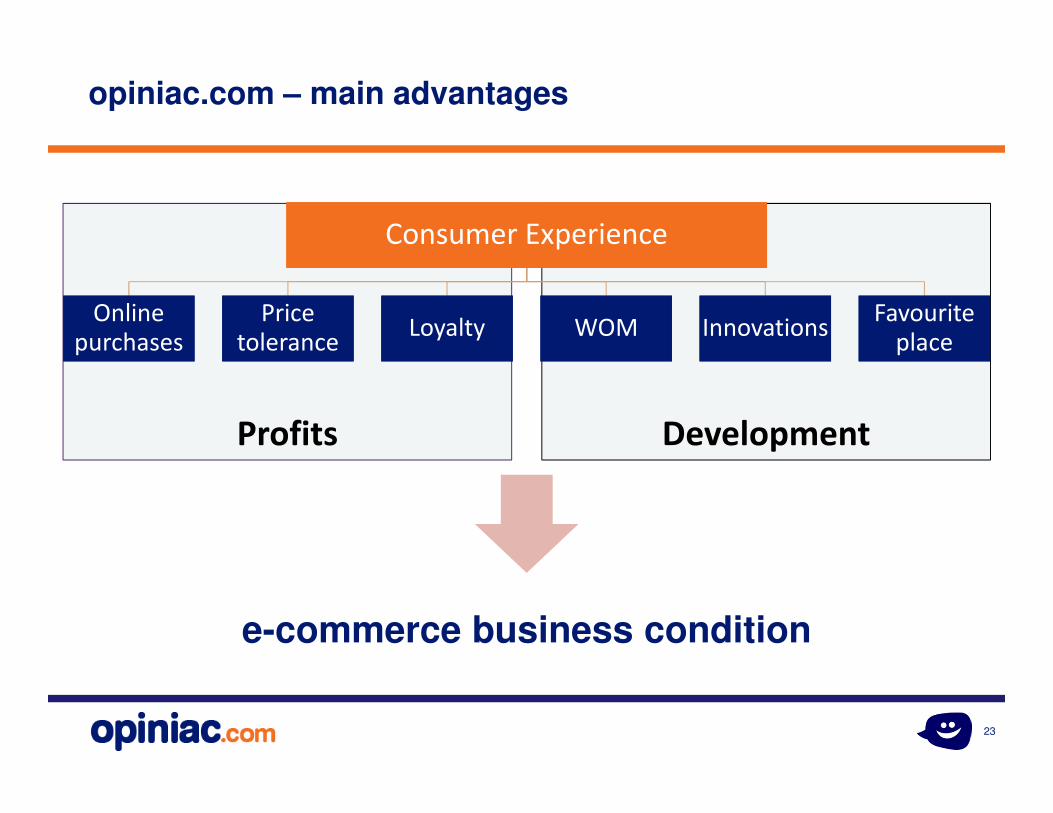
DevelopmentProfits
e-commerce business condition
Consumer ExperienceConsumer Experience
Onlinepurchases
Onlinepurchases
Price tolerance
Price tolerance
LoyaltyLoyalty WOMWOM InnovationsInnovationsFavourite
placeFavourite
place
opiniac.com – main advantages
24
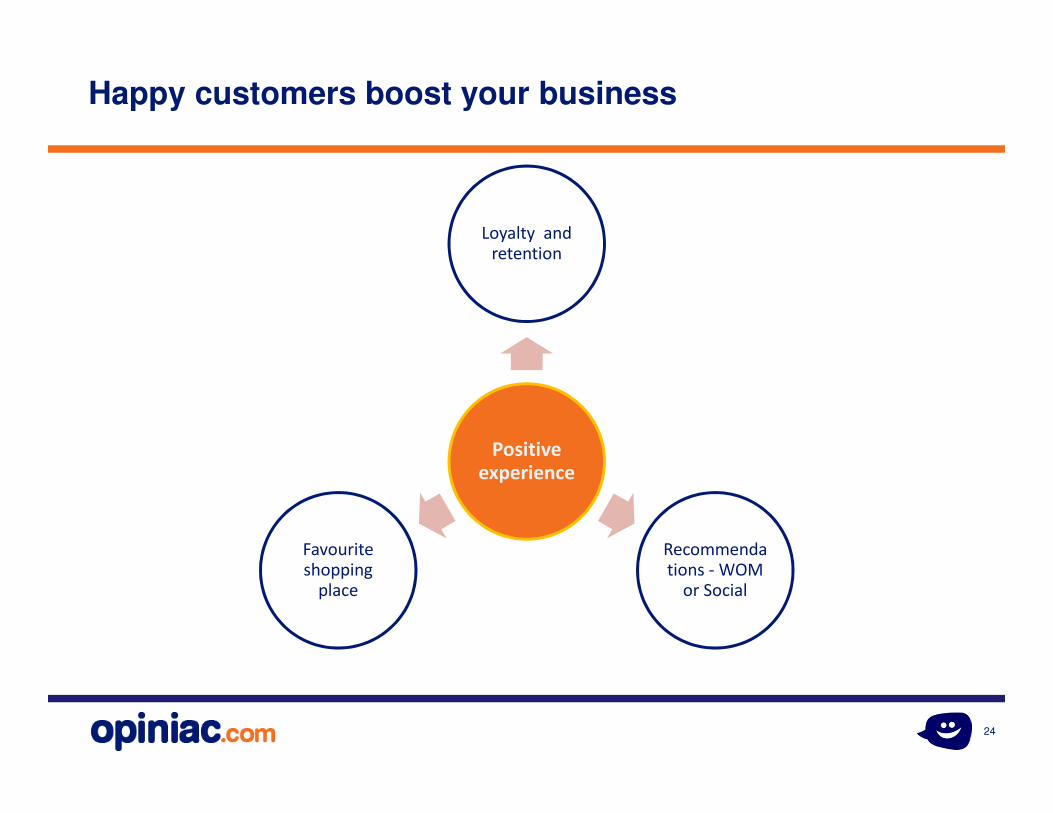
Positive
experience
Loyalty andretention
Recommendations - WOM
or Social
Favouriteshopping
place
Happy customers boost your business
25
Example project scope –form 12 to 24 months
26
Research objective
opiniac.com solution is aimed atcollecting knowledge about the needs and experiences of customers - to support process optimization, website development and CX improvement
27
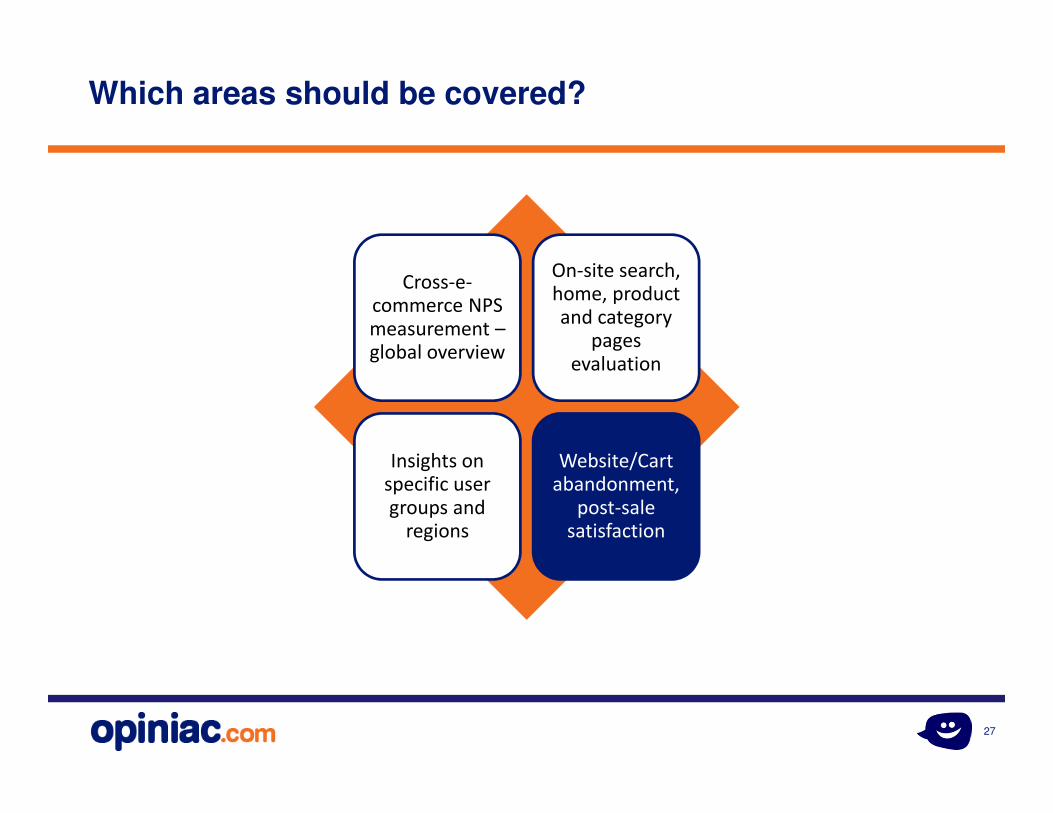
Cross-e-commerce NPS measurement –global overview
On-site search, home, product and category
pages evaluation
Insights on specific user groups and
regions
Website/Cart abandonment,
post-sale satisfaction
Which areas should be covered?
28
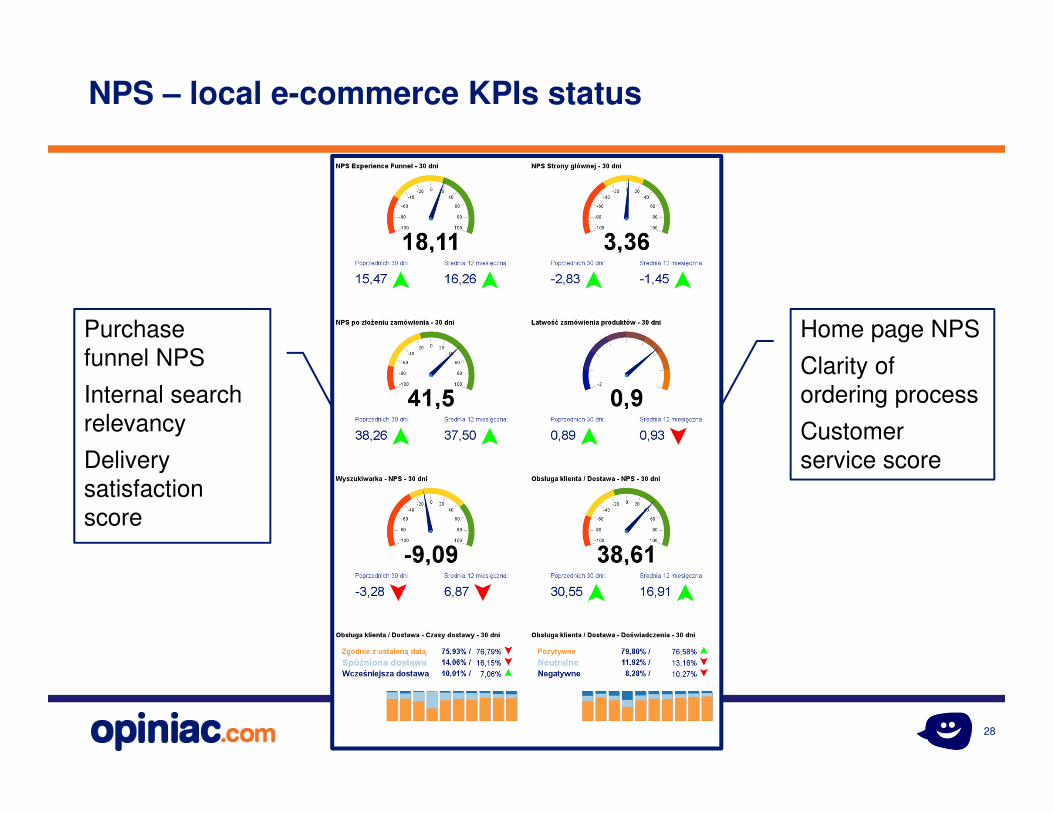
NPS – local e-commerce KPIs status
Home page NPS
Clarity of
ordering process
Customer
service score
Purchase
funnel NPS
Internal search
relevancy
Delivery
satisfaction
score
29
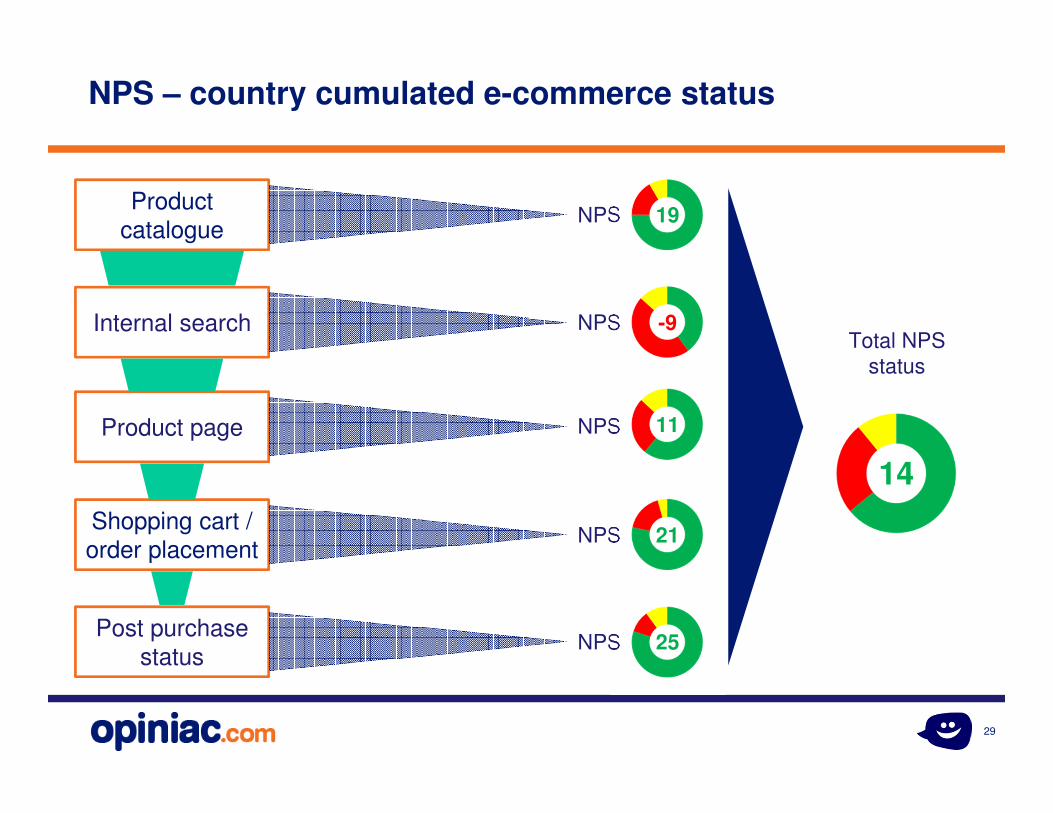
Product
catalogue
Internal search
NPS
Product page
Shopping cart /
order placement
Post purchase
status
NPS
NPS
NPS
NPS
Total NPS
status
19
-9
11
21
25
14
NPS – country cumulated e-commerce status
30
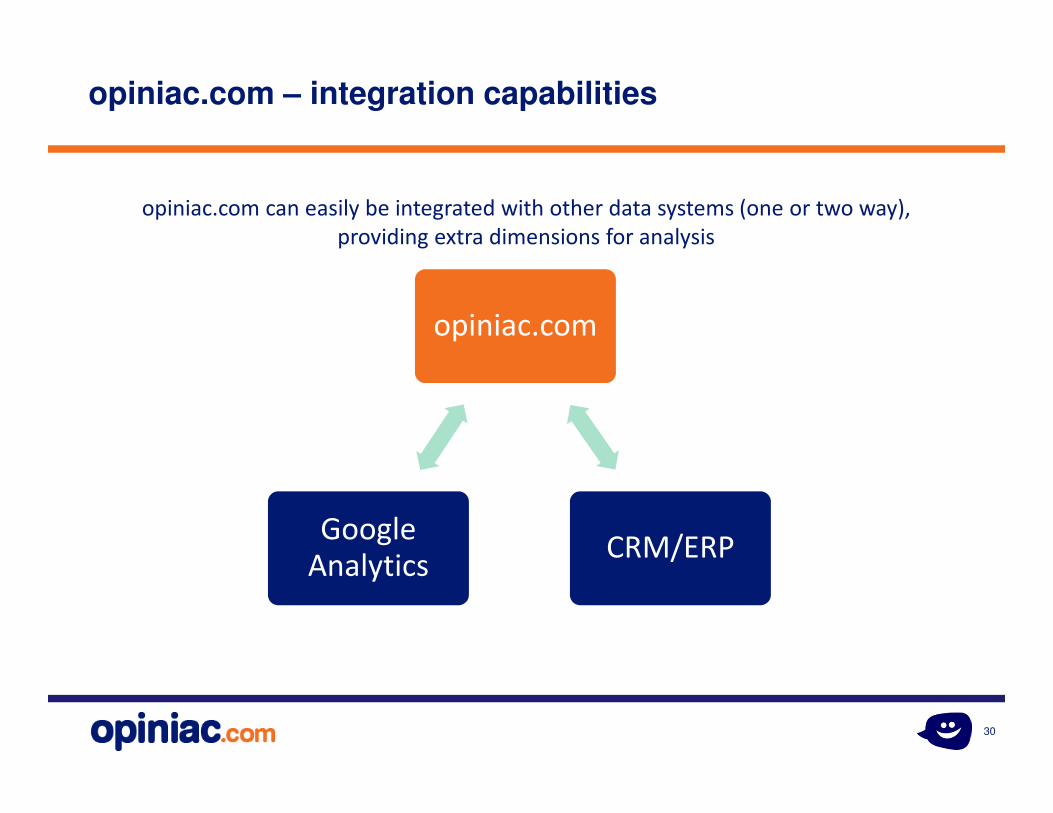
opiniac.com – integration capabilities
opiniac.com can easily be integrated with other data systems (one or two way),
providing extra dimensions for analysis
opiniac.com
CRM/ERPGoogle
Analytics
31
Next steps – suggestedaction plan
32
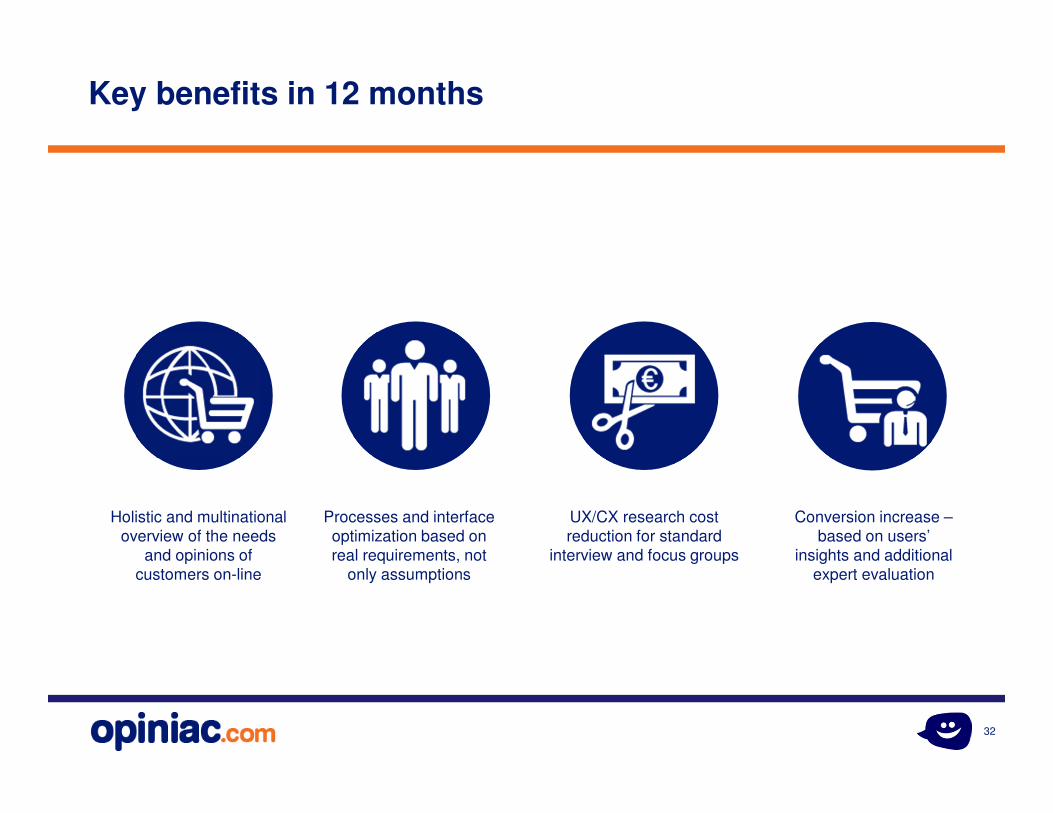
Holistic and multinational
overview of the needs
and opinions of
customers on-line
Processes and interface
optimization based on
real requirements, not
only assumptions
UX/CX research cost
reduction for standard
interview and focus groups
Conversion increase –
based on users’
insights and additional
expert evaluation
Key benefits in 12 months
33
Start with a PoC free test drive
Proof of Concept for solution advantage.
Complete system functionality available.
Summary in a form of CX overview report.
Free test drive is available for 1 month.
Simple installation, similar to Google Analytics.
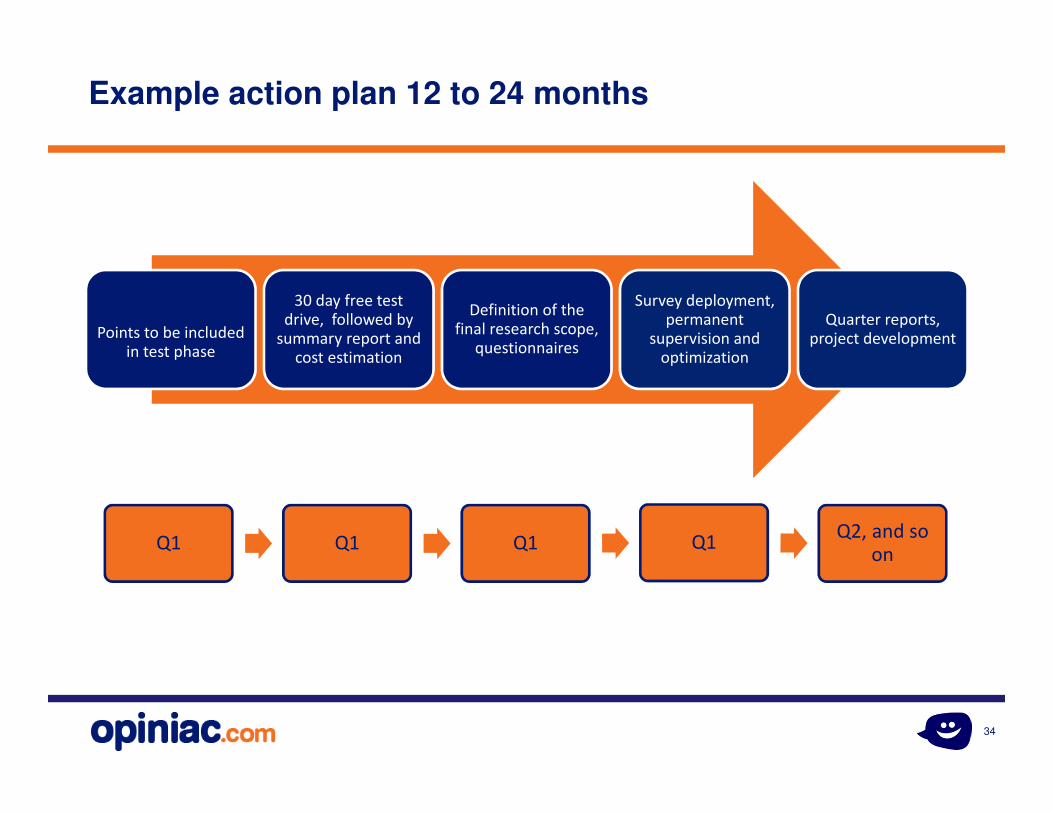
34
Points to be included in test phase
30 day free test drive, followed by
summary report and cost estimation
Definition of the final research scope,
questionnaires
Survey deployment, permanent
supervision and optimization
Quarter reports, project development
Q1 Q1 Q1 Q1Q2, and so
on
Example action plan 12 to 24 months
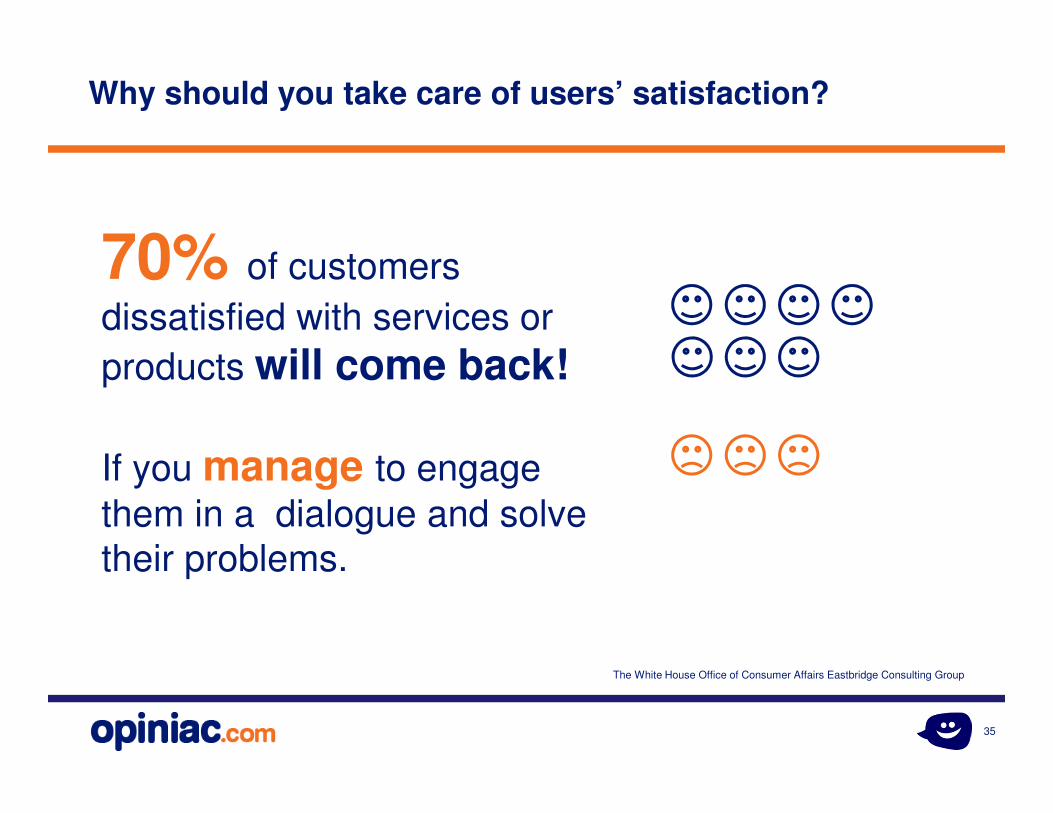
35
Why should you take care of users’ satisfaction?
70% of customers
dissatisfied with services or
products will come back!
If you manage to engage
them in a dialogue and solve
their problems.
The White House Office of Consumer Affairs Eastbridge Consulting Group
Customer Experience Management
Thank you for your attention.
Zbigniew Nowicki, CEO
+48 502 593 293
Confidential data. Property of opiniac.com. Not to be copied in any form without permission in written .


![Customer Retention [Infographic] Customer Experience](https://img.pdfslide.us/doc/110x75/55b6dceebb61eb0c598b46c8/customer-retention-infographic-customer-experience.jpg)