Embed Size (px)
Citation preview

OxySure Systems, Inc. (OXYS)
Corporate PresentationOctober 2015
2
Forward Looking Statements
The following may contain forward-looking statements that involve risks anduncertainties, including uncertainties associated with the medical device industry.Except for the historical information contained herein, the matters set forth in thiscommunication, including statements relating to our growth strategy, financial results,product approvals, and development programs, are forward-looking statements withinthe meaning of the "safe harbor" provisions of the Private Securities Litigation ReformAct of 1995. Forward-looking statements speak only as of the date the statements aremade and are based on information available at the time those statements are madeand/or management's good faith belief as of that time with respect to future events.You should not put undue reliance on any forward-looking statements. Importantfactors that could cause actual performance to differ materially from the forward-looking statements we make include: range of treatment options, clinical applications,and market acceptance of products and other risks detailed from time to time in ourfilings with the Securities and Exchange Commission. Our actual results of operationsmay differ significantly from those contemplated by such forward-looking statementsas a result of these and other factors.
3
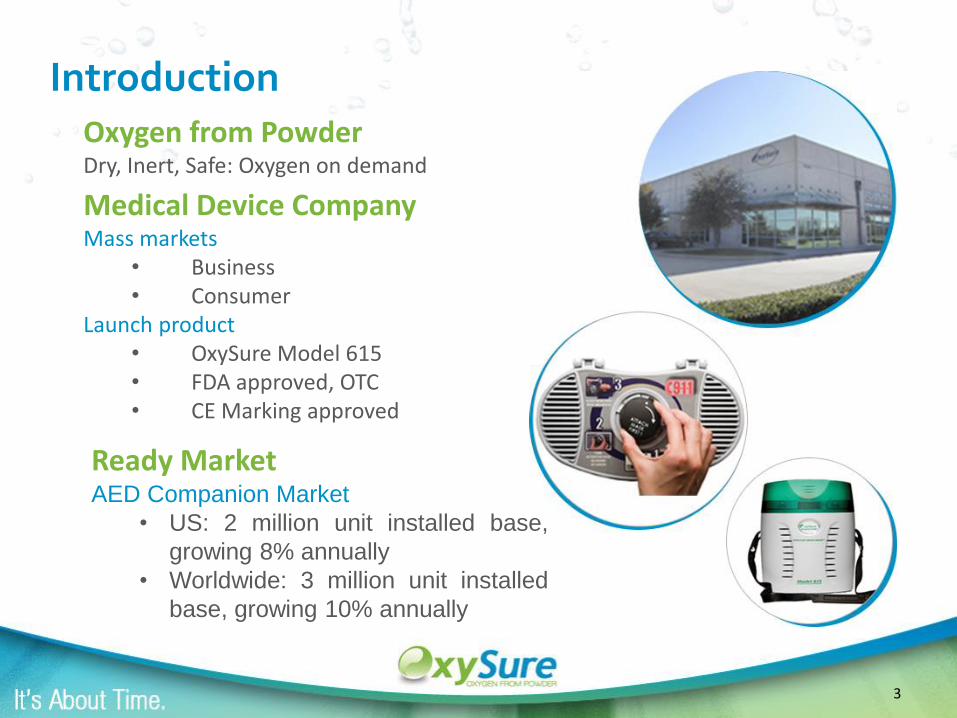
Introduction
Medical Device CompanyMass markets
• Business• Consumer
Launch product• OxySure Model 615• FDA approved, OTC• CE Marking approved
Oxygen from PowderDry, Inert, Safe: Oxygen on demand
Ready MarketAED Companion Market
• US: 2 million unit installed base,
growing 8% annually
• Worldwide: 3 million unit installed
base, growing 10% annually
4
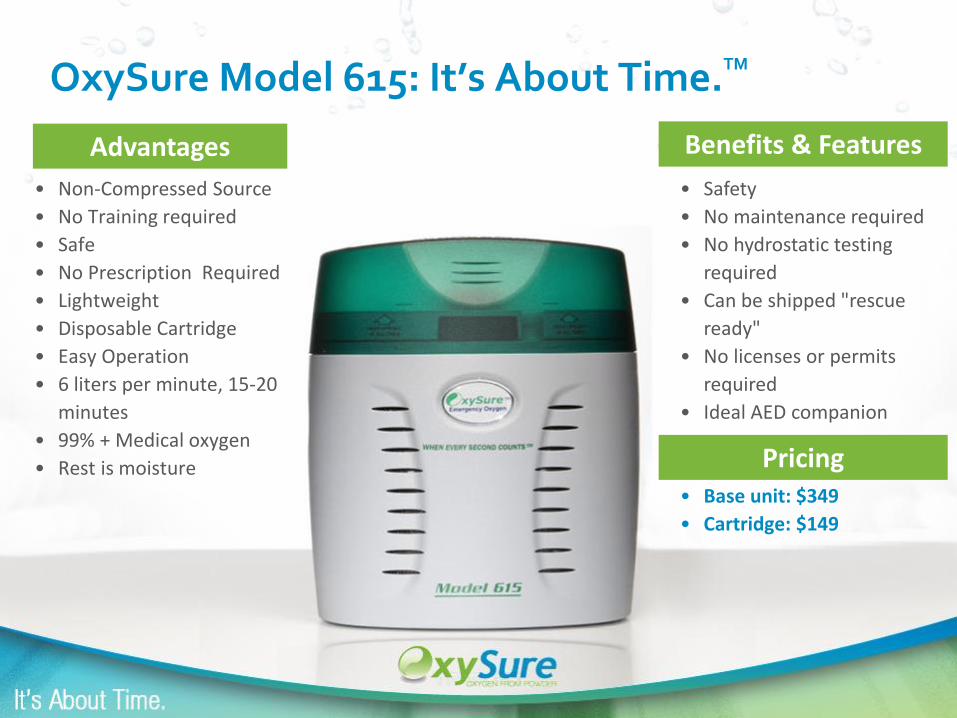
OxySure Model 615: It’s About Time.TM
• Non-Compressed Source
• No Training required
• Safe
• No Prescription Required
• Lightweight
• Disposable Cartridge
• Easy Operation
• 6 liters per minute, 15-20
minutes
• 99% + Medical oxygen
• Rest is moisture
Advantages Benefits & Features
• Safety
• No maintenance required
• No hydrostatic testing
required
• Can be shipped "rescue
ready"
• No licenses or permits
required
• Ideal AED companion
• Base unit: $349
• Cartridge: $149
Pricing
5
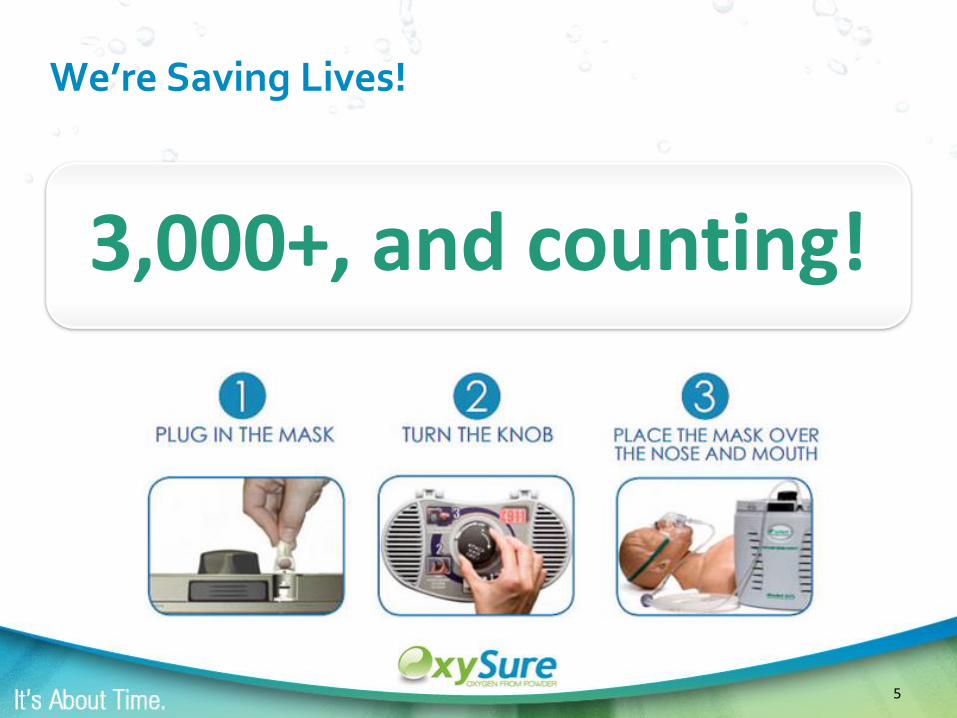
We’re Saving Lives!
3,000+, and counting!
6
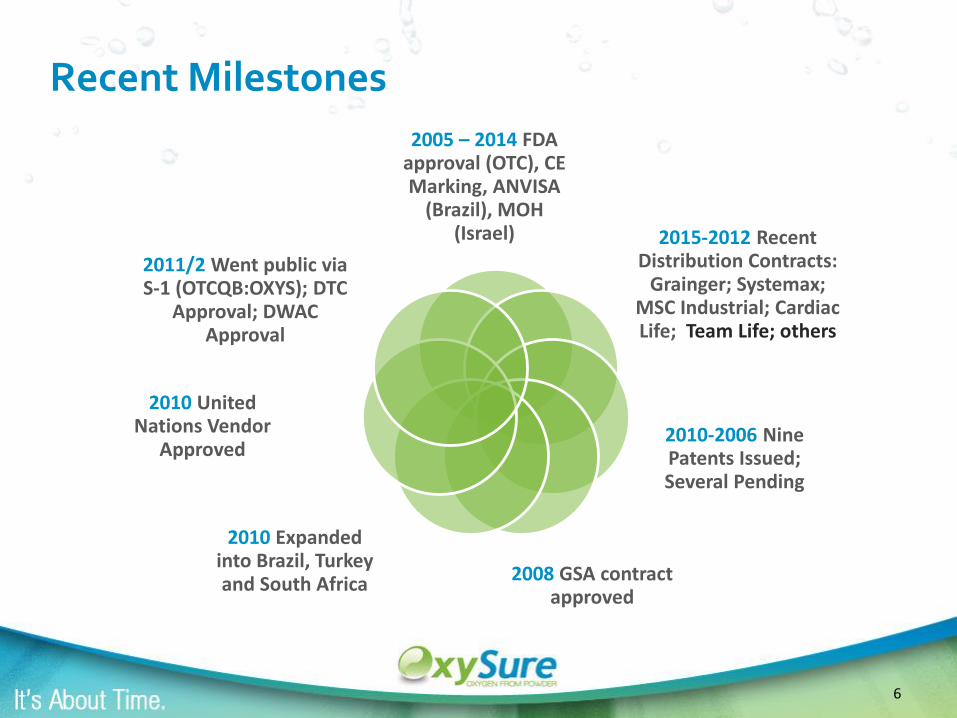
Recent Milestones
2005 – 2014 FDA approval (OTC), CE Marking, ANVISA
(Brazil), MOH (Israel)
2010-2006 Nine Patents Issued; Several Pending
2008 GSA contract approved
2015-2012 Recent Distribution Contracts:
Grainger; Systemax; MSC Industrial; Cardiac Life; Team Life; others
2010 United Nations Vendor
Approved
2010 Expanded into Brazil, Turkey and South Africa
2011/2 Went public via S-1 (OTCQB:OXYS); DTC
Approval; DWAC Approval
7
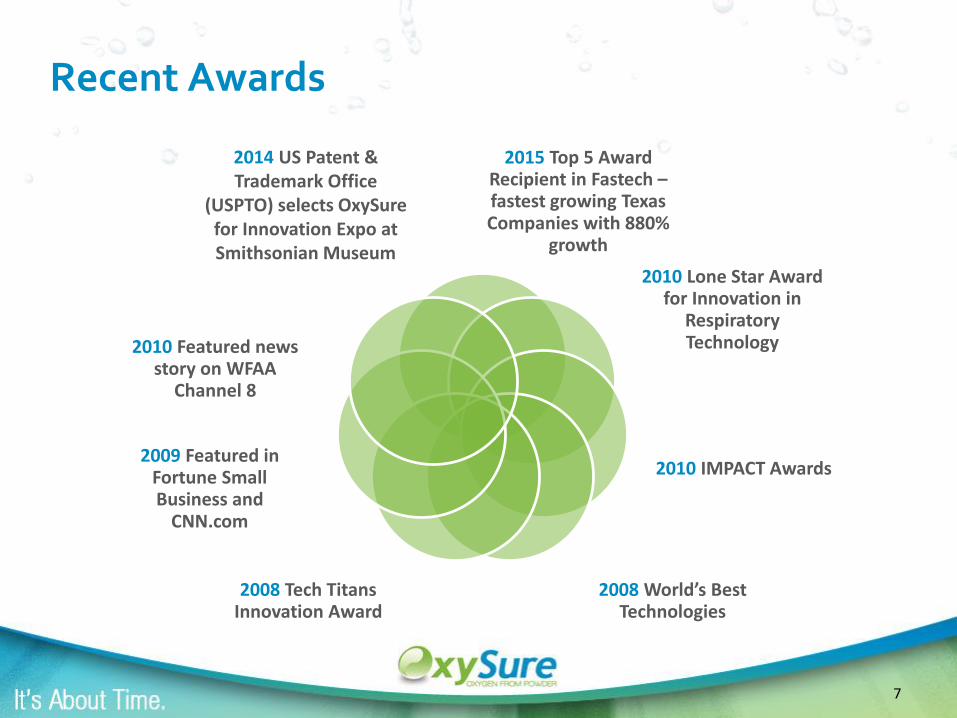
Recent Awards
2015 Top 5 Award Recipient in Fastech –fastest growing Texas Companies with 880%
growth
2010 Lone Star Award for Innovation in
Respiratory Technology
2010 IMPACT Awards
2008 World’s Best Technologies
2008 Tech Titans Innovation Award
2009 Featured in Fortune Small Business and
CNN.com
2010 Featured news story on WFAA
Channel 8
2014 US Patent & Trademark Office
(USPTO) selects OxySure for Innovation Expo at Smithsonian Museum

8
Where is OxySure needed?
• “Bridging the Gap”
• Gap = Emergency Onset Arrival of First Responders
• USA Today: Gap is 6 - 15 Minutes
• AEDs Address This Gap
“OxySure enables a loved one, bystander or even the person himself to provide oxygen while awaiting the arrival of emergency medical responders.”
Dr. Vincent Mosesso,
University of Pittsburgh Medical Center
Founder, Sudden Cardiac Arrest
Association (SCAA)

9
Just like AEDs…
– Average Price: $1,500 (started in $5,000 range)
– Batteries and pads replaced every 2 years ($400)
USA, approx. 2 Million units –Growing approx. 8.8% p.a.
$1.7 Billion in 2015, USA only
ROW, approx. 3 Million units –Growing approx. 10% p.a.
*Rise in demand for AEDs from alternate care and public access segments fueled by Legislation:(1) Cardiac Arrest Survival Act (CASA) (2) State Mandates; and Increasing awareness.
Automated External Defibrillator (AED):
Units sold and pre-positioned since 2001:

10
Just like AEDs…
Except… 300x more likely to need
Oxysure vs. AED!
11
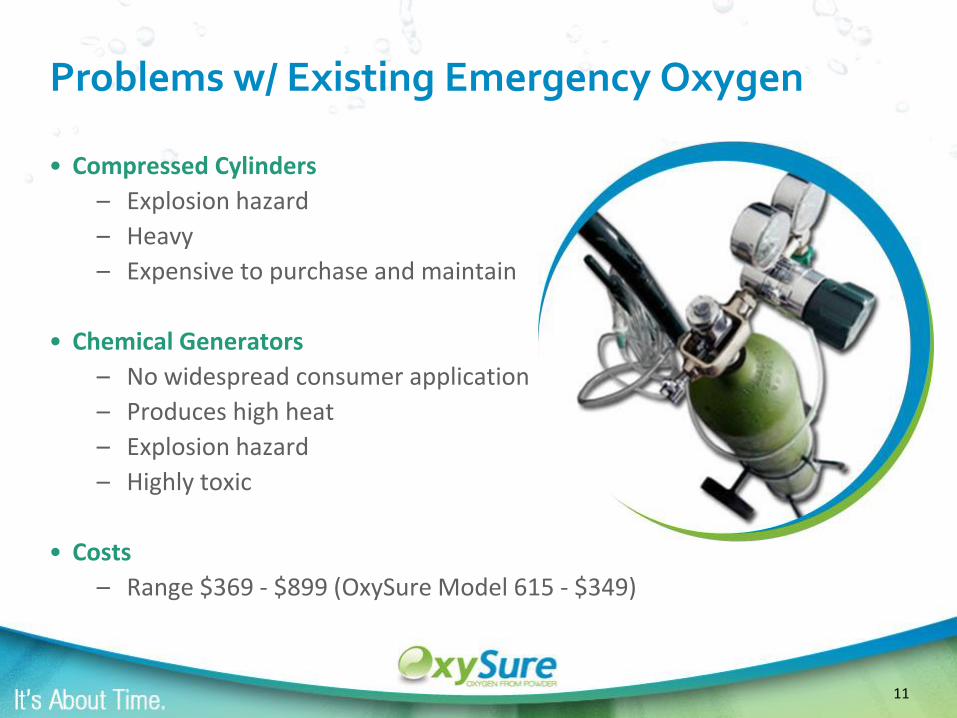
Problems w/ Existing Emergency Oxygen
• Compressed Cylinders
– Explosion hazard
– Heavy
– Expensive to purchase and maintain
• Chemical Generators
– No widespread consumer application
– Produces high heat
– Explosion hazard
– Highly toxic
• Costs
– Range $369 - $899 (OxySure Model 615 - $349)
12
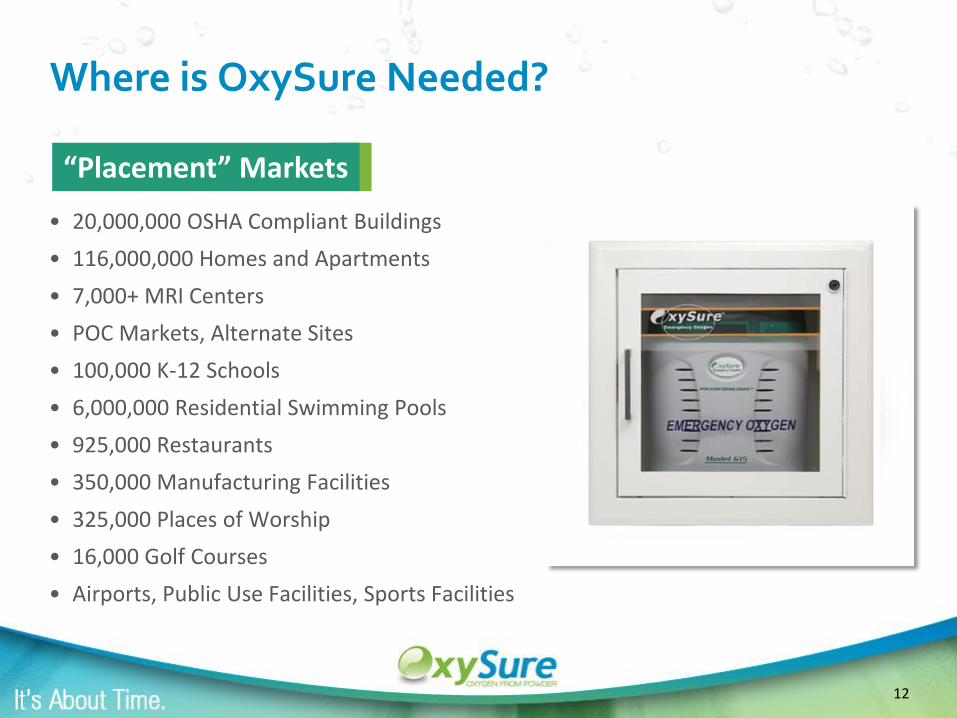
• 20,000,000 OSHA Compliant Buildings
• 116,000,000 Homes and Apartments
• 7,000+ MRI Centers
• POC Markets, Alternate Sites
• 100,000 K-12 Schools
• 6,000,000 Residential Swimming Pools
• 925,000 Restaurants
• 350,000 Manufacturing Facilities
• 325,000 Places of Worship
• 16,000 Golf Courses
• Airports, Public Use Facilities, Sports Facilities
Where is OxySure Needed?
“Placement” Markets
13
Who Needs OxySure?
• Cardiovascular Disease
– 40 Million Diagnosed
– 40 Million Undiagnosed
• Chronic Obstructive Pulmonary Disease (COPD)
– 16 Million Diagnosed
– 14 Million Undiagnosed
– 1.6 Million on Long Term Oxygen Therapy (Back-up)
• Asthma – 22.3 million
• General medical & civil emergencies
• Travelers to higher altitudes
• Private pilots – 400,000
• Over 50
“At Risk” Markets
14
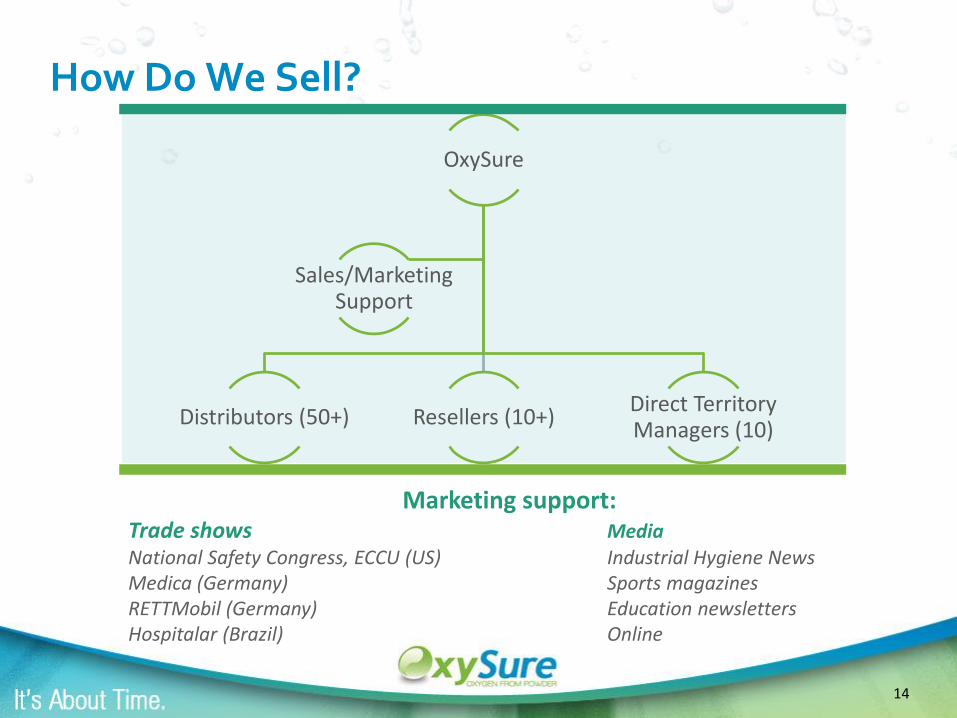
How Do We Sell?
OxySure
Distributors (50+) Resellers (10+)Direct Territory Managers (10)
Sales/Marketing Support
Marketing support:Trade shows MediaNational Safety Congress, ECCU (US) Industrial Hygiene NewsMedica (Germany) Sports magazinesRETTMobil (Germany) Education newslettersHospitalar (Brazil) Online
15
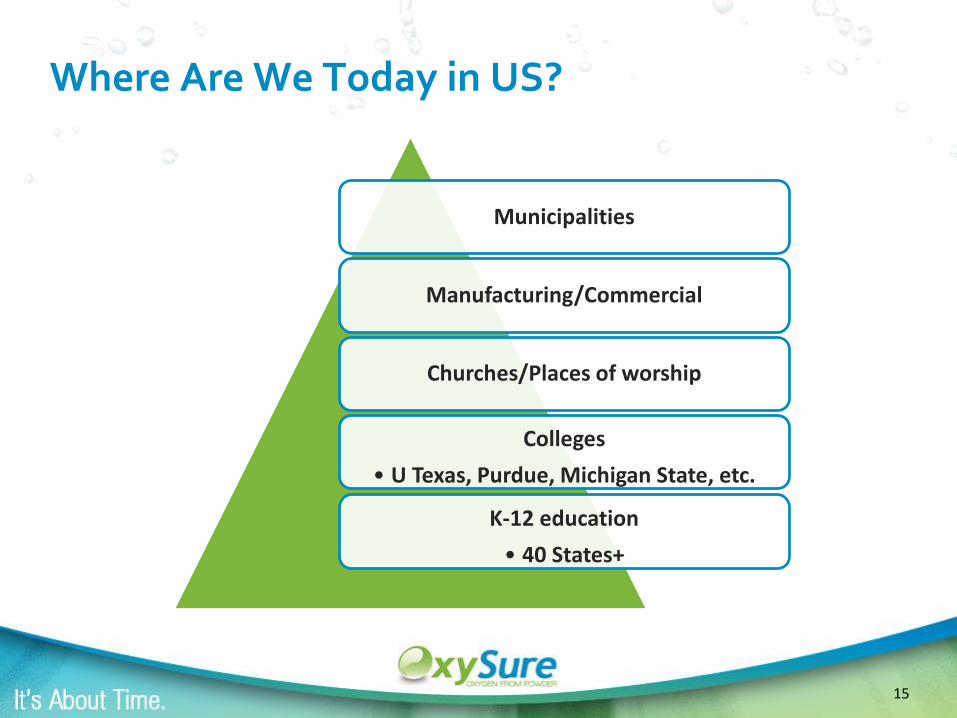
Where Are We Today in US?
Municipalities
Manufacturing/Commercial
Churches/Places of worship
Colleges
• U Texas, Purdue, Michigan State, etc.
K-12 education
• 40 States+

16
Where Are We Today Outside US?
Others pending
Hong Kong, Macau, Chile
Netherlands, Belgium, Luxembourg
Australia, New Zealand, UK
Brazil, Turkey, South Africa

17
Manufacturing/Operations
GMP / ISO 13485Scalable
100% Made in USA
18
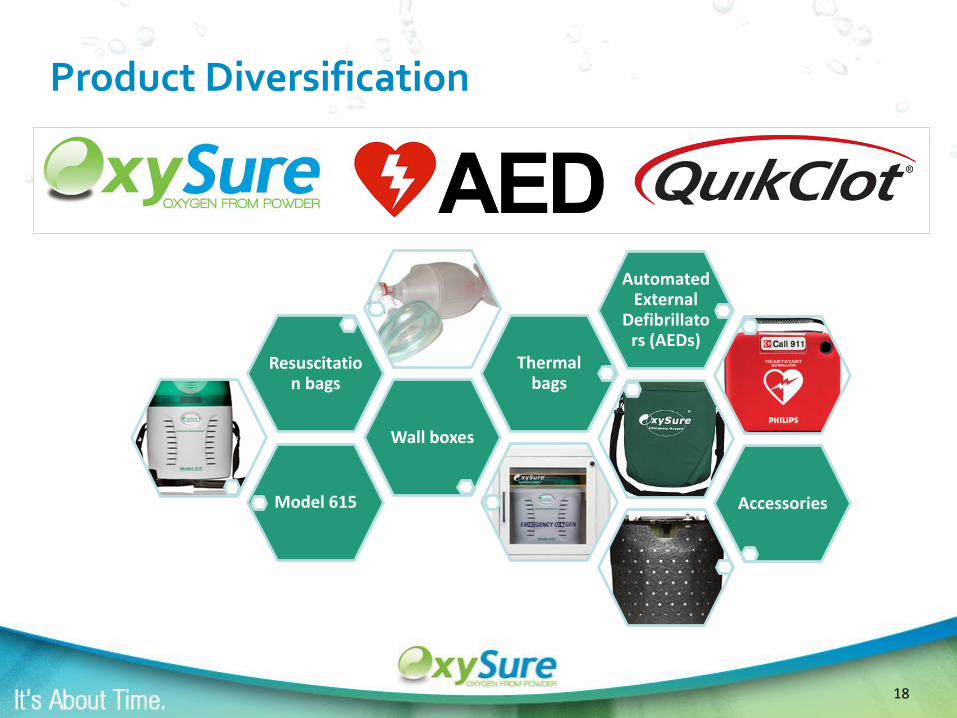
Product Diversification
Model 615
Wall boxes
Resuscitation bags
Thermal bags
Automated External
Defibrillators (AEDs)
Accessories
19
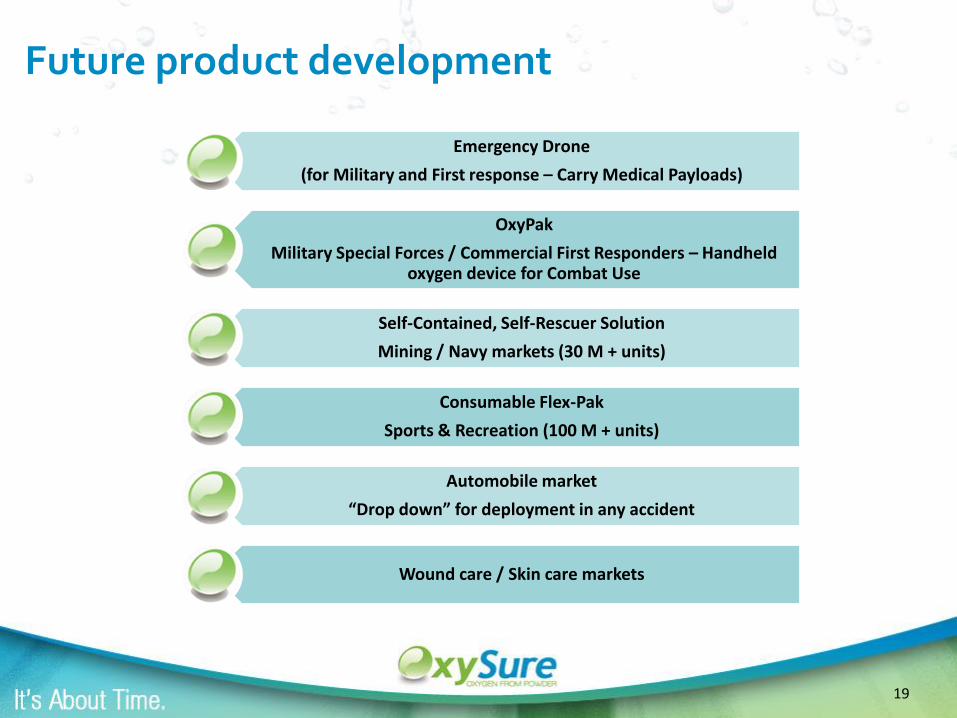
Future product development
Emergency Drone
(for Military and First response – Carry Medical Payloads)
OxyPak
Military Special Forces / Commercial First Responders – Handheld oxygen device for Combat Use
Self-Contained, Self-Rescuer Solution
Mining / Navy markets (30 M + units)
Consumable Flex-Pak
Sports & Recreation (100 M + units)
Automobile market
“Drop down” for deployment in any accident
Wound care / Skin care markets
20
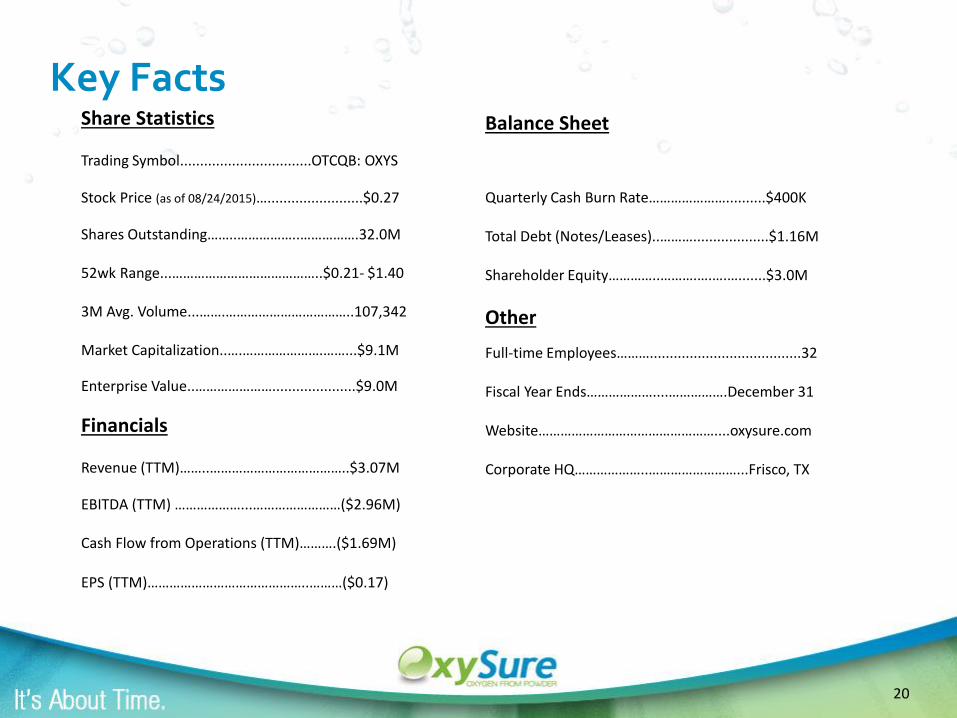
Key FactsShare Statistics
Trading Symbol.................................OTCQB: OXYS
Stock Price (as of 08/24/2015)…........................$0.27
Shares Outstanding……..……………..…………….32.0M
52wk Range...…………………………………..$0.21- $1.40
3M Avg. Volume...…….……………………………..107,342
Market Capitalization..….………………….……...$9.1M
Enterprise Value..………………….....................$9.0M
Financials
Revenue (TTM)……..………………………………..$3.07M
EBITDA (TTM) ………………...……………………($2.96M)
Cash Flow from Operations (TTM)……….($1.69M)
EPS (TTM)……………………………………..………($0.17)
Balance Sheet
Quarterly Cash Burn Rate…………………..........$400K
Total Debt (Notes/Leases)..………...................$1.16M
Shareholder Equity…………..……….….….….......$3.0M
Other
Full-time Employees………......................................32
Fiscal Year Ends………………....…………….December 31
Website…………………………………………....oxysure.com
Corporate HQ………………..……………………...Frisco, TX
21
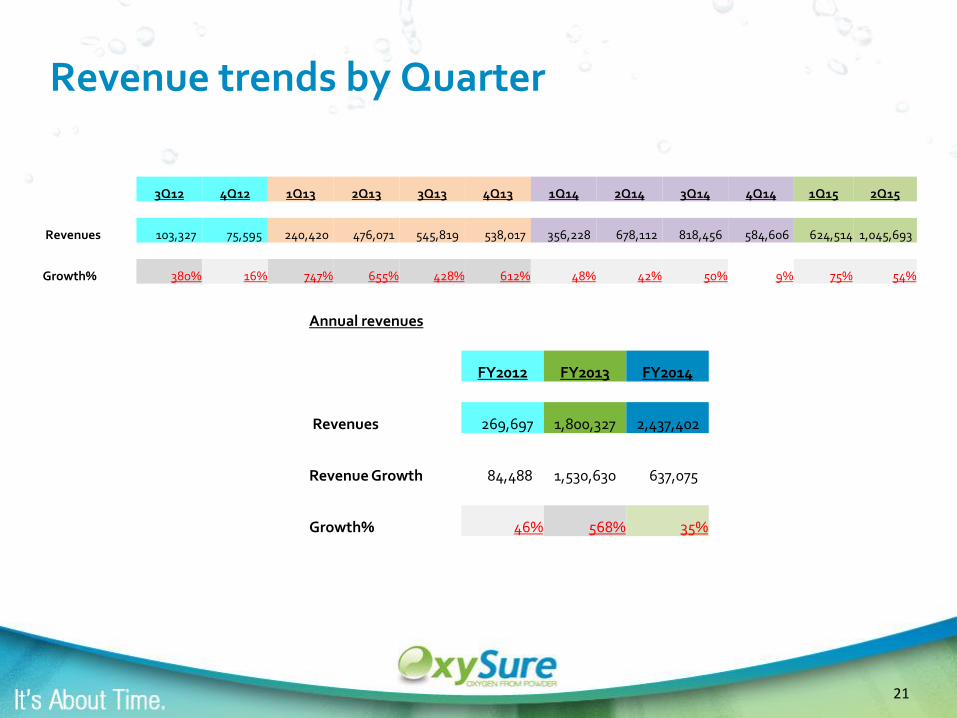
Revenue trends by Quarter
Annual revenues
FY2012 FY2013 FY2014
Revenues 269,697 1,800,327 2,437,402
Revenue Growth 84,488 1,530,630 637,075
Growth% 46% 568% 35%
3Q12 4Q12 1Q13 2Q13 3Q13 4Q13 1Q14 2Q14 3Q14 4Q14 1Q15 2Q15
Revenues 103,327 75,595 240,420 476,071 545,819 538,017 356,228 678,112 818,456 584,606 624,514 1,045,693
Growth% 380% 16% 747% 655% 428% 612% 48% 42% 50% 9% 75% 54%
22
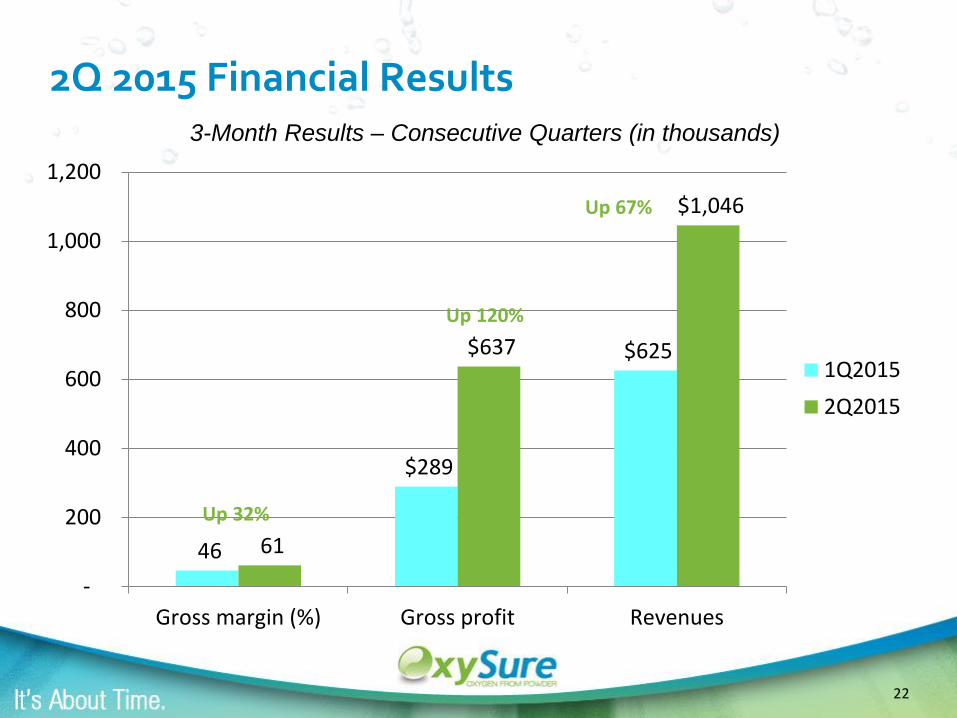
2Q 2015 Financial Results
46
$289
$625
61
$637
$1,046
-
200
400
600
800
1,000
1,200
Gross margin (%) Gross profit Revenues
1Q2015
2Q2015
Up 67%
Up 120%
Up 32%
3-Month Results – Consecutive Quarters (in thousands)
23
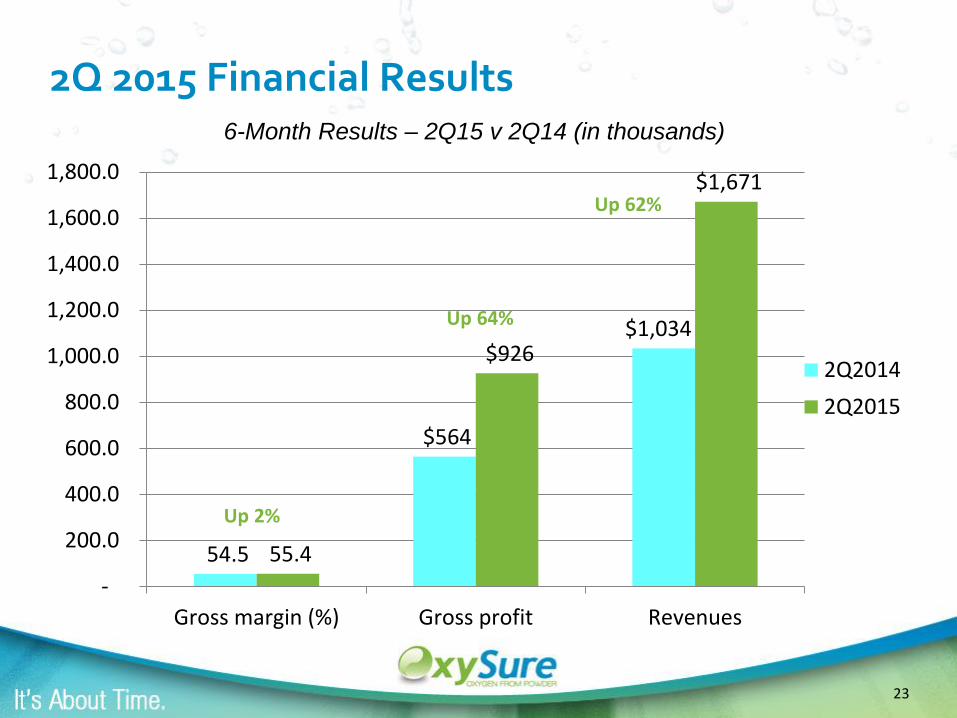
2Q 2015 Financial Results
54.5
$564
$1,034
55.4
$926
$1,671
-
200.0
400.0
600.0
800.0
1,000.0
1,200.0
1,400.0
1,600.0
1,800.0
Gross margin (%) Gross profit Revenues
2Q2014
2Q2015
Up 62%
Up 64%
Up 2%
6-Month Results – 2Q15 v 2Q14 (in thousands)
24
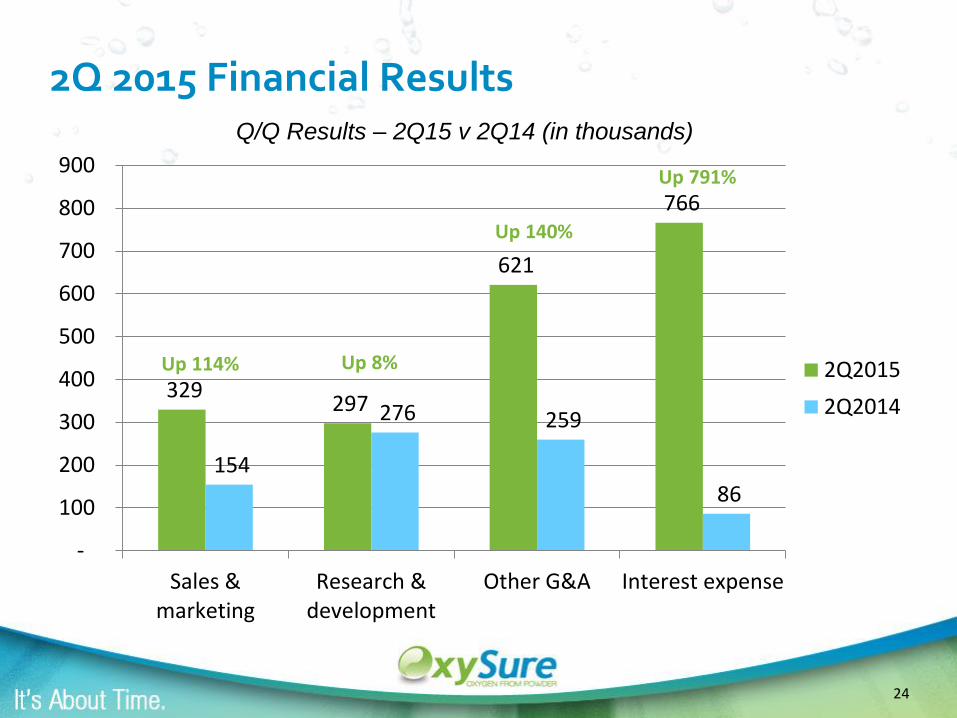
2Q 2015 Financial Results
329 297
621
766
154
276 259
86
-
100
200
300
400
500
600
700
800
900
Sales &marketing
Research &development
Other G&A Interest expense
2Q2015
2Q2014
Up 114% Up 8%
Up 140%
Up 791%
Q/Q Results – 2Q15 v 2Q14 (in thousands)

25
2Q 2015 Financial Results
2,876
2,265
2,997
5,283
647 419
1,075
2,511
-
1,000
2,000
3,000
4,000
5,000
6,000
Cash Working Capital StockholderEquity
Total Assets
6/30/2015
12/31/2014Up 344%
Up 441%
Up 179%
Up 110%
Balance Sheet Items – 6/30/15 v 12/31/2014 (in thousands)

26
2Q 2015 Financial Results
2Q 2015 1Q 2015 2Q 2014
Revenues:
$ 1,045,693 $$624,514 $678,111
Net income (loss):
$(1,259,314) $(1,340,103) $(233,528)
Net income (loss) per share:
$(.04) $(.05) $(.01)
27
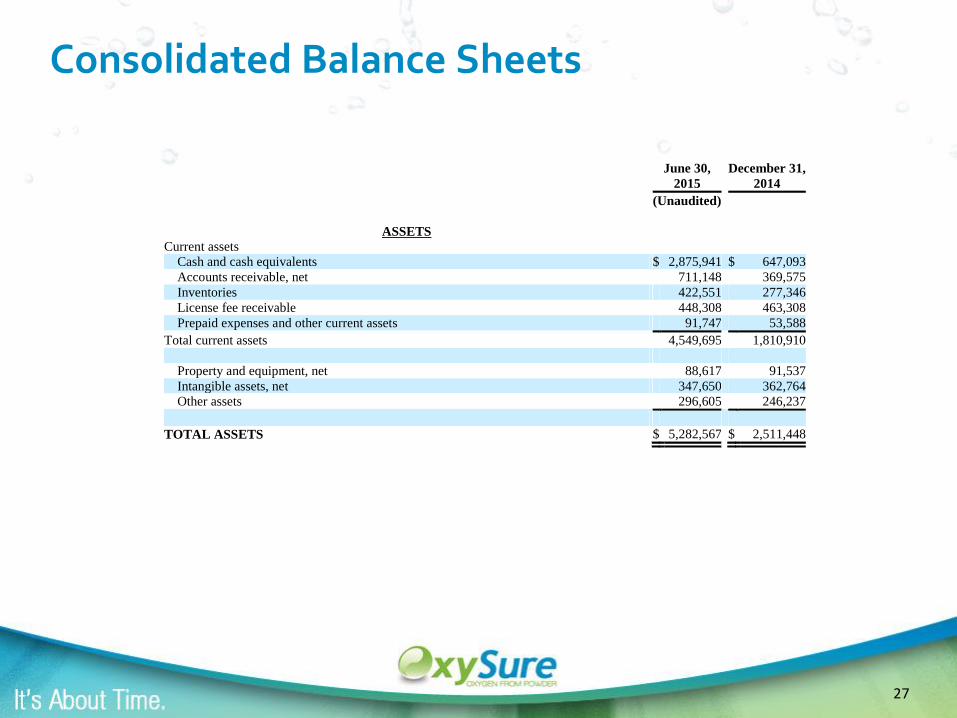
Consolidated Balance Sheets
June 30, December 31, 2015 2014
(Unaudited)
ASSETS
Current assets
Cash and cash equivalents $ 2,875,941 $ 647,093
Accounts receivable, net 711,148 369,575
Inventories 422,551 277,346
License fee receivable 448,308 463,308
Prepaid expenses and other current assets 91,747 53,588
Total current assets 4,549,695 1,810,910
Property and equipment, net 88,617 91,537
Intangible assets, net 347,650 362,764
Other assets 296,605 246,237
TOTAL ASSETS $ 5,282,567 $ 2,511,448
28
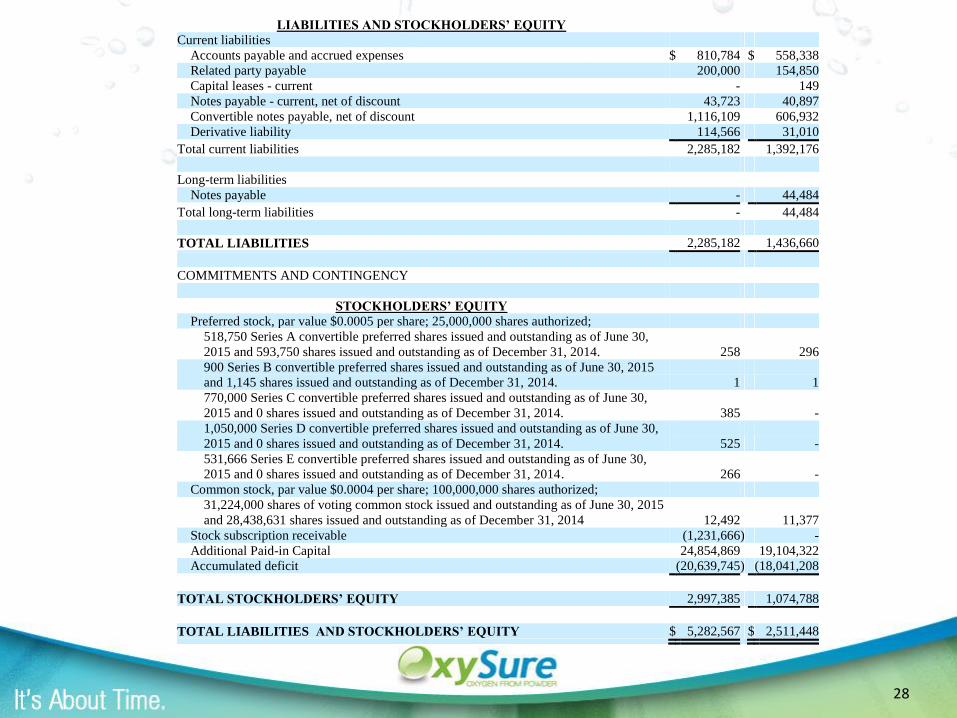
LIABILITIES AND STOCKHOLDERS’ EQUITY
Current liabilities
Accounts payable and accrued expenses $ 810,784 $ 558,338
Related party payable 200,000 154,850
Capital leases - current - 149
Notes payable - current, net of discount 43,723 40,897
Convertible notes payable, net of discount 1,116,109 606,932
Derivative liability 114,566 31,010
Total current liabilities 2,285,182 1,392,176
Long-term liabilities
Notes payable - 44,484
Total long-term liabilities - 44,484
TOTAL LIABILITIES 2,285,182 1,436,660
COMMITMENTS AND CONTINGENCY
STOCKHOLDERS’ EQUITY
Preferred stock, par value $0.0005 per share; 25,000,000 shares authorized;
518,750 Series A convertible preferred shares issued and outstanding as of June 30,
2015 and 593,750 shares issued and outstanding as of December 31, 2014. 258 296
900 Series B convertible preferred shares issued and outstanding as of June 30, 2015
and 1,145 shares issued and outstanding as of December 31, 2014. 1 1
770,000 Series C convertible preferred shares issued and outstanding as of June 30,
2015 and 0 shares issued and outstanding as of December 31, 2014. 385 -
1,050,000 Series D convertible preferred shares issued and outstanding as of June 30,
2015 and 0 shares issued and outstanding as of December 31, 2014. 525 -
531,666 Series E convertible preferred shares issued and outstanding as of June 30,
2015 and 0 shares issued and outstanding as of December 31, 2014. 266 -
Common stock, par value $0.0004 per share; 100,000,000 shares authorized;
31,224,000 shares of voting common stock issued and outstanding as of June 30, 2015
and 28,438,631 shares issued and outstanding as of December 31, 2014 12,492 11,377
Stock subscription receivable (1,231,666 ) -
Additional Paid-in Capital 24,854,869 19,104,322
Accumulated deficit (20,639,745 ) (18,041,208
TOTAL STOCKHOLDERS’ EQUITY 2,997,385 1,074,788
TOTAL LIABILITIES AND STOCKHOLDERS’ EQUITY $ 5,282,567 $ 2,511,448
29
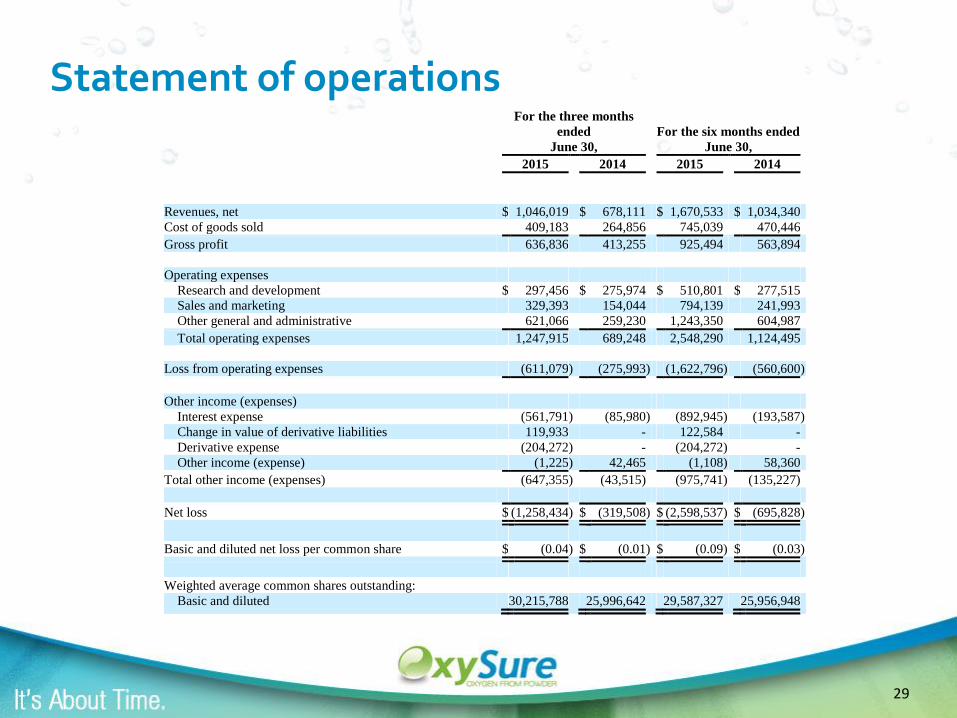
Statement of operations
For the three months
ended
June 30, For the six months ended
June 30,
2015 2014 2015 2014
Revenues, net $ 1,046,019 $ 678,111 $ 1,670,533 $ 1,034,340
Cost of goods sold 409,183 264,856 745,039 470,446
Gross profit 636,836 413,255 925,494 563,894
Operating expenses
Research and development $ 297,456 $ 275,974 $ 510,801 $ 277,515
Sales and marketing 329,393 154,044 794,139 241,993
Other general and administrative 621,066 259,230 1,243,350 604,987
Total operating expenses 1,247,915 689,248 2,548,290 1,124,495
Loss from operating expenses (611,079 ) (275,993 ) (1,622,796 ) (560,600 )
Other income (expenses)
Interest expense (561,791 ) (85,980 ) (892,945 ) (193,587 )
Change in value of derivative liabilities 119,933 - 122,584 -
Derivative expense (204,272 ) - (204,272 ) -
Other income (expense) (1,225 ) 42,465 (1,108 ) 58,360
Total other income (expenses) (647,355 ) (43,515) (975,741 ) (135,227)
Net loss $ (1,258,434 ) $ (319,508 ) $ (2,598,537 ) $ (695,828 )
Basic and diluted net loss per common share $ (0.04 ) $ (0.01 ) $ (0.09 ) $ (0.03 )
Weighted average common shares outstanding:
Basic and diluted 30,215,788 25,996,642 29,587,327 25,956,948
30
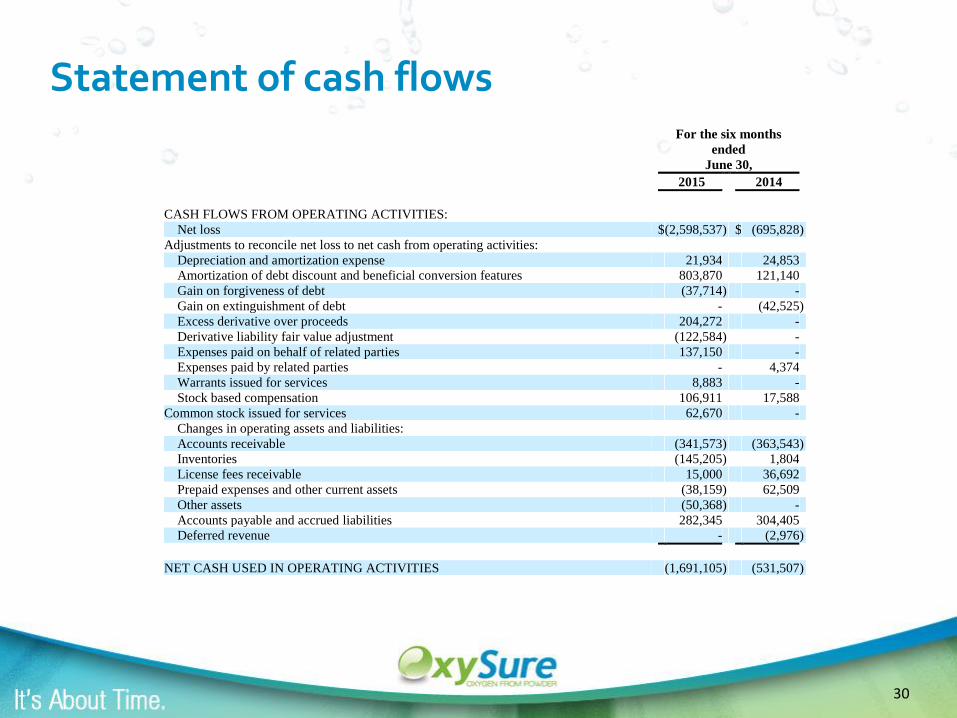
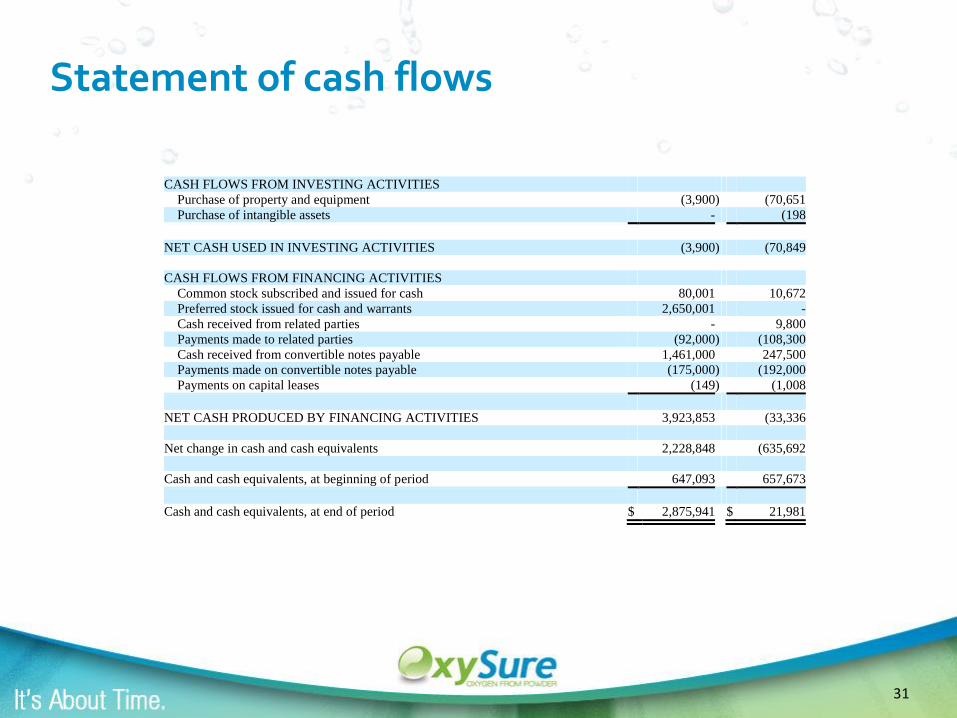
Statement of cash flows
For the six months
ended
June 30,
2015 2014
CASH FLOWS FROM OPERATING ACTIVITIES:
Net loss $ (2,598,537 ) $ (695,828 )
Adjustments to reconcile net loss to net cash from operating activities:
Depreciation and amortization expense 21,934 24,853
Amortization of debt discount and beneficial conversion features 803,870 121,140
Gain on forgiveness of debt (37,714 ) -
Gain on extinguishment of debt - (42,525 )
Excess derivative over proceeds 204,272 -
Derivative liability fair value adjustment (122,584 ) -
Expenses paid on behalf of related parties 137,150 -
Expenses paid by related parties - 4,374
Warrants issued for services 8,883 -
Stock based compensation 106,911 17,588
Common stock issued for services 62,670 -
Changes in operating assets and liabilities:
Accounts receivable (341,573 ) (363,543 )
Inventories (145,205 ) 1,804
License fees receivable 15,000 36,692
Prepaid expenses and other current assets (38,159 ) 62,509
Other assets (50,368 ) -
Accounts payable and accrued liabilities 282,345 304,405
Deferred revenue - (2,976 )
NET CASH USED IN OPERATING ACTIVITIES (1,691,105 ) (531,507 )
31
Statement of cash flows
CASH FLOWS FROM INVESTING ACTIVITIES
Purchase of property and equipment (3,900 ) (70,651
Purchase of intangible assets - (198
NET CASH USED IN INVESTING ACTIVITIES (3,900 ) (70,849
CASH FLOWS FROM FINANCING ACTIVITIES
Common stock subscribed and issued for cash 80,001 10,672
Preferred stock issued for cash and warrants 2,650,001 -
Cash received from related parties - 9,800
Payments made to related parties (92,000 ) (108,300
Cash received from convertible notes payable 1,461,000 247,500
Payments made on convertible notes payable (175,000 ) (192,000
Payments on capital leases (149 ) (1,008
NET CASH PRODUCED BY FINANCING ACTIVITIES 3,923,853 (33,336
Net change in cash and cash equivalents 2,228,848 (635,692
Cash and cash equivalents, at beginning of period 647,093 657,673
Cash and cash equivalents, at end of period $ 2,875,941 $ 21,981
32
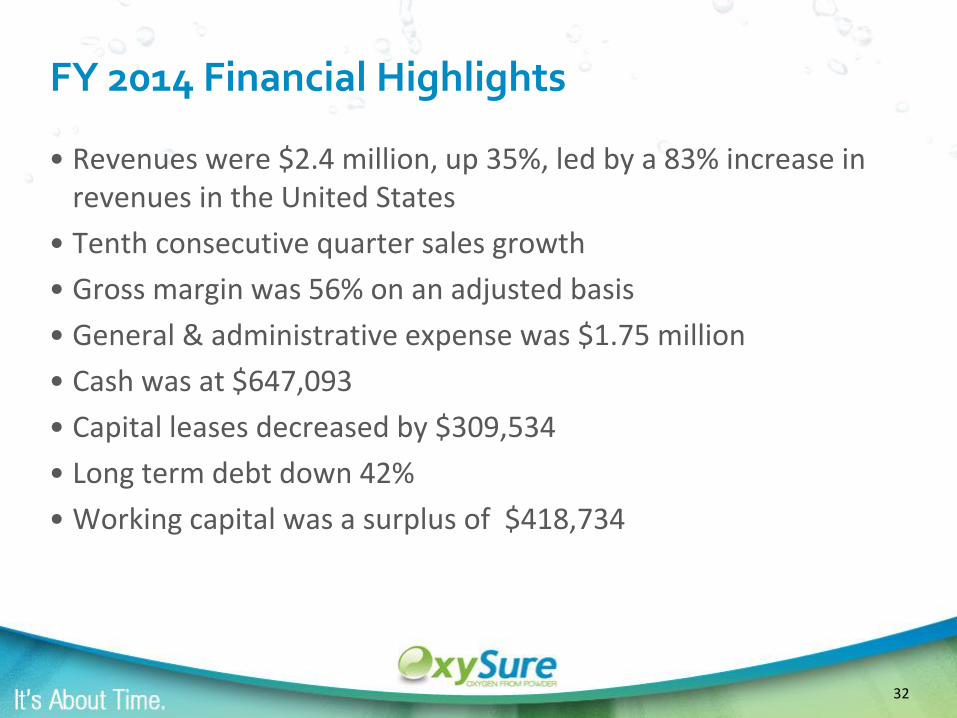
FY 2014 Financial Highlights
• Revenues were $2.4 million, up 35%, led by a 83% increase in revenues in the United States
• Tenth consecutive quarter sales growth
• Gross margin was 56% on an adjusted basis
• General & administrative expense was $1.75 million
• Cash was at $647,093
• Capital leases decreased by $309,534
• Long term debt down 42%
• Working capital was a surplus of $418,734

33
FY 2014 Financial Highlights, cont.
• Current ratio was 1.3
• Total assets increased 7% to $2,511,448
• Net loss per share for the year was $.10
• Model 615 shipments up 18%
• Replacement cartridge shipments up 35%
• Replacement cartridges up to 144% of Model 615 shipped
34
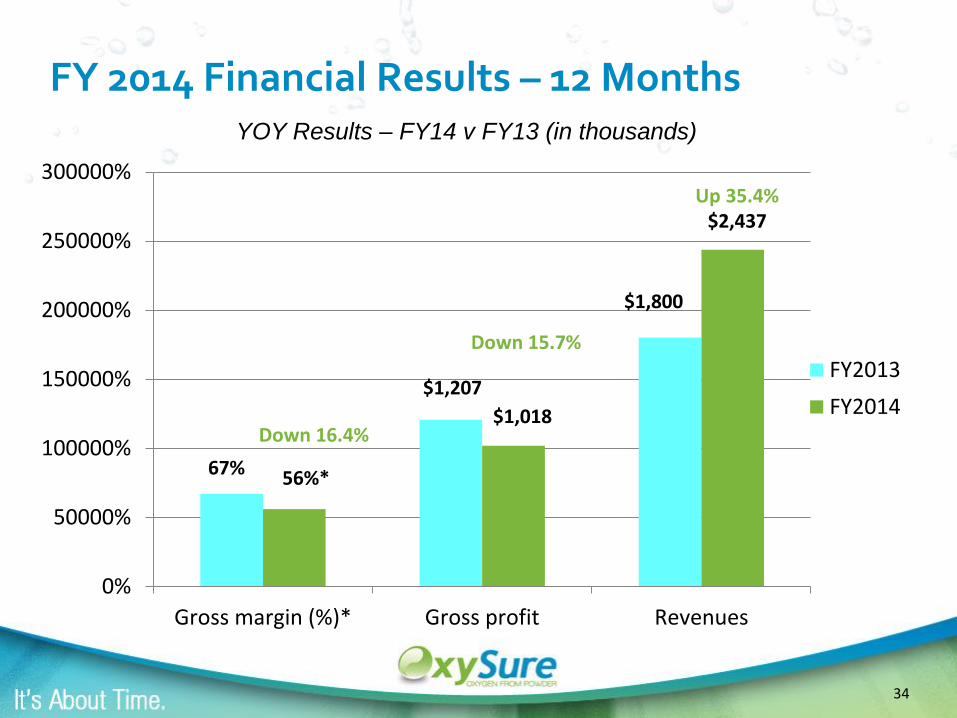
FY 2014 Financial Results – 12 Months
0%
50000%
100000%
150000%
200000%
250000%
300000%
Gross margin (%)* Gross profit Revenues
FY2013
FY2014
Up 35.4%
Down 15.7%
Down 16.4%
$1,207
$1,018
$1,800
$2,437
56%*67%
YOY Results – FY14 v FY13 (in thousands)
35
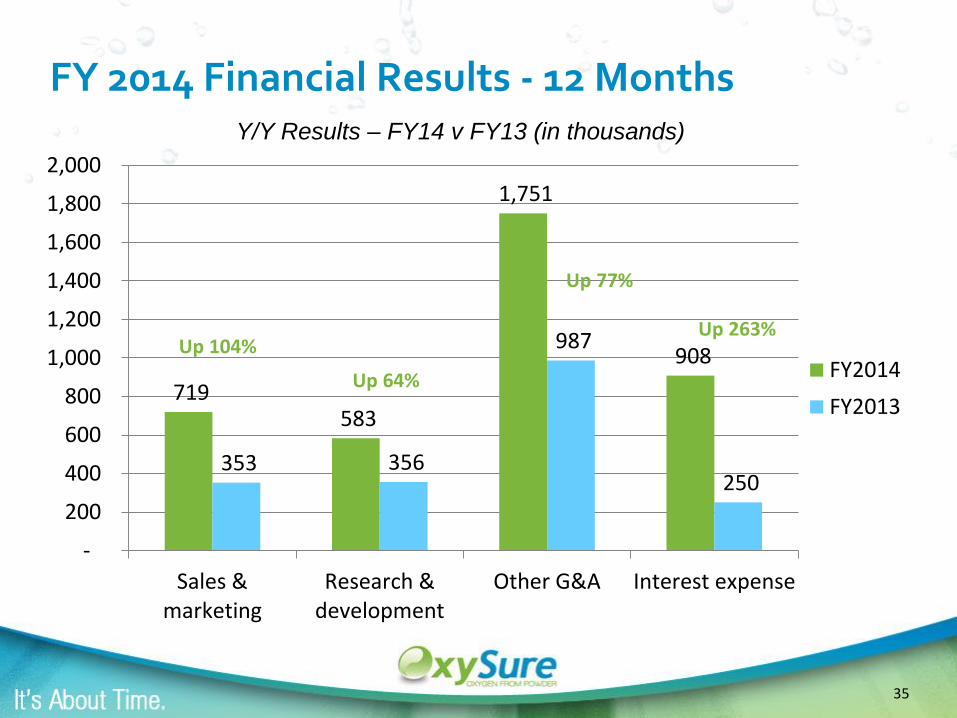
FY 2014 Financial Results - 12 Months
719 583
1,751
908
353 356
987
250
-
200
400
600
800
1,000
1,200
1,400
1,600
1,800
2,000
Sales &marketing
Research &development
Other G&A Interest expense
FY2014
FY2013
Up 104%
Up 64%
Up 77%
Up 263%
Y/Y Results – FY14 v FY13 (in thousands)

36
Other Financial Items
• Capital leases retired
• $2 Million in capital equipment off balance sheet
• Deferred income tax assets of $5.6 million
• Other balance sheet items
37
Other Highlights
• Expanded international distribution– $4.8 million in new contracts in 2014
• Received CE Mark Approval
• Appointed several new US distributors
• Made significant progress on the development of new products for the military
• Launched a pilot for a could based tracking and incident reporting system
38
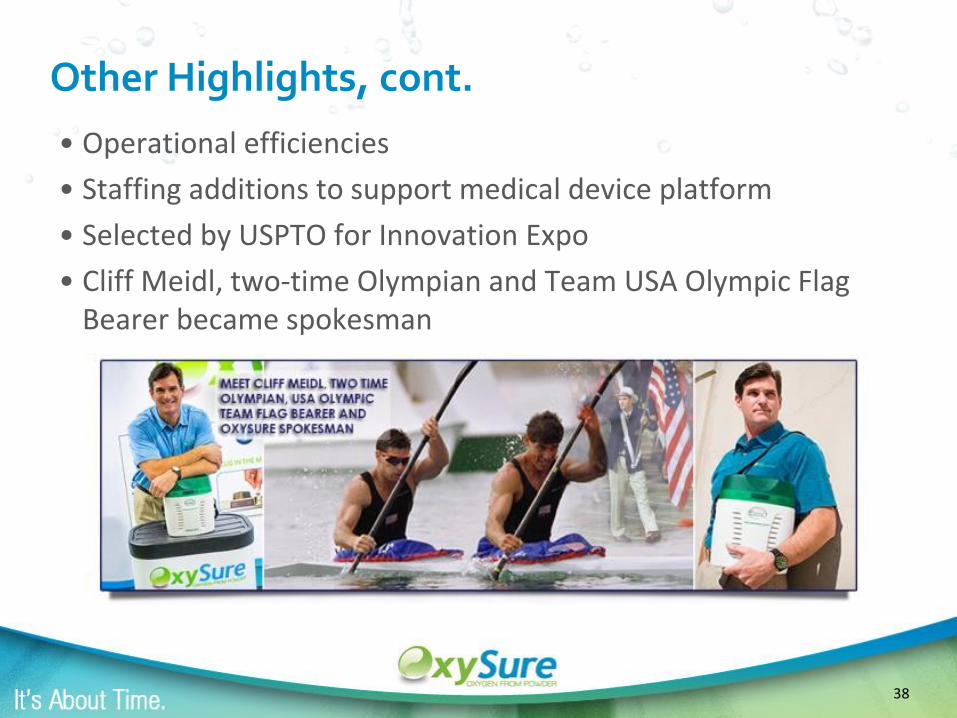
Other Highlights, cont.
• Operational efficiencies
• Staffing additions to support medical device platform
• Selected by USPTO for Innovation Expo
• Cliff Meidl, two-time Olympian and Team USA Olympic Flag Bearer became spokesman
39
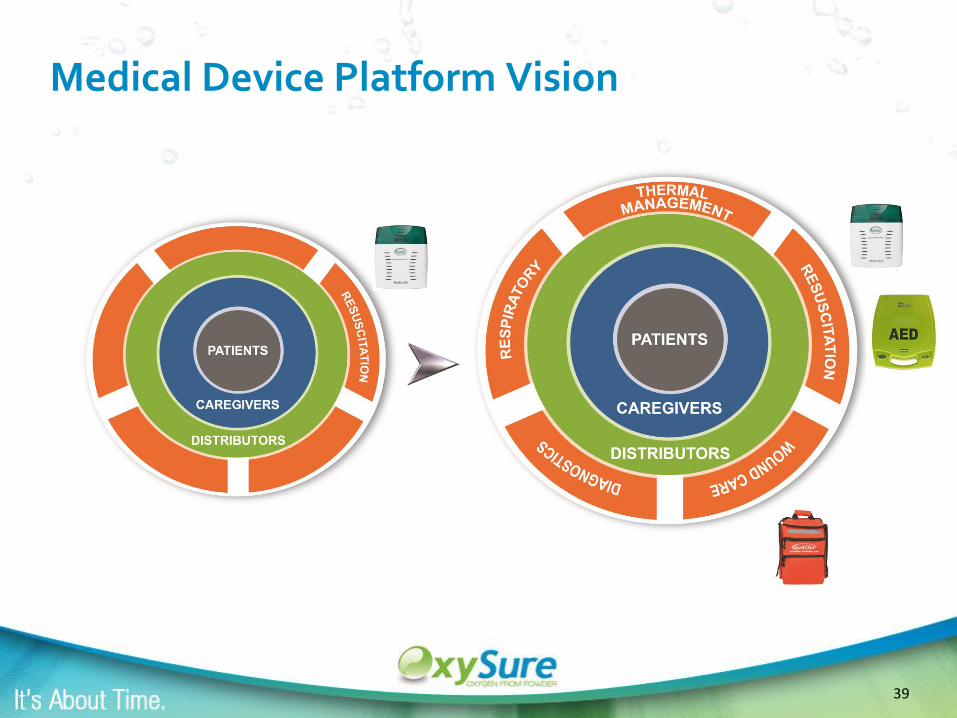
Medical Device Platform Vision
40
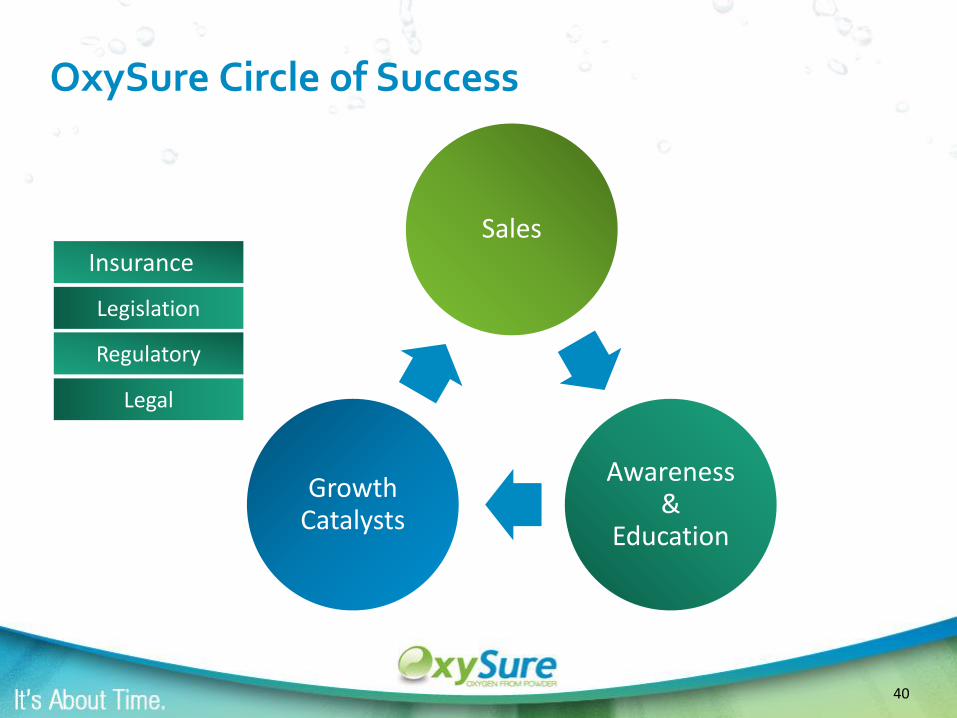
Sales
Awareness&
Education
Growth Catalysts
Legislation
OxySure Circle of Success
Insurance
Legal
Regulatory

41
Growth Strategy Next 3-5 Years
• Grow distributors; US + ROW
• Grow strategic accounts teams
• Pursue legislation / mandates
• Aggressively pursue 3 million+ unit ‘AED companion’ market, and 100 million+ unit general placement markets
• Services
Grow Placement Markets Grow At Risk Markets New Vertical Mass Markets
• Pursue insurance
reimbursement (Medicare, private)
• Execute rolling
short/long form commercial
campaign(s) targeting
100 million+ US and 500 million+ ROW ‘at
risk’ customers
• Services
• Military
• Mining
• Aviation
• Sports/Recreation
• Skin care
• Wound care
• Automotive
+ Strategic Alliances

42
Recently announced…
• Nasdaq uplisting support
• Expansion of Strategic Advisory Board
• Commercial Drone Approval from FAA
• Fastest Growing Companies in North Texas
43
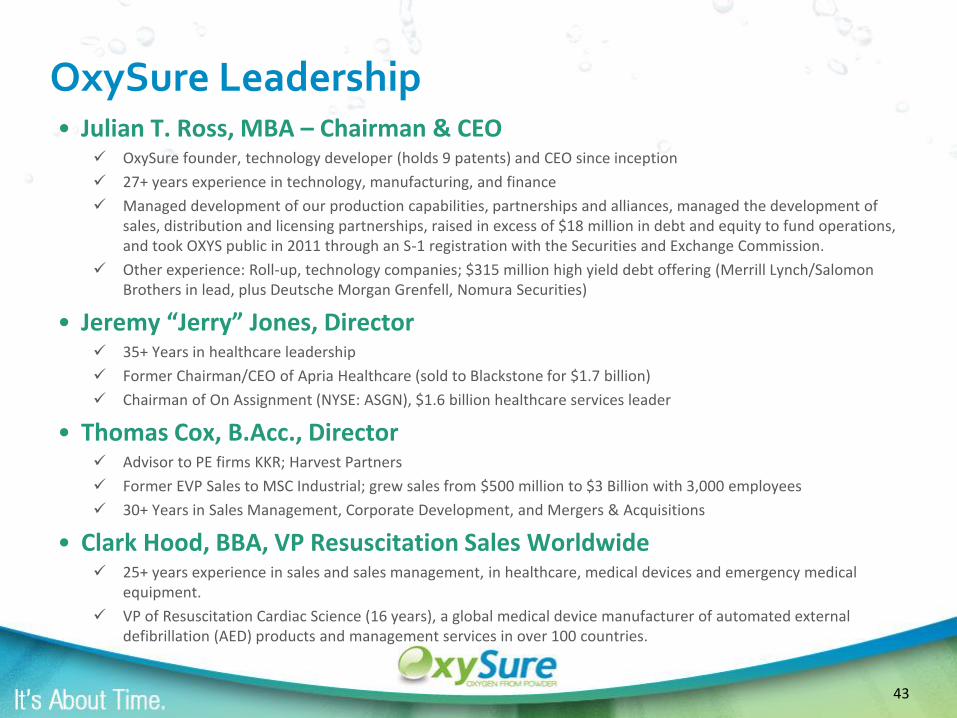
OxySure Leadership• Julian T. Ross, MBA – Chairman & CEO
OxySure founder, technology developer (holds 9 patents) and CEO since inception
27+ years experience in technology, manufacturing, and finance
Managed development of our production capabilities, partnerships and alliances, managed the development of sales, distribution and licensing partnerships, raised in excess of $18 million in debt and equity to fund operations, and took OXYS public in 2011 through an S-1 registration with the Securities and Exchange Commission.
Other experience: Roll-up, technology companies; $315 million high yield debt offering (Merrill Lynch/Salomon Brothers in lead, plus Deutsche Morgan Grenfell, Nomura Securities)
• Jeremy “Jerry” Jones, Director 35+ Years in healthcare leadership
Former Chairman/CEO of Apria Healthcare (sold to Blackstone for $1.7 billion)
Chairman of On Assignment (NYSE: ASGN), $1.6 billion healthcare services leader
• Thomas Cox, B.Acc., Director Advisor to PE firms KKR; Harvest Partners
Former EVP Sales to MSC Industrial; grew sales from $500 million to $3 Billion with 3,000 employees
30+ Years in Sales Management, Corporate Development, and Mergers & Acquisitions
• Clark Hood, BBA, VP Resuscitation Sales Worldwide 25+ years experience in sales and sales management, in healthcare, medical devices and emergency medical
equipment.
VP of Resuscitation Cardiac Science (16 years), a global medical device manufacturer of automated external defibrillation (AED) products and management services in over 100 countries.
44
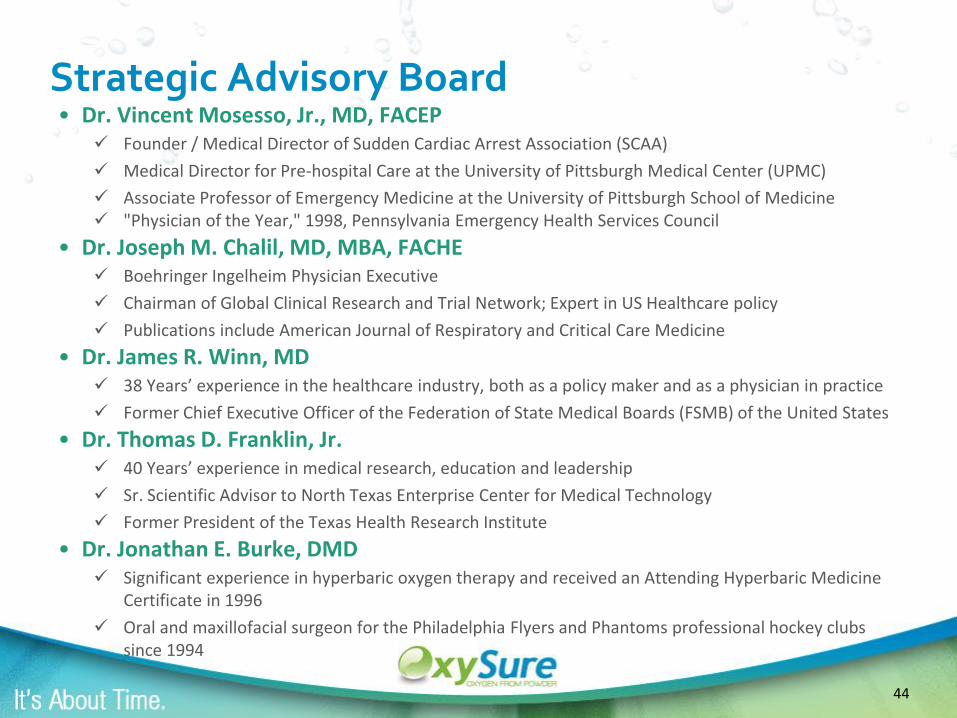
Strategic Advisory Board• Dr. Vincent Mosesso, Jr., MD, FACEP
Founder / Medical Director of Sudden Cardiac Arrest Association (SCAA)
Medical Director for Pre-hospital Care at the University of Pittsburgh Medical Center (UPMC)
Associate Professor of Emergency Medicine at the University of Pittsburgh School of Medicine "Physician of the Year," 1998, Pennsylvania Emergency Health Services Council
• Dr. Joseph M. Chalil, MD, MBA, FACHE Boehringer Ingelheim Physician Executive
Chairman of Global Clinical Research and Trial Network; Expert in US Healthcare policy
Publications include American Journal of Respiratory and Critical Care Medicine
• Dr. James R. Winn, MD 38 Years’ experience in the healthcare industry, both as a policy maker and as a physician in practice
Former Chief Executive Officer of the Federation of State Medical Boards (FSMB) of the United States
• Dr. Thomas D. Franklin, Jr. 40 Years’ experience in medical research, education and leadership
Sr. Scientific Advisor to North Texas Enterprise Center for Medical Technology
Former President of the Texas Health Research Institute
• Dr. Jonathan E. Burke, DMD Significant experience in hyperbaric oxygen therapy and received an Attending Hyperbaric Medicine
Certificate in 1996
Oral and maxillofacial surgeon for the Philadelphia Flyers and Phantoms professional hockey clubs since 1994
45
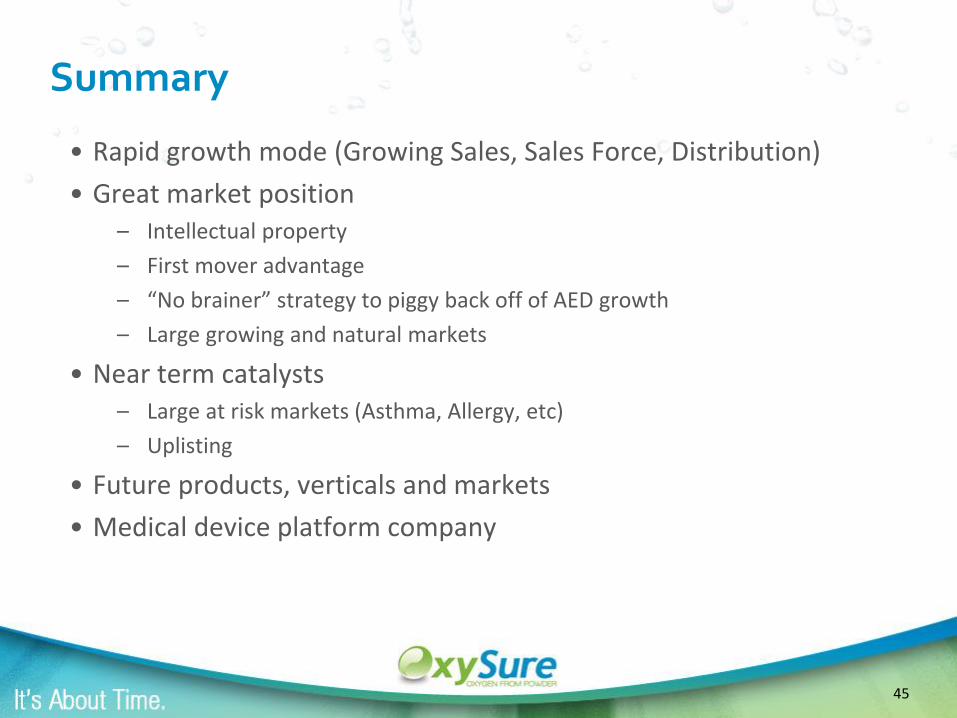
Summary
• Rapid growth mode (Growing Sales, Sales Force, Distribution)
• Great market position– Intellectual property
– First mover advantage
– “No brainer” strategy to piggy back off of AED growth
– Large growing and natural markets
• Near term catalysts– Large at risk markets (Asthma, Allergy, etc)
– Uplisting
• Future products, verticals and markets
• Medical device platform company
46
OxySure Systems, Inc.OXYS: OTCQB 10880 John W. Elliott Road, Suite 600Frisco, TX 75034 USA Tel: (+1) [email protected]
Redchip Companies, Inc. Renmark Financial Communications, Inc.800-733-2447, ext. 107 (416) 644-2020 Jon Cunningham Bettina Filippone: [email protected]@redchip.com Richard Dupuy: [email protected]/ www.renmarkfinancial.com/
Contact Information