Embed Size (px)
Citation preview

0
Gray Television, Inc.Investor PresentationNYSE:GTN
August 2021
Updated for June 30, 2021 Financial Information
4370 Peachtree Road, NE, Atlanta, GA 30319 | P 404.504.9828 | F 404.261.9607 | www.gray.tv

1
GRAY TELEVISION, INC.
Financial data reflects results “as reported” except where “Combined Historical Basis” (or “CHB”) is noted. Revenue is presented net of agency commissions. Ratings data derived from Comscore, Inc. (“Comscore”). ”Completed Transactions” includes all acquisitions or dispositions completed as of December 31, 2020. See Glossary at end for definitions. If Appendix is not included, see full presentation located at www.gray.tv for Non-GAAP Reconciliations.
Leading the Industry with the Highest Quality Portfolio of Local Television Stations

22
Gray Completes the Quincy Acquisition and Prepares to Complete the Meredith Acquisition, Transforming It Into the Nation’s Second Largest Broadcaster
113
89%
TV markets reaching 36% US TVHH
Markets with #1/#2 Ranked Stations
33
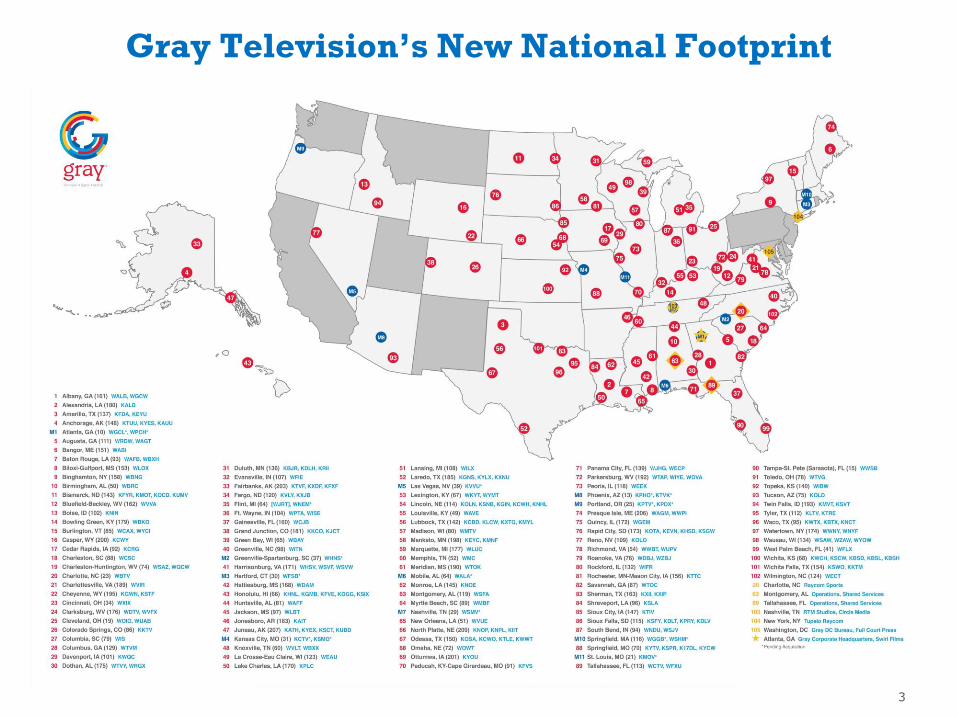
Gray Television’s New National Footprint

4
▪ 79 #1 Rated TV Stations
▪ $3.1 Billion in 2019/2020 CHB Blended Revenue
▪ Combined Quincy + Meredith is anticipated to be approximately 50% accretive to blended 2021/2022 FCF
▪ Highest CHB OCF(2) / TVHH in the Industry
▪ Both transactions announced and expected to close in 2021
Two Excellent Acquisitions
Source: Company filings, Nielsen and Comscore(1) Gives effect to all completed and
pending acquisitions and required regulatory divestitures
(2) Combined Historical Basis Operating Cash Flow as defined in the Senior Credit Agreement is equivalent to the presentation of Adj. EBITDA
Combination Highlights(1)
▪ On August 2, 2021, Gray completed its acquisition of Quincy Media, Inc.
for $925 million in cash and the related divestiture of 10 of Quincy’s
stations in seven overlap markets to Allen Media Broadcasting, LLC
(“Allen”) for $380 million.
▪ Acquisition adds 8 new markets, each with the #1 or #2 ranked television
station.
▪ Purchase price represents a multiple of 6.9x ’19/’20 EBITDA including $23
million of expected year-1 annualized synergies.
Gray Acquires Quincy Media
▪ Gray reached an agreement to acquire Meredith Corporation’s Local Media
Group for $2.825 billion in cash. Gray will divest one of its currently
owned television stations in the companies’ only overlap market to Allen
for $70 million.
▪ Acquisition to add 11 new markets, including the #1 or #2 ranked
television station in 8 markets. Closing expected in Q4 2021, following
receipt of regulatory and other approvals.
▪ Purchase price represents a multiple of 8.3x ’19/’20 operating cash flow
including $55 million of expected year-1 annualized synergies.
Gray to Acquire Meredith Local Media Group

5
Combined Company Snapshot
Source: Nielsen and Comscore
Note: RemainCo financial information compiled from unaudited financial statements of Local Media Group
(1) Pro forma for the divestiture of Quincy’s seven overlap markets and Gray’s station in Flint, MI; includes $23 million of synergies
(2) Includes $55 million of synergies
($ in Millions)
Financial Profile
2019 / 2020 CHB Blended Net Revenue $2,372 $770 $3,141 32%2019 / 2020 CHB Blended OCF $889 $286 $1,230 38%% Margin 37% 37% 39%
Scale
Markets 101 12 113 12%Gross TV Household Reach 25.0% 11.2% 36.2%
Asset Quality
Markets with #1 / #2 Ranked Stations 93 8 101 9%2018 CHB Political Revenue $262 $135 $397 52%2020 CHB Political Revenue $473 $219 $692 46%2020 CHB Gross Retransmission Revenue $904 $366 $1,270 41%
Gray + QuincyMeredith Local Media Group
(RemainCo)
Big 4
Network Affiliated
Channels
Gray + RemainCoPro Forma
Impact
59
57
29
27
1
7
1
5 60
64
30
32
(2)
(1)

6
Gray Will be the Second Largest TV Broadcast Group with the Highest Quality Assets
Source: Company filings, Wall Street research, BIA Investing in Television Market Report, Nielsen and Comscore
Note: Dollars in millions, except Adj. EBITDA / TV household; RemainCo financial information compiled from unaudited financial statements of Local Media Group
(1) Adj. EBITDA for Gray is Operating Cash Flow as defined in the Senior Credit Agreement
(2) Includes $55 million of synergies
(3) Pro forma for the divestiture of Quincy’s seven overlap markets and Gray’s station in Flint, MI; includes $23 million of synergies
(4) EBITDA estimates are derived from 2019 BIA revenue and extrapolate ’19A/’20E based on peer revenue growth and average peer EBITDA margin
(5) Based on 2020 broadcast revenue of $525 million and extrapolated based on estimated television peer revenue growth and ’19A/’20A EBITDA margin for Graham’s broadcast segment
TV Broadcast Affiliate Group Owners
2019 / 2020 CHB Blended Adj. EBITDA(1)
Financial
Adj. EBITDA / TVHH $24.5 $28.1 $20.5 $19.4 $29.4 $7.6 $19.3 $20.4 $21.2 $21.4
Operational
Markets 115 113 87 52 101 76 26 20 12 6
# 1 Rated Stations 28 79 18 12 76 9 9 4 3 2
% Markets with
#1 Rated Stations24% 70% 21% 23% 75% 12% 35% 20% 25% 33%
Markets with
#1 / #2 Rated Stations68 101 49 30 93 14 17 8 8 4
% Markets with
#1 / #2 Rated Stations59% 89% 56% 58% 92% 18% 65% 40% 67% 67%
% Nielsen TVHH 62% 36% 39% 39% 25% 72% 19% 13% 11% 7%
$1,837
$1,230
$959 $925 $889
$660
$435 $320 $286
$180
Nexstar Gray +
RemainCo
Sinclair (TV) TEGNA Gray +
Quincy
Scripps Hearst Cox Media
Group - TV
Meredith Local
Media Group
Graham (TV)(4) (4) (5)
(2) (3)
(RemainCo)
7
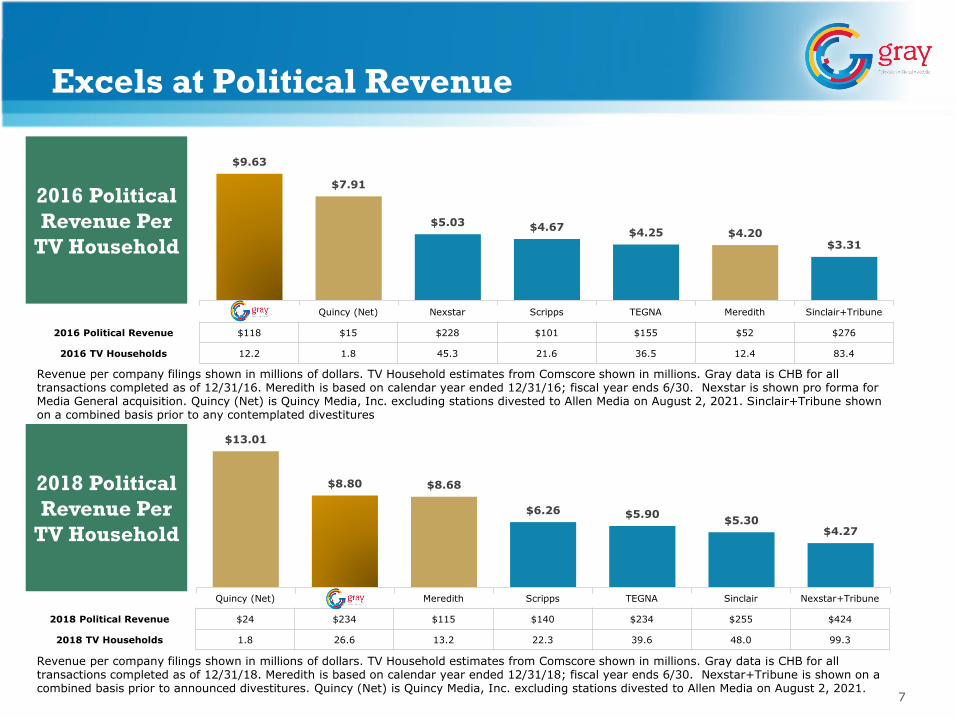
Quincy (Net) Meredith Scripps TEGNA Sinclair Nexstar+Tribune
2018 Political Revenue $24 $234 $115 $140 $234 $255 $424
2018 TV Households 1.8 26.6 13.2 22.3 39.6 48.0 99.3
Excels at Political Revenue
2016 Political
Revenue Per
TV Household
Revenue per company filings shown in millions of dollars. TV Household estimates from Comscore shown in millions. Gray data is CHB for all transactions completed as of 12/31/18. Meredith is based on calendar year ended 12/31/18; fiscal year ends 6/30. Nexstar+Tribune is shown on a combined basis prior to announced divestitures. Quincy (Net) is Quincy Media, Inc. excluding stations divested to Allen Media on August 2, 2021.
Revenue per company filings shown in millions of dollars. TV Household estimates from Comscore shown in millions. Gray data is CHB for all transactions completed as of 12/31/16. Meredith is based on calendar year ended 12/31/16; fiscal year ends 6/30. Nexstar is shown pro forma for Media General acquisition. Quincy (Net) is Quincy Media, Inc. excluding stations divested to Allen Media on August 2, 2021. Sinclair+Tribune shown on a combined basis prior to any contemplated divestitures
2018 Political
Revenue Per
TV Household
$9.63
$7.91
$5.03 $4.67 $4.25 $4.20
$3.31
z Quincy (Net) Nexstar Scripps TEGNA Meredith Sinclair+Tribune
2016 Political Revenue $118 $15 $228 $101 $155 $52 $276
2016 TV Households 12.2 1.8 45.3 21.6 36.5 12.4 83.4
$13.01
$8.80 $8.68
$6.26 $5.90 $5.30
$4.27

8
Well Positioned for Political Revenue
2020 Political
Revenue Per
TV Household
Revenue per company filings shown in millions of dollars. TV Household estimates from Comscore shown in millions. Gray PF is Gray (Net) plus Meredith (including synergies). Gray (Net) is CHB for all transactions closed as of August 2, 2021, and excludes the financial contribution of Gray’s WJRT in Flint, MI. Gray is As Reported for calendar year 2020. Meredith is based on calendar year ended 12/31/20; fiscal year ends 6/30.
Gray’s Local News Stations
Located Throughout the Most Competitive Political Areas in 2022
2022 Senate RacesGray Stations have a strong position throughout 8 of 9 Most Competitive Races (per Cook Political Report) -
AZ, FL, GA, NC, NH, OH, NV, WI.
2022 Gubernatorial RacesGray Stations in 31 of 36 States with Races – AK, AL, AR, AZ, CO, CT, FL, GA, HI, IA, ID, IL, KS, MA, MI,
ME, MN, NE, NH, NV, NY, OH, OK, OR, SC, SD, TN, TX, VT, WI, WY.
2022 House RacesAll 435 Districts, All Gray Markets.
$19.19 $18.77$17.57 $17.12
$11.60
$9.50 $8.10
$3.70
(PF) . (Net) Meredith TEGNA Sinclair (TV) Nexstar Scripps + Ion
2020 Political Revenue $692 $473 $430 $186 $446 $374 $508 $265
2020 TV Households 36.1 25.2 24.5 10.9 38.3 39.3 62.5 72.5

99
An Industry Leading Power
The following data is for
Gray Television, Inc.
BEFORE
giving effect to the completed Quincy Acquisition and pending
Meredith Acquisition.

10
Local News
Network Prime
Network News
Network Sports
Syndication
Other
Approximate AdvertisingRevenue Contributions 2019-2020
3%
13%
9%
Diversified Revenue
2020 Big 4 Affiliates
2020Revenues
2020Broadcast Cash Flow
36%
32%
14%
10%
8%
37%
31%
15%
9%
8%
55
52
28
25
All OthersAll Others
32%
8%
18%
36%
3% 3%
2020 Revenues
Local
National
Political
Retransmission
Production Companies
Other-TV Stations
50%
9%
16%

11
2021
2023
2022
Retransmission Revenue
Retransmission Expense (“Reverse Comp.”)
Retransmission Revenue net of Expense
55 82 103141
190
376 371
238 258326
377 371
20
7098
136
165
420496
282
206
351
422496
$75
$152
$201
$277
$355
$444
$540
$0
$200
$400
$600
$800
$1,000
2014 2015 2016 2017 2018 2019 2020 2016 2017 2018 2019 2020
Retransmission Revenue ($ in millions)
$799
$867
Strong Network and Distribution Positions
MVPD Subscribers Year-End Renewal Schedule
55% - 2020 (and 2023)
25% - 2021 (and 2024)
20% - 2022 (and 2025)
As Reported CHB
$677
$796
$867

12
OVER 1,000 CHANNELS
STREAMED ACROSS ALL PLATFORMS
RECORD BREAKING GROWTH FOR
GRAY’S PLATFORM IN 2020 OVER 2019:
Successful Digital Ventures
2020 SESSIONS: +24%
2020 VIDEO PLAYS: +13%
2020 USERS: +37%
2020 PAGE VIEWS: +13%
1.1 BILLION MONTHLY AGGREGATE USERS IN 2020
Gray’s in-house Digital Agency Servicing over 2,200 campaigns monthly.
With a suite of 15+ products and service offerings.
Premion delivers
brand-safe CTV and OTT impressions at scale, with
full transparency for
advertisers, across 125+ premium networks.
Provides a free,
ad-supported national streaming service with live and
on-demand video streaming channels, with both local and
unique programming.
13
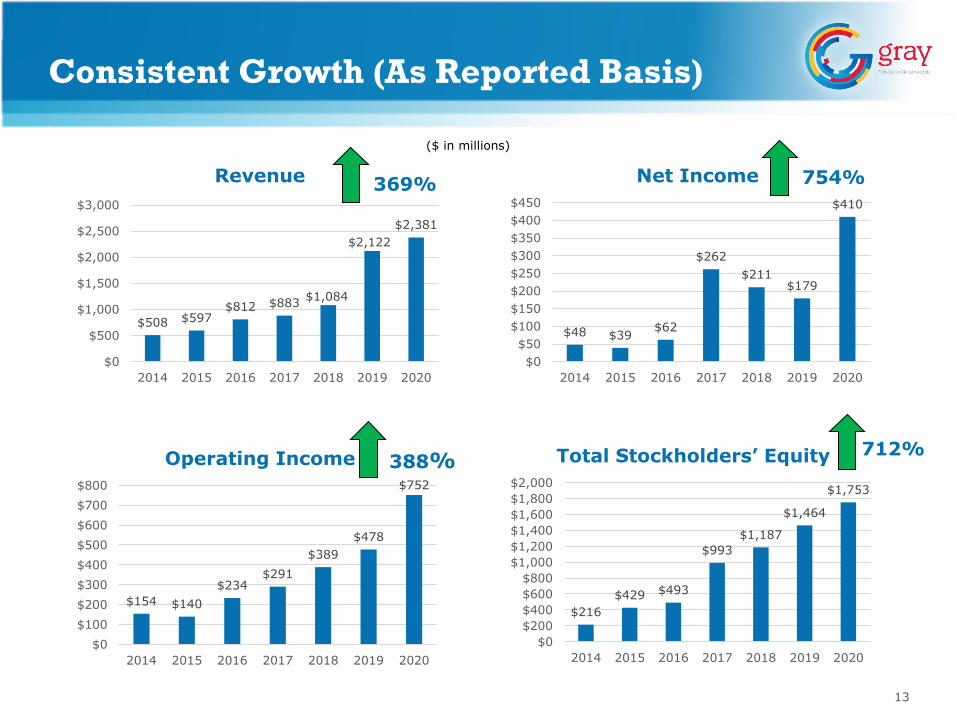
Consistent Growth (As Reported Basis)
$508 $597$812 $883
$1,084
$2,122
$2,381
$0
$500
$1,000
$1,500
$2,000
$2,500
$3,000
2014 2015 2016 2017 2018 2019 2020
Revenue
$154 $140
$234$291
$389
$478
$752
$0
$100
$200
$300
$400
$500
$600
$700
$800
2014 2015 2016 2017 2018 2019 2020
Operating Income
$48 $39$62
$262
$211$179
$410
$0
$50
$100
$150
$200
$250
$300
$350
$400
$450
2014 2015 2016 2017 2018 2019 2020
Net Income
$216
$429 $493
$993
$1,187
$1,464
$1,753
$0
$200
$400
$600
$800
$1,000
$1,200
$1,400
$1,600
$1,800
$2,000
2014 2015 2016 2017 2018 2019 2020
Total Stockholders’ Equity
369% 754%
388%712%
($ in millions)

14
2019 CHB 2020 Average
FCF Per Diluted Share
$4.65
FCF as a Percentage of OCF
55%
Presidential Election Year
2020 OCF Buildup
FCF Per Diluted Share
$5.76
FCF as a Percentage of OCF59%
$93
$216
$91
$216
$102
$216 $216 $216$180 $198
$52 $52 $52 $52 $52$52
$52
$44
$70
$35
$57
$56
$74 $69 $69$81 $75
$148
$400
$171
$301
$263
$534
$273$358
$559$458
$15$66
$2 $64 $34 $38 $23 $23$70 $47
$0
$100
$200
$300
$400
$500
$600
$700
$800
$900
$1,000
CHB CHB CHB CHB Average
2016 2017 2018 2019 2020 19CHB/20
$942(2)
$299(2)
Robust Free Cash Flow Generation and Conversion
(1) CHB interest expense for 2016, 2017, 2018 and 2019 estimated with incremental indebtedness and estimated cash interest relating to acquisition debt financing as if the acquisition debt financing had occurred on the first day of the period reported
(2) As reported OCF is equal to Broadcast Cash Flow less Cash Corporate Expenses plus Pension Expense less Pension Contributions
Taxes Cash Interest excluding amortization of deferred financing costs/premiums (1) Preferred Dividends Capex Free Cash Flow
$690
$455(2)
$914
($ in millions)
$830
$300(2)
$804
$633(2)
$718
Presidential Election Year
2016 OCF Buildup
FCF Per Diluted Share
$2.04 $4.75
FCF as a Percentage of OCF
49% 50%
Non-Election Year
2017 OCF Buildup
FCF Per Diluted Share
$2.32 $3.53
FCF as a Percentage of OCF
57% 44%
Midterm Election Year 2018 OCF
Buildup
FCF Per Diluted Share
$2.96 $5.32
FCF as a Percentage of OCF
58% 58%
Non-Election Year 2019 OCF
Buildup
FCF Per Diluted Share
$2.72 $3.58
FCF as a Percentage of OCF
43% 50%

15
2.6x1.9x
0.8x 0.6x
3.0x
2.0x1.2x 1.2x
3.4x
2.9x4.3x
3.6x
2.4x
2.7x 2.7x
6.0x
4.8x5.1x
4.2x4.4x
3.95x 3.92x
2014 2015 2016 2017 2018 2019 2020 2Q2021
3.0x
Note: Financial leverage excludes preferred stock
(1) For 2014 and 2021, total debt netting all cash includes $10 million and $1 million in undrawn letters
of credit, respectively
(2) Last eight quarter average OCF as calculated in the applicable quarterly compliance certificate
(3) Operating Cash Flow (“OCF”) as defined under the existing credit agreement, which includes
adjustments for all transactions completed as of the respective balance sheet dates
(4) Secured debt netting all cash on hand as of the respective balance sheet date
Successful Integration of Acquisitions And Meaningful Deleveraging
7.1
$288
Total debt netting all cash (in millions)
L8QA(2) OCF(3) (in millions) $200 $235
As of the respective period end:
$383
Secured Debt Netting All Cash(4) / OCF(3)
Unsecured Debt Netting All Cash / OCF(3)
Guidance YE 2021 Net
Leverage Ratio:
Approximately 5.4x
Projected total debt (excluding preferred stock) net of all cash,
assuming no M&A other than the Quincy Media
and Meredith acquisitions on trailing 8-quarter
basis
Financial Leverage Net of All Cash (as defined in our Senior Credit Facility)
$826$816$336
$1,134 $1,201(1) $1,456 $1,399 $1,154 $3,262$3,548 $3,251
$828

16
Note: For illustrative purposes, excludes Incremental Term Loan B amortization
Staggered Debt Maturity Profile
($ in Millions)
No Maturities until 2024
Term Loan B Due Feb 2024 (L+225)
$0
$500
$1,000
$1,500
$2,000
$2,500
2021 2022 2023
$595
2024 2025
$300 Million Revolver Due Jan 2026 ($299 Million Undrawn; $1 Million Letter of Credit Issued)
Term Loan C Due Jan 2026 (L+250)
Senior Notes Due Jul 2026 (5.875%)
Senior Notes Due May 2027 (7.000%)
Senior Notes due October 2030 (4.750%)
$750
2027
$4.0 Billion Total Principal Amount of Debt Outstanding
at June 30, 2021
2028/2029
$800
2030
$700
$299
2026
$1,190

1717
(1) Excludes depreciation, amortization and (gain) loss on disposal of assets.
(2) See definition of non-GAAP terms and a reconciliation of the non-GAAP amounts to net income included elsewhere herein.
(3) Transaction Related Expenses are incremental expenses incurred specific to acquisitions and divestitures, including but not limited to, legal and professional fees, severance and incentive compensation
and contract termination fees.
As Reported 2Q 2021
% Change % Change
2021 to 2021 to
2021 2020 2020 2019 2019
Revenue (less agency commissions):
Broadcasting 1,067$ 964$ 11 % 980$ 9 %
Production companies 24 21 14 % 46 (48)%Total revenue 1,091$ 985$ 11 % 1,026$ 6 %
Political advertising revenue 15$ 57$ (74)% 8$ 88 %
Operating expenses (1):
Broadcasting 715$ 659$ 8 % 670$ 7 %
Production companies 26$ 24$ 8 % 44$ (41)%
Corporate and administrative 43$ 32$ 34 % 69$ (38)%
Net income 78$ 64$ 22 % 26$ 200 %
Non-GAAP cash flow (2):
Broadcast Cash Flow 351$ 304$ 15 % 308$ 14 %
Broadcast Cash Flow Less
Cash Corporate Expenses 314$ 276$ 14 % 244$ 29 %
Free Cash Flow 112$ 120$ (7)% 73$ 53 %
Transaction Related Expenses included in operating expenses (3):
Broadcasting -$ -$ 37$
Production companies -$ -$ -$
Corporate and administrative 8$ -$ 33$
Miscellaneous expense 7$ -$ -$
Six Months Ended June 30,

1818
(1) Excludes depreciation, amortization and (gain) loss on disposal of assets.
(2) See definition of non-GAAP terms and a reconciliation of the non-GAAP amounts to net income included elsewhere herein.
(3) Transaction Related Expenses are incremental expenses incurred specific to acquisitions and divestitures, including but not limited to, legal and professional fees, severance and incentive
compensation and contract termination fees.
As Reported Year-End
2020 2019
% Change
2020 to
2019 2018
% Change
2020 to
2018
Revenue (less agency commissions):
Broadcasting 2,320$ 2,035$ 14 % 1,084$ 114 %
Production companies 61 87 (30)% -
Total revenue 2,381$ 2,122$ 12 % 1,084$ 120 %
Political advertising revenue 430$ 68$ 532 % 155$ 177 %
Operating expenses (1):
Broadcasting 1,340$ 1,325$ 1 % 596$ 125 %
Production companies 52$ 74$ (30)% -$
Corporate and administrative 65$ 104$ (38)% 41$ 59 %
Net income 410$ 179$ 129 % 211$ 94 %
Non-GAAP Cash Flow (2):
Broadcast Cash Flow 999$ 729$ 37 % 493$ 103 %
Broadcast Cash Flow Less Cash Corporate Expenses 945$ 636$ 49 % 457$ 107 %
Free Cash Flow 559$ 273$ 105 % 263$ 113 %
Transaction related expenses included in operating expenses (3):
Broadcasting -$ 45$ 3$
Production companies -$ -$ -$
Corporate and administrative 1$ 34$ 8$
Year Ended December 31,
(dollars in millions)
1919
Appendix: Non-GAAP Reconciliations,
Disclaimers, and Definitions

20
Reconciliation of Non-GAAP terms on As Reported Basis, in millions
Non-GAAP Reconciliation
2021 2020 2019
Net income 78$ 64$ 26$
Adjustments to reconcile from net income to
Free Cash Flow:
Depreciation 50 42 40
Amortization of intangible assets 53 52 57
Non-cash stock-based compensation 7 7 5
Non-cash 401(k) expense 1 - -
Gain on disposal of assets, net (5) (13) (13)
Miscellaneous expense (income), net 6 3 (4)
Interest expense 95 98 116
Income tax expense 30 24 21
Amortization of program broadcast rights 17 19 20
Payments for program broadcast rights (18) (20) (24)
Corporate and administrative expenses before
depreciation, amortization of intangible assets and
non-cash stock-based compensation 37 28 64
Broadcast Cash Flow 351 304 308
Corporate and administrative expenses before
depreciation, amortization of intangible assets and
non-cash stock-based compensation (37) (28) (64)
Broadcast Cash Flow Less Cash Corporate Expenses 314 276 244
Interest expense (95) (98) (116)
Amortization of deferred financing costs 6 6 6
Preferred stock dividends (26) (26) (26)
Common stock dividends (15) - -
Purchases of property and equipment (1) (41) (51) (44)
Reimbursements of property and equipment purchases 7 14 17
Income taxes paid, net of refunds (38) (1) (8)
Free Cash Flow 112$ 120$ 73$
Six Months Ended June 30,
(1) Excludes approximately $80 million related to the purchase of land in Doraville, Georgia.

21
Reconciliation of Non-GAAP terms on As Reported Basis, in millions
Non-GAAP Reconciliation
(1) Amounts in 2017 have been reclassified to give effect to the implementation of ASU 2017-07.
2020 2019 2018 2017
Net income 410$ 179$ 211$ 262$
Adjustments to reconcile from net income to
Free Cash Flow:
Depreciation 96 80 54 52
Amortization of intangible assets 105 115 21 25
Non-cash stock-based compensation 16 16 7 8
Gain on disposal of assets, net (29) (54) (17) (74)
Miscellaneous expense (income), net 5 (4) (6) -
Interest expense 191 227 107 95
Loss on early extinguishment of debt 12 - - 3
Income tax expense 134 76 77 (69)
Amortization of program broadcast rights 38 39 21 21
Non-cash 401(k) expense 6 5 4 -
Payments for program broadcast rights (39) (43) (22) (21)
Corporate and administrative expenses before
depreciation, amortization of intangible assets and
non-cash stock-based compensation 54 93 36 27
Broadcast Cash Flow (1) 999 729 493 329
Corporate and administrative expenses before
depreciation, amortization of intangible assets and
non-cash stock-based compensation (54) (93) (36) (27)
Broadcast Cash Flow Less Cash Corporate Expenses (1) 945 636 457 302
Contributions to pension plans (3) (3) (2) (3)
Interest expense (191) (227) (107) (95)
Amortization of deferred financing costs 11 11 5 4
Preferred stock dividends (52) (52) - -
Purchase of property and equipment (110) (110) (70) (35)
Reimbursements of property and equipment purchases 29 41 14 -
Income taxes paid, net of refunds (70) (23) (34) (2)
Free Cash Flow 559$ 273$ 263$ 171$
Year Ended
December 31,

22
Non-GAAP Reconciliation
Reconciliation of Non-GAAP terms on a Combined Historical Basis, in millions
(1) Amounts in 2017 have been reclassified to give effect to the implementation of ASU 2017-07.
2019 2018 2017
Net income 157$ 288$ 648$
Adjustments to reconcile from net income to
Free Cash Flow:
Depreciation 81 86 86
Amortization of intangible assets 115 117 124
Non-cash stock-based compensation 16 15 14
Gain on disposal of assets, net (35) (7) (155)
Miscellaneous (income) expense, net (3) 4 1
Interest expense 227 227 227
Loss from early extinguishment of debt - - 5
Income tax (benefit) expense 76 74 (354)
Amortization of program broadcast rights 40 42 41
Common stock contributed to 401(k) plan
excluding corporate 401(k) contributions 4 4 -
Payments for program broadcast rights (44) (42) (41)
Corporate and administrative expenses excluding
depreciation, amortization of intangible assets and
non-cash stock-based compensation 92 72 54
Broadcast Transaction Related Expenses 45 3 3
Broadcast other adjustments 8 11 13
Broadcast Cash Flow (1) 779 894 666
Corporate and administrative expenses excluding
depreciation, amortization of intangible assets and
non-cash stock-based compensation (92) (72) (54)
Broadcast Cash Flow Less Cash Corporate Expenses (1) 687 822 612
Contributions to pension plans (3) (2) (3)
Corporate Transaction Related Expenses 34 14 1
Synergies and other adjustments - 80 80
Operating Cash Flow as Defined in Senior Credit Facility (1) 718 914 690
Interest expense (227) (227) (227)
Amortization of deferred financing costs 11 11 11
Preferred dividends (52) (52) (52)
Purchase of property and equipment (110) (88) (57)
Reimbursement of purchases of property and equipment 41 14 -
Income taxes paid, net of refunds (23) (38) (64)
Free Cash Flow 358$ 534$ 301$
Year Ended
December 31,

23
Reconciliation of Total Leverage Ratio (in millions)
Eight Quarters
Ended
June 30, 2021
Net income 642$
Adjustments to reconcile from net income to Operating Cash Flow as
defined in our Senior Credit Agreement:
Depreciation 186
Amortization of intangible assets 216
Non-cash stock-based compensation 33
Gain on disposal of assets, net (74)
Interest expense 397
Loss on early extinguishment of debt 12
Income tax expense 218
Amortization of program broadcast rights 74
Common stock contributed to 401(k) plan 12
Payments for program broadcast rights (80)
Pension benefit (2)
Contributions to pension plans (6)
Adjustments for unrestricted subsidiaries 1
Adjustments for stations acquired or divested, financings and expected
synergies during the eight quarter period 1
Transaction Related Expenses 26
Operating Cash Flow as defined in our Senior Credit Agreement 1,656$
Operating Cash Flow as defined in our Senior Credit Agreement,
divided by two 828$
June 30, 2021
Adjusted Total Indebtedness:
Total outstanding principal 4,035$
Letters of credit outstanding 1
Cash (785)
Adjusted Total Indebtedness, Net of All Cash 3,251$
Total Leverage Ratio, Net of All Cash 3.92

24
From time to time, Gray supplements its financial results prepared in accordance with accounting principles generally accepted in the United States of America (“GAAP”) by disclosing the non-GAAP financial measures Broadcast Cash Flow, Broadcast Cash Flow Less Cash Corporate Expenses, Operating Cash Flow as defined in Gray’s Senior Credit Agreement, Free Cash Flow and Total Leverage Ratio, Net of All Cash. These non-GAAP amounts are used by us to approximate the amount used to calculate key financial performance covenants contained in our debt agreements and are used with our GAAP data to evaluate our results and liquidity. These non-GAAP amounts may be provided on an As-Reported Basis as well as a Combined Historical Basis.
“Broadcast Cash Flow” or “BCF” Net income or loss plus loss from early extinguishment of debt, non-cash corporate and administrative expenses, non-cash stock based compensation, depreciation and amortization (including amortization of intangible assets and program broadcast rights), any loss on disposal of assets, any miscellaneous expense, interest expense, any income tax expense, non-cash 401(k) expense, Broadcast Transactions Related Expenses and broadcast other adjustments less any gain on disposal of assets, any miscellaneous income, any income tax benefits and payments for program broadcast rights.
“Broadcast Cash Flow Less Cash Corporate Expenses”
Net income or loss plus loss from early extinguishment of debt, non-cash stock based compensation, depreciation and amortization (including amortization of intangible assets and program broadcast rights), any loss on disposal of assets, any miscellaneous expense, interest expense, any income tax expense, non-cash 401(k) expense, Broadcast Transactions Related Expenses and broadcast other adjustments less any gain on disposal of assets, any miscellaneous income, any income tax benefits and payments for program broadcast rights.
“Free Cash Flow” or “FCF” Net income or loss plus loss from early extinguishment of debt, non-cash stock based compensation, depreciation and amortization (including amortization of intangible assets and program broadcast rights), any loss on disposal of assets, any miscellaneous expense, any income tax expense, non-cash 401(k) expense, Broadcast Transactions Related Expenses, broadcast other adjustments, certain pension expenses, Corporate Transaction Related Expenses, synergies, other adjustments and amortization of deferred financing costs less any gain on disposal of assets, any miscellaneous income, any income tax benefits, payments for program broadcast rights, pension income, contributions to pension plans, preferred dividends, purchase of property and equipment (net of reimbursements) and income taxes paid (net of any refunds received).
“Operating Cash Flow” or “OCF” Defined in our Senior Credit Agreement as net income or loss plus loss from early extinguishment of debt, non-cash stock based compensation, depreciation and amortization (including amortization of intangible assets and program broadcast rights), any loss on disposal of assets, any miscellaneous expense, interest expense, any income tax expense, non-cash 401(k) expense, Broadcast Transactions Related Expenses, broadcast other adjustments, certain pension expenses, Corporate Transaction Related Expenses, synergies and other adjustments less any gain on disposal of assets, any miscellaneous income, any income tax benefits, payments for program broadcast rights, pension income and contributions to pension plans.
“Total Leverage Ratio, Net of All Cash”
Our Total Leverage Ratio, Net of All Cash is determined by dividing our Adjusted Total Indebtedness, Net of All Cash by our Operating Cash Flow as defined in our Senior Credit Agreement, divided by two. Our Adjusted Total Indebtedness, Net of All Cash represents the total outstanding principal of our long-term debt, plus certain other obligations as defined in our Senior Credit Agreement, less all cash (excluding restricted cash). Our Operating Cash Flow as defined in our Senior Credit Agreement, divided by two, represents our average annual Operating Cash Flow as defined in our Senior Credit Agreement for the preceding eight quarters.
These non-GAAP terms are not defined in GAAP and our definitions may differ from, and therefore not be comparable to, similarly titled measures used by other companies, thereby limiting their usefulness. Such terms are used by management in addition to and in conjunction with results presented in accord-ance with GAAP and should be considered as supplements to, and not as substitutes for, net income and cash flows reported in accordance with GAAP.
Non-GAAP Terms

25
Disclaimers, Definitions, and Non-GAAP Financial Data
This presentation contains certain forward looking statements that are based largely on Gray Television, Inc.’s (“Gray”, “Gray Television”, “GTN” or the “Company”) current expectations and reflect various estimates and assumptions by Gray. These statements may be identified by words such as “estimates”, “expect,” “anticipate,” “will,” “implied,” “assume” and similar expressions. Forward looking statements are subject to certain risks, trends and uncertainties that could cause actual results and achievements to differ materially from those expressed in such forward looking statements. Such risks, trends and uncertainties which in some instances are beyond Gray’s control, include Gray’s inability to complete its pending acquisition of Meredith on the terms and within the time frame contemplated, any material regulatory or other unexpected requirements in connection therewith, Gray’s inability to complete the integration of our acquisition of Quincy, the inability to achieve expected synergies from its pending acquisition of Meredith or acquisition of Quincy on a timely basis or at all, estimates of future retransmission revenue, future expenses and other future events. Gray is subject to additional risks and uncertainties described in Gray’s quarterly and annual reports filed with the Securities and Exchange Commission from time to time, including in the “Risk Factors,” and management’s discussion and analysis of financial condition and results of operations sections contained therein. Any forward lookingstatements in this presentation should be evaluated in light of these important risk factors. This presentation reflects management’s views as of the date hereof. Except to the extent required by applicable law, Gray undertakes no obligation to update or revise any information contained in this presentation beyond the published date, whether as a result of new information, future events or otherwise.
The financial information attributable to Meredith Local Media Group for each of the periods presented are based on good faith estimates and assumptions of Gray management derived entirely from financial information provided by each respective entity in the due diligence process prior to our ownership and control thereof. Accordingly, although we believe such information to be accurate, such information cannot be independently verified by our management. This financial information also includes certain non-GAAP financial measures that are dependent on financial results that are not yet determinable with certainty. We are unable to present a quantitative reconciliation of the estimated non-GAAP financial measures to their most directly comparable GAAP financial measures because such information is not yet available and management cannot reliably estimate all of the necessary components of such GAAP measures without unreasonable effort or expense. In addition, we believe such reconciliation would imply a degree of precision that would be confusing or misleading to investors.
Combined Historical Basis reflects financial results that have been compiled by adding Gray’s historical revenue and broadcast expenses to the historical revenue and broadcast expenses of the stations acquired in the completed transactions and subtracting the historical revenues and broadcast expenses of stations divested in the completed transactions as if they had been acquired or divested, respectively, on January 1, 2016 (the beginning of the earliest period presented).
Combined Historical Basis financial information does not include any adjustments for other events attributable to the completed transactions except “Broadcast Cash Flow,” “Broadcast Cash Flow Less Cash Corporate Expenses,” “Operating Cash Flow,” “Operating Cash Flow as Defined in the Senior Credit Agreement” and “Total Leverage Ratio, Net of All Cash” each give effect to expected synergies, and “Free Cash Flow” on a Combined Historical Basis gives effect to the financings and certain expected operating synergies related to the completed transactions. “Operating Cash Flow,” “Operating Cash Flow as Defined in the Senior Credit Agreement” and “Total Leverage Ratio, Net of All Cash” on a Combined Historical Basis also reflect the add-back of legal and other professional fees incurred in completing acquisitions. Certain of the Combined Historical Basis financial information has been derived from, and adjusted based on, unaudited, unreviewed financial information prepared by other entities, which Gray cannot independently verify. We cannot assure you that such financial information would not be materially different if such information were audited or reviewed and no assurances can be provided as to the accuracy of such information, or that our actual results would not differ materially from the Combined Historical Basis financial information if the completed transactions had been completed at the stated date. In addition, the presentation of Combined Historical Basis, “Broadcast Cash Flow,” “Broadcast Cash Flow Less Cash Corporate Expenses,” “Operating Cash Flow,” “Operating Cash Flow as Defined in the Senior Credit Agreement,” “Total Leverage Ratio, Net of All Cash,” “Free Cash Flow,” and the adjustments to such information, including expected synergies resulting from such transactions, may not comply with GAAP or the requirements for pro forma financial information under Regulation S-X under the Securities Act.

26
Gray Television, Inc.4370 Peachtree Rd., NE
Atlanta, Georgia 30319
www.gray.tv