Embed Size (px)
Citation preview

Collec&ng Data to address the Social Determinants of Health
Healthcare Interpreta&on Network October 22, 2014
Andrew Pinto MD CCFP FRCPC MSc
Department of Family and Community Medicine, St. Michael’s Hospital Department of Family and Community Medicine, Faculty of Medicine, University of Toronto
Centre for Research on Inner City Health, St. Michael’s Hospital

No specific financial conflict of interest. Salary support: • Department of Family & Community Medicine, St. Michael’s Hospital • Department of Family & Community Medicine, Faculty of Medicine,
University of Toronto Research funding: • Ontario Ministry of Health and Long-‐Term Care • TD Financial Literacy Grant Fund • PSI Founda&on • Legal Aid Ontario The premise of this discussion is working towards social jus*ce and hence, a more healthy society. This is my objec&ve as a physician, ac&vist and public scholar. I bring a privileged world-‐view and set of experiences to this work. I do not bring the lived experience of being a member of a marginalized popula&on.

Acknowledgements SDOH Commi=ee Gary Bloch (physician, Chair) Daniel Bois (nurse) Jacqueline Chen (clinical manager) Ka&e Dorman (resident physician) Laura Easty (resident physician) Melinda Glassford (die&cian) Laurie Green (physician) Sue Hranilovic (nurse prac&&oner) Laurie Malone (execu&ve director) Anthony Mohamed (senior specialist equity & community engagement) Nav Persaud (physician) Danyaal Raza (physician) Katherine Rouleau (physician) Courtney Ruddy (clerical) Mannie Sarao (resident physician) Celia Schwartz (social worker) Karen Tomlinson (income security health promoter)
OCFP Poverty Commi`ee Health Providers Against Poverty IGNITE Study Team Ahmed Bayoumi Gary Bloch Muhammad Mamdani Nav Persaud Linda Rozmovits Kevin Thorpe EMBER Study Team Ri&ka Goel Yogendra Shakya Gary Bloch Deena Ladd Anthony Mohamed

Outline
1. Our role in addressing SDOH 2. Developing a SDOH Commi`ee 3. Collec&ng socio-‐demographic data 4. Ques&ons and feedback

OUR ROLE IN ADDRESSING SDOH Part 1
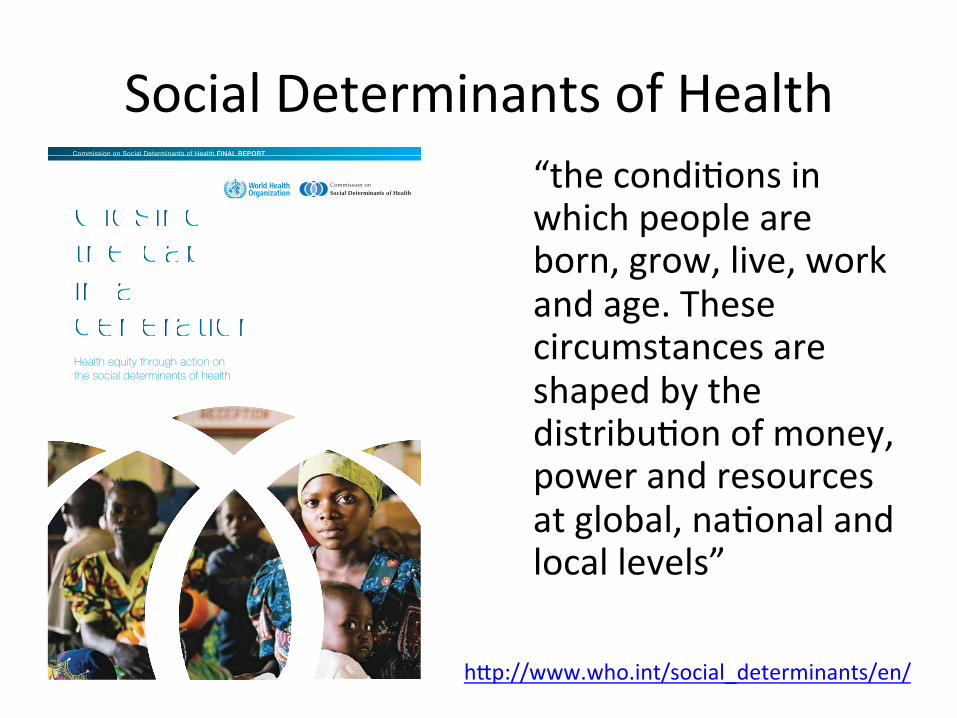
Social Determinants of Health “the condi&ons in which people are born, grow, live, work and age. These circumstances are shaped by the distribu&on of money, power and resources at global, na&onal and local levels”
h`p://www.who.int/social_determinants/en/
Closing the gapin a generationHealth equity through action on the social determinants of health
Commission on Social Determinants of Health FINAL REPORT

Canadian Medical Associa&on, 2013 h`p://healthcaretransforma&on.ca/infographic-‐social-‐determinants-‐of-‐health/

The Unequal City | Toronto Public Health 9
Life Expectancy at Birth
Figure 2a: Life Expectancy at Birth, by Income1,Males, Toronto, 2001, 2003 & 2004 Combined2
Figure 2b: Life Expectancy at Birth, by Income1,Females, Toronto, 2001, 2003 & 2004 Combined2
1 Income is the population quintile by proportion of the population below the LICO in census tracts. 2 Mortality data are used from 2001, 2003 and 2004 as these years contain the most current and complete data for postal code. Three years of data are required for this type of analysis. Error bars (I) denote 95% confidence intervals. Source: Ontario Mortality Data 2003-2004, Provincial Health Planning Database (PHPDB) Ver. 18.01, Ontario MOHLTC. Ontario Mortality Data 2001, Statistics Canada, June 2008.
Life expectancy at birth represents the average number of years a group born at a specific time will live and is based on the current death rates across age groups. The life expectancy at birth for Toronto males was 78.1 years and for females was 83.0 years.
There was a significant gradient in life expectancy for both males and females across income quintiles in Toronto. The male gradient was steeper than the female gradient. Both follow the same step pattern. Males in the lowest income quintile (Q1) had the lowest life expectancy (77.2 years), and those in the highest income quintile (Q5) had the highest (80.1 years). Females in Q1 also experience the lowest life expectancy (82.9 years), while those in Q5 have the highest (84.5 years).
The absolute difference in life expectancy was 2.9 years for males in the lowest income quintile compared to the highest income quintile. The difference for females was 1.6 years. In relative terms, the male life expectancy in the lowest income quintile was 3.6% lower than the highest quintile, and for females it was 1.9% lower than the highest income quintile.
Life expectancy was also analyzed by income decile (tenth of the population). Males living in the lowest income decile had a life expectancy of 76.3 years and those in the highest income decile had a life expectancy of 80.8 years. Females living in the lowest income decile had a life expectancy of 82.7 years and those in the highest income decile had a life expectancy of 84.7 years. The difference in life expectancy between the lowest and highest income deciles was 4.5 years for males and 2.0 years for females.
Life expectancy in Toronto was higher than for individuals in the rest of Ontario with the exception of males in the lowest income decile.
75
80
85
0Lowest Q2 Q3 Q4 Highest
IncomeY
ears
75
80
85
0Lowest Q2 Q3 Q4 Highest
IncomeY
ears
75
80
85
0Lowest Q2 Q3 Q4 Highest
Income
Yea
rs
75
80
85
0Lowest Q2 Q3 Q4 Highest
Income
75
80
85
0Lowest Q2 Q3 Q4 Highest
Income
Yea
rs
Toronto Public Health. 2008. Unequal City Report.

The Unequal City | Toronto Public Health 14
Teen Pregnancy Figure 7: Teen Pregnancy1 Rate2, by Income3, Toronto, 2004-2006
0
10
20
30
40
50
Lowest Q2 Q3 Q4 HighestIncome
Rat
e pe
r 1,
000
1 Teen pregnancy includes hospital deliveries (live and still born) plus therapeutic abortions. 2 Rate is per 1,000 women aged 15 to 19 years per year. 3 Income is the population quintile by proportion of the population below the LICO in census tracts.Error bars (I) denote 95% confidence intervals. Source: Teen deliveries (live and stillbirth) Hospital In-Patient Data, and Therapeutic abortions Hospital In-Patient Data, Ambulatory Visits, Day Procedures, 2004-2006, Provincial Health Planning Database (PHPDB) Ver. 18.01, Health Planning Branch, Ontario MOHLTC.
Teen pregnancy represents the number of women aged 15 to 19 years who gave birth (live or stillborn) or had a therapeutic abortion. Teen pregnancy is associated with an increased risk of low birth weight, preterm birth, and postpartum depression.24, 25 Pregnant teens are more likely to have delays in accessing prenatal care, are less likely to continue their education and may be exposed to increased rates of violence. Their children are at increased risk of health problems. 24 In 2004-2006 the annual teen pregnancy rate was 30 per 1,000 in Toronto.
There was a significant gradient in teen pregnancy rates across income quintiles in Toronto. Teens in the lowest income quintile (Q1) had a rate significantly higher than all other income quintiles. The gradient was steep with the highest teen pregnancy rate (42 per 1,000) in the lowest income quintile and a step-wise decrease in rates to 16 per 1,000 in the highest income quintile (Q5).
The absolute difference in teen pregnancy rates was 26 pregnancies per 1,000 in quintile 1 compared to quintile 5. In relative terms, the teen pregnancy rate in quintile 1 was 2.6 times the rate in quintile 5.
If all women aged 15-19 years had the pregnancy rate of the highest income quintile (Q5) there would be 996 or 46% fewer teen pregnancies per year in Toronto.
Toronto’s teen pregnancy rates in income quintiles 1, 2, and 3 were higher than the overall rate for the rest of Ontario. The rate in quintile 1 was 64% higher than the rate for the rest of the province.
Toronto Public Health. 2008. Unequal City Report.

Hulchanski. Ci&es Centre, U of T. 2010

Diabetes

43
COMMISSION ON SOCIAL DETERMINANTS OF HEALTH | FINAL REPORT
issues including food and nutrition, rural factors, violence and crime, and climate change did not have a dedicated Knowledge Network but are recognized as important factors for health equity. The Commission deals with these in subsequent chapters, providing some general recommendations but without outlining the more specific steps of exactly how action could happen.
JUDGING THE EVIDENCEFormulating the Commission’s recommendations about what should be done in order to improve global health equity has involved balancing the use of different types of evidence, considering the scope and completeness of the evidence, and assessing the degree to which action in these social determinants of health has been shown to be possible and effective. The recommendations made by the Commission are: a) underpinned by an aetiological conceptual framework, b) supported by a vast global evidence base that demonstrates an impact of action on these social determinants of health and health inequities (effectiveness), c) supported by evidence on feasibility of implementation in different scenarios, and d) supported by evidence showing consistency of effects of action in different population groups and countries with different levels of national economic development.
THE COMMISSION’S KEY AREAS FOR ACTION AND RECOMMENDATIONSGlobally it is now understood better than at any moment in history how social factors affect health and health equity. While information is always partial and the need for better evidence remains, we have the knowledge to guide effective action. By linking our understanding of poverty and the social gradient, we now assert the common issues underlying health inequity. By recognizing the nature and scale of both non-
communicable and communicable diseases, we demonstrate the inextricable linkages between countries, rich and poor. Action is needed on the determinants of health – from structural conditions of society to the daily conditions in which people grow, live, and work at all levels from global to local, across government and inclusive of all stakeholders from civil society and the private sector.
As we have pursued our work we have become convinced that it is possible to close the health gap in a generation. It will take a huge effort but it can be done. The chapters that follow in Parts 3-5 show that there is urgent need for change – in how we understand the causes of health inequities, in the way we accept and use different types of evidence, in the way we work together, and in the different types of action that is taken to tackle global- and national-level health inequities. Action to effect these interventions will be at global, national, local, and individual levels.
In Chapter 1 we stated that the Commission’s analysis leads to three principles of action:
1 Improve the conditions of daily life – the circumstances in which people are born, grow, live, work, and age.
2 Tackle the inequitable distribution of power, money, and resources – the structural drivers of those conditions of daily life – globally, nationally, and locally.
3 Measure the problem, evaluate action, expand the knowledge base, develop a workforce that is trained in the social determinants of health, and raise public awareness about the social determinants of health.
Figure 4.1 Commission on Social Determinants of Health conceptual framework.
Source: Amended from Solar & Irwin, 2007
Socioeconomic& political context
Social position
Education
Occupation
Health-Care System
SOCIAL DETERMINANTS OF HEALTH AND HEALTH INEQUITIES
Income
Gender
Ethnicity / Race
Governance
Cultural and societal norms
and values
Policy(Macroeconomic,
Social, Health)
Material circumstances
Social cohesion
Psychosocial factors
Behaviours
Biological factors
Distribution of health and well-being
WHO. Final Report of the Commission on Social Determinants of Health. 2008.

Professional Activities
Social Determinants of Health –What Doctors Can DoOctober 2011
h`p://bma.org.uk/-‐/media/files/pdfs/working%20for%20change/improving%20health/socialdeterminantshealth.pdf
Doctors can use evidence and influence to have a posi&ve impact on health inequali&es. Doctors can use their posi&on and their exper&se to advocate for change…”
“Doctors can help by intervening with individual pa*ents, their families and contacts, using clinical tools including social prescribing and brief interven&ons.
They can work within communi*es, for example, by commissioning measures including health promo&on and ill-‐health preven&on that will affect changes to the social determinants and are effec&ve in the whole community including those who are tradi&onally hard to reach.
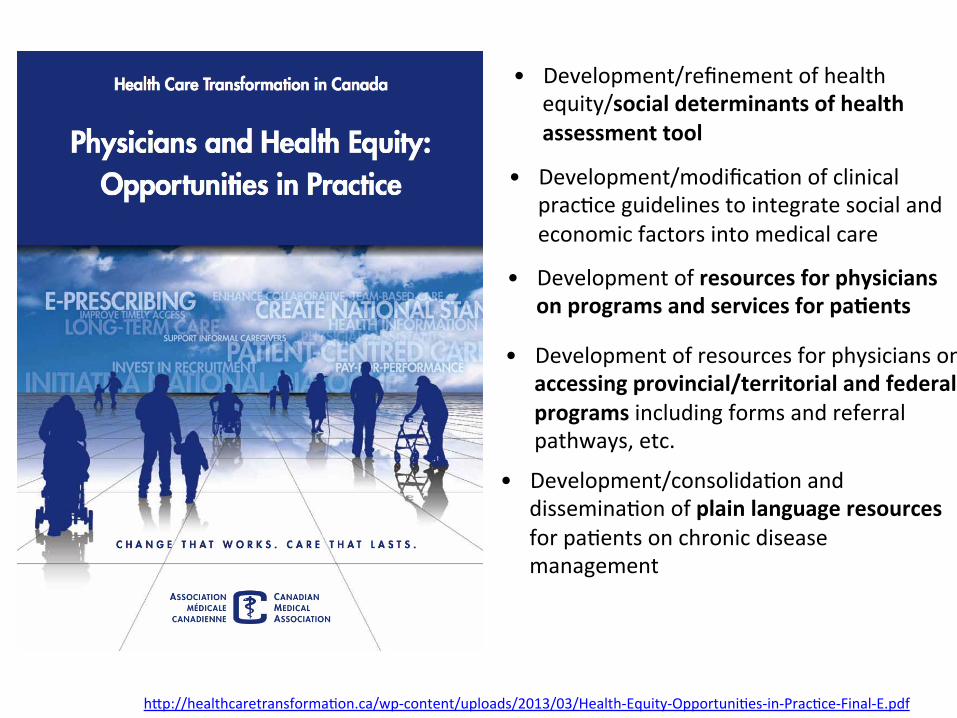
• Development/refinement of health equity/social determinants of health assessment tool
h`p://healthcaretransforma&on.ca/wp-‐content/uploads/2013/03/Health-‐Equity-‐Opportuni&es-‐in-‐Prac&ce-‐Final-‐E.pdf
• Development/modifica&on of clinical prac&ce guidelines to integrate social and economic factors into medical care
• Development of resources for physicians on programs and services for pa*ents
• Development of resources for physicians on accessing provincial/territorial and federal programs including forms and referral pathways, etc.
• Development/consolida&on and dissemina&on of plain language resources for pa&ents on chronic disease management

Canadian Medical Association Town Hall Report | July 2013
Health care in Canada WHAT MAKES US SICK?
h`ps://www.cma.ca/Assets/assets-‐library/document/fr/advocacy/What-‐makes-‐us-‐sick_en.pdf
Recommenda&ons: 1. Poverty Reduc&on Strategies 2. Guaranteed annual income 3. Affordable housing 4. Housing First 5. Na&onal food security 6. Early child development 7. Pharmacare 8. Recognize SDOH 9. Require HIA 10. Local health and social databases 11. Investments in Aboriginal health 12. Educa&on on Aboriginal health
2
Town hall report, July 2013
Recommendation 7: That governments, in consultation with the life and health insurance industry and the public, estab-lish a program of comprehensive prescription drug coverage to be administered through reimbursement of provincial–territorial and private prescription drug plans to ensure that all Canadians have access to medically necessary drug therapies.
Recommendation 8: That the federal government recognize the importance of the social and economic determinants of health to the health of Canadians and the demands on the health care system.
Recommendation 9: That the federal government require a
process.
Recommendation 10: That local databases of community services and programs (health and social) be developed and provided to health care professionals, and where possible, tar-geted guides be developed for the health care sector.
Recommendation 11: That the federal government put in place a comprehensive strategy and associated investments for improving the health of Aboriginal people that involves a partnership among governments, non-governmental organiza-tions, universities and Aboriginal communities.
Recommendation 12: That educational initiatives in cross-cultural awareness of Aboriginal health issues be developed for the Canadian population, particularly for health care providers.

Why address SDOH in health care?
• First contact • Accessible • Longitudinal • Person-‐focused • Coordina&on and naviga&on • Comprehensive • BOTH preven&ve (future needs) and cura&ve (immediate needs)
• Exis&ng and poten&al connec&ons to other systems • Poli&cal/media focus • Highly resources
Adapted from De Maeseneer et al. WHO 2007. h`p://www.who.int/social_determinants/resources/csdh_media/primary_health_care_2007_en.pdf

ST. MICHAEL’S HOSPITAL DFCM SDOH COMMITTEE
Part 2

St. Michael’s Hospital
• Established a SDOH Commi`ee within the DFCM
• Projects: 1. Socio-‐demographic data collec&on (ongoing) 2. Income security health promo&on (ongoing) 3. Medical-‐Legal Partnership (to launch) 4. Reach Out and Read (future) 5. Employment and Be`er Employment (future)
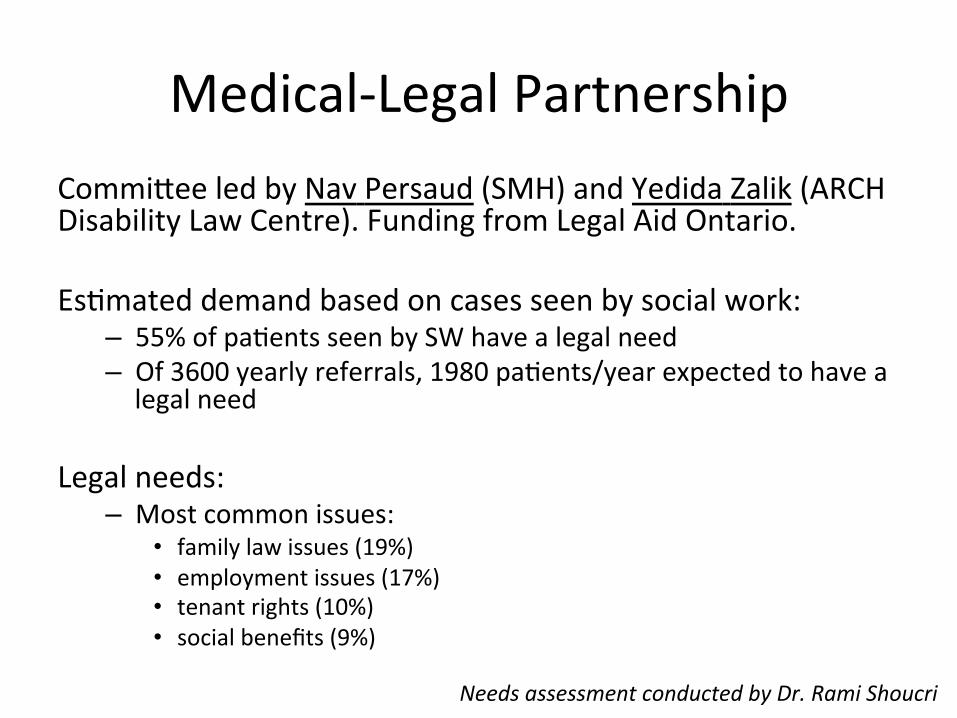
Medical-‐Legal Partnership Commi`ee led by Nav Persaud (SMH) and Yedida Zalik (ARCH Disability Law Centre). Funding from Legal Aid Ontario. Es&mated demand based on cases seen by social work:
– 55% of pa&ents seen by SW have a legal need – Of 3600 yearly referrals, 1980 pa&ents/year expected to have a legal need
Legal needs:
– Most common issues: • family law issues (19%) • employment issues (17%) • tenant rights (10%) • social benefits (9%)
Needs assessment conducted by Dr. Rami Shoucri


Reach Out and Read @ SMH Commi`ee led by Laurie Green (staff physician) and Ka&e Dorman (PGY-‐2). Currently applying for funding. GOAL: enhance childhood development and improve health equity among low-‐income families receiving primary care from the St. Michael’s Hospital Family Health Team. We propose to implement the following components 1. Literacy-‐rich wai&ng room 2. Informa&on sheets on (i) importance of reading aloud, (ii) informa&on on accessing local libraries, and (iii) loca&ons of Early Years Centres and Parent Literacy Centres
3. An&cipatory guidance on benefits of reading aloud 4. Book distribu*on at child visits (birthdays -‐ 1, 2, 3, 4, 5)

“There is strong and growing evidence that higher social and economic status is associated with better health. In fact,these two factors seem to be the most
important determinants of health.”1
- Public Health Agency of Canada
Poverty requires intervention
like other major health risks:
The evidence shows poverty
to be a risk to health equivalent
to hypertension, high
cholesterol, and smoking. We
devote significant energy and
resources to treating these
health issues. Should we treat
poverty like any equivalent
health condition?
Of course .
Poverty accounts for 24% of person years of life lost in Canada (second only to 30% for neoplasms).2
Income is a factor in the health of all but our richest patients.
Poverty Interventions for Family Physicians
POVERTY:A clinical tool for primary carein Ontario
May 2012 Developed by Gary Bloch
Three Steps To Addressing Poverty in Primary Care
1. Screen
2. Adjust Risk
3. Intervene
h`p://www.healthprovidersagainstpoverty.ca/
Income Security Health Promo&on

Income Security Health Promoter at SMH DFCM
Interven&ons include assis&ng with:
1. Increasing income • Benefits/grants • Comple&ng taxes • Employment/retraining
2. Reducing expenses • Housing & rent • Free services
3. Improving financial literacy • Fraud preven&on • Budge&ng • Avoiding cheque cashing

IGNITE (addressInG iNcome securITy in primary carE) Study
Builds on findings of systema&c review and detailed retrospec&ve review of 1 year of cases, and qualita&ve interviews with 12-‐15 pa&ents Design: pragma&c RCT Funding: TD Financial Literacy Grant Fund, AFP Innova&on Fund, PSI Founda&on What is the impact on income, health status and health service u;liza;on of pa;ents living in poverty of engaging with an income-‐focused health promoter, based in a primary care seAng?

EMployment and Be=er Employment through Rela*onships (EMBER) Project
• Being employed AND the condi&ons of employment are key SDOH
• Growing awareness that decent work is rare 1. Develop a network in SE Toronto of primary health
care organiza&ons (e.g. SMH, ICHA, Access Alliance), social service organiza&ons and advocacy organiza&ons (e.g. Workers’ Ac&on Centre)
2. Environmental scan & survey of organiza&ons who succeed in helping clients gain decent work
3. Pilot test an interven&on with 30-‐40 unemployed pa&ents

Client is identified by any
organization
Case discussion and consultation: Primary health care representative • Readiness assessment Social service representative • Interview skills • CV writing • Job search Advocacy organization representative • Advice on workplace accommodation • Explore how client wants to be involved in systemic change
Follow-up &
support Discharge
Intake by EMBER Project Coordinator/ Employment Advocate
With Yogendra Shakya (Access Alliance), Ri&ka Goel (ICHA FHT), Deena Ladd (Workers’ Ac&on Centre) and others.

COLLECTING SOCIO-‐DEMOGRAPHIC DATA
Part 3

SUMMARY REPORT
JUNE 2013
WE ASK BECAUSE WE CARE.
201306278
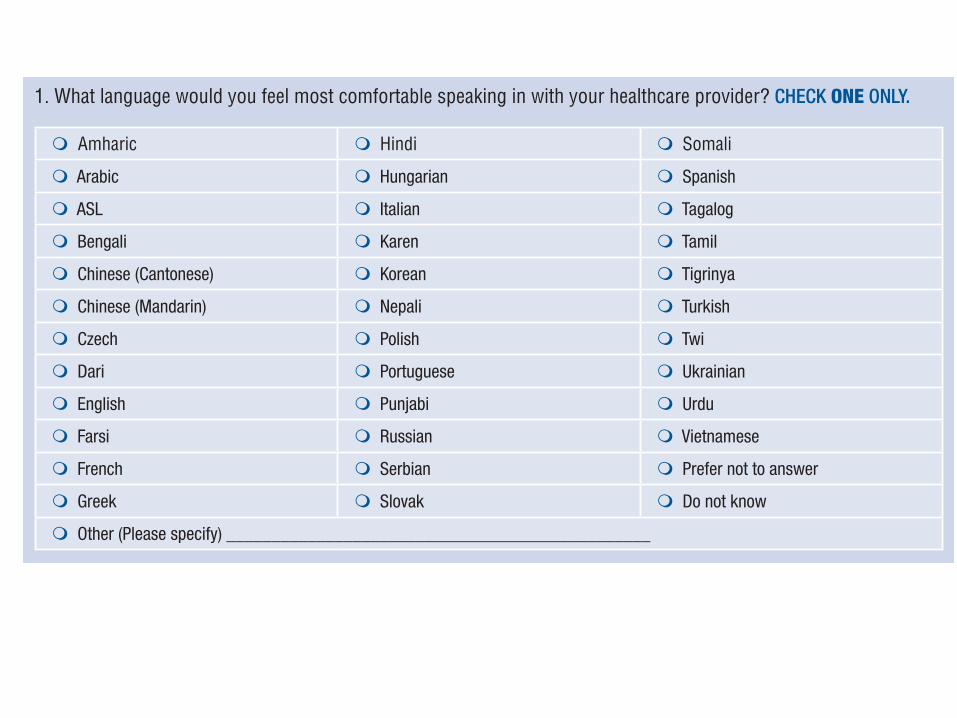
What language do you feel most comfortable speaking in with your health-care provider?
Which of the following
best describes your racial or ethnic group?
Do you have any of the following
disabilities?
Will you please provide us with information about yourself?This information will increase access to services
and improve the quality of care.
With funding and support from the Toronto Central LHIN.
We ask because we careThe Tri-Hospital + TPH Health Equity Data Collection Research Project Report
Socio-‐demographic data collec&on
Language Immigra&on Race/ethnicity Disabili&es Gender iden&ty Sexual orienta&on Income Housing
h`p://www.stmichaelshospital.com/quality-‐new/data-‐collec&on-‐research-‐project.php

Language as a SDOH • Recent immigrants with prolonged limited English language
proficiency are more likely to experience a downwards trend in self-‐reported health and higher rates of unmet health needs.
• Ontarians who are non-‐English speaking are more likely to report poor health.
• Limited English proficiency in Canada has been associated with reduced treatment comprehension and compliance, increased risk of adverse drug reac&ons, and increased likelihood of inadequate management for chronic disease.
• Non-‐English speaking pa&ents are less likely to be sa&sfied with the care received when not speaking the same language as their provider. Bierman et al. POWER Study. ICES 2012.
Raphael D. SDOH: Canadian Perspec&ves. Scholars’ Press 2008 CSDOH. WHO: 2008 Wu Z et al. CJPH 2005; 96: 369-‐73 Bowen S. Health Canada 2001. Dastjerdi M et al. Int J Equity Health 2012; 11:55.
TRI-HOSPITAL + TPH REPORT
Appendix B8 Final Core Questions
1. What language would you feel most comfortable speaking in with your healthcare provider? CHECK ONE ONLY.
� Amharic � Hindi � Somali
� Arabic � Hungarian � Spanish
� ASL � Italian � Tagalog
� Bengali � Karen � Tamil
� Chinese (Cantonese) � Korean � Tigrinya
� Chinese (Mandarin) � Nepali � Turkish
� Czech � Polish � Twi
� Dari � Portuguese � Ukrainian
� English � Punjabi � Urdu
� Farsi � Russian � Vietnamese
� French � Serbian � Prefer not to answer
� Greek � Slovak � Do not know
� Other (Please specify) _______________________________________________
2. Were you born in Canada?
� Yes � No � Prefer not to answer � Do not know
� If no, what year did you arrive in Canada? ________________________________________
3. Which of the following best describes your racial or ethnic group? CHECK ONE ONLY.
� Asian - East (e.g., Chinese, Japanese, Korean) � Latin American (e.g., Argentinean, Chilean, Salvadorian)
� Asian - South (e.g., Indian, Pakistani, Sri Lankan) � Métis
� Asian - South East (e.g., Malaysian, Filipino, Vietnamese) � Middle Eastern (e.g., Egyptian, Iranian, Lebanese)
� Black - African (e.g., Ghanaian, Kenyan, Somali) � White - European (e.g., English, Italian, Portuguese, Russian)
� Black - Caribbean (e.g., Barbadian, Jamaican) � White - North American (e.g., Canadian, American)
� Black - North American (e.g., Canadian, American) � Mixed heritage
(e.g., Black- African and White-North American)
(Please specify) _______________________________
� First Nations
� Indian - Caribbean (e.g., Guyanese with origins in India)
� Other(s) (Please specify) ____________________________
� Indigenous/Aboriginal not included elsewhere � Prefer not to answer
� Inuit � Do not know
48

Most comfortable language (at least 1 person responding)
12 5 2 3 4
367
3 1 2 1 1 1 1 1 3 1 1 2 1 1 0
50
100
150
200
250
300
350
400


h`p://www.theglobeandmail.com/life/health-‐and-‐fitness/health/concerns-‐raised-‐at-‐over-‐demographic-‐data-‐collec&on-‐at-‐canadian-‐hospitals/ar&cle20487997/

Final Thoughts
• SDOH is not only a public health challenge, but something that we can address in health care organiza&ons
• Recognizing the limits of this work (income security, legal advice, child literacy, employment) we must incorporate a system of advocacy that looks across cases
• All work is based on rela&onships and collabora&on


![Nepal Observer kang hin ? lb sª lxg < What is this ? Di kitap hin. lb lstfk lxg . This is a book. Phokiti kang hin ? kmf]lstL sª lxg < What is that ? Phokiti naksha hin. kmf]lstL](https://img.pdfslide.us/doc/110x75/5caa160688c993c9218dbc2a/nepal-observer-kang-hin-lb-sa-lxg-what-is-this-di-kitap-hin-lb-lstfk-lxg.jpg)


![Hin Jax09 Tonguesb[1]Ff](https://img.pdfslide.us/doc/110x75/55cb8ecebb61eb4b728b470c/hin-jax09-tonguesb1ff.jpg)