Embed Size (px)
Citation preview

Dysglycemia and CKD
BY
Alaa Wafa MD.Associate Professor of internal medicine
Diabetes & Endocrine unit.
Mansoura university
8th international HD course
UNC 15/12/2015
AGENDA
2
Background of Dysglycemia and CKD
Pathophysiology of Dysglycemia and CKD
Glycemic control and CKD
Insulin therapy and CKD
Conclusions

TEAMWORK- the power of a multidisciplinary approach
Patient and
family
Nephrologist
Nurse
Clinician
Diabetes
Educator
Pharmacist
Registered
Dietitian
Social
Work

Diabetes:The Most Common Cause of ESRD
Primary Diagnosis for Patients Who Start Dialysis
Diabetes50.1%
Hypertension27%
Glomerulonephritis
13%
Other
10%
United States Renal Data System. Annual data report. 2000.
No. of patientsProjection95% CI
1984 1988 1992 1996 2000 2004 20080
100
200
300
400
500
600
700
r2=99.8%243,524
281,355
520,240
No
. o
f d
ialy
sis
pati
en
ts
(th
ou
san
ds)
©2006. American College of Physicians. All Rights Reserved.
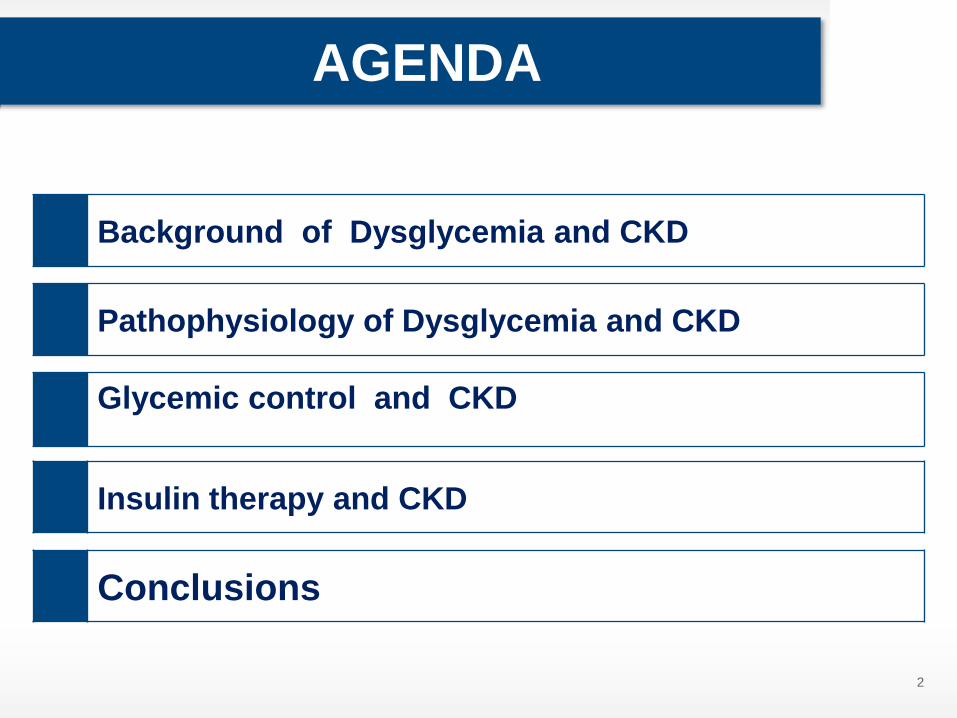
Rate of kidney diseases in Egypt is 36.4* with about 5.19% deaths
*Per 100,000
http://www.worldlifeexpectancy.com/cause-of-death/kidney-
disease/by-country/ accessed 2012 Oct.
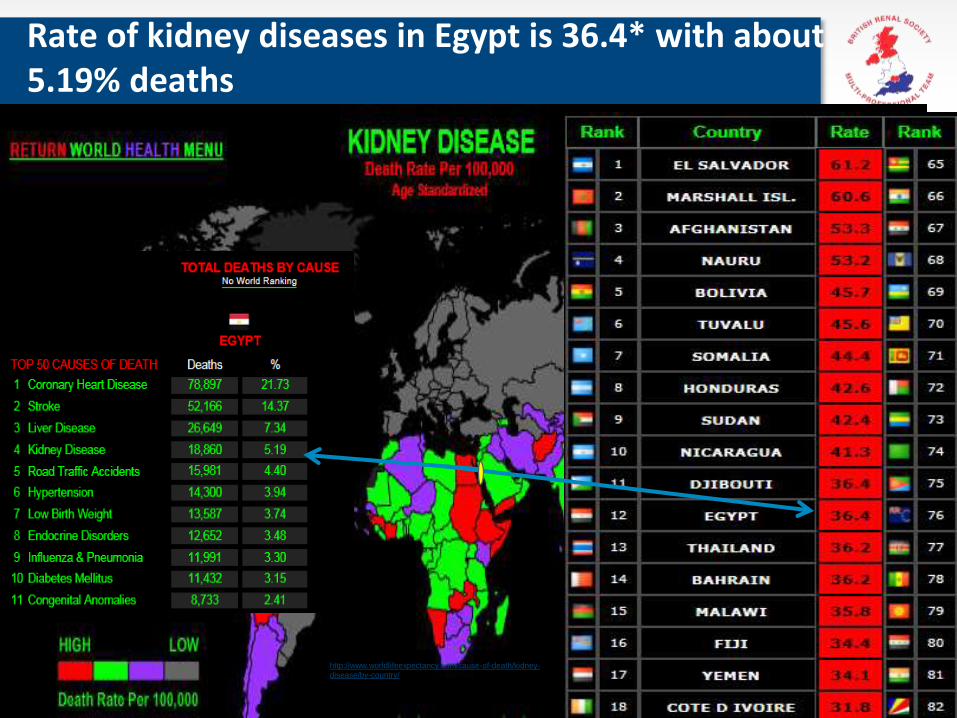
Dysglycemia
The Dysglycemia of diabetes includes two components:
• (1) sustained chronic hyperglycemia that exerts its effects
through both excessive protein glycation and activation of
oxidative stress
• (2) acute glucose fluctuations (glycemic variability).
Glycemic variability seems to have more deleterious effects than sustained
hyperglycemia in the development of diabetic complications as both upward
(postprandial glucose increments) and downward (interprandial glucose
decrements) changes activate the oxidative stress.
6

Glucose variability
Multiple fluctuations of glycemia in the same individual within-day or day-to-day, or even over longer periods of time; that is, week to-week or visit-to-visit.
The concept of glucose variability was first introduced in the Diabetes Control and Complications Trial (DCCT), and defined as the standard deviation (SD) of daily blood glucose around the mean from each quarterly visit
Am J Kidney Dis 2002; 39:S1
What is CKD?
• Presence of markers of kidney damage for three months, as defined by structural or functional abnormalities of the kidney with or without decreased GFR,
• Manifest by either pathological abnormalities or other markers of kidney damage, including abnormalities in the composition of blood or urine, or abnormalities in imaging tests.
• The presence of GFR <60 mL/min/1.73 m2 for three months, with or without other signs of kidney damage as described above.
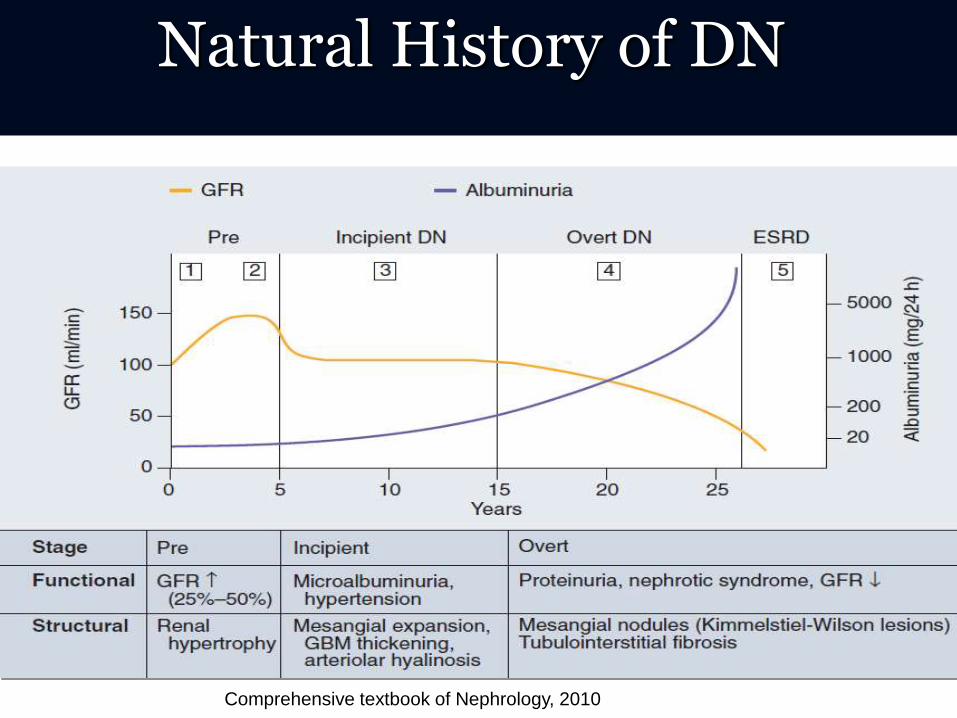
Natural History of DN
Comprehensive textbook of Nephrology, 2010

Uremia alters the entire metabolism including that of carbohydrates, proteins and fats. It also causes electrolyte disturbances and upsets mineral and hormonal homeostasis. Directly or indirectly, glucose metabolism is disturbed by all these changes’.
Kumar, K.V. S. et al: Glycemic Control in Patients of Chronic Kidney Disease. \www.ijddc.com/article.asp?issn=0973-
3939;year=2007; volume27; issue=4
International Journal of Diabetes in Developing Countries.
Diabetes and CKD
Chronic kidney disease (CKD) is associated with
insulin resistance and, in advanced CKD, decreased
insulin degradation.
The latter can lead to a marked decrease in insulin
requirement or even the cessation of insulin
therapy in patients with type 2 diabetes.
Both of these abnormalities are at least partially
reversed with the institution of dialysis
Kumar, K.V. S. et al: Glycemic Control in Patients of Chronic Kidney Disease. \www.ijddc.com/article.asp?issn=0973-
3939;year=2007; volume27; issue=4
International Journal of Diabetes in Developing Countries.
Diabetes and CKD

Pathways within diabetes that lead to the development
of vascular disease
Glomerular endothelial dysfunction (in particular, damage to the
glycocalyx) is the likely step in initiating albuminuria1
This diagram shows the relationship between hyperglycaemia, insulin resistance, endothelial
dysfunction, macrovascular disease and albuminuria in diabetes.1,2
12
Notes on this diagram1:Proposed major pathways are represented
by pink arrows.
Pathways of less certain significance are
represented by grey arrows.
In type 2 diabetes, other pathways not
directly involving endothelial dysfunction,
are likely in the pathogenesis of
macrovascular disease and may also
contribute to albuminuria (broken arrows).
Type 1 diabetes Type 2 diabetes
Cardiovascular
disease albuminuria
Insulin resistance
syndromeGlucose
Effector pathways
Endothelial (including
glycocalyx) dysfunction
Reference:
1.Satchell SC and Tooke JE. What is the mechanism of microalbuminuria in diabetes: a role for the glomerular endothelium? Diabetologia. 2008;51:714-725. 2.Deckert T, et al.
Diabetologia. 1989;32(4):219-26.

Diabetic kidney disease implies widespread vascular
disease
• The epidemiology of albuminuria (abnormal levels of albumin in the urine) reveals a close association with vascular disease1
• Meta-analyses in general population and high risk cohorts demonstrated that albuminuria is associated with cardiovascular mortality independently of traditional cardiovascular risk factors2,3
• The presence of both generalised vascular dysfunction and albuminuria suggests a common cause of proteinuria4
13
Reference:
1. Satchell SC and Tooke JE. What is the mechanism of microalbuminuria in diabetes: a role for the glomerular endothelium? Diabetologia. 2008;51:714-725. 2. Matsushita K,
van der Velde M, Astor BC, et al. Lancet 2010;375(9731):2073–2081 3. Gansevoort RT, Matsushita K, van der Velde M, et al. Kidney Int. 2011;80(1):93–104. 4. Deckert T, et
al. Diabetologia. 1989;32(4):219-26.
Hazard ratios (HR) and 95% confidence
intervals for cardiovascular mortality
according to ACR2
4
2
1
0.5
2.5 5 10 30 300 1000
HR
for
CV
D m
ort
alit
y (
AC
R s
tudie
s)
ACR, mg/g
Adapted from Matsushita K, van der Velde M, Astor BC, et al. Lancet 2010;375:2073–2081.
These slides were sponsored by Janssen and developed in conjunction with the BRS CKD Strategy Group, following an advisory board that
was organised by Janssen. Bedrock Healthcare Communications provided editorial support to members of the advisory board in developing
the slides. Janssen reviewed the content for technical accuracy. The content is intended for a UK healthcare professional audience only.
JOB CODE PHGB/VOK/0914/0018b
Date of preparation: January 2015
Pathophysiology of
Dysglycemia & CKD
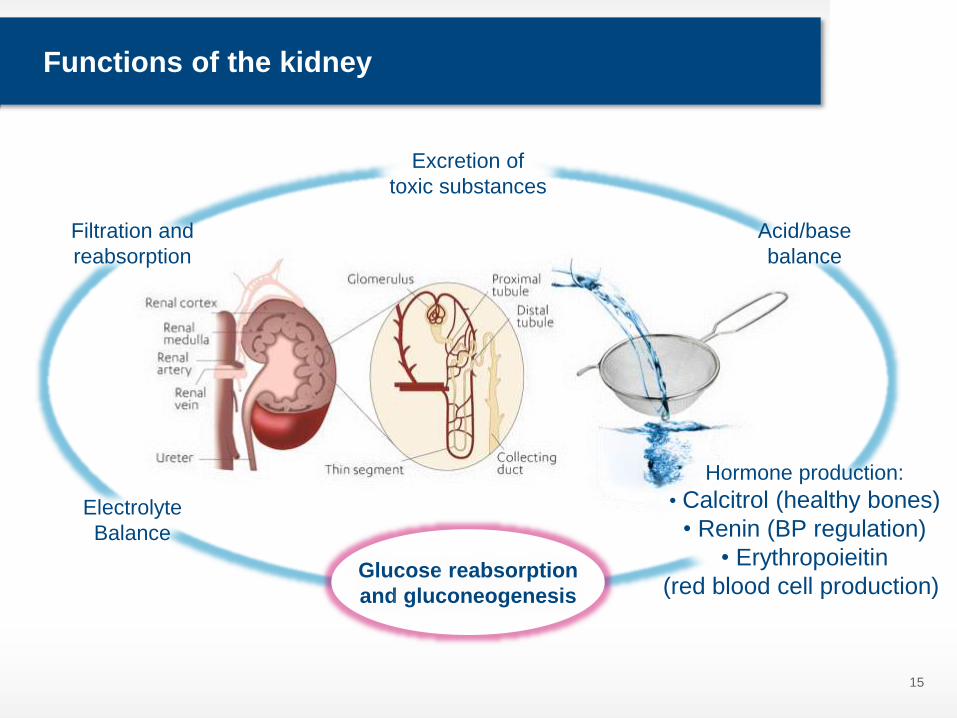
Functions of the kidney
15
Filtration and
reabsorption
Acid/base
balance
Electrolyte
Balance
Excretion of
toxic substances
Hormone production:
• Calcitrol (healthy bones)
• Renin (BP regulation)
• Erythropoieitin
(red blood cell production) Glucose reabsorption
and gluconeogenesis

The kidneys’ contribution to glucose homeostasis
• Kidneys contribute to glucose homeostasis in many ways including:
producing, filtering, reabsorbing and excreting glucose
• The kidneys produce approximately 20-25%1,2 of the total endogenous
glucose production
• In a healthy individual* virtually all of the filtered glucose is actively
reabsorbed into the blood by the sodium glucose co-transporters 2 and
1 (SGLT2 and SGLT1); virtually none is excreted in the urine2,3
16
*Normal physiological blood glucose range <6.5mmol/L before meals and <7.8mmol/L after meals
References:
1. Gerich JE. Physiology of glucose homeostasis. Diabetes Obes Metab. 2000;2:345-50.
2. Gerich JE. Role of the kidney in normal glucose homeostasis and in the hyperglycaemia of diabetes mellitus: therapeutic implications. Diabet Med. 2010 Feb;27(2):136-42.
3. Mitrakou A. Kidney: its impact on glucose homeostasis and hormonal regulation. Diabetes Res Clin Pract. 2011 Aug;93 Suppl 1:S66-72

The role of the kidney in glucose reabsorption
• There are two main sodium-glucose
cotransporters: SGLT2 and SGLT11
• SGLT2 is mainly found in the
proximal tubules of the kidneys1
• SGLT2 is responsible for
reabsorbing approximately 90%
of the glucose reabsorbed by
the kidney2
• The remaining glucose is
reabsorbed by SGLT1 further
along the proximal tubule1
• The reabsorbed glucose is then
returned to the blood2
17
Adapted from Nair S, Wilding JP. J Clin Endocrinol Metab. 2010;95:34-42.
Reference:
1. Nair S, Wilding JP. J Clin Endocrinol Metab. 2010;95:34-42. 2. DeFronzo RA, et al. Diabetes Obes Metab. 2012;14:5-14.
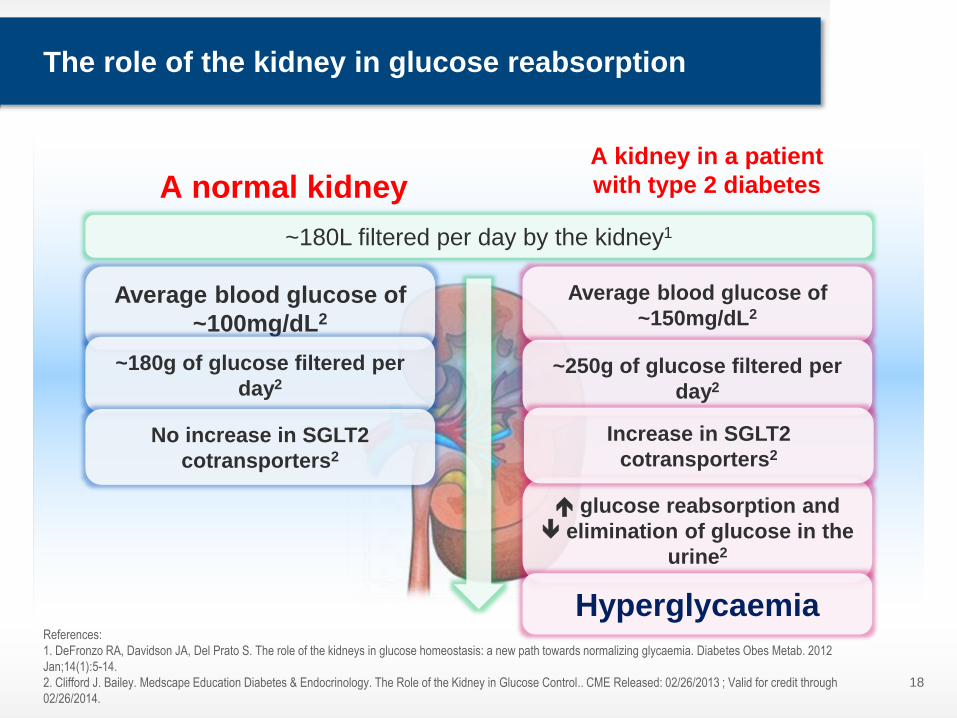
The role of the kidney in glucose reabsorption
18
~180L filtered per day by the kidney1
References:
1. DeFronzo RA, Davidson JA, Del Prato S. The role of the kidneys in glucose homeostasis: a new path towards normalizing glycaemia. Diabetes Obes Metab. 2012
Jan;14(1):5-14.
2. Clifford J. Bailey. Medscape Education Diabetes & Endocrinology. The Role of the Kidney in Glucose Control.. CME Released: 02/26/2013 ; Valid for credit through
02/26/2014.
A normal kidneyA kidney in a patient
with type 2 diabetes
Average blood glucose of
~100mg/dL2
Average blood glucose of
~150mg/dL2
~180g of glucose filtered per
day2
No increase in SGLT2
cotransporters2
~250g of glucose filtered per
day2
glucose reabsorption and
elimination of glucose in the
urine2
Hyperglycaemia
Increase in SGLT2
cotransporters2

Selected actions of insulin

The role of the kidney in insulin elimination
• The kidney plays a central role in the metabolism of insulin1
• Increased insulin levels suppress gluconeogenesis in the
kidney and enhance glucose reuptake by the kidney2
• Six to eight units of insulin are degraded by a healthy
kidney each day1
– This is approximately 25% of the daily production of insulin by the
pancreas
20
References:
1. Palmer BF and Henrich WL Carbohydrate and insulin metabolism in chronic kidney disease.. Available at: http://www.uptodate.com/contents/carbohydrate-and-insulin-
metabolism-in-chronic-kidney-disease.
2. Andrianesis V and Doupis J. The Role of Kidney in Glucose Homeostasis - SGLT2 Inhibitors, a New Approach in Diabetes Treatment. Expert Rev Clin Pharmacol.
2013;6(5):519-539.
Renal Metabolism of Insulin
30–80% of systemic insulin is metabolized particularly in
the kidney .
The kidney is, therefore, the main organ responsible for
metabolizing exogenous insulin administered to diabetic
patients .
About 65% of insulin that reaches the kidney is filtered in
the glomerulus and is, subsequently, metabolized in the
proximal tubular cells.
About 35% of insulin diffuses from postglomerular
peritubular vessels to the contraluminal cell membrane of
the proximal tubular cell, where it is also degraded.
Less than 1% of filtered insulin appears in the urine
21
Renal Metabolism of Insulin
Unlike insulin, C-peptide is not metabolized
during its first pass through the liver and,
approximately 70%of its plasma clearance is
performed in the kidney For that reason,
serum concentration of C-peptide reflects
pancreatic liberation of endogenous insulin
in subjects with normal renal function
22

Renal Metabolism of Insulin
23

Hyperglycaemia drives diabetic kidney disease
1. Activation of protein kinase C1
2. Acceleration of the renin-
angiotensin-aldosterone
system (RAAS)1
3. Non-enzymatic glycation
that generates advanced
glycation end products1
– Circulating levels are
raised in people with
diabetes, particularly those
with renal insufficiency, since
they are normally excreted in
the urine1
• Oxidative stress seems to be a
theme common to all three
pathways3
24
HypertensionOverproduction of
mesangial cell matrix
Tubulointerstitial
injury
Acceleration
of RAAS
Advanced glycation
end products (AGEs)
Protein kinase C and
growth factors
Glomerular
damage
ProteinuriaNephron loss
Hyperglycaemi
a
Reference:
1.Cade WT. Diabetes-Related Microvascular and macrovascular diseases in the physical therapy setting. Phys Ther. 2008;88(11):1322–1335. 2.Wolf G et al. (2005) From the
periphery of the glomerular capillary wall toward the center of disease: podocyte injury comes of age in diabetic nephropathy. Diabetes 54: 1626-1634. 3.Dronavalli S, Duka I
and Bakris GL. Nat Clin Pract Endocrinol Metab. 2008;4(8):444-52.
Three mechanisms have been postulated that explain how hyperglycaemia
causes tissue damage in the kidney:1-3

25
Pathophysiological cardiovascular
consequences of hypoglycaemia
CRP=C-reactive protein; IL-6=interleukin 6; VEGF=vascular endothelial growth factor.
Desouza CV, et al. Diabetes Care. 2010; 33: 1389–1394.
VEGF IL-6 CRP
Neutrophil
activation
Platelet
activation
Factor VII
Blood coagulation
abnormalities
Sympathoadrenal response
Inflammation
Endothelial
dysfunction
Vasodilation
Heart rate variability
Rhythm abnormalities Haemodynamic changes
Adrenaline
Contractility
Oxygen consumption
Heart workload
HYPOGLYCAEMIA
25

Dysglycemia drives diabetic kidney disease
• For instance, the urinary excretion rate of 8-iso-PGF2α, a reliable marker of oxidative stress, was found to be strongly, positively correlated (r = 0.86, p < .001) with glycemic variability assessed from the mean amplitude of glycemic excursions (MAGE) as estimated by continuous glucose monitoring systems (CGMS).
These observations therefore raise the question of whether we have the appropriate tools for assessing glycemic variability in
clinical practice ??????
26

ConclusionsThe short-term glucose variability expressed by 2hPG-FPG is closely associated with decreased eGFR and an increased risk of CKD in patients with poor glycemic control (HbA1c≥7%).

• Patients with more variable HbA1c face a higher risk of microvascularcomplications, in terms of the frequency and amplitude of HbA1c fluctuation.
• The deleterious effect of glucose variability on the kidneys attributed to the metabolic memory induced by repeated exposure to glucose fluctuation.
• The precise mechanism has not been well determined; however, endothelial dysfunction and oxidative stress were found to be worsened by glucose variability compared with stable hyperglycemia, and could be reversed by Reduction of glucose fluctuations.

• Patients lagged in the ‘metabolic memory’ as a result of frequent HbA1c fluctuation with a large rang were much more prone to developing severe nephropathy than those with the same average HbA1c, but less variable HbA1c.

Conclusions.Subjects with CKD and T2DM had poor glycemic control and significantly higher glycemic variability comparative to those without CKD, and especially to healthy volunteers. Assessment of glycemic
variability indices through CGM is more accurate than HbA1c for
the quantification of glycemic control in CKD diabetic patients

AGENDA
33
Background of Dysglycemia and CKD
Pathophysiology of Dysglycemia and CKD
Glycemic control and CKD
Insulin therapy and CKD
Conclusions

Glycemic control and CKD
-50
-40
-30
-20
-10
0
Diabetes-
related death
Myocardial
infarction
Microvascular
complications
Peripheral
vascular
disease
Lowering HbA1c by 1% significantly reduces:
Reduction in incid
ence r
isk
per
1%
reduction in H
bA
1c
–21%*
–14%*
–37%*
–43%*
*p < 0.0001Stratton IM et al. BMJ 2000;321:405–12
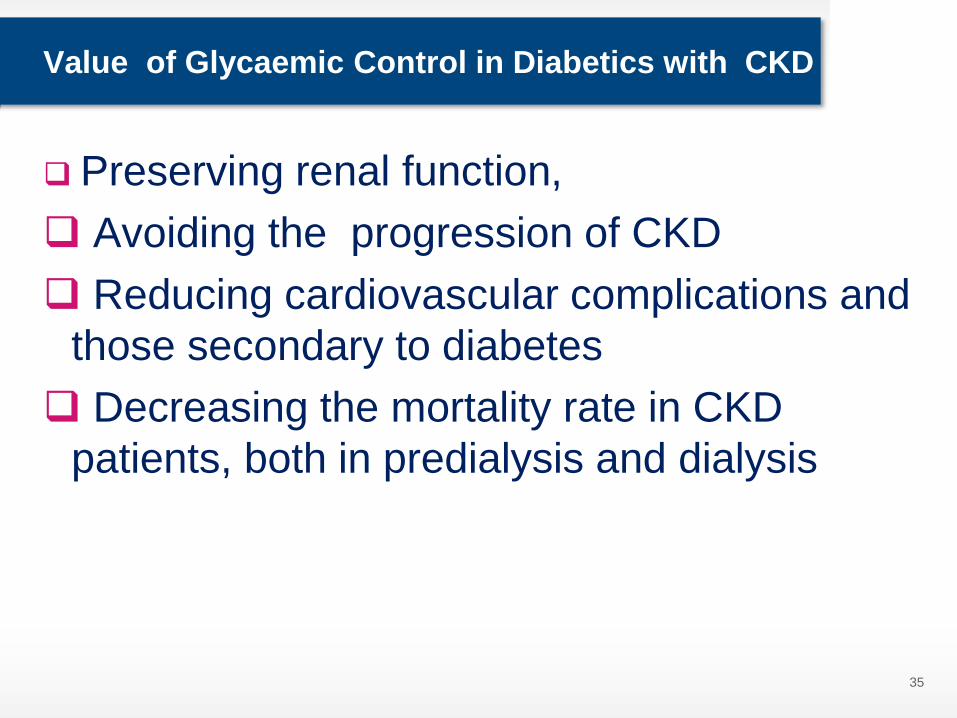
Value of Glycaemic Control in Diabetics with CKD
Preserving renal function,
Avoiding the progression of CKD
Reducing cardiovascular complications and
those secondary to diabetes
Decreasing the mortality rate in CKD
patients, both in predialysis and dialysis
35

Glycaemic Control in Diabetics with CKD
Diabetic Nephropathy
36Diabetes, Obesity and Metabolism, 10,2008 , 811–823
Management of Hyperglycemia in
Type 2 Diabetes, 2015:
A Patient-Centered Approach
Update to a Position Statement of the American Diabetes Association (ADA) and the
European Association for the Study of Diabetes (EASD)
Diabetes Care 2015;38:140–149
Diabetologia 2015;58:429–442
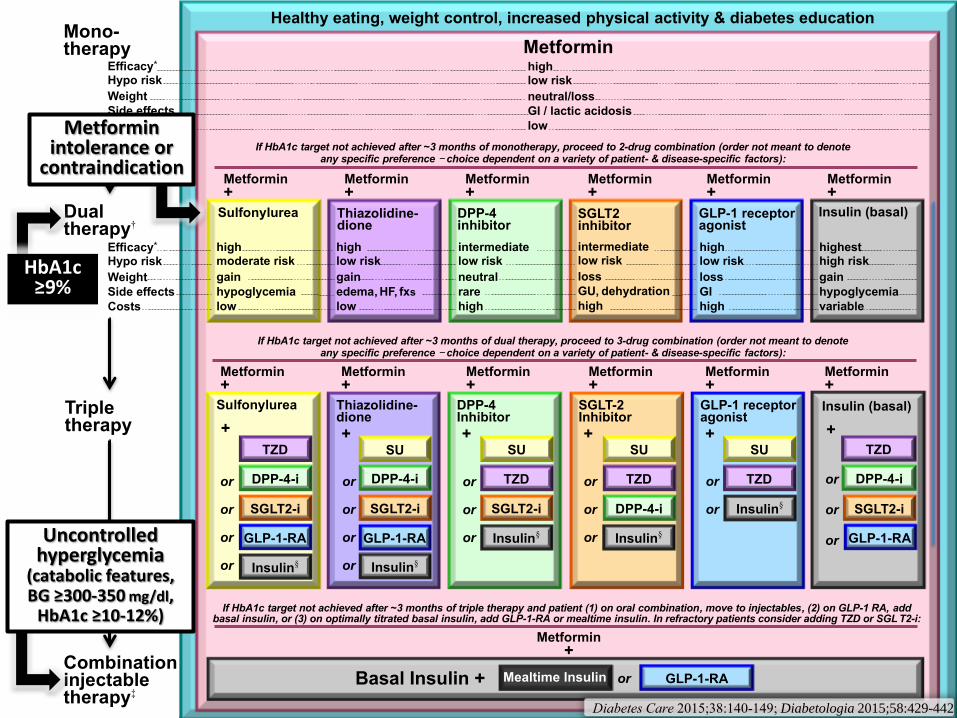
Healthy eating, weight control, increased physical activity & diabetes education
Metformin high low risk
neutral/loss
GI / lactic acidosis
low
If HbA1c target not achieved after ~3 months of monotherapy, proceed to 2-drug combination (order not meant to denote any specific preference - choice dependent on a variety of patient- & disease-specific factors):
Metformin +
Metformin +
Metformin +
Metformin +
Metformin +
high low risk
gain
edema, HF, fxs
low
Thiazolidine- dione
intermediate low risk
neutral
rare
high
DPP-4 inhibitor
highest high risk
gain
hypoglycemia
variable
Insulin (basal)
Metformin +
Metformin +
Metformin +
Metformin +
Metformin +
Basal Insulin +
Sulfonylurea
+
TZD
DPP-4-i
GLP-1-RA
Insulin§
or
or
or
or
Thiazolidine-dione
+ SU
DPP-4-i
GLP-1-RA
Insulin§
TZD
DPP-4-i
or
or
or
GLP-1-RA
high low risk
loss
GI
high
GLP-1 receptor agonist
Sulfonylurea
high moderate risk
gain
hypoglycemia
low
SGLT2 inhibitor
intermediate low risk
loss
GU, dehydration
high
SU
TZD
Insulin§
GLP-1 receptor agonist
+
SGLT-2 Inhibitor +
SU
TZD
Insulin§
Metformin +
Metformin +
or
or
or
or
SGLT2-i
or
or
or
SGLT2-i
Mono- therapy
Efficacy* Hypo risk
Weight
Side effects
Costs
Dual therapy†
Efficacy* Hypo risk
Weight
Side effects
Costs
Triple therapy
or
or
DPP-4 Inhibitor
+ SU
TZD
Insulin§
SGLT2-i
or
or
or
SGLT2-i
or
DPP-4-i
If HbA1c target not achieved after ~3 months of dual therapy, proceed to 3-drug combination (order not meant to denote any specific preference - choice dependent on a variety of patient- & disease-specific factors):
If HbA1c target not achieved after ~3 months of triple therapy and patient (1) on oral combination, move to injectables, (2) on GLP-1 RA, add basal insulin, or (3) on optimally titrated basal insulin, add GLP-1-RA or mealtime insulin. In refractory patients consider adding TZD or SGL T2-i:
Metformin +
Combination injectable therapy‡
GLP-1-RA Mealtime Insulin
Insulin (basal)
+
Diabetes Care 2015;38:140-149; Diabetologia 2015;58:429-442
HbA1c ≥9%
Metformin intolerance or
contraindication
Uncontrolled hyperglycemia
(catabolic features, BG ≥300-350 mg/dl,
HbA1c ≥10-12%)

Diet modification;
Salt diet reduces blood pressure.
Fibres improves lipid profile.
Phosphorus .
Protein diet .
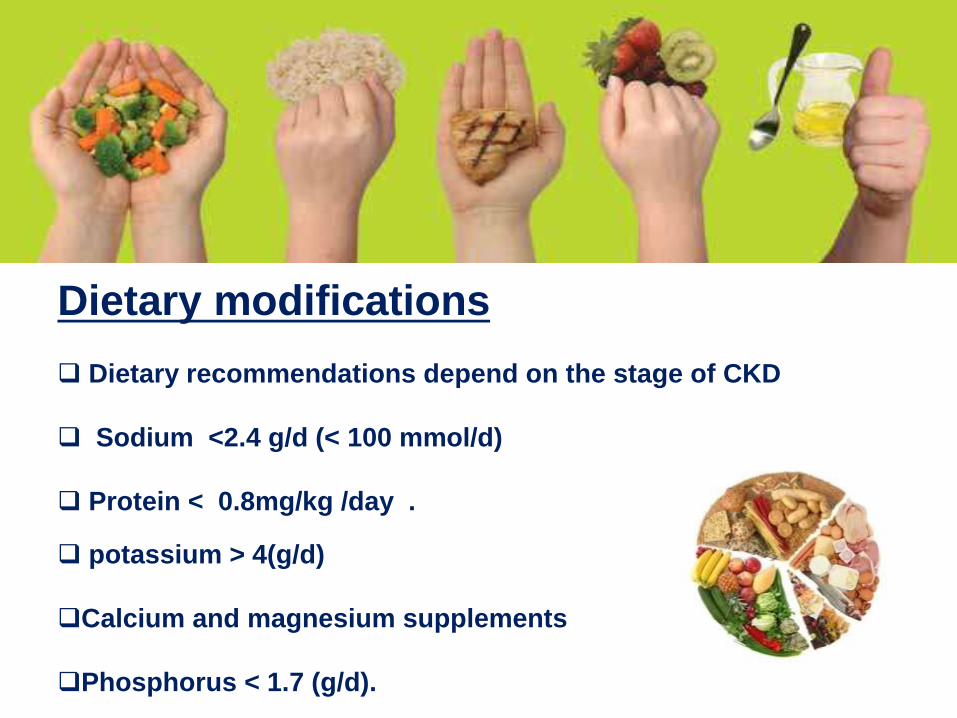
Dietary modifications
Dietary recommendations depend on the stage of CKD
Sodium <2.4 g/d (< 100 mmol/d)
Protein < 0.8mg/kg /day .
potassium > 4(g/d)
Calcium and magnesium supplements
Phosphorus < 1.7 (g/d).

Exercise and smoking cessation.
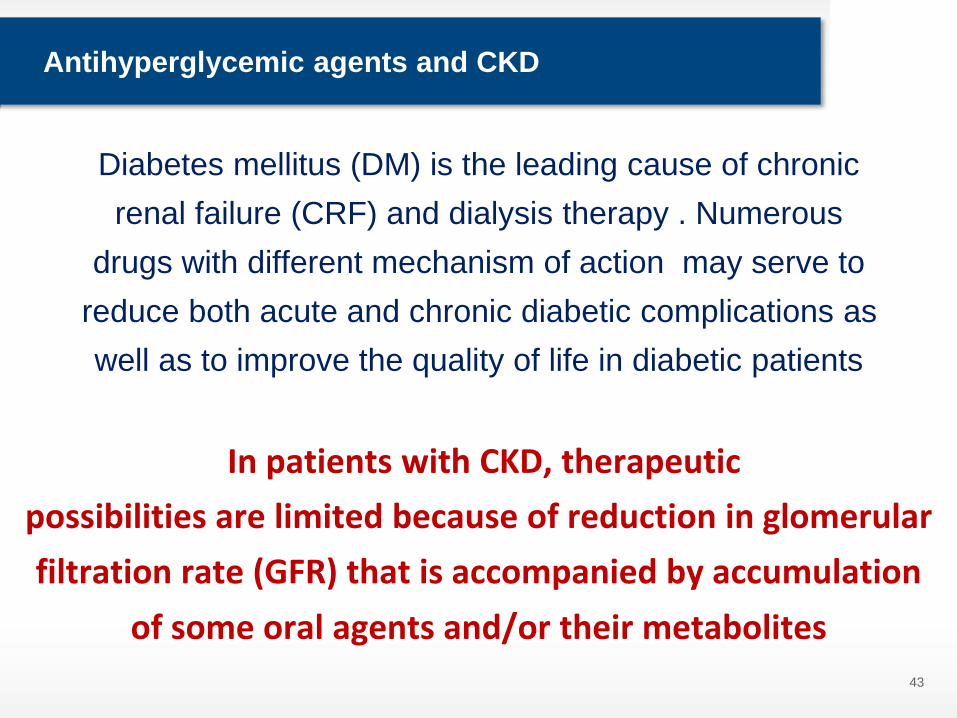
Antihyperglycemic agents and CKD
Diabetes mellitus (DM) is the leading cause of chronic
renal failure (CRF) and dialysis therapy . Numerous
drugs with different mechanism of action may serve to
reduce both acute and chronic diabetic complications as
well as to improve the quality of life in diabetic patients
In patients with CKD, therapeutic
possibilities are limited because of reduction in glomerular
filtration rate (GFR) that is accompanied by accumulation
of some oral agents and/or their metabolites
43


Antihyperglycemic Agents and CKD
45

AGENDA
46
Background of Dysglycemia and CKD
Pathophysiology of Dysglycemia and CKD
Glycemic control and CKD
Insulin therapy and CKD
Conclusions
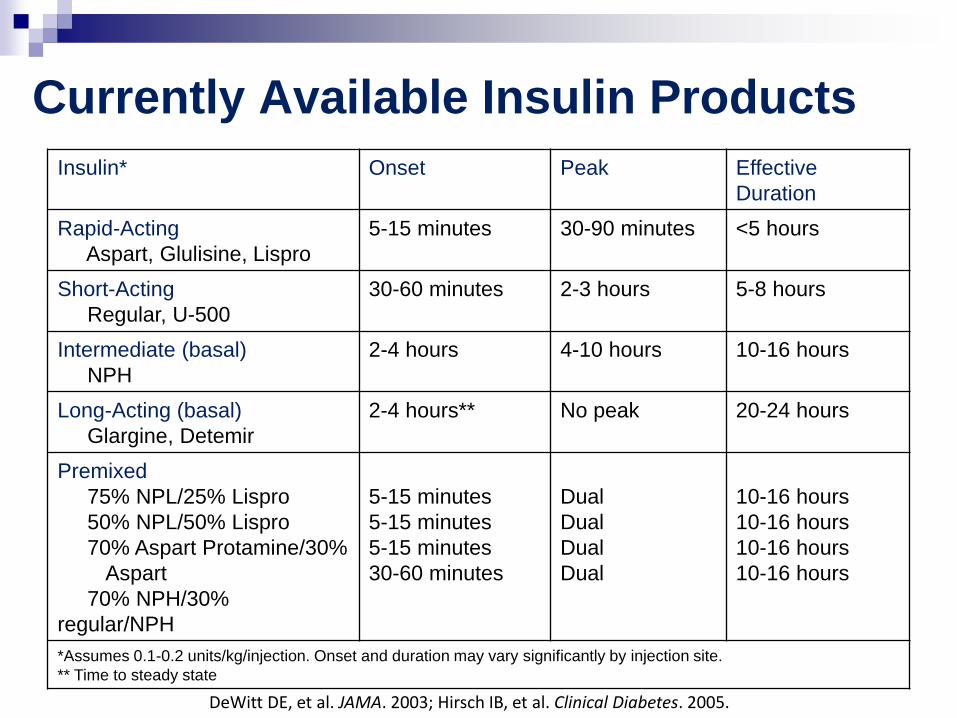
Currently Available Insulin Products
Insulin* Onset Peak Effective
Duration
Rapid-Acting
Aspart, Glulisine, Lispro
5-15 minutes 30-90 minutes <5 hours
Short-Acting
Regular, U-500
30-60 minutes 2-3 hours 5-8 hours
Intermediate (basal)
NPH
2-4 hours 4-10 hours 10-16 hours
Long-Acting (basal)
Glargine, Detemir
2-4 hours** No peak 20-24 hours
Premixed
75% NPL/25% Lispro
50% NPL/50% Lispro
70% Aspart Protamine/30%
Aspart
70% NPH/30%
regular/NPH
5-15 minutes
5-15 minutes
5-15 minutes
30-60 minutes
Dual
Dual
Dual
Dual
10-16 hours
10-16 hours
10-16 hours
10-16 hours
*Assumes 0.1-0.2 units/kg/injection. Onset and duration may vary significantly by injection site.
** Time to steady state
DeWitt DE, et al. JAMA. 2003; Hirsch IB, et al. Clinical Diabetes. 2005.
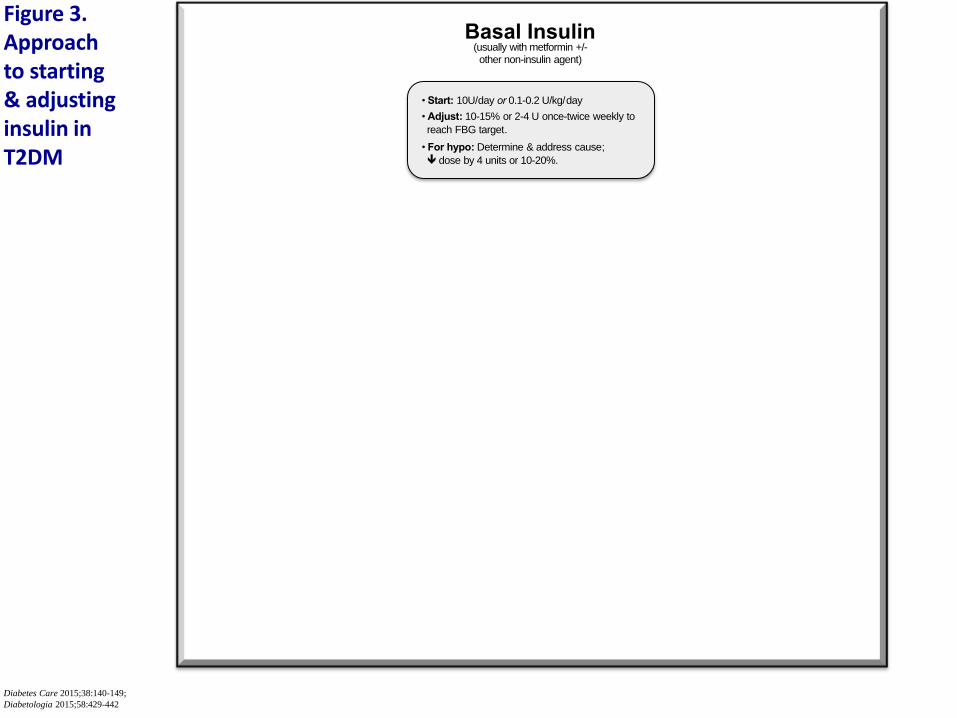
• Start: 10U/day or 0.1-0.2 U/kg/day
• Adjust: 10-15% or 2-4 U once-twice weekly to
reach FBG target.
• For hypo: Determine & address cause;
ê dose by 4 units or 10-20%.
Basal Insulin (usually with metformin +/- other non-insulin agent)
Figure 3. Approach to starting & adjusting insulin in T2DM
Diabetes Care 2015;38:140-149;
Diabetologia 2015;58:429-442

Add ≥2 rapid insulin* injections before meals ('basal-bolus’†)
Change to premixed insulin* twice daily
Add 1 rapid insulin* injections before largest meal
• Start: Divide current basal dose into 2/3 AM,
1/3 PM or 1/2 AM, 1/2 PM.
• Adjust: é dose by 1-2 U or 10-15% once-
twice weekly until SMBG target reached.
• For hypo: Determine and address cause; ê corresponding dose by 2-4 U or 10-20%.
• Start: 10U/day or 0.1-0.2 U/kg/day
• Adjust: 10-15% or 2-4 U once-twice weekly to
reach FBG target.
• For hypo: Determine & address cause;
ê dose by 4 units or 10-20%.
Basal Insulin (usually with metformin +/- other non-insulin agent)
If not controlled after
FBG target is reached (or if dose > 0.5 U/kg/day),
treat PPG excursions with
meal-time insulin. (Consider initial
GLP-1-RA trial.)
If not controlled,
consider basal-bolus.
If not controlled,
consider basal-bolus.
• Start: 4U, 0.1 U/kg, or 10% basal dose. If A1c<8%, consider ê basal by same amount.
• Adjust: é dose by 1-2 U or 10-15% once-
twice weekly until SMBG target reached.
• For hypo: Determine and address cause;
ê corresponding dose by 2-4 U or 10-20%.
• Start: 4U, 0.1 U/kg, or 10% basal dose/meal.‡ If
A1c<8%, consider ê basal by same amount.
• Adjust: é dose by 1-2 U or 10-15% once-twice
weekly to achieve SMBG target.
• For hypo: Determine and address cause; ê corresponding dose by 2-4 U or 10-20%.
Figure 3. Approach to starting & adjusting insulin in T2DM
Diabetes Care 2015;38:140-149;
Diabetologia 2015;58:429-442

Add ≥2 rapid insulin* injections before meals ('basal-bolus’†)
Change to premixed insulin* twice daily
Add 1 rapid insulin* injections before largest meal
• Start: Divide current basal dose into 2/3 AM,
1/3 PM or 1/2 AM, 1/2 PM.
• Adjust: é dose by 1-2 U or 10-15% once-
twice weekly until SMBG target reached.
• For hypo: Determine and address cause; ê corresponding dose by 2-4 U or 10-20%.
• Start: 10U/day or 0.1-0.2 U/kg/day
• Adjust: 10-15% or 2-4 U once-twice weekly to
reach FBG target.
• For hypo: Determine & address cause;
ê dose by 4 units or 10-20%.
Basal Insulin (usually with metformin +/- other non-insulin agent)
If not controlled after
FBG target is reached (or if dose > 0.5 U/kg/day),
treat PPG excursions with
meal-time insulin. (Consider initial
GLP-1-RA trial.)
low
mod.
high
more flexible less flexible
Complexity #
Injections
Flexibility
1
2
3+
If not controlled,
consider basal-bolus.
If not controlled,
consider basal-bolus.
• Start: 4U, 0.1 U/kg, or 10% basal dose. If A1c<8%, consider ê basal by same amount.
• Adjust: é dose by 1-2 U or 10-15% once-
twice weekly until SMBG target reached.
• For hypo: Determine and address cause;
ê corresponding dose by 2-4 U or 10-20%.
• Start: 4U, 0.1 U/kg, or 10% basal dose/meal.‡ If
A1c<8%, consider ê basal by same amount.
• Adjust: é dose by 1-2 U or 10-15% once-twice
weekly to achieve SMBG target.
• For hypo: Determine and address cause; ê corresponding dose by 2-4 U or 10-20%.
Figure 3. Approach to starting & adjusting insulin in T2DM
Diabetes Care 2015;38:140-149;
Diabetologia 2015;58:429-442
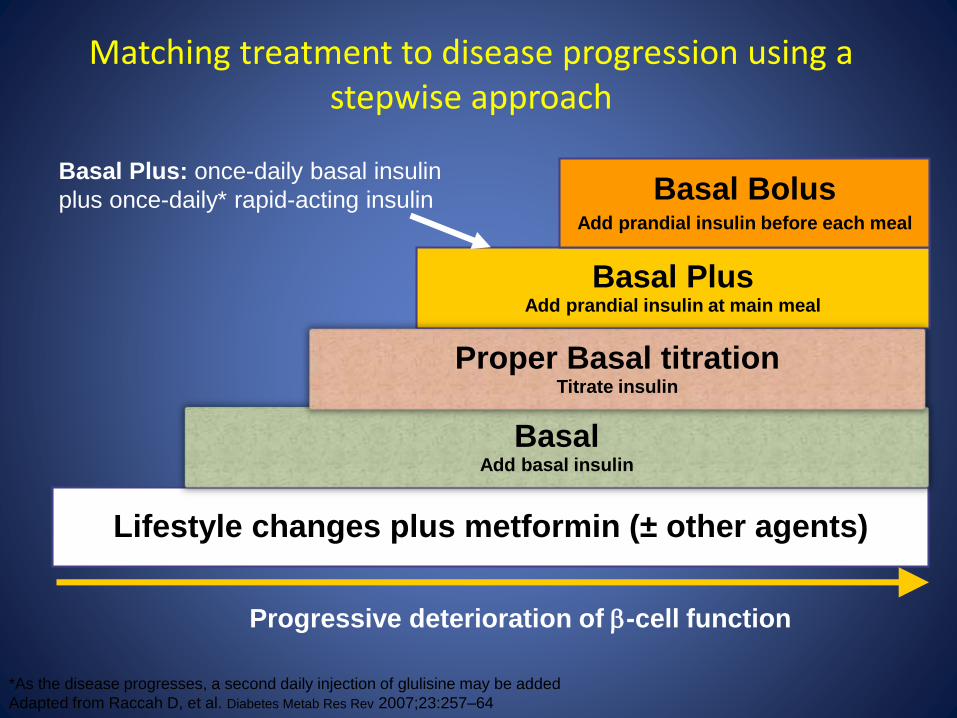
Lifestyle changes plus metformin (± other agents)
BasalAdd basal insulin
Basal PlusAdd prandial insulin at main meal
Basal BolusAdd prandial insulin before each meal
Progressive deterioration of -cell function
Basal Plus: once-daily basal insulin
plus once-daily* rapid-acting insulin
Matching treatment to disease progression using a stepwise approach
*As the disease progresses, a second daily injection of glulisine may be added
Adapted from Raccah D, et al. Diabetes Metab Res Rev 2007;23:257–64
Proper Basal titrationTitrate insulin

Insulin Therapy in Patients with CKD
Diabetic NephropathyTIDM: Intensive insulin therapy was more effective as
regards glycaemic control (HbA1c 7.2 vs. 9.1%) than
conventional insulin therapy in 1441 type 1 diabetics treated
for an average treatment period of 6.5 years.
39% reduction in microalbuminuria risk (>40 mg/day)
(primary prevention)
54% reduction in progression to macroalbuminuria
(>300 mg/ day) (secondary intervention)
The effect of intensive treatment of diabetes on thedevelopment and progression of long-term complications
n insulin-dependent diabetes mellitus: The DiabetesControl and Complications Trial ResearchGroup. N Engl J Med 1993; 329:
977–986.
52

Insulin Therapy in Patients with CKD
Diabetic Nephropathy
•T2DMay also benefit from intensive insulin
therapy. In a 6-year study, performed on 110 non-
obese Japanese patients with type 2 diabetes,
intensive insulin therapy was associated with
• primary prevention (7.7 vs. 28%)
• secondary intervention (11.5 vs.32%) .
Ohkubo Y, Kishikawa H, Araki E et al. Intensiveinsulin therapy prevents the progression of diabetic microvascular complications
in Japanese patients withnon-insulin-dependent diabetes mellitus: a randomizedprospective 6-year study. Diabetes Res Clin
Pract1995; 28: 103–117.
53

Insulin Therapy in Patients with CKD
Diabetic NephropathyAmong the main limitations of intensive insulin therapy
Hypoglycaemia
Weight gain.
54

Insulin Therapy in HD
Diabetic Nephropathy• In HD patients, insulin requirements are reduced in
probable relationship with an improvement in IR associated to
dialysis procedure
• Hypoglycemic events tended to be higher than in the
predialysis period. Moreover, the residual diuresis decrement
during the first year on HD is associated with a significant
reduction of insulin requirements
• patients with residual diuresis <500 ml/day showed a
reduction in insulin needs by about 29%, whereas no changes
were reported in patients with higher residualDiuresis
55

Insulin Therapy in HD
Diabetic Nephropathy
• Adequate glycaemic control in HD diabetic patients : two
doses of intermediate-acting insulin and or one basal insulin +
preprandial dose of rapid-acting insulin as needed .
• HD solutions with high glucose concentration have shown to
be useful in preventing hypoglycemic events during the HD
session, without significant effects on HbA1c
56

Insulin Therapy in PD
Diabetic Nephropathy
57

Insulin Analogues in Renal Insufficiency
Diabetic Nephropathy
58


AGENDA
60
Background of Dysglycemia and CKD
Pathophysiology of Dysglycemia and CKD
Glycemic control and CKD
Insulin therapy and CKD
Conclusions

Conclusions
Diabetic NephropathyGlycaemic control in CKD diabetic patients can be difficult to be
obtained because of multiple factors intrinsic to diabetes, renal
insufficiency and concomitant therapy(pharmacological, dialytic and
immunosuppressive therapy).
IR and hyperinsulinaemia can impair the capacity to reach satisfactory
target blood glucose levels.
Intensive insulin therapy is an adequate option for improving glycemic
control in CKD although it might increase the risk of hypoglycaemic
events.
insulin analogues in CKD patients has been associated with potential
advantages and benefits with regard to glycaemic control.
61