Embed Size (px)
Citation preview

SMALL AIRWAYS & CHILD HEALTH WORKING GROUP MEETING
DATE: Saturday September 3rd
TIME: 4.00–5.00pm VENUE: Royal College of General Practitioners; 30 Euston Square, London, UK

Agenda 16.00-16.05 Welcome / Introduction Omar Usmani
16.05–16.15 On-going publications 16.05–16.10 – Chest nomenclature commentary Liz Hillyer 16.10–16.20 – Systematic Review of the comparative Sam Sonnappa 16.20–16.35 Pre-school asthma wheeze Jonathan Grigg
16.35–16.50 New ideas for the group • Ideas so far Omar Usmani – Implications of ICS particle size on (on behalf of Nicolas Roche) • GERD • ACOS – Other ideas / Discussion Group
16.50–17.00 Oscillometry – FOT study overview Ron Dandurand

ONGOING PUBLICATIONS – CHEST PARTICLE SIZE NOMENCLATURE EDITORIAL – SYSTEMATIC REVIEW OF THE ICS PARTICLE SIZE
COMPARATIVE EFFECTIVENESS EVIDENCE 16.05–16.20PM

Chest Commentary: Nomenclature Update: Background
• Need for consensus on aerosol particle nomenclature • Terms used in the published literature:
o Extrafine, ultrafine, small vs. large, standard-size, coarse
• ERS/ISAM Task Force Report (ERJ 2011) includes: o “Fine-particle dose” (FPD) = mass of drug consisting of
particles <5µm in aerodynamic diameter o Denotes Qvar and ciclesonide as being “extrafine.”
• Hence our proposal, submitted to Chest last month: o “Extrafine” particle = MMAD <2µm o “Fine” particle = MMAD 2-5µm o “Coarse” particle = MMAD >5µm

Chest Commentary: Review 29Aug
Reviewer 1: favorable, two suggestions: 1. Replace the Figure (schematic of lung deposition by particle
size) with a table summarizing evidence basis for nomenclature proposal: o This could be added without deleting the figure.
2. Add a proposal for use of the terms extrafine- and coarse-particle fractions, in accordance with “fine-particle fraction” o Instead we could propose “extrafine-particle dose” and
“coarse-particle dose,” as per fine-particle dose (FPD) o The fine-particle fraction (FPF) is variable depending on how
it’s calculated (FPD/emitted dose vs. FPD/nominal metered dose) & can be the same for two products with different delivered doses even if the FPD differs
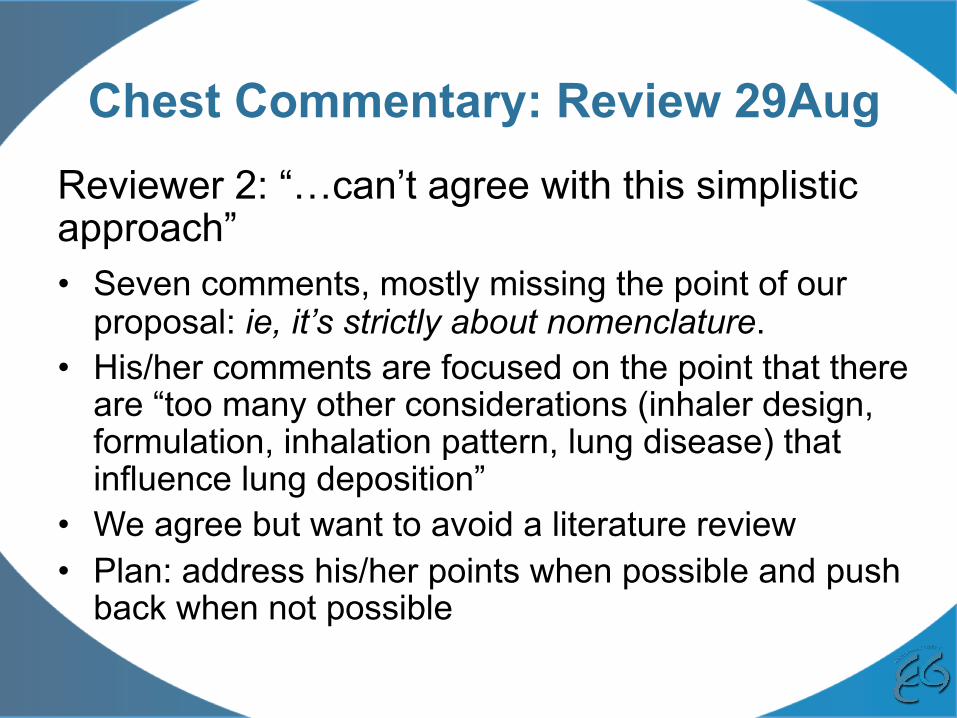
Chest Commentary: Review 29Aug Reviewer 2: “…can’t agree with this simplistic approach” • Seven comments, mostly missing the point of our
proposal: ie, it’s strictly about nomenclature. • His/her comments are focused on the point that there
are “too many other considerations (inhaler design, formulation, inhalation pattern, lung disease) that influence lung deposition”
• We agree but want to avoid a literature review • Plan: address his/her points when possible and push
back when not possible
SYSTEMATIC REVIEW OF THE COMPARATIVE EFFECTIVENESS LITERATURE
ON ICS PARTICLE SIZE
DR SAM SONNAPPA

Figure : PRISMA flowchart showing the step-by-step process of the application of inclusion and exclusion criteria to generate the final number of studies included
in the meta-analysis
Literature Review

Figure : Forest plot showing pooled odds ratios (95% CI) for measures of asthma control
Results: Asthma Control

Figure: Forest plot showing pooled relative risk ratios (95% CI) for measures of asthma exacerbations
Results: Exacerbations
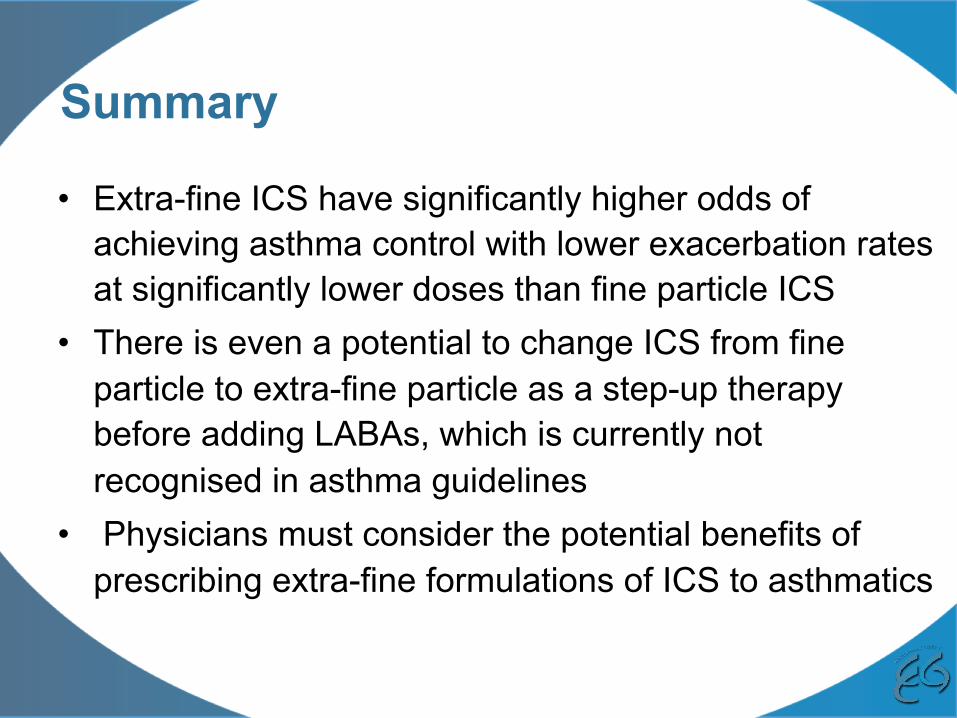
Summary
• Extra-fine ICS have significantly higher odds of achieving asthma control with lower exacerbation rates at significantly lower doses than fine particle ICS
• There is even a potential to change ICS from fine particle to extra-fine particle as a step-up therapy before adding LABAs, which is currently not recognised in asthma guidelines
• Physicians must consider the potential benefits of prescribing extra-fine formulations of ICS to asthmatics

PRE-SCHOOL ASTHMA / WHEEZE JONATHAN GRIGG
16.20–16.35PM
Background / Rationale
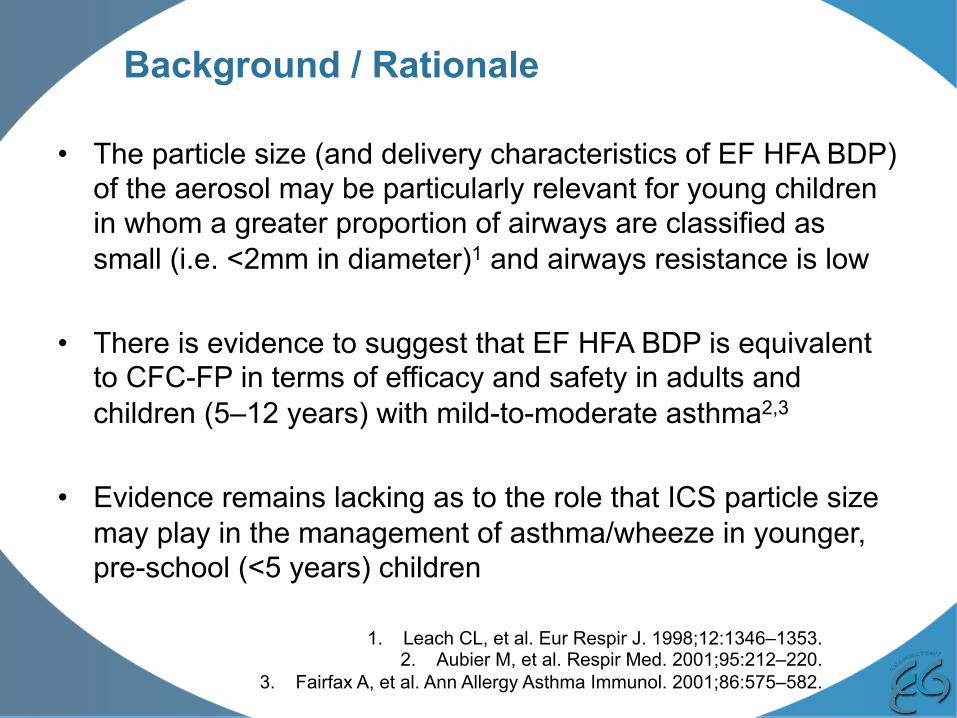
• The particle size (and delivery characteristics of EF HFA BDP) of the aerosol may be particularly relevant for young children in whom a greater proportion of airways are classified as small (i.e. <2mm in diameter)1 and airways resistance is low
• There is evidence to suggest that EF HFA BDP is equivalent to CFC-FP in terms of efficacy and safety in adults and children (5–12 years) with mild-to-moderate asthma2,3
• Evidence remains lacking as to the role that ICS particle size may play in the management of asthma/wheeze in younger, pre-school (<5 years) children
1. Leach CL, et al. Eur Respir J. 1998;12:1346–1353. 2. Aubier M, et al. Respir Med. 2001;95:212–220.
3. Fairfax A, et al. Ann Allergy Asthma Immunol. 2001;86:575–582.

• To test the hypothesis that use of EF ICS in pre-school children with asthma/wheeze will achieve better outcomes than treatment alternatives (i.e. NEF ICS, LTRA, or SABA)
Study Objectives
• Phase I: a descriptive analysis of treatment patterns in children aged ≤5 years with wheezing illness
• Phase II: a comparative effectiveness evaluation of guideline-recommended treatment options in pre-school children newly initiating Step 2 therapy NEF ICS vs EF ICS and LTRA vs EF ICS over a 1-year outcome period
• Exploratory analysis: an extension of the primary analysis over a 5-year outcome period to explore whether EF ICS may offer potential disease-modifying effects compared with alternative treatment options when used in the management of early-life wheezing illness
Study Phases

Data Source
• The UK’s Optimum Patient Care Research Database (OPCRD)
• Fully anonymised UK primary care data
• Historical medical records for: o >2.2 million patients, from
o >550 primary care practices across the UK
• Ethical approval for medical research
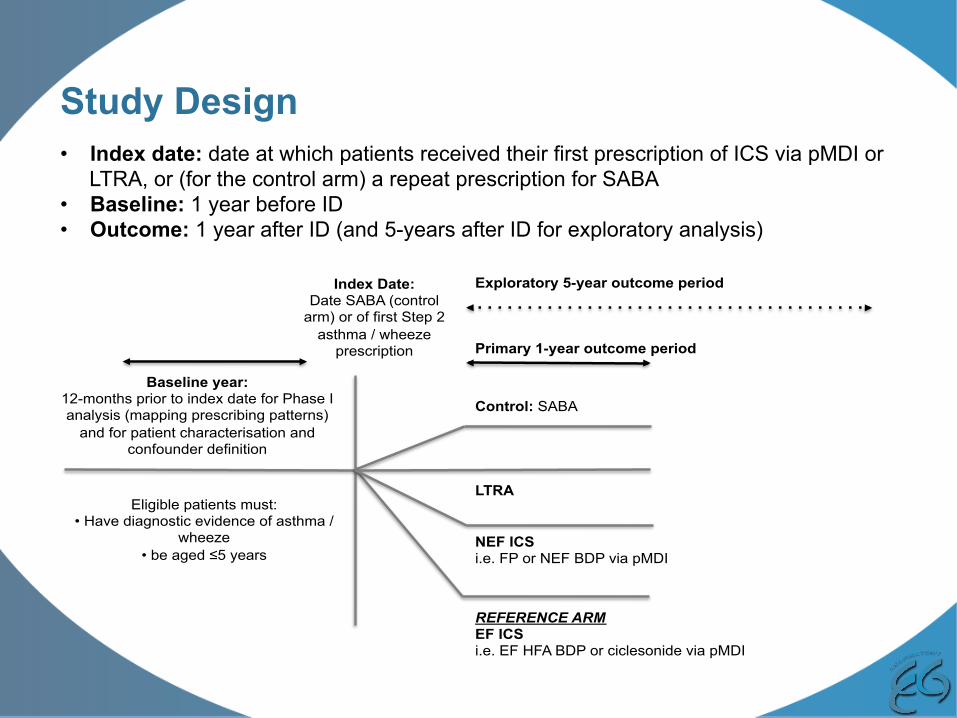
Study Design
Index Date: Date SABA (control
arm) or of first Step 2 asthma / wheeze
prescription
Baseline year: 12-months prior to index date for Phase I analysis (mapping prescribing patterns)
and for patient characterisation and confounder definition
Exploratory 5-year outcome period
Primary 1-year outcome period
REFERENCE ARM EF ICS i.e. EF HFA BDP or ciclesonide via pMDI
LTRA Eligible patients must:
• Have diagnostic evidence of asthma / wheeze
• be aged ≤5 years
NEF ICS i.e. FP or NEF BDP via pMDI
Control: SABA
• Index date: date at which patients received their first prescription of ICS via pMDI or LTRA, or (for the control arm) a repeat prescription for SABA
• Baseline: 1 year before ID • Outcome: 1 year after ID (and 5-years after ID for exploratory analysis)

Inclusion Criteria
• Age: ≤5 years of age at the index date • Evidence of pre-school wheeze or asthma during the baseline year – defined as either:
o ≥2 wheezing episodes recorded within their primary care records in the baseline year, or o ≥2 prescriptions (at two different points in time) during the baseline year for any combination
of oral steroids coded for a lower respiratory complaint ± salbutamol • Active treatment during outcome year:
o Active treatment arms (Step 2 therapy): ≥2 prescriptions (i.e. ≥1 in addition to that prescribed at index date) for any of the Step 2 treatment options (i.e. any ICS via pMDI or LTRA)
o Control arm: ≥2 prescriptions for SABA o Exploratory 5-year outcome analysis: ≥1 prescription of the index date therapy in each of
the outcome years • At least 2 year’s continuous records: ≥1 year’s continuous baseline records and ≥1 year’s outcome
records o Eligibility for the exploratory analysis ≥5-years’outcome data
Study Population
Exclusion Criteria
• Have a clinical diagnosis for any chronic respiratory disease, except wheeze or asthma • Received a combination inhaler in addition to a separate ICS inhaler in baseline; • Multiple step-up therapies on the same day • Infants: any child under the age of 1 year (as ≥1 year of baseline data is required)

Outcomes/Endpoints
Primary Endpoint: • Exacerbations (ATS/ERS definition) defined as occurrence of an:
o Asthma-related: Hospital admissions OR A&E attendance; OR o An acute course of oral steroids (coded for asthma or wheeze)
Secondary Endpoints: • Acute respiratory event
o Hospital Admissions OR A&E attendance OR o Acute Oral Steroid Prescriptions o Antibiotic Prescriptions with LR complaint
• Risk Domain Asthma Control • Overall Asthma Control (OAC) • Treatment stability

Outcome Definitions
Risk Domain Asthma Control (RDAC) Defined as absence of: Controlled: • Asthma-related: Hospital admission AND A&E
attendance AND out-patient attendance; AND • Acute use of oral steroids; AND • Antibiotics prescribed with lower respiratory
consultation
Uncontrolled: all others
Treatment stability: Stable: • Achieved Risk Domain Asthma Control; AND • No additional therapy defined as no:
• Increased dose of ICS (≥50% increase of that prescribed at index date) AND/OR
• Use of additional therapy as defined by: long-acting bronchodilator (LABA), theophylline, LTRAs
Unstable: all others
Overall Asthma Control Defined as absence of: Controlled: • RDAC (achievement/non-achievement); plus • Average daily dose of SABA ≤200mcg salbutamol Uncontrolled: all others

MATCHED RESULTS SUMMARY
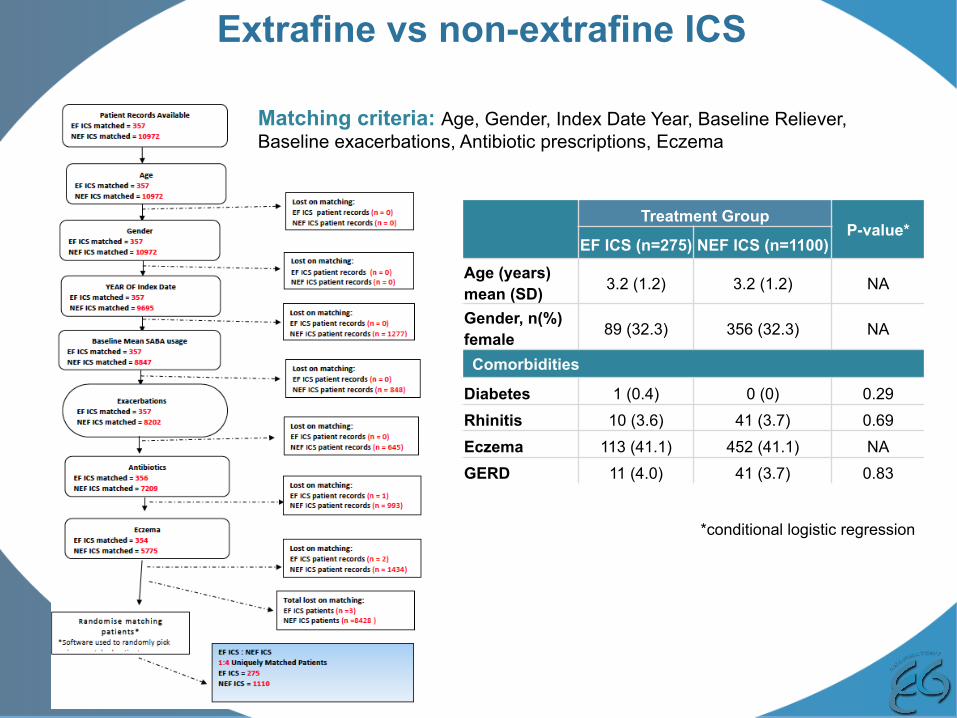
Extrafine vs non-extrafine ICS
Treatment Group P-value*
EF ICS (n=275) NEF ICS (n=1100) Age (years) mean (SD) 3.2 (1.2) 3.2 (1.2) NA
Gender, n(%) female 89 (32.3) 356 (32.3) NA
Comorbidities
Diabetes 1 (0.4) 0 (0) 0.29 Rhinitis 10 (3.6) 41 (3.7) 0.69 Eczema 113 (41.1) 452 (41.1) NA GERD 11 (4.0) 41 (3.7) 0.83
*conditional logistic regression
Matching criteria: Age, Gender, Index Date Year, Baseline Reliever, Baseline exacerbations, Antibiotic prescriptions, Eczema

OUTCOME SUMMARY BASELINE OUTCOMES EF ICS (n=275) NEF ICS (n=1100) EF ICS (n=275) NEF ICS (n=1100)
Exacerbations Mean (SD) 0.76 (0.88) 0.77 (0.93) 0.55 (0.85) 0.49 (0.83)
Yes (≥1), n(%) 142 (51.6) 568 (51.6) 99 (36.0) 366 (33.3)
P-value* NA 0.363
Lower respiratory Hospitalisations
Mean (SD) 0.06 (0.26) 0.05 (0.28) 0.03 (0.16) 0.03 (0.17) Yes (≥1), n(%) 14 (5.1) 47 (4.3) 7 (2.5)
P-Value* 0.546 0.789
Lower respiratory A&E Attendances
Mean (SD) 0.02 (0.13) 0.02 (0.16) 0.01 (0.12) 0.02 (0.16) Yes (≥1), n(%) 5 (1.8) 25 (2.2) 4 (1.4) 16 (1.2)
P-value* 0.643 0.712
Acute oral steroid prescriptions
Mean (SD) 0.72 (0.88) 0.74 (0.95) 0.53 (0.83) 0.47 (0.83) Yes (≥1), n(%) 135 (49.1) 535 (48.6) 94 (34.2) 350 (31.8)
P-value* 0.683 0.426
Lower respiratory antibiotic
prescriptions
Mean (SD) 1.06 (1.29) 1.08 (1.31) 0.61 (1.07) 0.63 (1.0) Yes (≥1), n(%) 152 (55.3) 608 (55.3) 100 (36.4) 416 (37.8)
P-value* NA 0.639
Acute Respiratory Events
No, n(%) 133 (48.4) 532 (48.4) 176 (64.0) 734 (66.7) Yes, n(%) 142 (51.6) 568 (51.6) 99 (36.0) 366 (33.3) P-value* NA 0.363
Risk Domain Asthma Control
Controlled, n(%) 68 (24.5) 272 (24.7) 128 (46.5) 523 (47.5) Uncontrolled, n(%) 207 (75.3) 828 (75.3) 147 (53.5) 577 (52.5)
P-value* NA 0.755
Overall Asthma Control
Controlled, n(%) 51 (18.3) 209 (17.6) 81 (29.5) 332 (30.2) Uncontrolled, n(%) 183 (68.3) 709 (66.4) 65 (23.6) 279 (25.3)
Missing 41 (13.3) 182 (16.0) 129 (46.9) 489 (44.5) P-value* NA 0.904
Treatment Stability
Stable, n (%) – – 115 (41.8) 451 (41.0) Unstable, n (%) – – 118 (42.9) 439 (39.9) Missing, n (%) – – 42 (15.3) 210 (19.1)
P-value* – 0.847 *conditional logistic regression
No significant differences to suggest extrafine particle ICS offers benefit over
standard particle ICS

ICS (all) vs LTRA
Treatment Group P-value*
LTRA (n=104) ICS (n=104)
Age (years) mean (SD) 2.6 (1.1) 2.6 (1.1) NA
Gender, n(%) female 41 (39.4) 41 (39.4) NA
Comorbidities
Diabetes 0 (0) 0 (0) NA
Rhinitis 6 (5.8) 7 (6.7) 0.782
Eczema 39 (37.5) 39 (37.5) NA
GERD 9 (8.7) 5 (4.8) 0.258
*conditional logistic regression
Matching criteria: Age, Gender, Index Date Year, Baseline Reliever, Baseline exacerbations, Antibiotic prescriptions, Eczema
LTRA=104
LTRApa,entrecords
LTRApa,entrecords
LTRApa,entrecords
LTRApa,entrecords
LTRApa,entrecords
LTRApa,entrecords
LTRApa,entrecords
LTRApa,entrecords

OUTCOME SUMMARY BASELINE OUTCOMES LTRA (n=104) ICS (n=104) LTRA (n=104) ICS (n=104)
Exacerbations Mean (SD) 1.13 (1.0) 1.13 (1.0) 0.8 (1.1) 0.6 (0.9)
Yes (≥1), n(%) 75 (72.1) 75 (72.1) 47 (45.2) 41 (39.4) P-value* NA 0.378
Lower respiratory Hospitalisations
Mean (SD) 0.13 (0.4) 0.1 (0.3) 0 (0.2) 0.0 (0.2) Yes (≥1), n(%) 12 (11.5) 7 (6.7) 4 (3.8) 1 (1.0)
P-Value* 0.232 0.215
Lower respiratory A&E Attendances
Mean (SD) 0.1 (0.3) 0.0 (0.1) 0.0 (0.2) 0.0 (0.1) Yes (≥1), n(%) 9 (8.7) 2 (1.9) 4 (3.8) 1 (1.0)
P-value* 0.05 0.215
Acute oral steroid prescriptions
Mean (SD) 1.0 (1.0) 1.1 (1.0) 0.8 (1.1) 0.6 (0.9) Yes (≥1), n(%) 69 (67.0) 72 (69.2) 44 (42.3) 40 (38.5)
P-value* 0.327 0.556 Lower respiratory
antibiotic prescriptions
Mean (SD) 1.5 (1.6) 1.6 (1.6) 0.9 (1.2) 0.7 (0.9) Yes (≥1), n(%) 74 (71.2) 74 (71.2) 49 (47.1) 48 (46.2)
P-value* NA 0.896
Acute Respiratory Events
No, n(%) 15 (14.4) 15 (14.4) 36 (34.6) 41 (39.4) Yes, n(%) 89 (85.6) 89 (85.6) 68 (65.4) 63 (60.6) P-value* NA 0.485
Risk Domain Asthma Control
Controlled, n(%) 15 (14.4) 15 (14.4) 36 (34.6) 41 (39.4) Uncontrolled, n(%) 89 (85.6) 89 (85.6) 68 (65.4) 63 (60.6)
P-value* NA 0.485
Overall Asthma Control
Controlled, n(%) 14 (13.5) 14 (13.5) 18 (17.3) 30 (28.8) Uncontrolled, n(%) 84 (80.8) 81 (77.9) 28 (26.9) 30 (28.8)
Missing 6 (6.7) 9 (8.6) 58 (55.8) 44 (42.4) P-value* NA 0.655
Treatment Stability
Stable, n (%) – – 36 (34.6) 38 (36.5) Unstable, n (%) – – 68 (65.4) 52 (50.0) Missing, n (%) – – 0 14 (13.5)
P-value* – 0.230 *conditional logistic regression
No significant differences to suggest benefit of ICS versus LTRA

ICS (all) vs SABA
Treatment Group P-value*
SABA (n=3960) ICS (n=990)
Age (years) mean (SD) 3.19 (1.3) 3.19 (1.3) NA
Gender, n(%) female 1552 (39.2) 388 (39.2) NA
Comorbidities
Diabetes 6 (0.2) 0 (0) 1.000
Rhinitis 170 (4.3) 36 (3.6) 0.351
Eczema 1488 (37.6) 372 (37.6) NA
GERD 149 (3.8) 36 (3.6) 0.850
*conditional logistic regression
Matching criteria: Age, Gender, Index Date Year, Baseline Reliever, Baseline exacerbations, Antibiotic prescriptions, Eczema

OUTCOME SUMMARY BASELINE OUTCOMES SABA (n=3960) ICS (n=990) SABA (n=3960) ICS (n=990)
Exacerbations Mean (SD) 0.50 (0.78) 0.53 (0.84) 0.41 (0.81) 0.42 (0.83)
Yes (≥1), n(%) 1420 (35.9) 335 (35.9) 1042 (26.3) P-value* NA 0.378
Lower respiratory Hospitalisations
Mean (SD) 0.05 (0.26) 0.05 (0.26) 0.02 (0.16) 0.02 (0.15) Yes (≥1), n(%) 157 (4.0) 36 (3.7) 76 (1.9) 15 (1.5)
P-Value* 0.614 0.396
Lower respiratory A&E Attendances
Mean (SD) 0.01 (0.13) 0.02 (0.15) 0.01 (0.11) 0.03 (0.2) Yes (≥1), n(%) 52 (1.3) 13 (1.3) 39 (1.0) 21 (2.1)
P-value* 1.000 0.004
Acute oral steroid prescriptions
Mean (SD) 0.46 (0.77) 0.50 (0.82) 0.40 (0.83) 0.40 (0.83) Yes (≥1), n(%) 1303 (32.9) 334 (33.7) 987 (24.9) 259 (25.2)
P-value* 0.135 0.822 Lower respiratory
antibiotic prescriptions
Mean (SD) 0.89 (1.21) 0.92 (1.27) 0.56 (1.00) 0.57 (1.00) Yes (≥1), n(%) 1920 (48.5) 480 (48.5) 1370 (34.6) 344 (34.7)
P-value* NA 0.924
Acute Respiratory Events
No, n(%) 1492 (37.7) 373 (37.7) 2099 (53.0) 523 (52.8) Yes, n(%) 2468 (62.3) 617 (62.3) 1861 (47.0) 467 (47.2) P-value* NA 0.915
Risk Domain Asthma Control
Controlled, n(%) 1492 (37.7) 373 (37.7) 2099 (53.0) 523 (52.8) Uncontrolled, n(%) 2468 (62.3) 617 (62.3) 1861 (47.0) 467 (47.2)
P-value* NA 0.915
Overall Asthma Control
Controlled, n(%) 1,179 (29.8) 302 (30.5) 1054 (26.6) 338 (34.1) Uncontrolled, n(%) 2516 (63.5) 631 (63.7) 2906 (73.4) 597 (60.3)
Missing 265 (6.7) 57 (5.8) 0 55 (5.6) P-value* NA 0.043
Treatment Stability
Stable, n (%) – – 2052 (51.8) 448 (45.3) Unstable, n (%) – – 1908 (48.2) 542 (54.7) Missing, n (%) – – 0 0
P-value* – 0.317 *conditional logistic regression
Little significant differences to suggest benefit of ICS versus SABA
– possible ICS benefit in terms of overall asthma control – Difference in A&E attendances favours SABA

Treatment Group P-value*
SABA (n=1036) LTRA (n=259) Age (years) mean (SD) 2.6 (1.2) 2.6 (1.2) NA
Gender, n(%) female 364 (35.1) 91(35.1) NA
Comorbidities
Diabetes 3 (0.3) 0 (0) 1.000
Rhinitis 35 (3.4) 11 (4.3) 0.496
Eczema 388 (37.5) 97 (37.5) NA
GERD 59 (5.7) 24 (9.3) 0.038
*conditional logistic regression
LTRA vs SABA
Matching criteria: Age, Gender, Index Date Year, Baseline Reliever, Baseline exacerbations, Antibiotic prescriptions, Eczema
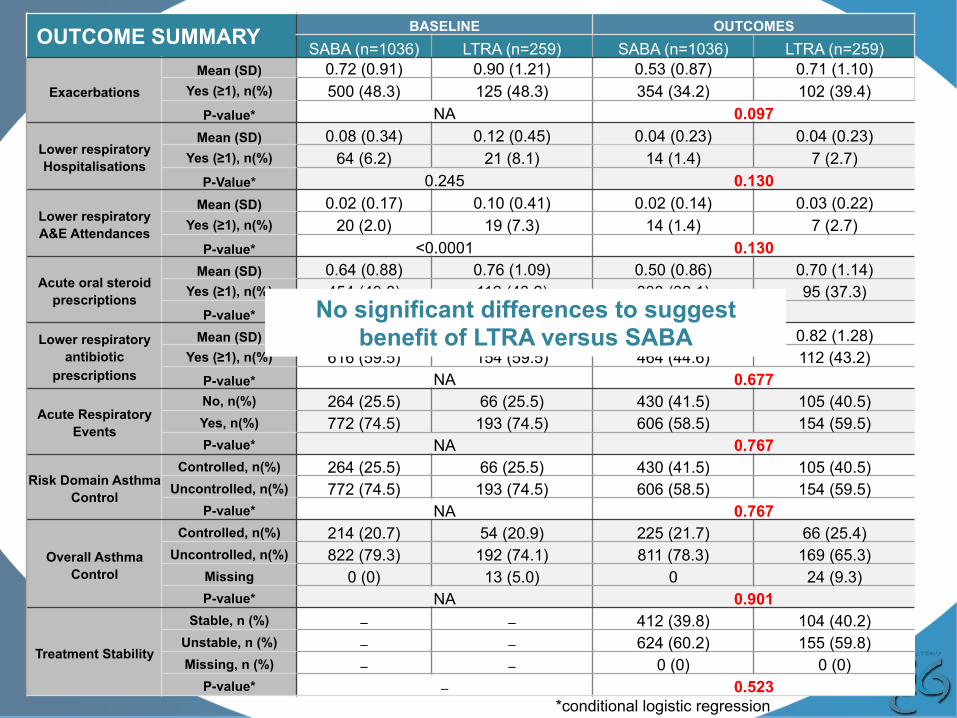
OUTCOME SUMMARY BASELINE OUTCOMES SABA (n=1036) LTRA (n=259) SABA (n=1036) LTRA (n=259)
Exacerbations Mean (SD) 0.72 (0.91) 0.90 (1.21) 0.53 (0.87) 0.71 (1.10)
Yes (≥1), n(%) 500 (48.3) 125 (48.3) 354 (34.2) 102 (39.4) P-value* NA 0.097
Lower respiratory Hospitalisations
Mean (SD) 0.08 (0.34) 0.12 (0.45) 0.04 (0.23) 0.04 (0.23) Yes (≥1), n(%) 64 (6.2) 21 (8.1) 14 (1.4) 7 (2.7)
P-Value* 0.245 0.130
Lower respiratory A&E Attendances
Mean (SD) 0.02 (0.17) 0.10 (0.41) 0.02 (0.14) 0.03 (0.22) Yes (≥1), n(%) 20 (2.0) 19 (7.3) 14 (1.4) 7 (2.7)
P-value* <0.0001 0.130
Acute oral steroid prescriptions
Mean (SD) 0.64 (0.88) 0.76 (1.09) 0.50 (0.86) 0.70 (1.14) Yes (≥1), n(%) 454 (43.8) 112 (43.2) 333 (32.1) 95 (37.3)
P-value* 0.676 0.142 Lower respiratory
antibiotic prescriptions
Mean (SD) 1.15 (1.34) 1.29 (1.53) 0.76 (1.12) 0.82 (1.28) Yes (≥1), n(%) 616 (59.5) 154 (59.5) 464 (44.6) 112 (43.2)
P-value* NA 0.677
Acute Respiratory Events
No, n(%) 264 (25.5) 66 (25.5) 430 (41.5) 105 (40.5) Yes, n(%) 772 (74.5) 193 (74.5) 606 (58.5) 154 (59.5) P-value* NA 0.767
Risk Domain Asthma Control
Controlled, n(%) 264 (25.5) 66 (25.5) 430 (41.5) 105 (40.5) Uncontrolled, n(%) 772 (74.5) 193 (74.5) 606 (58.5) 154 (59.5)
P-value* NA 0.767
Overall Asthma Control
Controlled, n(%) 214 (20.7) 54 (20.9) 225 (21.7) 66 (25.4) Uncontrolled, n(%) 822 (79.3) 192 (74.1) 811 (78.3) 169 (65.3)
Missing 0 (0) 13 (5.0) 0 24 (9.3) P-value* NA 0.901
Treatment Stability
Stable, n (%) – – 412 (39.8) 104 (40.2) Unstable, n (%) – – 624 (60.2) 155 (59.8) Missing, n (%) – – 0 (0) 0 (0)
P-value* – 0.523 *conditional logistic regression
No significant differences to suggest benefit of LTRA versus SABA

ADDITIONAL ANALYSES

Explore interaction of switch to ICS (I)
• 50-60% of patients in SABA and LTRA arms received ICS in the outcome year
• Implications…?
• Explore: o Time to treatment failure
– Addition of new therapy (i.e. ICS) or ≥50% dose increase in index date therapy
o Time to first exacerbation

Time to first exacerbation & treatment stability
OUTCOME SUMMARY Time to First Exacerbation (days)
Time to Treatment Failure (days)
EF vs NEF ICS (n=275 v n=1100)
Mean (SD) 61.0 (92.1) 70.2 (100.3) 115.0 (97.3) 129.8 (100.5)
P-value* 0.165 0.145
ICS vs SABA (n=990 v n=3960)
Mean (SD) 62.7 (97.4) 60.4 (96.7) 128.4 (101.8) 110.0 (99.9)
P-value* 0.489 0.183
ICS vs LTRA (n=104 v n=104)
Mean (SD) 87.2 (114.3) 83.9 (99.7) 134.8 (110.9) 107.7 (88.7)
P-value* 0.992 0.959
LTRA vs SABA (n=259 v n=1036)
Mean (SD) 72.0 (97.4) 68.5 (96.9) 104.6 (93.7) 99.5 (94.5)
P-value* 0.594 0.046
No clinically meaningful differences seen between any choice of treatment

Explore interaction of switch to ICS (II)
• In the unmatched population, evaluate the change in acute respiratory events between baseline and outcome as a function of consumed ICS dose in the outcome year (i.e. total mcg prescribed)
• Other possible additional analyses to explore markers for ICS response: o Explore whether there is any benefit in ICS treatment in
patients stratified by blood eosinophil threshold (<300 and ≥300) o Data available for ~9000 patients

DISCUSSION

Discussion • Key messages:
o Robustly negative study o The study design works – proven in other age groups o The results reflect clinical practice observations and results from large trials:
– Pre-school wheeze is a heterogeneous entity – Variable, often little, treatment response
o There may be some subgroups of patients that are responding to therapy, but there are no markers for potential response
o New therapeutic modalities are required o In the absence of better tools to help target treatments, the data suggest a
"wait-and-see approach" in this pre-school population may be sound
• Timeline: o Statistical adjustments & additional analyses: by October o Manuscript development over the autumn; submission by December
NEW RESEARCH IDEAS INTERACTION OF ICS PARTICLE SIZE AND – ASTHMA, EXCESS WEIGHT AND GERD
– ACOS – OTHERS?
16.35–16.50PM

Working title Implications of inhaled corticosteroid particle size in the management of asthma in patients excess weight/obesity and/or GERD Objective 1. Evaluate the comparative effectiveness of extra-fine
and non extra-fine inhaled corticosteroid (ICS) treatment in patients with asthma and comorbid GERD ± obesity
2. Determine the relationship between overweight/obesity and GERD as determinants of poor asthma control
Rationale • Apparent link between obesity and asthma • Positive correlation BMI and development of asthma. • GERD is a risk factor for asthma and shares common
pathophysiologic mechanisms that lead to worsening of asthma symptoms, including mechanical effects and local and systemic anti-inflammatory effects.
• High BMI and GERD may impair asthma control through: – Obeisty: systemic inflammation, modified lung mechanics – GERD: increased airways inflammation which could be associated with more distal inflammation
Outputs from the research • Hypothesis testing: contribute to the evidence for the
presence and potential management implications of distal airway inflammation in patients with asthma ± excess weight ± GERD
• Informing targeted management options: inform management decisions in patients with comorbid asthma, GERD and obesity
• Research dissemination: Respiratory conference abstract & open access peer review journal publication
Proposed methodology Design: 2-year observational matched cohort study study: 1 baseline year; an index date at which patients initiate or step-up ICS therapy; 1 outcome year Population: adult asthma patients (i) Population A: initiating and (ii) Population B: stepping up asthma maintenance therapy as extra-fine vs non extra-fine ICS will be matched on key baseline characteristics (age, sex, exacerbations, BMI, comorbid GERD) A priori subgroups: (i) asthma only; (ii) asthma+GERD; (iii) asthma+obesity; (iv) asthma+obesity+ GERD Outcomes: database measures of asthma control, acute respiratory events and asthma exacerbation rates.
Asthma & GERD±Obesity Research Concept
Proposed by Nicolas Roche; May 2015 Asthma, GERD, Obesity & extra-fine particle ICS
Therapeutic area(s)

Working title Implications of inhaled corticosteroid particle size in the management of patients with a mixed asthma-COPD phenotype
Objective 1. Evaluate the comparative effectiveness of
extra-fine and non extra-fine inhaled corticosteroid treatment in patients with ACO (vs asthma vs COPD)
2. Evaluate the consistency of outcomes across different research definitions of ACO
Rationale • Patients with an apparently mixed asthma–COPD
phenotype (ACO) have distinct characteristics of each condition and characteristics common to both.
• Some of the differences in the pathophysiological mechanisms present in asthma and COPD, may be attributed to the differential involvement of the distal airways.
• The distal airways may present a marker of likely ICS therapy response clinical target to optimise outcomes in patients with ACO
Outputs from the research • Improve understanding: of the respective involvement of
distal airways across OLD conditions: asthma, COPD, ACOS (and sub-categories of ACOS)
• Informing targeted management options: inform ICS management decisions in patients with a mixed asthma-COPD phenotype
• Research dissemination: Respiratory conference abstract & open access peer review journal publication
Proposed methodology Design: 2-year observational matched cohort study study: 1 baseline year; an index date at which patients initiate or step-up ICS therapy; 1 outcome year
Population: ACO patients (i) Population A: initiating and (ii) Population B: stepping up asthma maintenance therapy as extra-fine vs non extra-fine ICS will be matched on key baseline characteristics (age, sex, acute respiratory event rate, ICS dose and OLD diagnosis)
A priori subgroups: (i) asthma only; (ii) COPD; (iii) asthma+COPD; repeat in different operationalisable definitions of ACO (defined by the REG ACO Working Group)
Outcomes: database measures of OLD control, acute respiratory events and OLD exacerbation rates.
ACO Research Concept
Proposed by Nicolas Roche; May 2015 Asthma, COPD & extra-fine particle ICS
Therapeutic area(s)

OSCILLOMETRY – FOT STUDY
RON DANDURAND
16. 50–17.00PM

STANDARDIZATION OF FOT RESULTS ACROSS ALL FIVE COMMERCIALLY MARKETED DEVICES
Ron Dandurand 16. 50–17.00PM

Background
• Small airways are an important site of pathophysiology in obstructive lung diseases.
• Therapeutic targeting of the small airways is desirable.
• Easy bedside/clinic technique to evaluate the small airways remains elusive.
• FOT potentially, may fill this need.

Background

Background
• Small amplitude, subsonic, high frequency pressure waves i.e. infrasound applied at the mouth.
• Acoustic energy absorption estimates lung mechanics.
• Leverages infrasound’s frequency dependence of lung penetration.
• Localizes site of airflow limitation to small or large airways.

FOT is Rhino Talk
20-20,000Hz300-3000Hz 5-75Hz
Infrasoundreceiver

5 Commercial Devices
tremoFloiOSQuarki2m
MostGraph-02ResmonPro

McGill U Health Centre FOT Unit

McGill U Health Centre FOT Unit
McFOTU

McGill U Health Centre FOT Unit

McGill U Health Centre FOT Unit

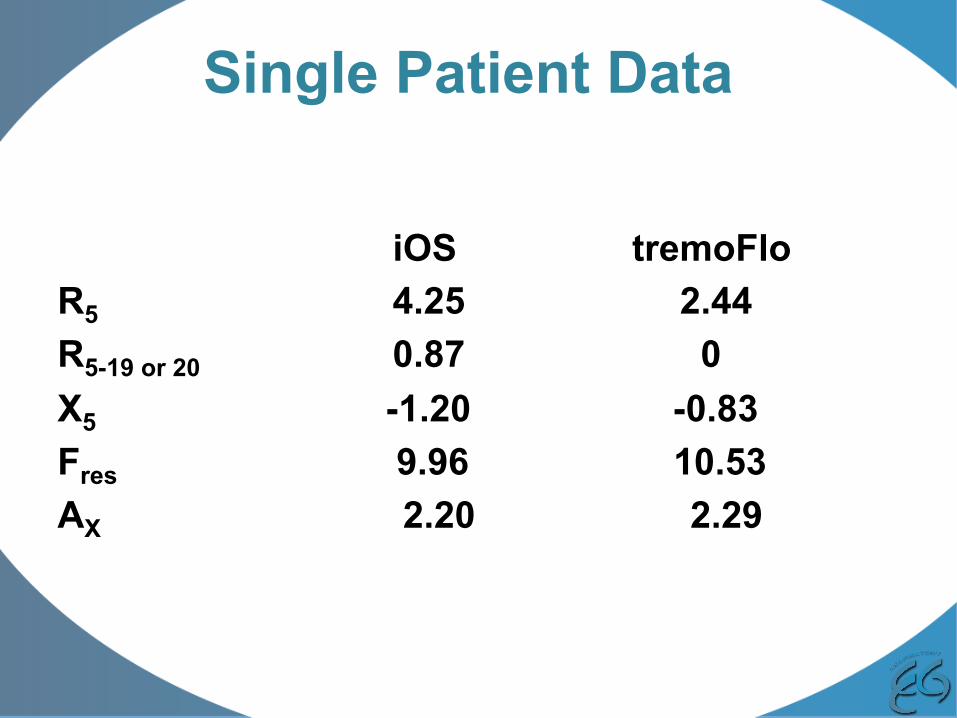
Single Patient Data
iOS tremoFlo R5 4.25 2.44 R5-19 or 20 0.87 0 X5 -1.20 -0.83 Fres 9.96 10.53 AX 2.20 2.29
Single Patient Data
iOS tremoFlo R5 4.25 2.44 R5-19 or 20 0.87 0 X5 -1.20 -0.83 Fres 9.96 10.53 AX 2.20 2.29

Single Patient Data
iOS tremoFlo R5 4.25 2.44 R5-19 or 20 0.87 0 X5 -1.20 -0.83 Fres 9.96 10.53 AX 2.20 2.29
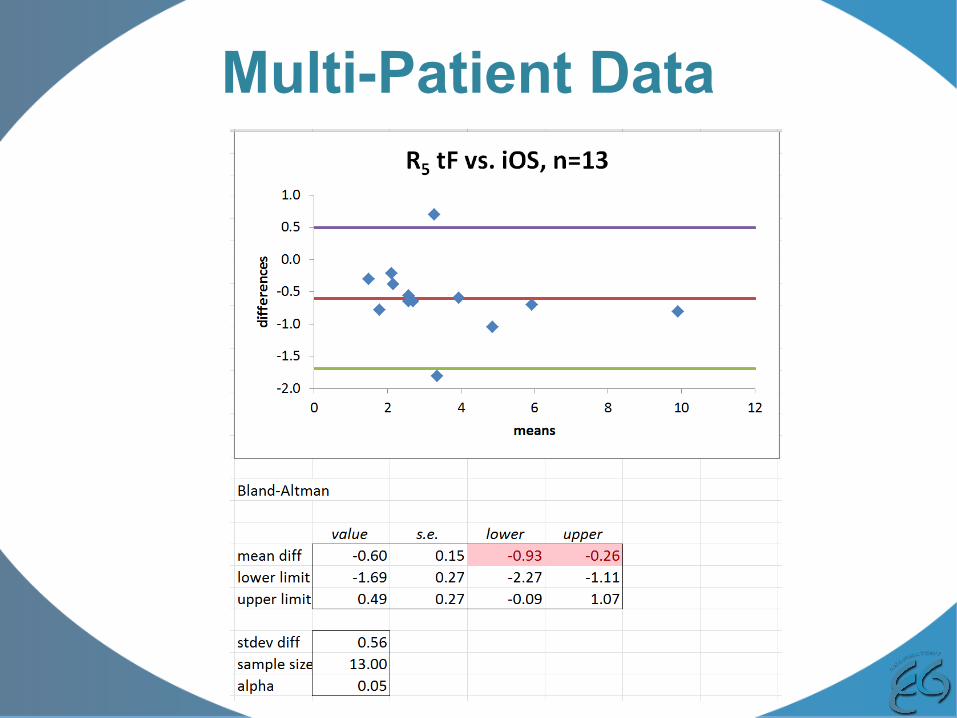
Multi-Patient Data

Bland-Altman Matrix
i2m
MG
tF
iOS
RM i2m MG tF

Bland-Altman Matrix
i2m
MG
tF
iOS
RM i2m MG tF
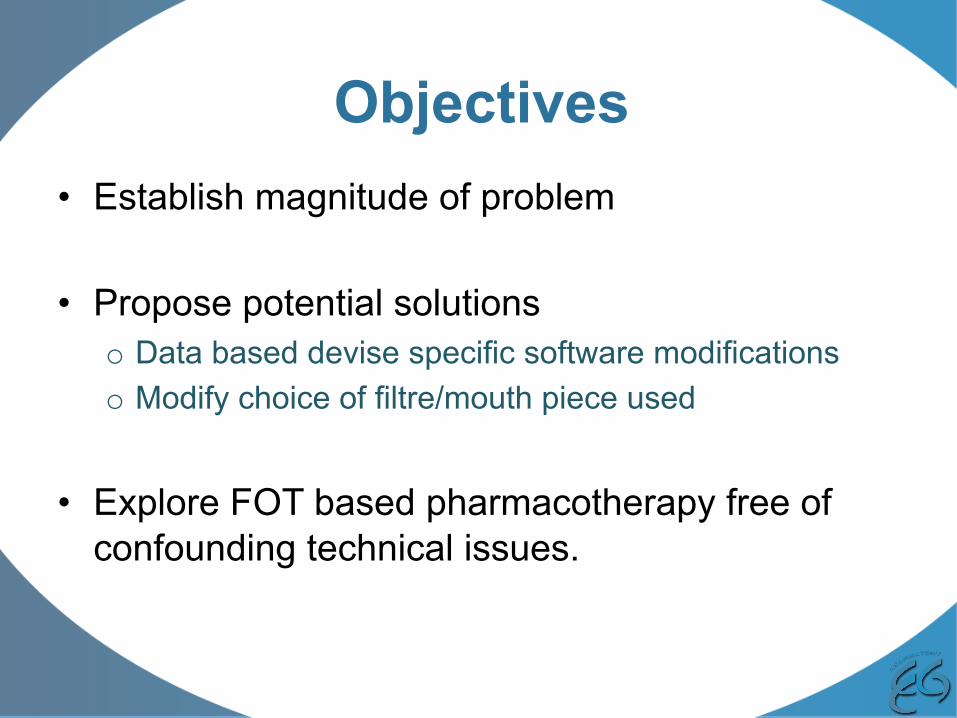
Objectives • Establish magnitude of problem
• Propose potential solutions o Data based devise specific software modifications o Modify choice of filtre/mouth piece used
• Explore FOT based pharmacotherapy free of
confounding technical issues.
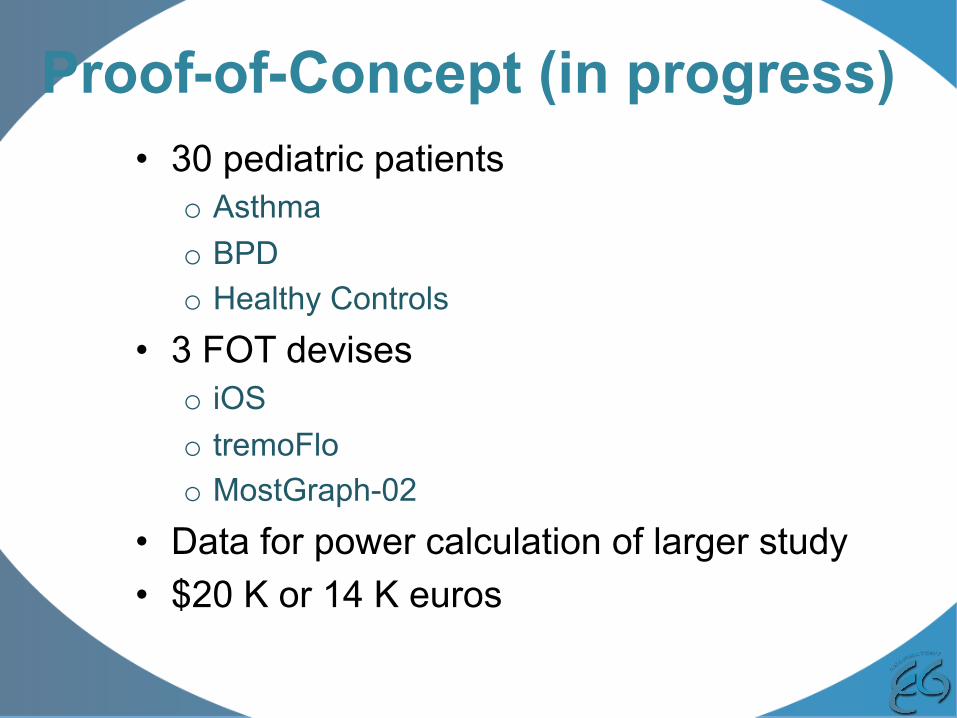
Proof-of-Concept (in progress) • 30 pediatric patients
o Asthma o BPD o Healthy Controls
• 3 FOT devises o iOS o tremoFlo o MostGraph-02
• Data for power calculation of larger study • $20 K or 14 K euros
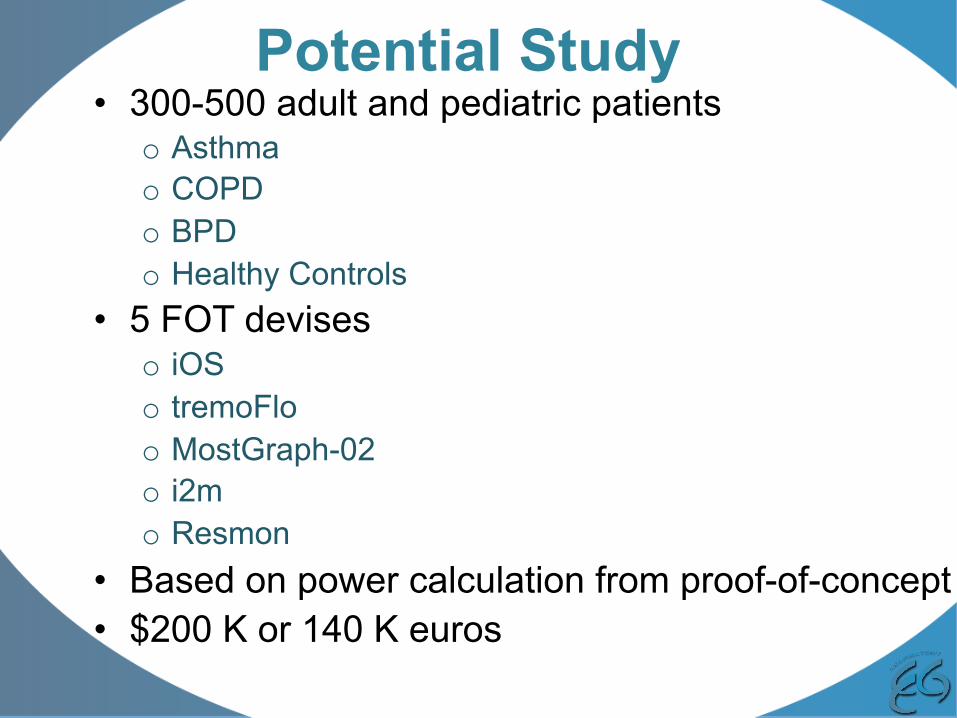
Potential Study • 300-500 adult and pediatric patients
o Asthma o COPD o BPD o Healthy Controls
• 5 FOT devises o iOS o tremoFlo o MostGraph-02 o i2m o Resmon
• Based on power calculation from proof-of-concept • $200 K or 140 K euros

Discussion
• Questions
• Study design suggestions
• Potential sources of funding
• Are other similar initiatives in progress?