Embed Size (px)
Citation preview
2015 National Payor Survey
M AY 2 0 1 5
2015 PayerView® Payer Rankings

Brandon Edwards CEO
ReviveHealth thinkrevivehealth.com
Dan Prince President
Catalyst Healthcare Research catalysthcr.com
Laurie Graham Payer Operations Manager
athenahealth athenahealth.com
2015 PayerView® athenahealth Inc. Payer Rankings
May 19, 2015

3,900 employees $595 million in revenue
9 locations
59,000 medical providers $11.7 billion in client collections
98 medical specialties
Introduction

athenahealth is a company with tremendous purpose
PayerView looks under the hood at payer performance on the athena network
4
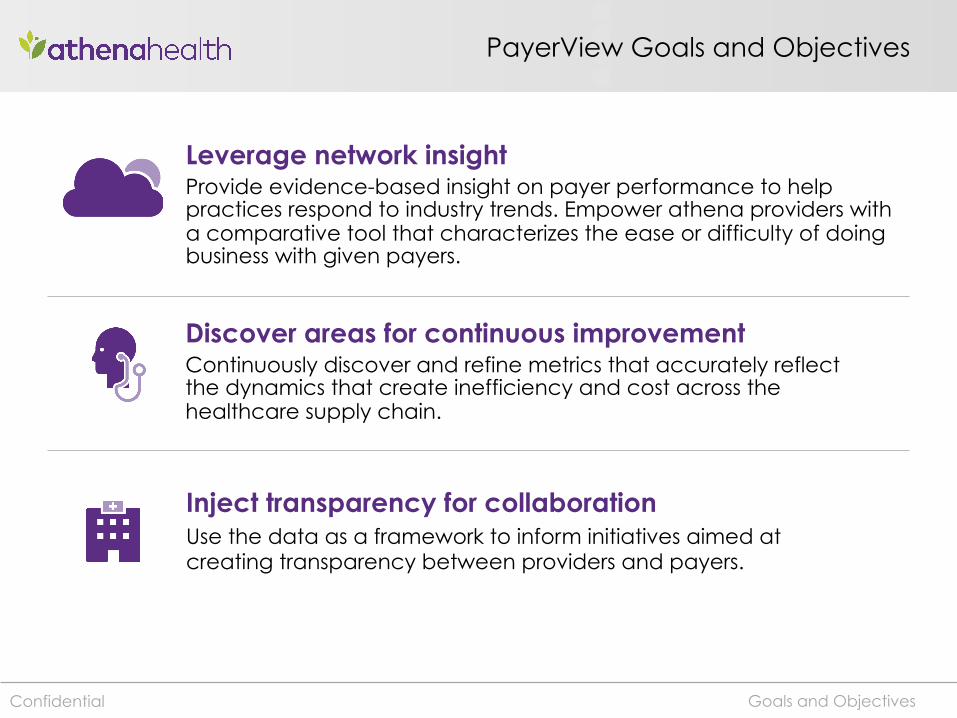
PayerView Goals and Objectives
Leverage network insight Provide evidence-based insight on payer performance to help practices respond to industry trends. Empower athena providers with a comparative tool that characterizes the ease or difficulty of doing business with given payers.
Discover areas for continuous improvement Continuously discover and refine metrics that accurately reflect the dynamics that create inefficiency and cost across the healthcare supply chain.
Inject transparency for collaboration Use the data as a framework to inform initiatives aimed at creating transparency between providers and payers.
Goals and Objectives Confidential
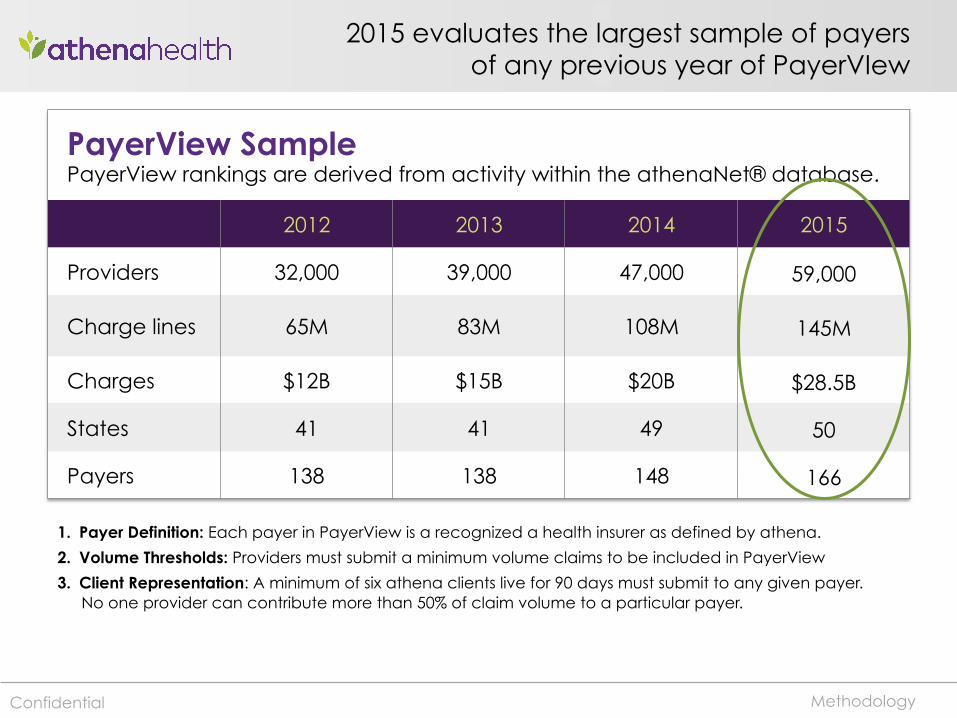
2015 evaluates the largest sample of payers of any previous year of PayerVIew
PayerView Sample PayerView rankings are derived from activity within the athenaNet® database.
2012 2013 2014 2015
Providers 32,000 39,000 47,000 59,000
Charge lines 65M 83M 108M 145M
Charges $12B $15B $20B $28.5B
States 41 41 49 50
Payers 138 138 148 166
Methodology
1. Payer Definition: Each payer in PayerView is a recognized a health insurer as defined by athena.
2. Volume Thresholds: Providers must submit a minimum volume claims to be included in PayerView
3. Client Representation: A minimum of six athena clients live for 90 days must submit to any given payer. No one provider can contribute more than 50% of claim volume to a particular payer.
Confidential
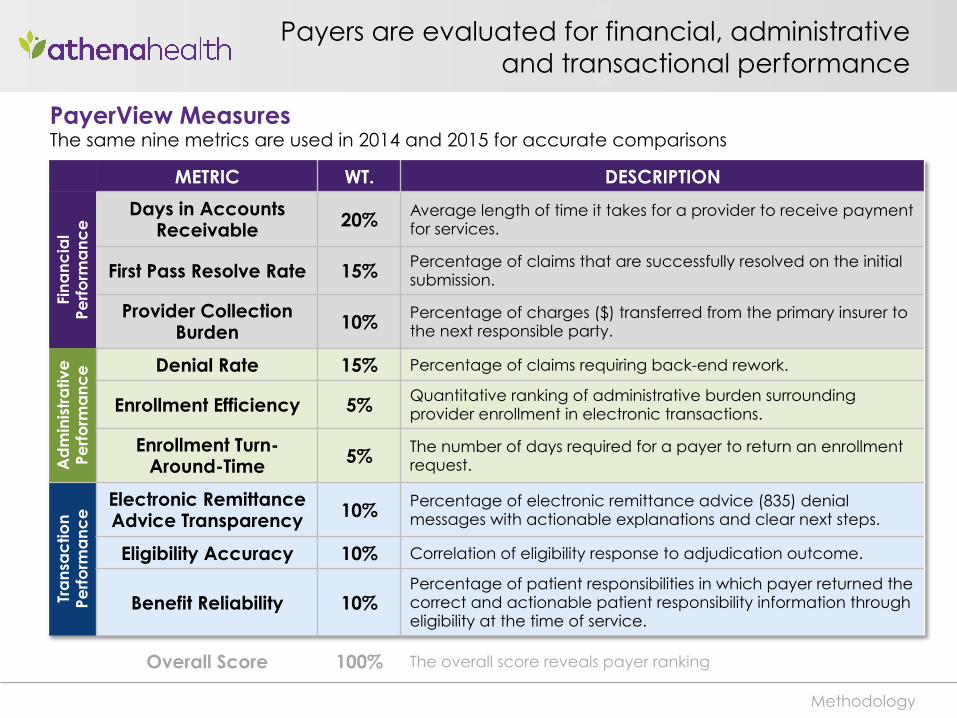
Payers are evaluated for financial, administrative and transactional performance
METRIC WT. DESCRIPTION
Fina
ncia
l Pe
rform
anc
e Days in Accounts
Receivable 20% Average length of time it takes for a provider to receive payment for services.
First Pass Resolve Rate 15% Percentage of claims that are successfully resolved on the initial submission.
Provider Collection Burden 10% Percentage of charges ($) transferred from the primary insurer to
the next responsible party.
Ad
min
istr
ativ
e
Perfo
rma
nce
Denial Rate 15% Percentage of claims requiring back-end rework.
Enrollment Efficiency 5% Quantitative ranking of administrative burden surrounding provider enrollment in electronic transactions.
Enrollment Turn-Around-Time 5% The number of days required for a payer to return an enrollment
request.
Tra
nsa
ctio
n Pe
rform
anc
e Electronic Remittance
Advice Transparency 10% Percentage of electronic remittance advice (835) denial messages with actionable explanations and clear next steps.
Eligibility Accuracy 10% Correlation of eligibility response to adjudication outcome.
Benefit Reliability 10% Percentage of patient responsibilities in which payer returned the correct and actionable patient responsibility information through eligibility at the time of service.
Overall Score 100% The overall score reveals payer ranking
Methodology
PayerView Measures The same nine metrics are used in 2014 and 2015 for accurate comparisons

2015 Rankings
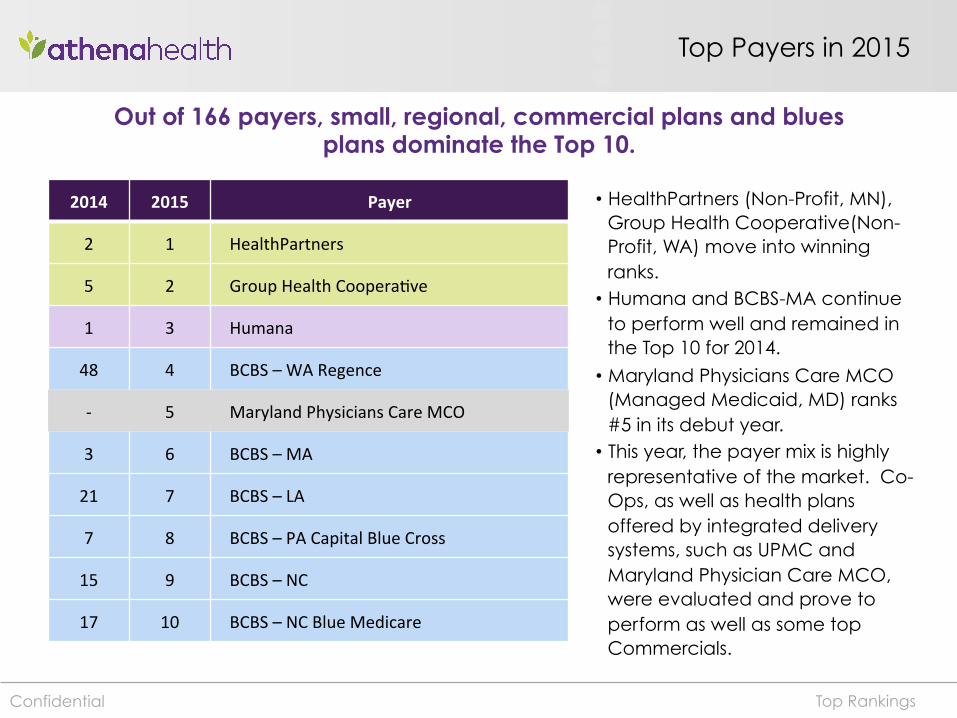
Top Payers in 2015
2014 2015 Payer
2 1 HealthPartners
5 2 Group Health Coopera4ve
1 3 Humana
48 4 BCBS – WA Regence
-‐ 5 Maryland Physicians Care MCO
3 6 BCBS – MA
21 7 BCBS – LA
7 8 BCBS – PA Capital Blue Cross
15 9 BCBS – NC
17 10 BCBS – NC Blue Medicare
Top Rankings
Out of 166 payers, small, regional, commercial plans and blues plans dominate the Top 10.
• HealthPartners (Non-Profit, MN), Group Health Cooperative(Non-Profit, WA) move into winning ranks. • Humana and BCBS-MA continue
to perform well and remained in the Top 10 for 2014.
• Maryland Physicians Care MCO (Managed Medicaid, MD) ranks #5 in its debut year. • This year, the payer mix is highly
representative of the market. Co-Ops, as well as health plans offered by integrated delivery systems, such as UPMC and Maryland Physician Care MCO, were evaluated and prove to perform as well as some top Commercials.
Confidential
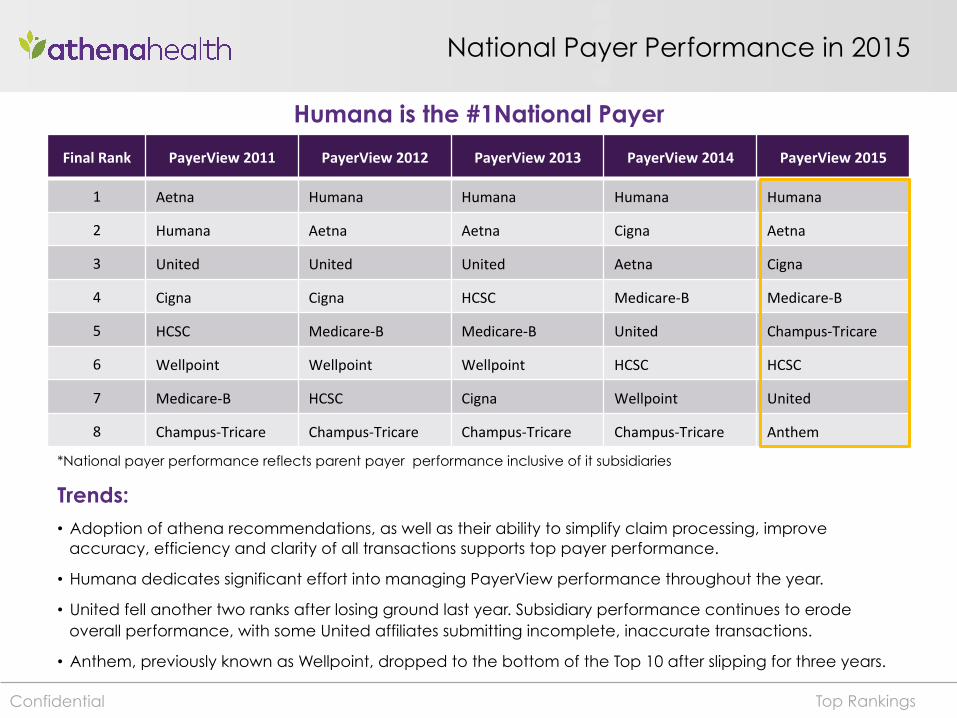
National Payer Performance in 2015
Final Rank PayerView 2011 PayerView 2012 PayerView 2013 PayerView 2014 PayerView 2015
1 Aetna Humana Humana Humana Humana
2 Humana Aetna Aetna Cigna Aetna
3 United United United Aetna Cigna
4 Cigna Cigna HCSC Medicare-‐B Medicare-‐B
5 HCSC Medicare-‐B Medicare-‐B United Champus-‐Tricare
6 Wellpoint Wellpoint Wellpoint HCSC HCSC
7 Medicare-‐B HCSC Cigna Wellpoint United
8 Champus-‐Tricare Champus-‐Tricare Champus-‐Tricare Champus-‐Tricare Anthem
Top Rankings
Humana is the #1National Payer
Trends: • Adoption of athena recommendations, as well as their ability to simplify claim processing, improve
accuracy, efficiency and clarity of all transactions supports top payer performance.
• Humana dedicates significant effort into managing PayerView performance throughout the year.
• United fell another two ranks after losing ground last year. Subsidiary performance continues to erode overall performance, with some United affiliates submitting incomplete, inaccurate transactions.
• Anthem, previously known as Wellpoint, dropped to the bottom of the Top 10 after slipping for three years.
Confidential
*National payer performance reflects parent payer performance inclusive of it subsidiaries
Key Findings
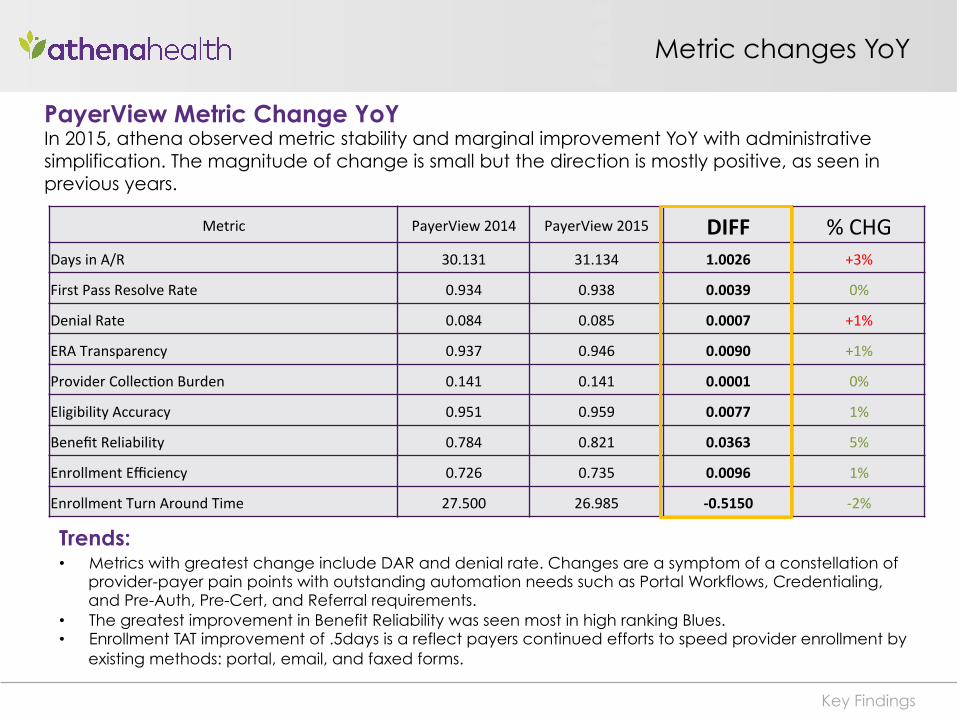
Metric PayerView 2014 PayerView 2015 DIFF % CHG Days in A/R 30.131 31.134 1.0026 +3%
First Pass Resolve Rate 0.934 0.938 0.0039 0%
Denial Rate 0.084 0.085 0.0007 +1%
ERA Transparency 0.937 0.946 0.0090 +1%
Provider Collec4on Burden 0.141 0.141 0.0001 0%
Eligibility Accuracy 0.951 0.959 0.0077 1%
Benefit Reliability 0.784 0.821 0.0363 5%
Enrollment Efficiency 0.726 0.735 0.0096 1%
Enrollment Turn Around Time 27.500 26.985 -‐0.5150 -‐2%
Metric changes YoY
PayerView Metric Change YoY In 2015, athena observed metric stability and marginal improvement YoY with administrative simplification. The magnitude of change is small but the direction is mostly positive, as seen in previous years.
Trends: • Metrics with greatest change include DAR and denial rate. Changes are a symptom of a constellation of
provider-payer pain points with outstanding automation needs such as Portal Workflows, Credentialing, and Pre-Auth, Pre-Cert, and Referral requirements.
• The greatest improvement in Benefit Reliability was seen most in high ranking Blues. • Enrollment TAT improvement of .5days is a reflect payers continued efforts to speed provider enrollment by
existing methods: portal, email, and faxed forms.
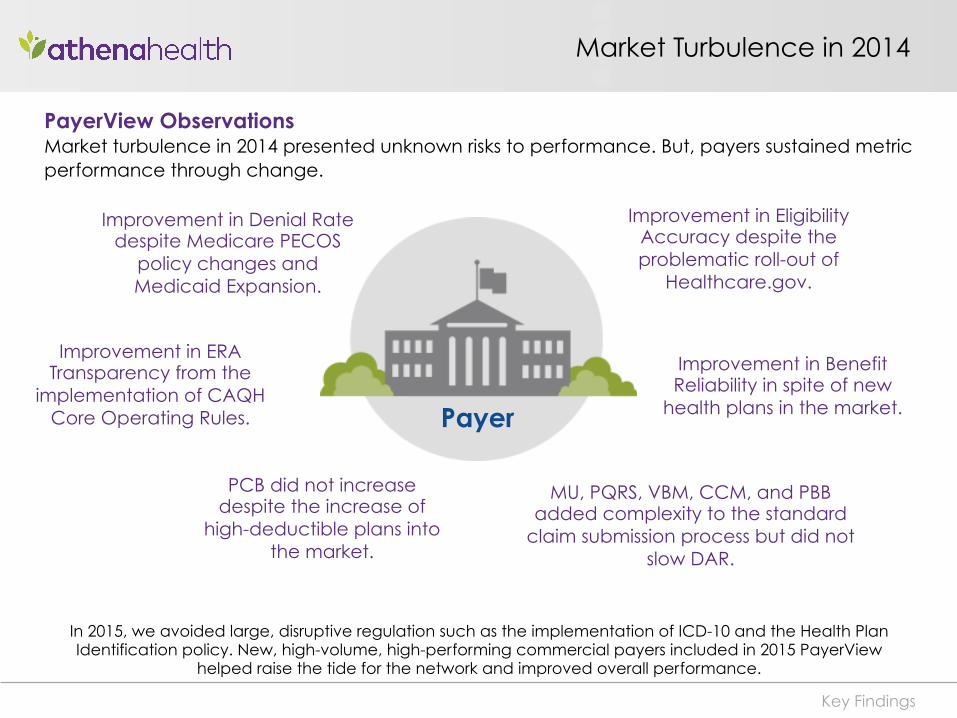
Market Turbulence in 2014
In 2015, we avoided large, disruptive regulation such as the implementation of ICD-10 and the Health Plan Identification policy. New, high-volume, high-performing commercial payers included in 2015 PayerView
helped raise the tide for the network and improved overall performance.
Improvement in Denial Rate despite Medicare PECOS
policy changes and Medicaid Expansion.
Improvement in ERA Transparency from the
implementation of CAQH Core Operating Rules.
Improvement in Eligibility Accuracy despite the problematic roll-out of
Healthcare.gov.
Key Findings
Payer
Improvement in Benefit Reliability in spite of new
health plans in the market.
PayerView Observations Market turbulence in 2014 presented unknown risks to performance. But, payers sustained metric performance through change.
PCB did not increase despite the increase of
high-deductible plans into the market.
MU, PQRS, VBM, CCM, and PBB added complexity to the standard
claim submission process but did not slow DAR.
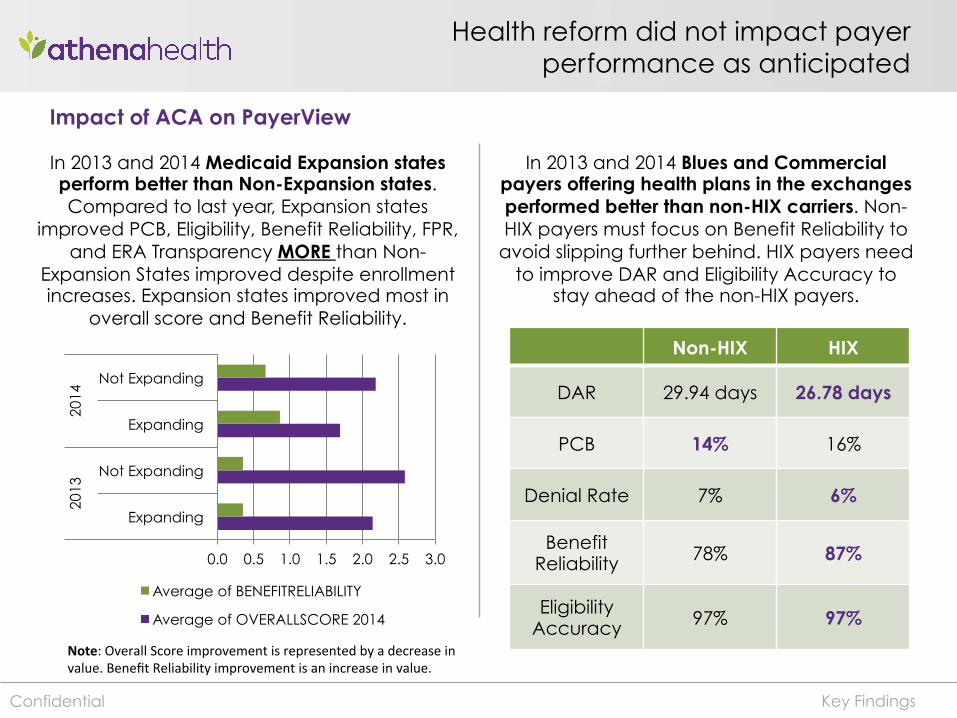
Health reform did not impact payer performance as anticipated
In 2013 and 2014 Medicaid Expansion states perform better than Non-Expansion states. Compared to last year, Expansion states
improved PCB, Eligibility, Benefit Reliability, FPR, and ERA Transparency MORE than Non-
Expansion States improved despite enrollment increases. Expansion states improved most in
overall score and Benefit Reliability.
In 2013 and 2014 Blues and Commercial payers offering health plans in the exchanges performed better than non-HIX carriers. Non-HIX payers must focus on Benefit Reliability to
avoid slipping further behind. HIX payers need to improve DAR and Eligibility Accuracy to
stay ahead of the non-HIX payers.
Non-HIX HIX
DAR 29.94 days 26.78 days
PCB 14% 16%
Denial Rate 7% 6%
Benefit Reliability 78% 87%
Eligibility Accuracy 97% 97%
Key Findings
0.0 0.5 1.0 1.5 2.0 2.5 3.0
Expanding
Not Expanding
Expanding
Not Expanding
2013
20
14
Average of BENEFITRELIABILITY
Average of OVERALLSCORE 2014
Note: Overall Score improvement is represented by a decrease in value. Benefit Reliability improvement is an increase in value.
Confidential
Impact of ACA on PayerView
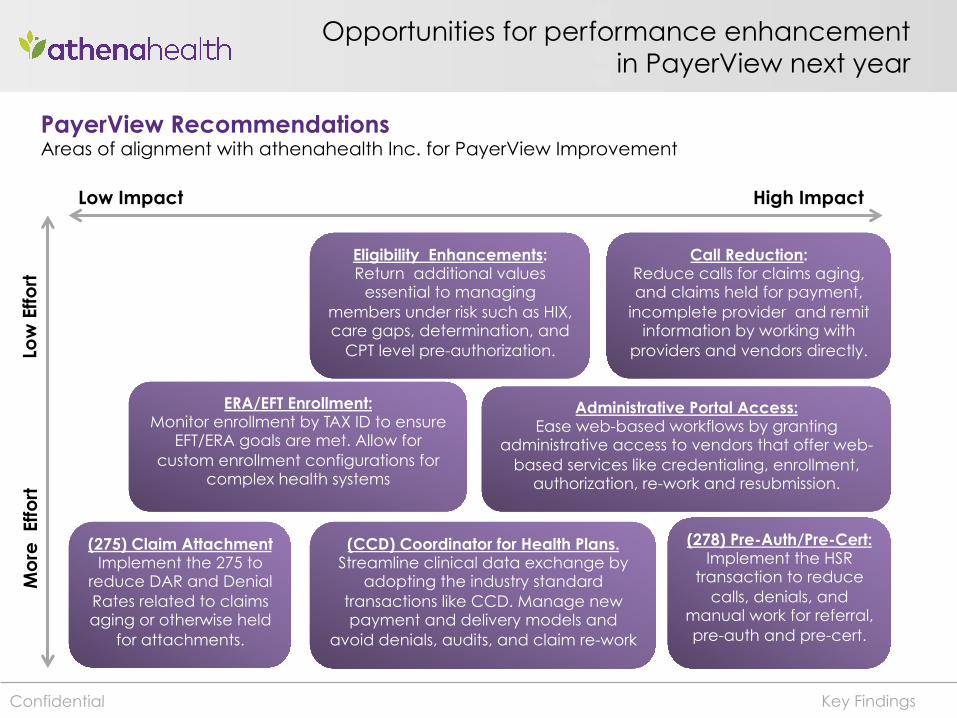
Opportunities for performance enhancement in PayerView next year
High Impact Low Impact
Administrative Portal Access: Ease web-based workflows by granting
administrative access to vendors that offer web-based services like credentialing, enrollment,
authorization, re-work and resubmission.
Eligibility Enhancements: Return additional values
essential to managing members under risk such as HIX, care gaps, determination, and
CPT level pre-authorization.
ERA/EFT Enrollment: Monitor enrollment by TAX ID to ensure
EFT/ERA goals are met. Allow for custom enrollment configurations for
complex health systems
(278) Pre-Auth/Pre-Cert: Implement the HSR
transaction to reduce calls, denials, and
manual work for referral, pre-auth and pre-cert.
Low
Effo
rt
Key Findings
(275) Claim Attachment Implement the 275 to
reduce DAR and Denial Rates related to claims aging or otherwise held
for attachments.
(CCD) Coordinator for Health Plans. Streamline clinical data exchange by
adopting the industry standard transactions like CCD. Manage new payment and delivery models and
avoid denials, audits, and claim re-work
Mo
re E
ffort
Confidential
PayerView Recommendations Areas of alignment with athenahealth Inc. for PayerView Improvement
Call Reduction: Reduce calls for claims aging, and claims held for payment,
incomplete provider and remit information by working with
providers and vendors directly.

15

2015 National Payor SurveyM AY 2 0 1 5
Prepared by:
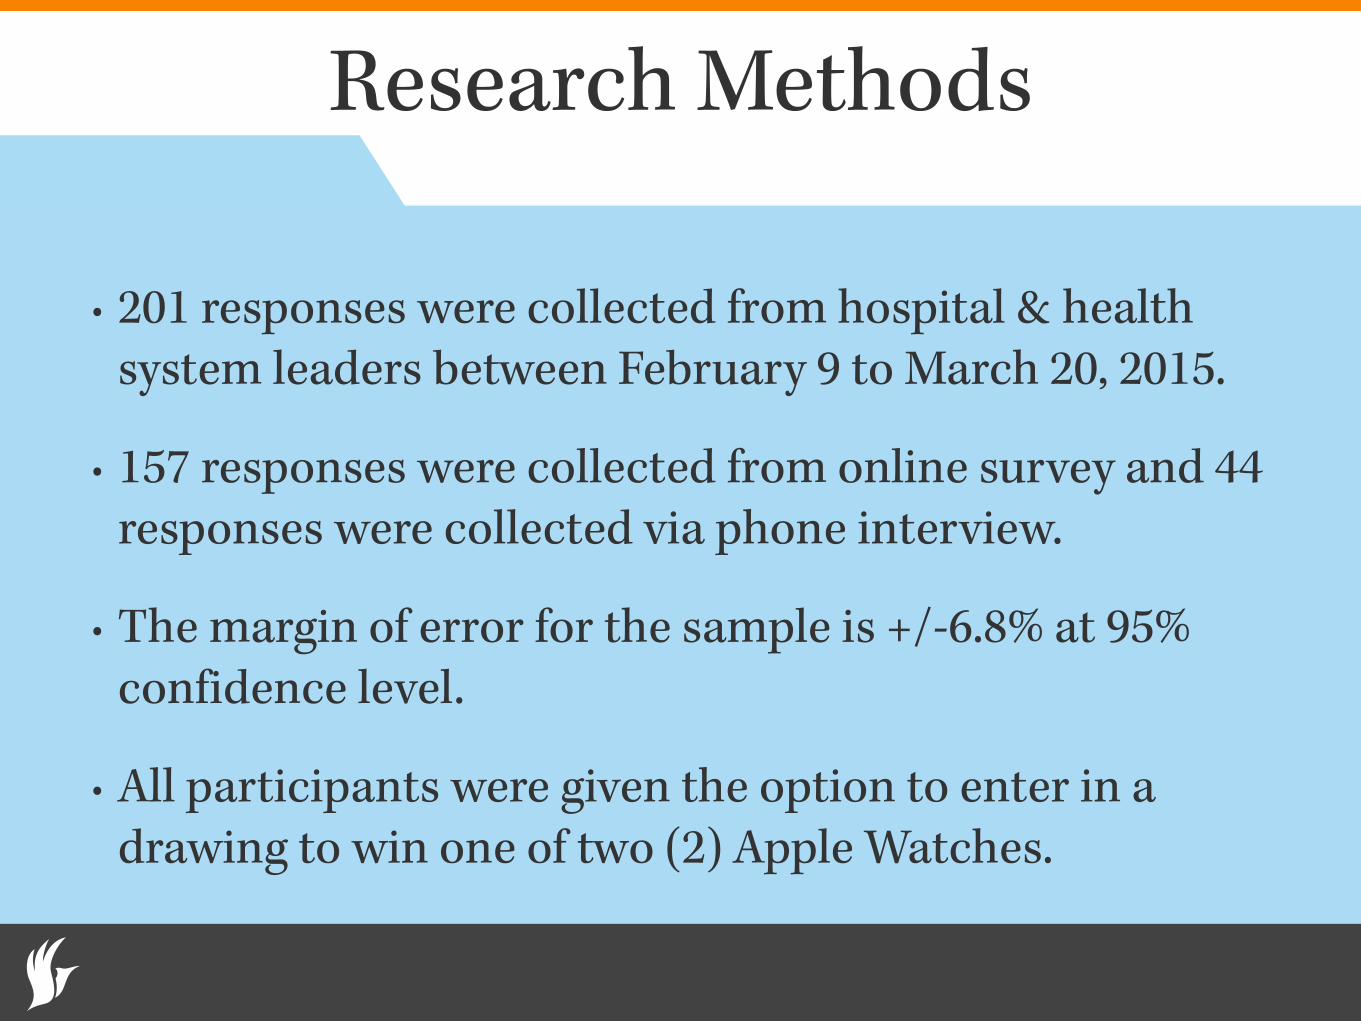
Research Methods
• 201 responses were collected from hospital & health system leaders between February 9 to March 20, 2015.
• 157 responses were collected from online survey and 44 responses were collected via phone interview.
• The margin of error for the sample is +/-6.8% at 95% confidence level.
• All participants were given the option to enter in a drawing to win one of two (2) Apple Watches.
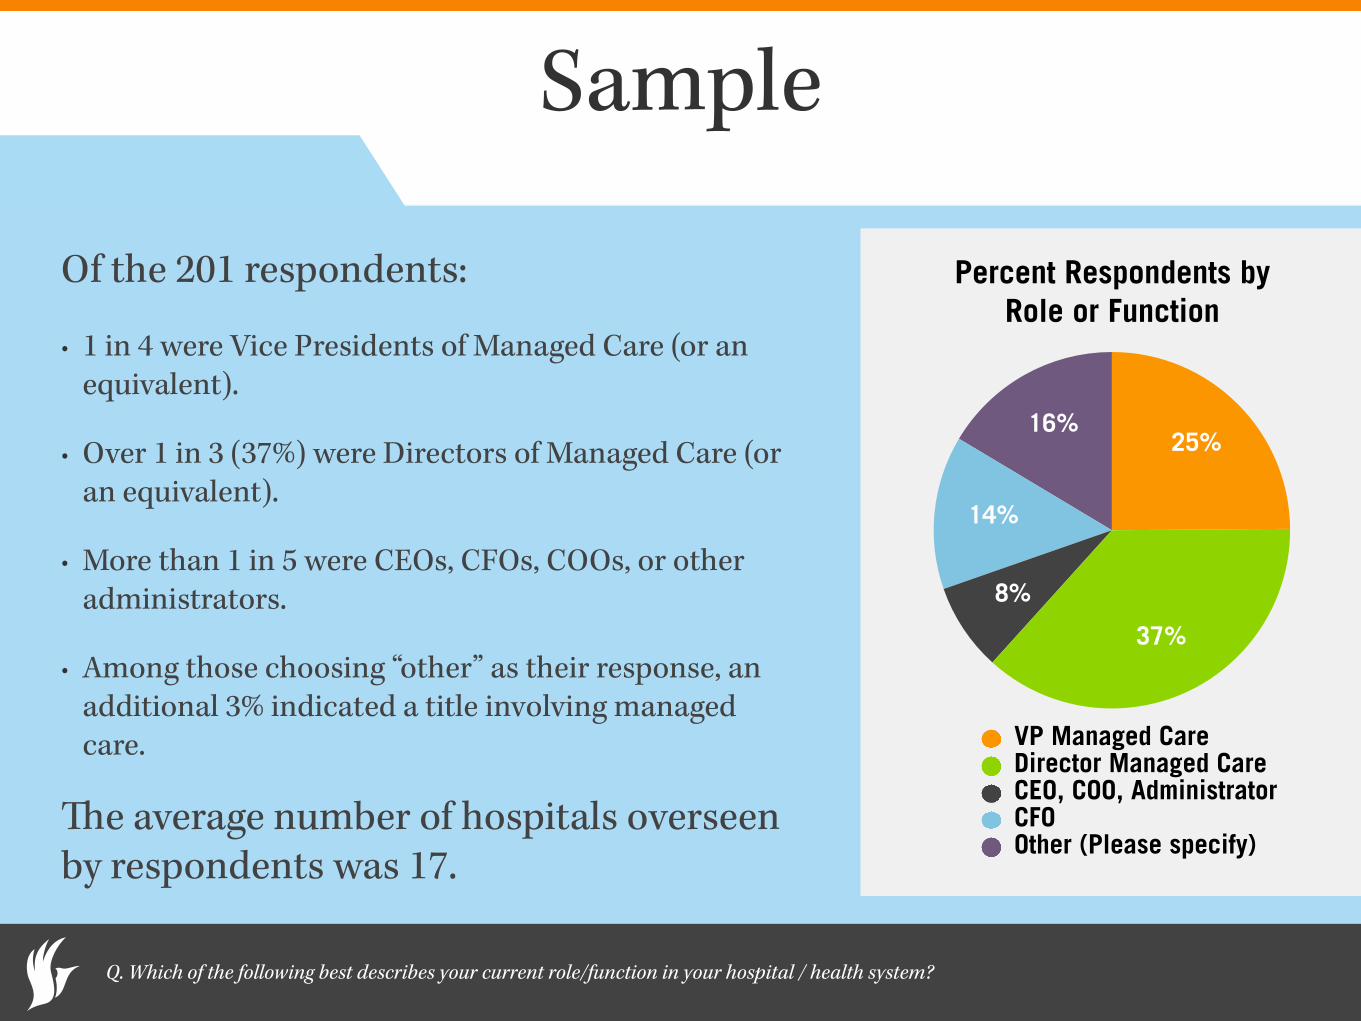
Sample
Of the 201 respondents:
• 1 in 4 were Vice Presidents of Managed Care (or an equivalent).
• Over 1 in 3 (37%) were Directors of Managed Care (or an equivalent).
• More than 1 in 5 were CEOs, CFOs, COOs, or other administrators.
• Among those choosing “other” as their response, an additional 3% indicated a title involving managed care.
The average number of hospitals overseen by respondents was 17.
Percent Respondents by Role or Function
16%
14%
8%
37%
25%
VP Managed CareDirector Managed CareCEO, COO, AdministratorCFOOther (Please specify)
Q. Which of the following best describes your current role/function in your hospital / health system?
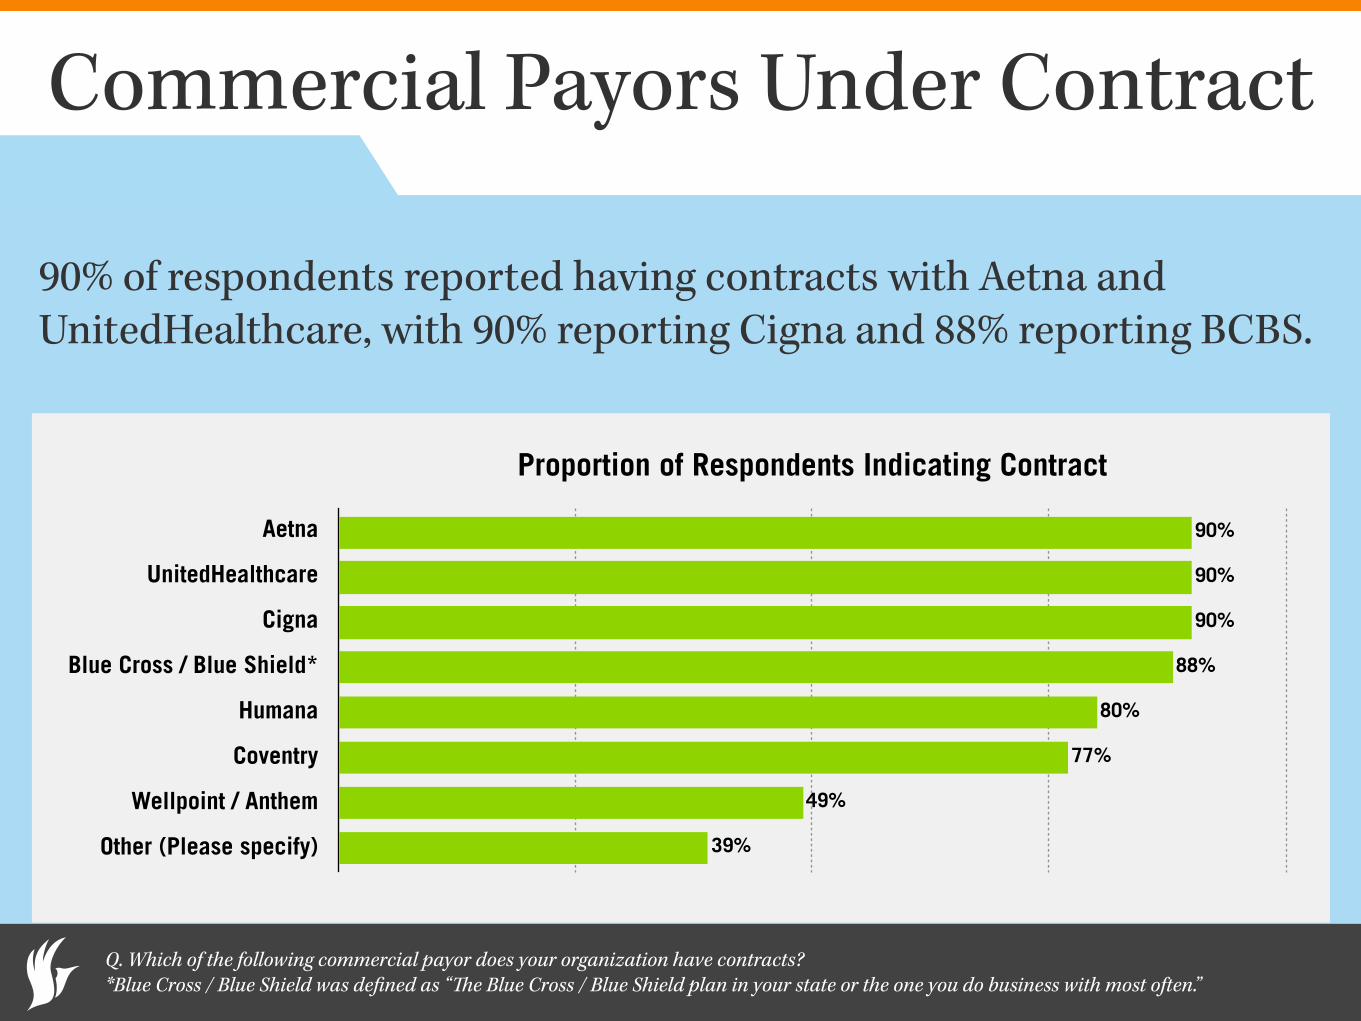
Commercial Payors Under Contract
90% of respondents reported having contracts with Aetna and UnitedHealthcare, with 90% reporting Cigna and 88% reporting BCBS.
Q. Which of the following commercial payor does your organization have contracts? *Blue Cross / Blue Shield was defined as “The Blue Cross / Blue Shield plan in your state or the one you do business with most often.”
Proportion of Respondents Indicating Contract
Aetna
UnitedHealthcare
Cigna
Blue Cross / Blue Shield*
Humana
Coventry
Wellpoint / Anthem
Other (Please specify) 39%
49%
77%
80%
88%
90%
90%
90%
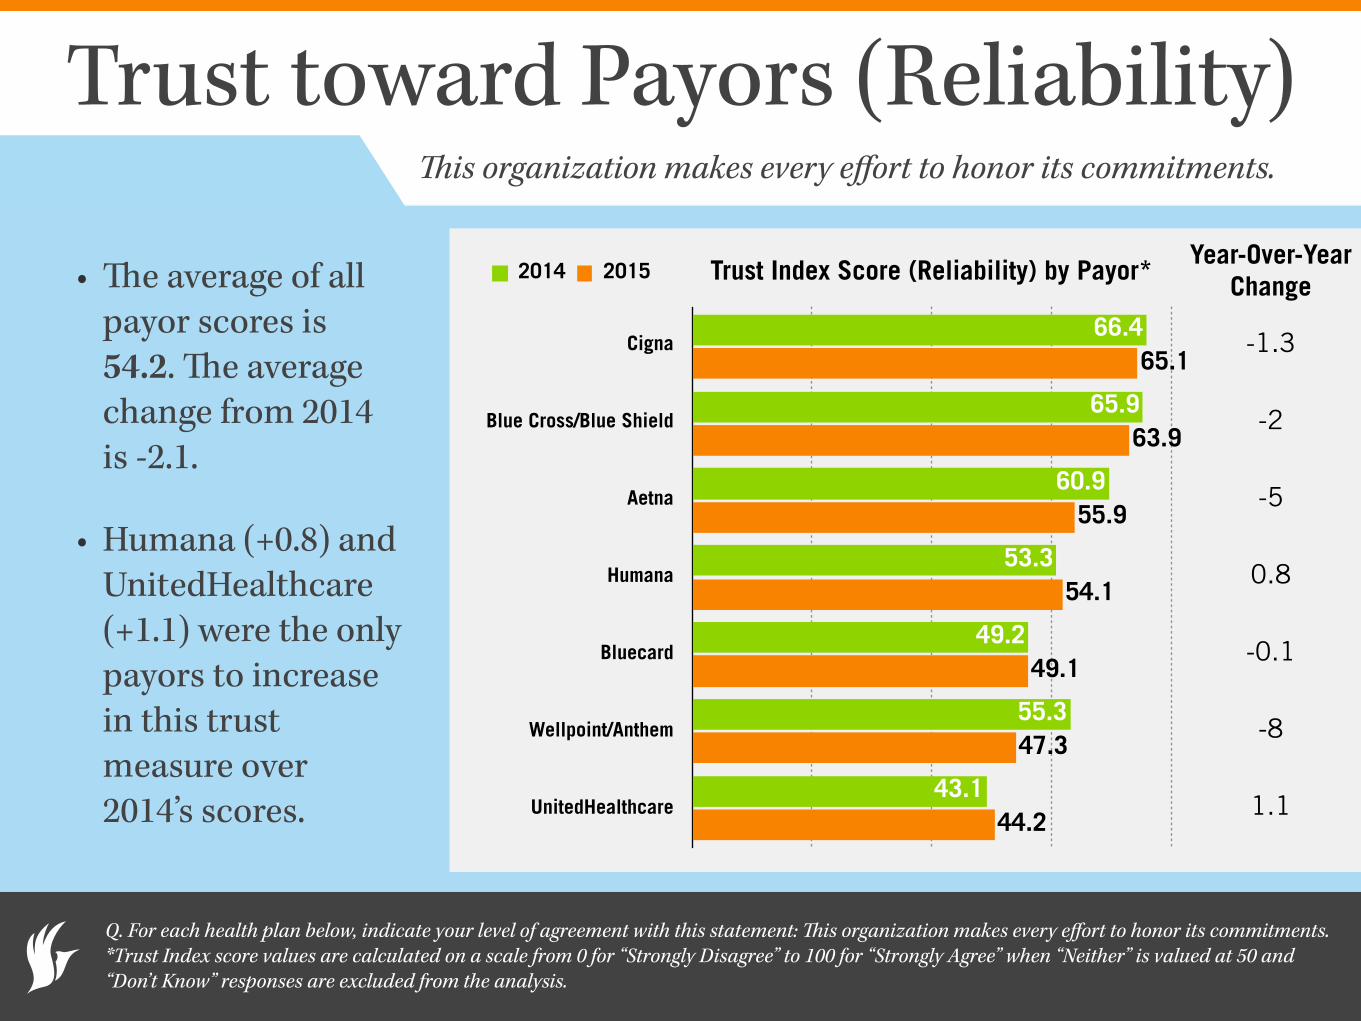
Trust toward Payors (Reliability)
• The average of all payor scores is 54.2. The average change from 2014 is -2.1.
• Humana (+0.8) and UnitedHealthcare (+1.1) were the only payors to increase in this trust measure over 2014’s scores.
Q. For each health plan below, indicate your level of agreement with this statement: This organization makes every effort to honor its commitments. *Trust Index score values are calculated on a scale from 0 for “Strongly Disagree” to 100 for “Strongly Agree” when “Neither” is valued at 50 and “Don’t Know” responses are excluded from the analysis.
Trust Index Score (Reliability) by Payor*
Cigna
Blue Cross/Blue Shield
Aetna
Humana
Bluecard
Wellpoint/Anthem
UnitedHealthcare44.2
47.3
49.1
54.1
55.9
63.9
65.1
43.1
55.3
49.2
53.3
60.9
65.9
66.4
2014 2015
This organization makes every effort to honor its commitments.
-1.3
-2
-5
0.8
-0.1
-8
1.1
Year-Over-Year Change
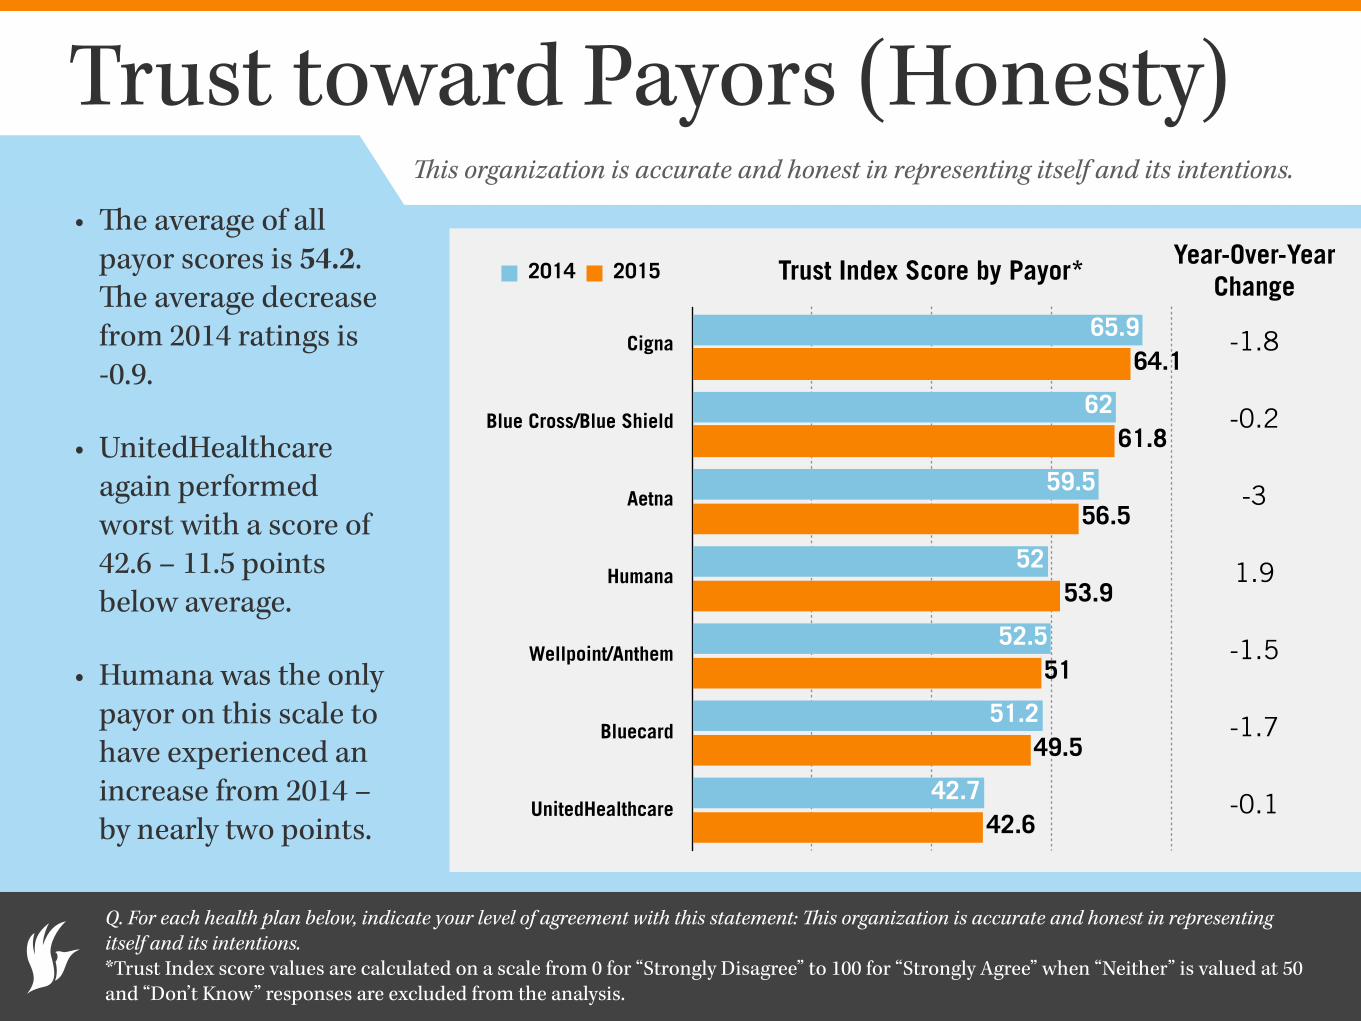
Trust toward Payors (Honesty)• The average of all
payor scores is 54.2. The average decrease from 2014 ratings is -0.9.
• UnitedHealthcare again performed worst with a score of 42.6 – 11.5 points below average.
• Humana was the only payor on this scale to have experienced an increase from 2014 – by nearly two points.
Q. For each health plan below, indicate your level of agreement with this statement: This organization is accurate and honest in representing itself and its intentions. *Trust Index score values are calculated on a scale from 0 for “Strongly Disagree” to 100 for “Strongly Agree” when “Neither” is valued at 50 and “Don’t Know” responses are excluded from the analysis.
Trust Index Score by Payor*
Cigna
Blue Cross/Blue Shield
Aetna
Humana
Wellpoint/Anthem
Bluecard
UnitedHealthcare42.6
49.5
51
53.9
56.5
61.8
64.1
42.7
51.2
52.5
52
59.5
62
65.9
2014 2015
This organization is accurate and honest in representing itself and its intentions.
Year-Over-Year Change
-1.8
-0.2
-3
1.9
-1.5
-1.7
-0.1
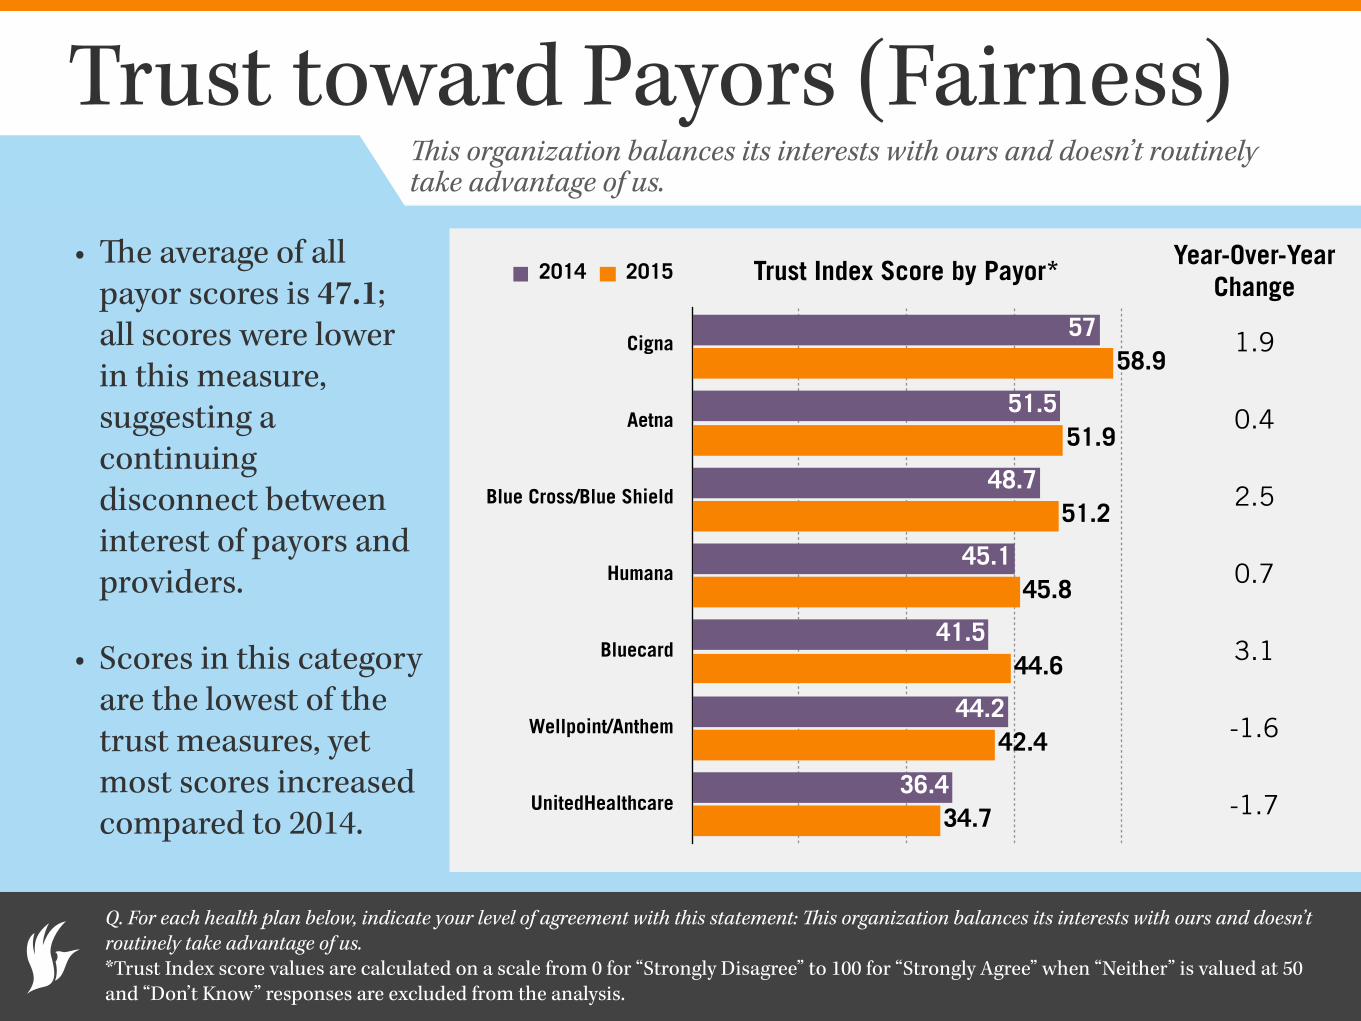
Trust toward Payors (Fairness)
• The average of all payor scores is 47.1; all scores were lower in this measure, suggesting a continuing disconnect between interest of payors and providers.
• Scores in this category are the lowest of the trust measures, yet most scores increased compared to 2014.
Q. For each health plan below, indicate your level of agreement with this statement: This organization balances its interests with ours and doesn’t routinely take advantage of us. *Trust Index score values are calculated on a scale from 0 for “Strongly Disagree” to 100 for “Strongly Agree” when “Neither” is valued at 50 and “Don’t Know” responses are excluded from the analysis.
Trust Index Score by Payor*
Cigna
Aetna
Blue Cross/Blue Shield
Humana
Bluecard
Wellpoint/Anthem
UnitedHealthcare34.7
42.4
44.6
45.8
51.2
51.9
58.9
36.4
44.2
41.5
45.1
48.7
51.5
57
2014 2015
This organization balances its interests with ours and doesn’t routinely take advantage of us.
1.9
0.4
2.5
0.7
3.1
-1.6
-1.7
Year-Over-Year Change
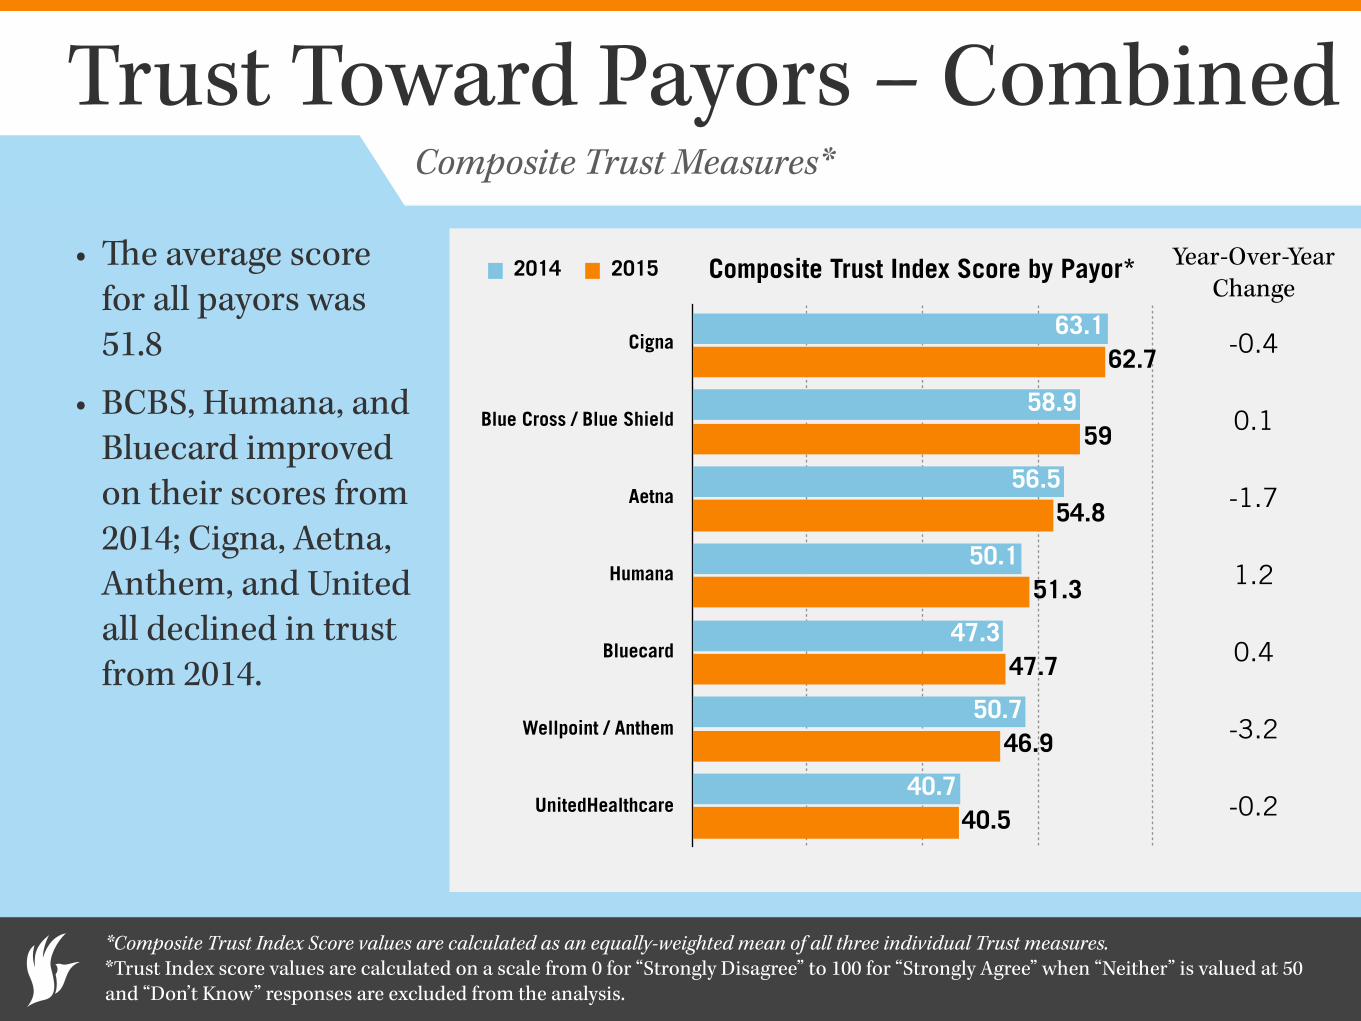
Trust Toward Payors – Combined
• The average score for all payors was 51.8
• BCBS, Humana, and Bluecard improved on their scores from 2014; Cigna, Aetna, Anthem, and United all declined in trust from 2014.
*Composite Trust Index Score values are calculated as an equally-weighted mean of all three individual Trust measures. *Trust Index score values are calculated on a scale from 0 for “Strongly Disagree” to 100 for “Strongly Agree” when “Neither” is valued at 50 and “Don’t Know” responses are excluded from the analysis.
Composite Trust Index Score by Payor*
Cigna
Blue Cross / Blue Shield
Aetna
Humana
Bluecard
Wellpoint / Anthem
UnitedHealthcare40.5
46.9
47.7
51.3
54.8
59
62.7
40.7
50.7
47.3
50.1
56.5
58.9
63.1
2014 2015
Composite Trust Measures*
-0.4
0.1
-1.7
1.2
0.4
-3.2
-0.2
Year-Over-Year Change
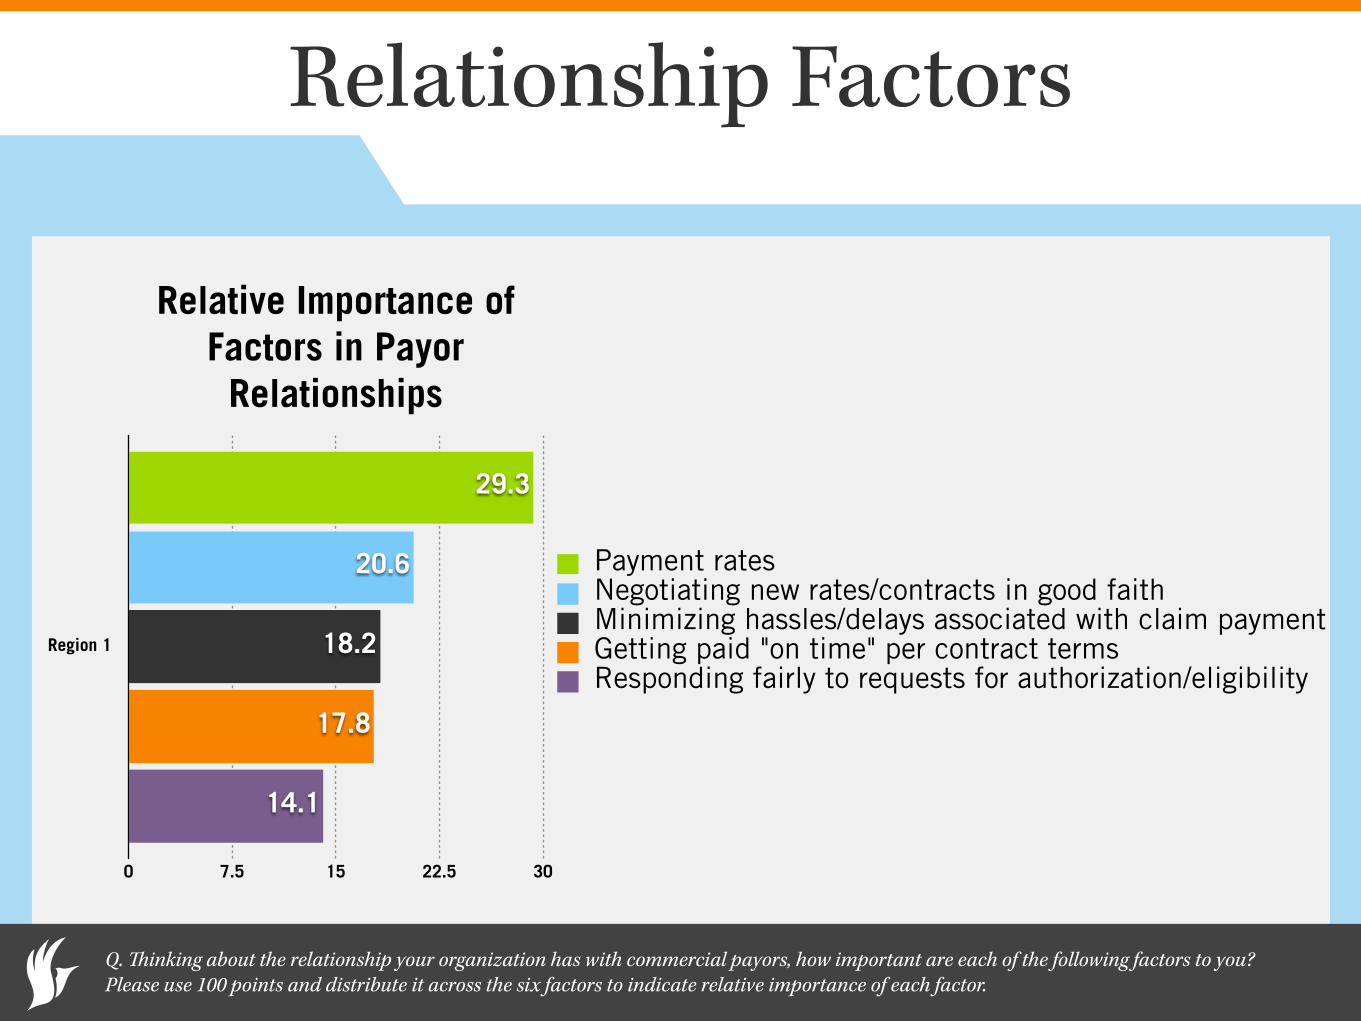
Relationship Factors
Q. Thinking about the relationship your organization has with commercial payors, how important are each of the following factors to you? Please use 100 points and distribute it across the six factors to indicate relative importance of each factor.
Relative Importance of Factors in Payor Relationships
Region 1
0 7.5 15 22.5 30
14.1
17.8
18.2
20.6
29.3
Payment ratesNegotiating new rates/contracts in good faithMinimizing hassles/delays associated with claim paymentGetting paid "on time" per contract termsResponding fairly to requests for authorization/eligibility
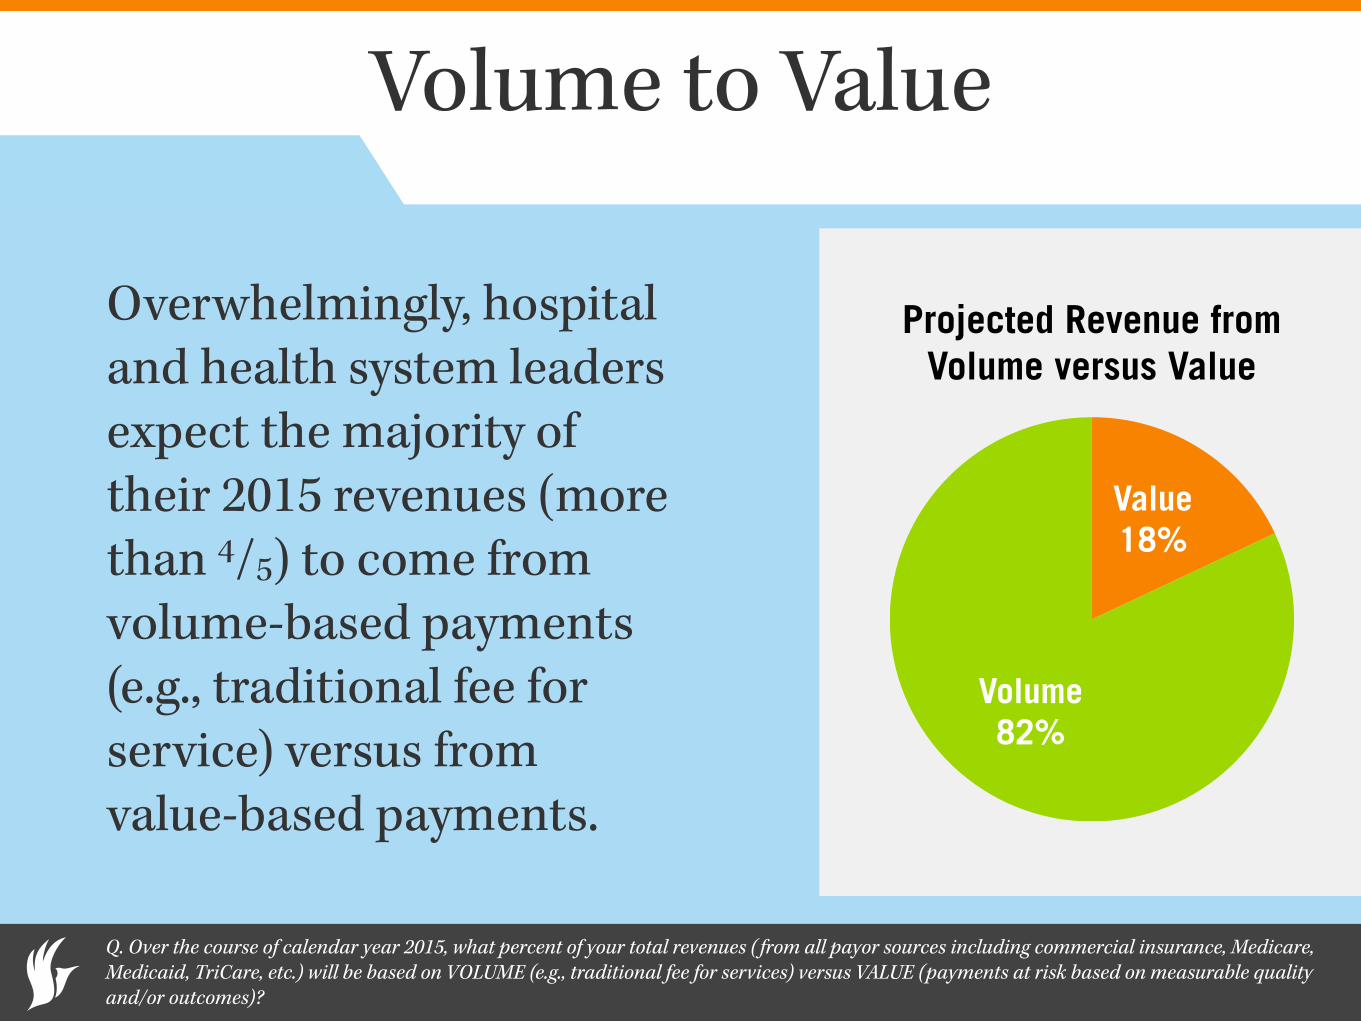
Volume to Value
Overwhelmingly, hospital and health system leaders expect the majority of their 2015 revenues (more than 4/5) to come from volume-based payments (e.g., traditional fee for service) versus from value-based payments.
Q. Over the course of calendar year 2015, what percent of your total revenues ( from all payor sources including commercial insurance, Medicare, Medicaid, TriCare, etc.) will be based on VOLUME (e.g., traditional fee for services) versus VALUE (payments at risk based on measurable quality and/or outcomes)?
Projected Revenue from Volume versus Value
Volume 82%
Value 18%
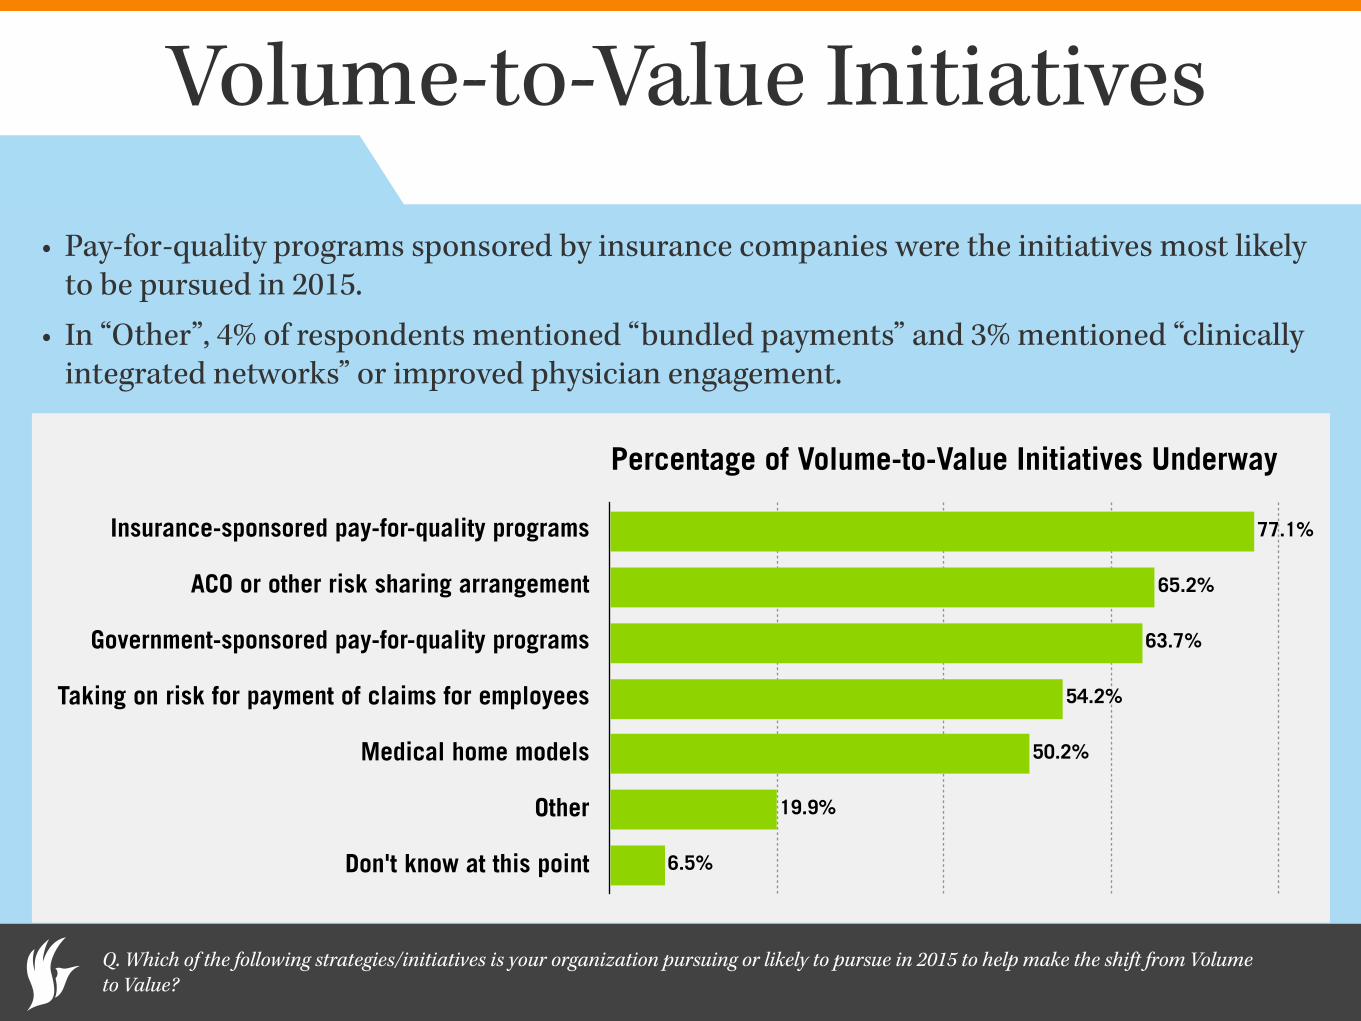
Volume-to-Value Initiatives
• Pay-for-quality programs sponsored by insurance companies were the initiatives most likely to be pursued in 2015.
• In “Other”, 4% of respondents mentioned “bundled payments” and 3% mentioned “clinically integrated networks” or improved physician engagement.
Q. Which of the following strategies/initiatives is your organization pursuing or likely to pursue in 2015 to help make the shift from Volume to Value?
Percentage of Volume-to-Value Initiatives Underway
Insurance-sponsored pay-for-quality programs
ACO or other risk sharing arrangement
Government-sponsored pay-for-quality programs
Taking on risk for payment of claims for employees
Medical home models
Other
Don't know at this point 6.5%
19.9%
50.2%
54.2%
63.7%
65.2%
77.1%
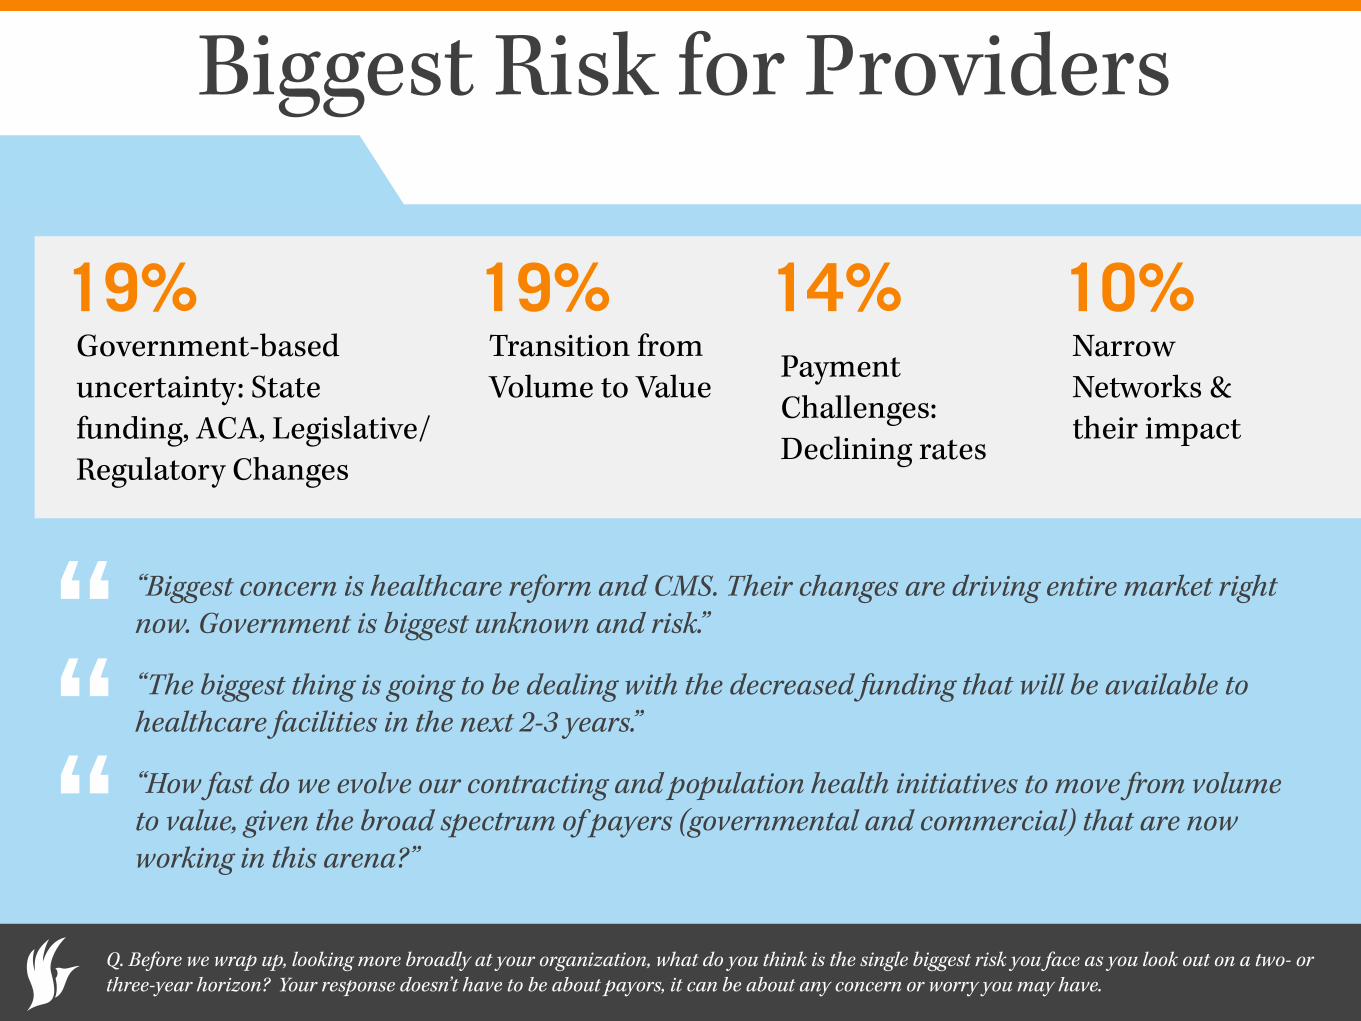
Biggest Risk for Providers
“Biggest concern is healthcare reform and CMS. Their changes are driving entire market right now. Government is biggest unknown and risk.”
“The biggest thing is going to be dealing with the decreased funding that will be available to healthcare facilities in the next 2-3 years.”
“How fast do we evolve our contracting and population health initiatives to move from volume to value, given the broad spectrum of payers (governmental and commercial) that are now working in this arena?”
Q. Before we wrap up, looking more broadly at your organization, what do you think is the single biggest risk you face as you look out on a two- or three-year horizon? Your response doesn’t have to be about payors, it can be about any concern or worry you may have.
“““
Government-based uncertainty: State funding, ACA, Legislative/Regulatory Changes
Transition from Volume to Value Payment
Challenges: Declining rates
Narrow Networks & their impact
19% 19% 14% 10%

Brandon Edwards CEO
ReviveHealth thinkrevivehealth.com
Dan Prince President
Catalyst Healthcare Research catalysthcr.com
Laurie Graham Payer Operations Manager
athenahealth athenahealth.com
Question & Answers