Embed Size (px)
Citation preview
PARENTAL CARE IS CHILD CARE: FAMILY
EMPOWERMENT AND CHILD CARE IN NIGERIA
BY
ABIMBOLA OLUGBENGA FAYOMIBOLANLE CLARA SIMEON-FAYOMI
TEMITOPE FAVOUR JIBOYE(Obafemi Awolowo University, Ile-Ife, Osun State, Nigeria)
BACKGROUND
In many ways, the pattern of childcare that is been practiced by any people can be influenced by many factors. One of which is the significance that are ascribed to children. Children are held in very high esteem in many cultures of the world.
In Yoruba culture, a union that is blessed with children is highly honoured while tension is pervasive in a union without children. The Yoruba express their joy and the value they ascribe to children in many ways. One of such is the lavish ceremony that often characterize the naming of the new born child.
BACKGROUND … contd
The Yorubas’ also express their perspectives through their proverbs and wise sayings
e.g. Olomololaye, Obaoke jenbitemi – meaning the world belongs to a
man/woman that is blessed with the fruit of the womb, God of heaven bless me with
one.
BACKGROUND … contd
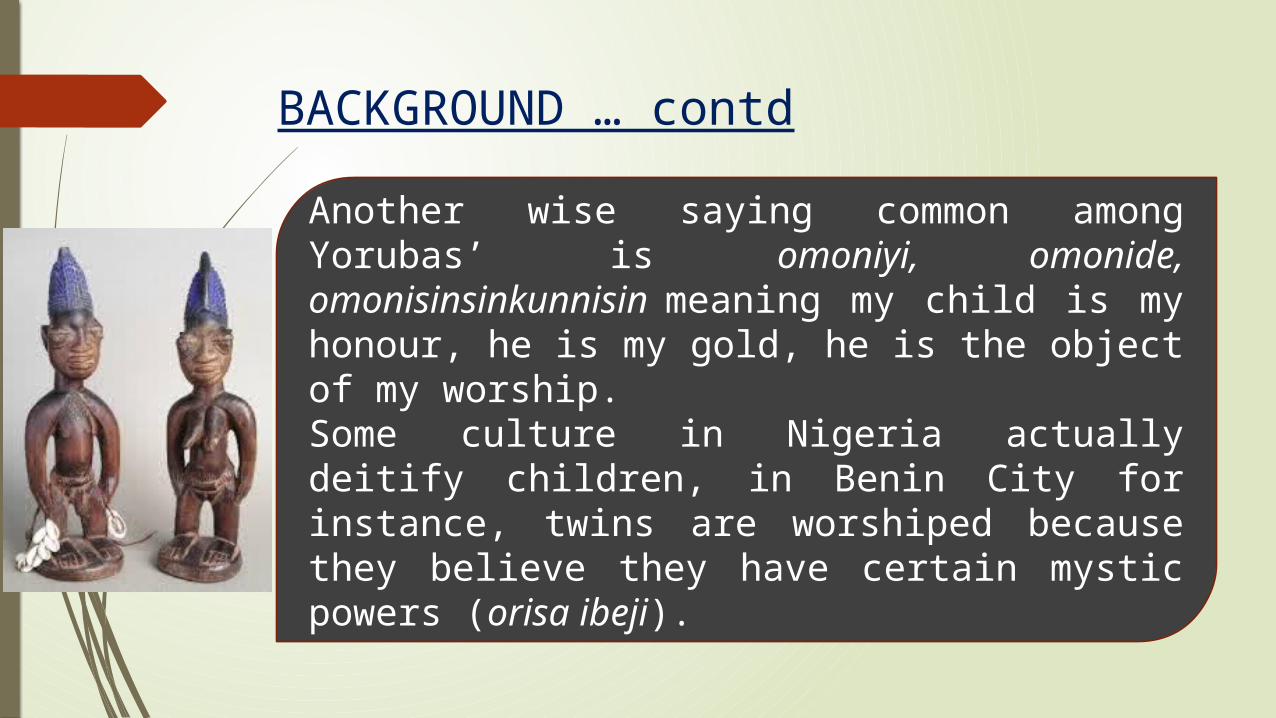
Another wise saying common among Yorubas’ is omoniyi, omonide, omonisinsinkunnisin meaning my child is my honour, he is my gold, he is the object of my worship.Some culture in Nigeria actually deitify children, in Benin City for instance, twins are worshiped because they believe they have certain mystic powers (orisa ibeji).
BACKGROUND … contd
Some religion accord children certain honor and privileges because they believe they are close to God due to their innocence and sinlessness, such religion involve them in important aspect of worship and sacrifice.
Another factor that may determine childcare pattern is the expectation of the parents from children.
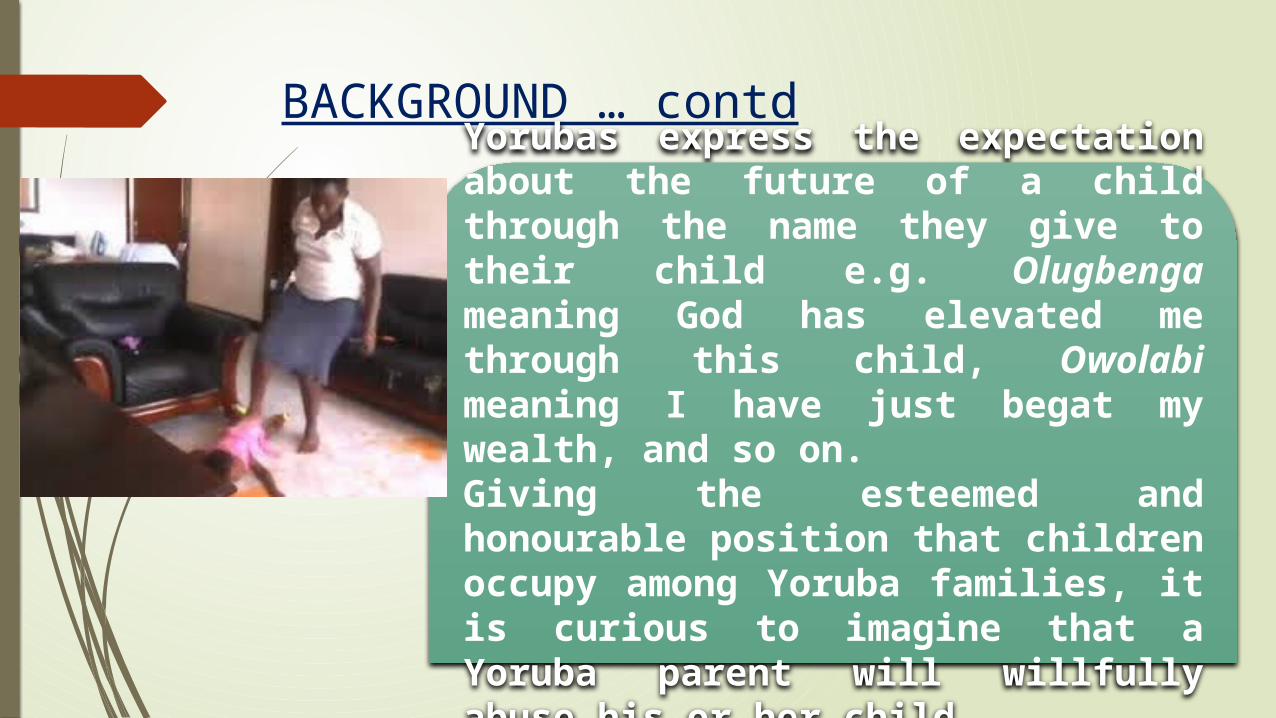
BACKGROUND … contdYorubas express the expectation about the future of a child through the name they give to their child e.g. Olugbenga meaning God has elevated me through this child, Owolabi meaning I have just begat my wealth, and so on.Giving the esteemed and honourable position that children occupy among Yoruba families, it is curious to imagine that a Yoruba parent will willfully abuse his or her child.
BACKGROUND … contd
In this regard, what constitute abuse could be a question of perception,
coloured by culture and other socio-economic factors of individuals. Given
this background, this paper aims at achieving the following objectives.
OBJECTIVES
Investigate the cultural dimensions to childcare among household
heads in Osun State
Determine the influence of economic status of household heads on their
perspectives on childcare.
Establish the relationship between gender and childcare practices of household heads in Osun State
HYPOTHESES
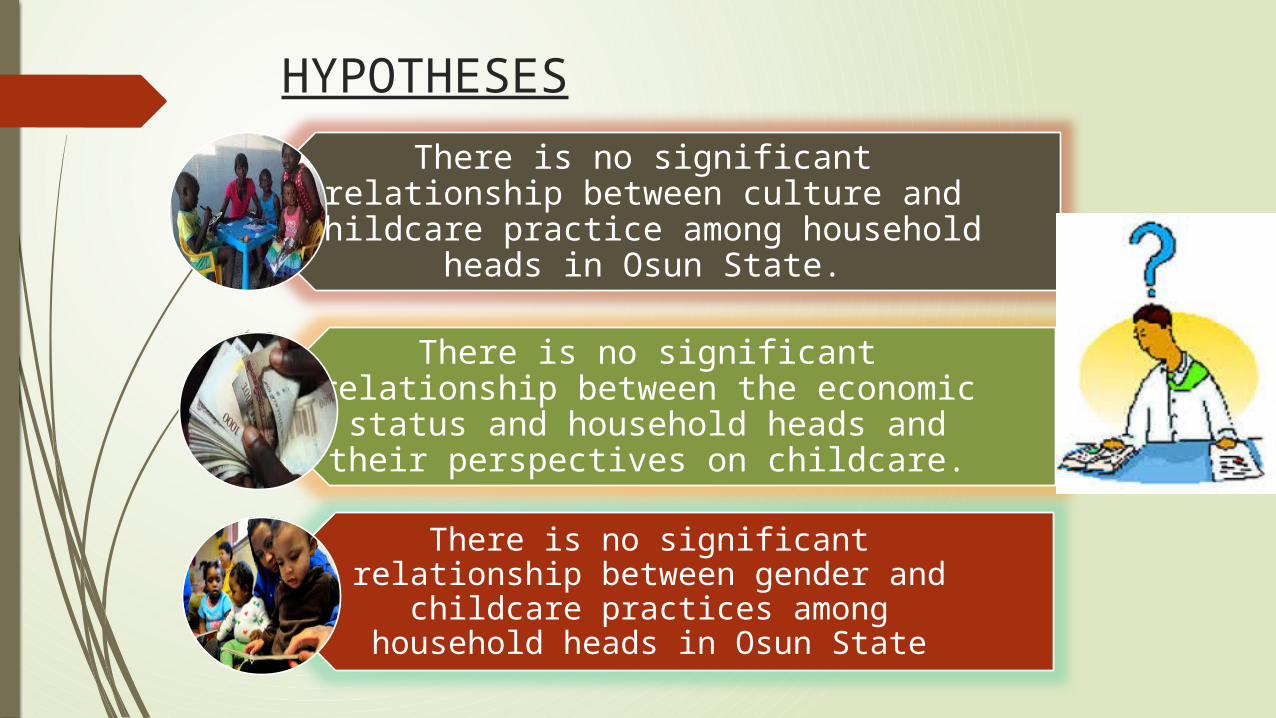
There is no significant relationship between culture and childcare practice among household heads in Osun State.
There is no significant relationship between the economic status and
household heads and their perspectives on childcare.
There is no significant relationship between gender and childcare practices among household heads in Osun State
METHODOLOGY
The study population comprised of head of households in Osun State of Southwestern Nigeria. Both primary and secondary data sources were employed. Primary data was elicited through structured interview schedule administered on 50 household heads that were purposively selected based on gender, ethnicity and perceived economic status Data were analyzed through inferential statistical statistical tools.
RESULTS
Gender n %MaleFemaleTotal
341650
6832
100
Age Group25 – 49 years50 and aboveTotal
311950
6238
100
Academic QualificationsNo formal educationPrimary SecondaryTertiaryTotal
34
261750
68
5234
100
OccupationTradingFarmingPrivate Sector EmployeeCivil ServantTotal
1869
1750
36121834
100
Source: Field Survey, 2015
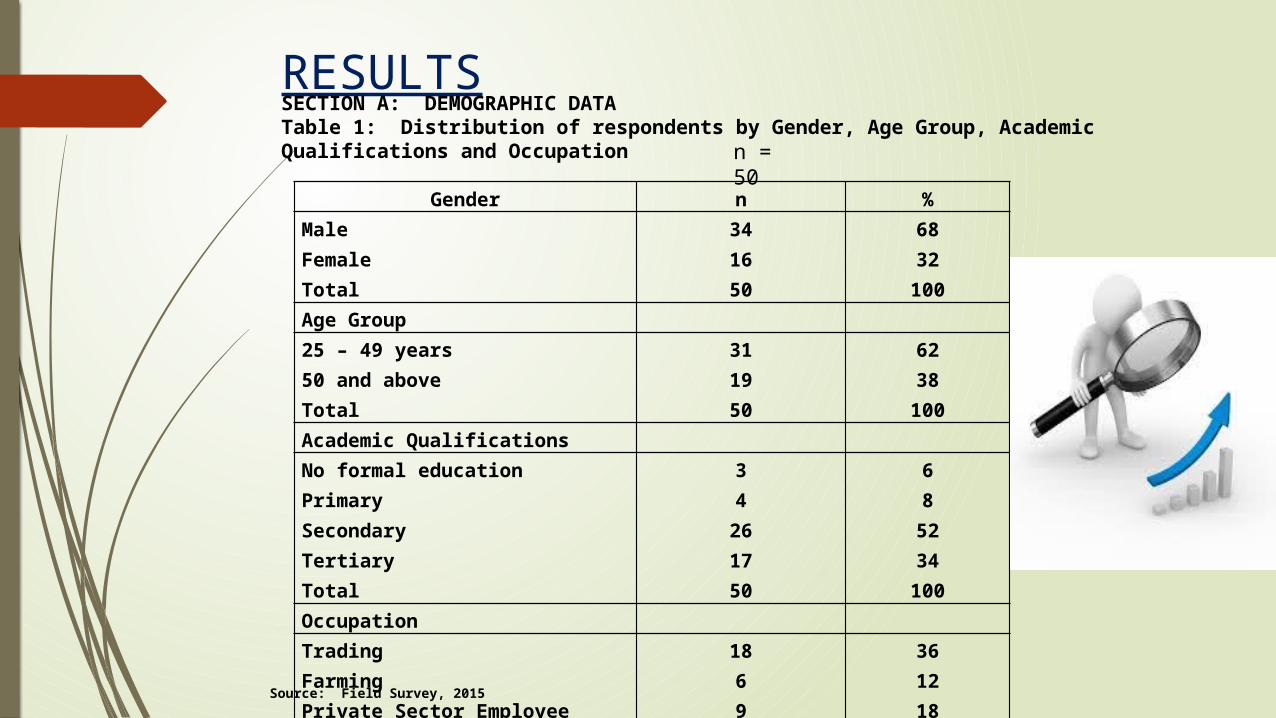
SECTION A: DEMOGRAPHIC DATATable 1: Distribution of respondents by Gender, Age Group, Academic Qualifications and Occupation
n = 50
INTERPRETATION … TABLE 1
From the table above, it can be deduced that 34 respondents representing 68% were male while 32% were female. 31 respondents representing 62% were between 25 – 49 years of age while the 19 respondents representing 38% were 50 years and above.
Also, 3 respondents representing 6% had no formal education, 4 respondents representing 8% had only primary education, 26 respondents representing 52% had secondary education while the remaining 17 respondents representing 34% were graduates. Furthermore, 18 respondents representing 36% were traders, 6 respondents representing 12% were farmers, 9 respondents representing 18% were private sector employees while the remaining 17 respondents representing 34% were civil servants.
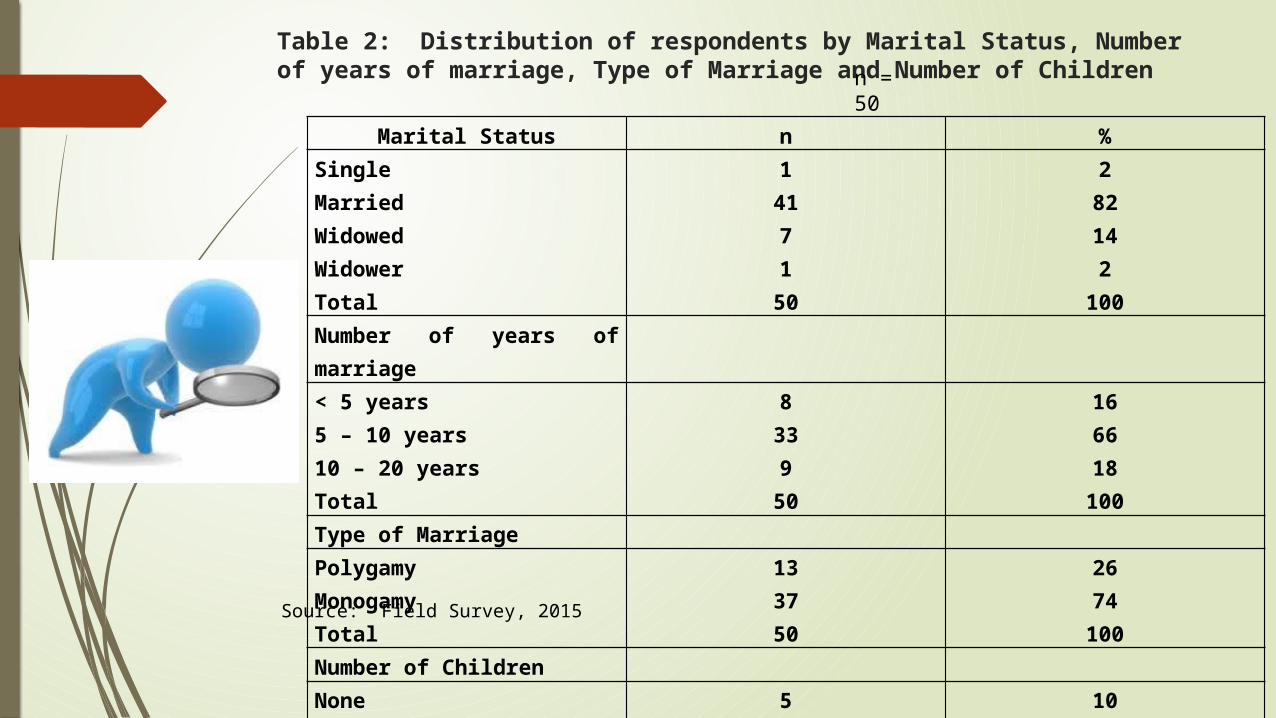
Table 2: Distribution of respondents by Marital Status, Number of years of marriage, Type of Marriage and Number of Children
Marital Status n %SingleMarriedWidowedWidowerTotal
14171
50
282142
100
Number of years of marriage< 5 years5 – 10 years10 – 20 yearsTotal
8339
50
166618
100
Type of MarriagePolygamyMonogamyTotal
133750
2674
100
Number of ChildrenNone1 – 22 – 5Total
5113450
102268
100
n = 50
Source: Field Survey, 2015
INTERPRETATION … TABLE 2
From the table above, 1 respondent representing 2% is single, 41 respondents representing 82% are married, 7 respondents representing 14% are widowed while the remaining 1 respondent representing 2% is a widower. This shows that most of the respondents are married. 8 respondents representing 16% have been married for less than 5 years, 33 respondents representing 66% had been married for between 5 – 10 years while the remaining 9 respondents representing 18% have been married for between 10 – 20 years.
Also, 13 respondents representing 26% practiced polygamy while the 37 respondents representing 74% practiced monogamy. Furthermore, 5 respondents representing 10% has no child, 11 respondents representing 22% has between 1 – 2 children, while the remaining 34 respondents representing 68% has between 2 – 5 children.
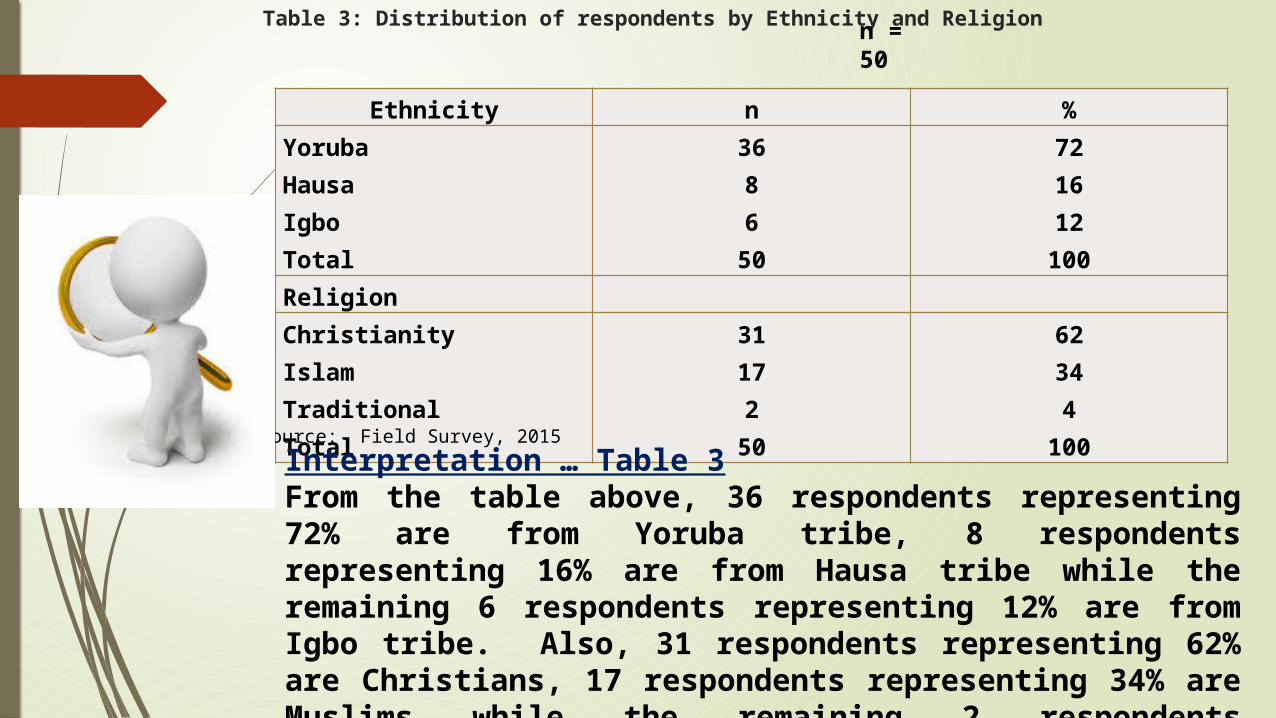
Table 3: Distribution of respondents by Ethnicity and Religion
Ethnicity n %YorubaHausaIgboTotal
368650
721612100
ReligionChristianityIslamTraditionalTotal
3117250
62344
100
n = 50
Source: Field Survey, 2015
Interpretation … Table 3From the table above, 36 respondents representing 72% are from Yoruba tribe, 8 respondents representing 16% are from Hausa tribe while the remaining 6 respondents representing 12% are from Igbo tribe. Also, 31 respondents representing 62% are Christians, 17 respondents representing 34% are Muslims while the remaining 2 respondents representing 4% are traditional worshippers.
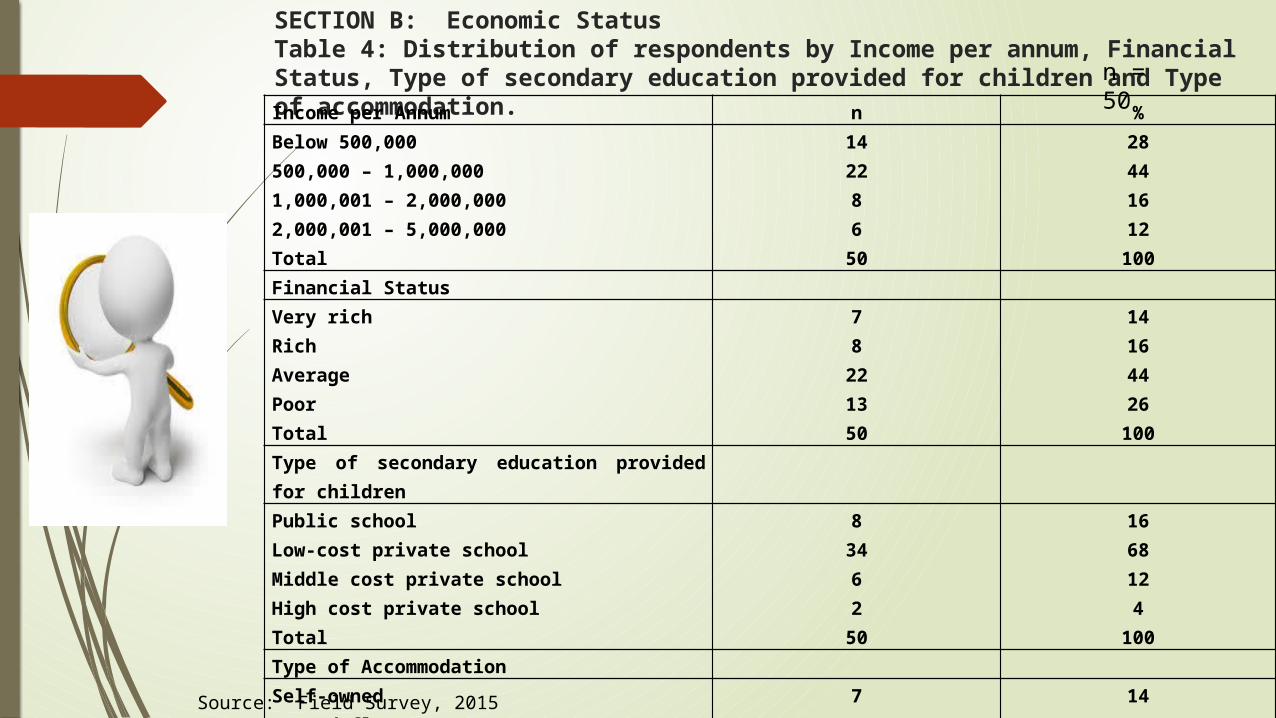
SECTION B: Economic StatusTable 4: Distribution of respondents by Income per annum, Financial Status, Type of secondary education provided for children and Type of accommodation.Income per Annum n %Below 500,000500,000 – 1,000,0001,000,001 – 2,000,0002,000,001 – 5,000,000Total
142286
50
28441612
100Financial Status Very richRichAveragePoorTotal
78
221350
14164426
100Type of secondary education provided for childrenPublic schoolLow-cost private schoolMiddle cost private schoolHigh cost private schoolTotal
83462
50
1668124
100Type of AccommodationSelf-ownedRented flatRented apartment (Face-me-I-face you)Total
7182550
143650
100
n = 50
Source: Field Survey, 2015
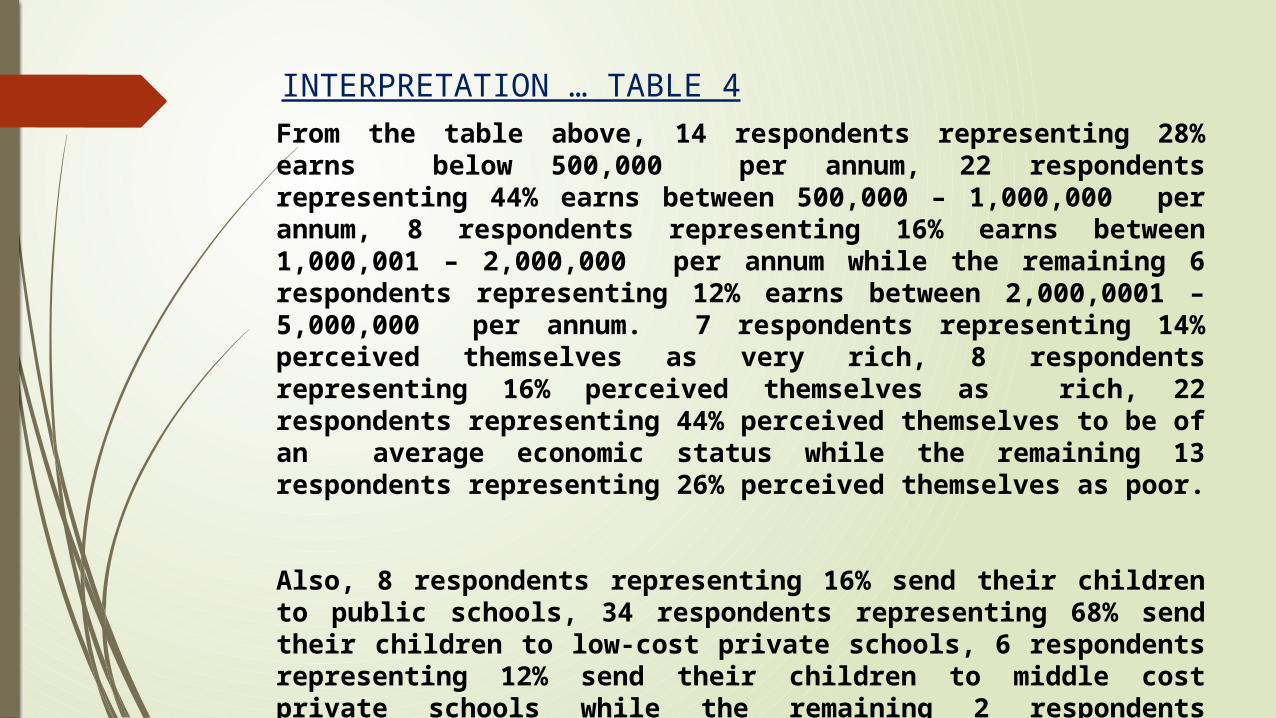
INTERPRETATION … TABLE 4From the table above, 14 respondents representing 28% earns below 500,000 per annum, 22 respondents representing 44% earns between 500,000 – 1,000,000 per annum, 8 respondents representing 16% earns between 1,000,001 – 2,000,000 per annum while the remaining 6 respondents representing 12% earns between 2,000,0001 – 5,000,000 per annum. 7 respondents representing 14% perceived themselves as very rich, 8 respondents representing 16% perceived themselves as rich, 22 respondents representing 44% perceived themselves to be of an average economic status while the remaining 13 respondents representing 26% perceived themselves as poor.
Also, 8 respondents representing 16% send their children to public schools, 34 respondents representing 68% send their children to low-cost private schools, 6 respondents representing 12% send their children to middle cost private schools while the remaining 2 respondents representing 4% send their children to high cost private schools. Furthermore, 7 respondents representing 14 lives in a self-owned apartment, 18 respondents representing 36% lives in a rented flat while the remaining 25 respondents representing 50% lives in a rented apartment (face-me-I-face-you).
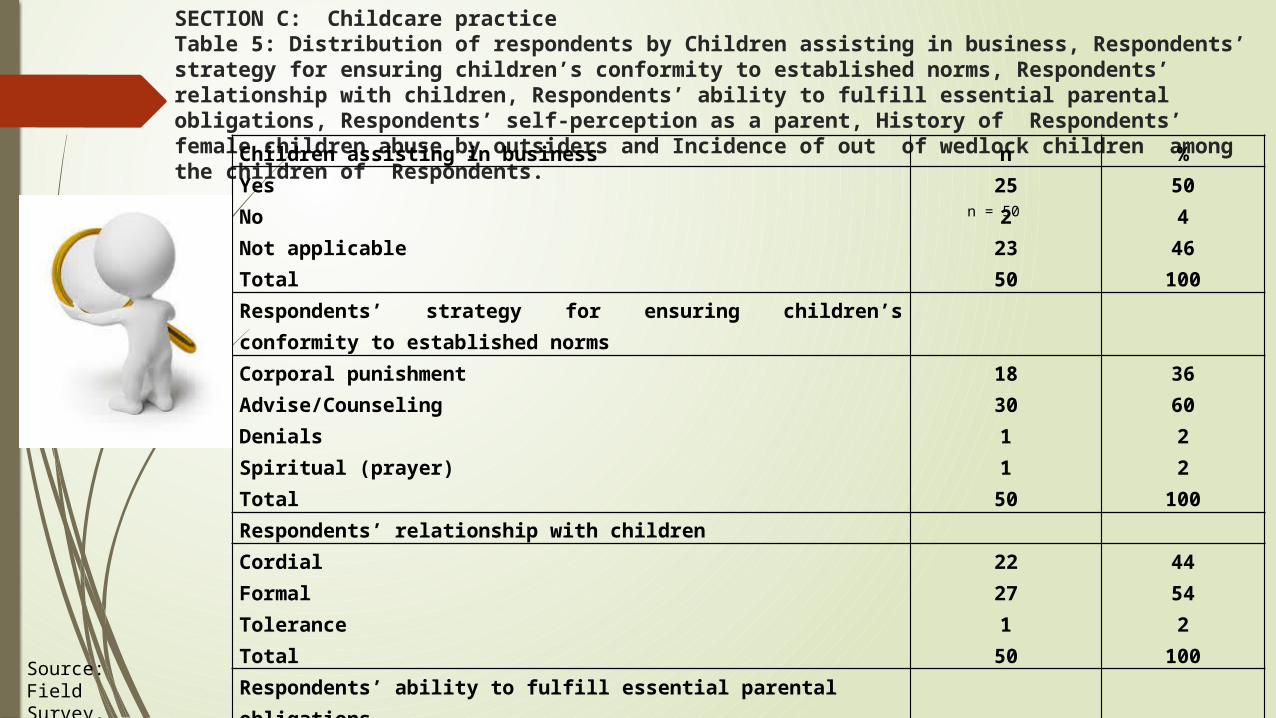
SECTION C: Childcare practiceTable 5: Distribution of respondents by Children assisting in business, Respondents’ strategy for ensuring children’s conformity to established norms, Respondents’ relationship with children, Respondents’ ability to fulfill essential parental obligations, Respondents’ self-perception as a parent, History of Respondents’ female children abuse by outsiders and Incidence of out of wedlock children among the children of Respondents.
Children assisting in business n %YesNoNot applicableTotal
252
2350
504
46100
Respondents’ strategy for ensuring children’s conformity to established normsCorporal punishmentAdvise/CounselingDenialsSpiritual (prayer)Total
183011
50
366022
100Respondents’ relationship with childrenCordialFormalToleranceTotal
22271
50
44542
100Respondents’ ability to fulfill essential parental obligationsTotallyPartiallyNot at allTotal
17300350
346006
100
n = 50
Source: Field Survey, 2015
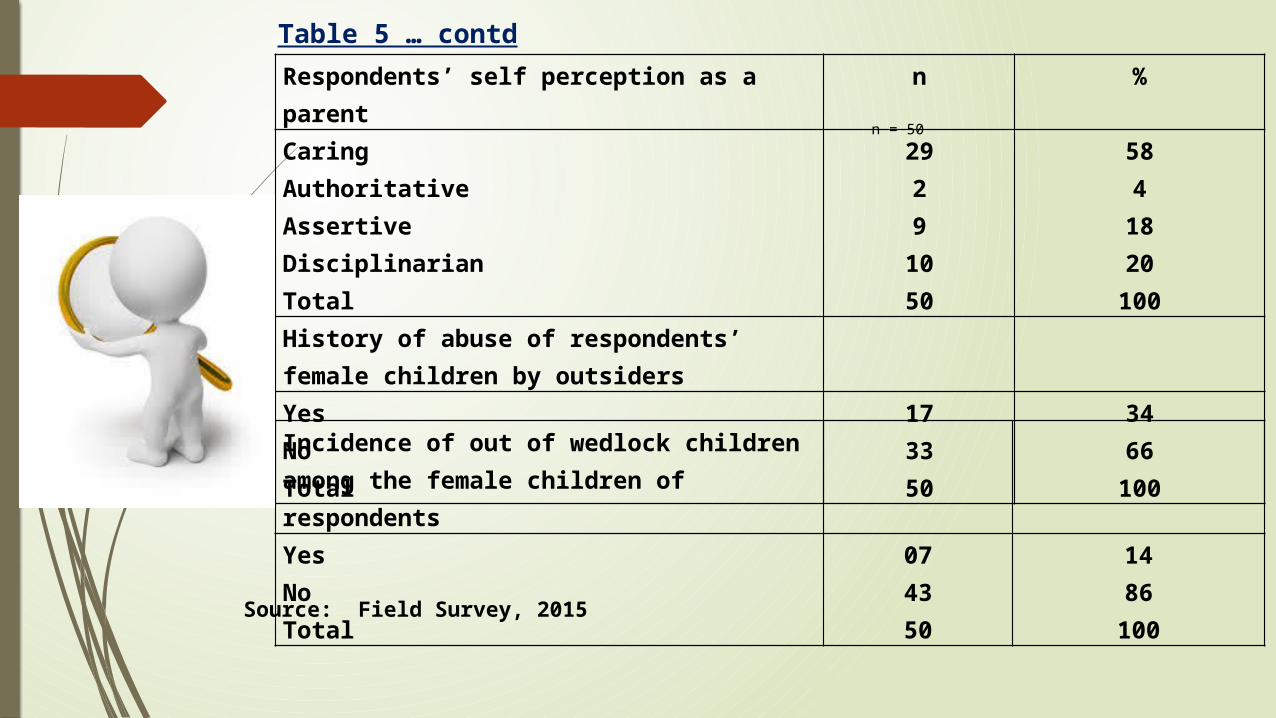
Table 5 … contdRespondents’ self perception as a parent n %CaringAuthoritativeAssertiveDisciplinarianTotal
2929
1050
584
1820
100History of abuse of respondents’ female children by outsidersYesNoTotal
173350
3466
100
Incidence of out of wedlock children among the female children of respondentsYesNoTotal
074350
1486
100
n = 50
Source: Field Survey, 2015
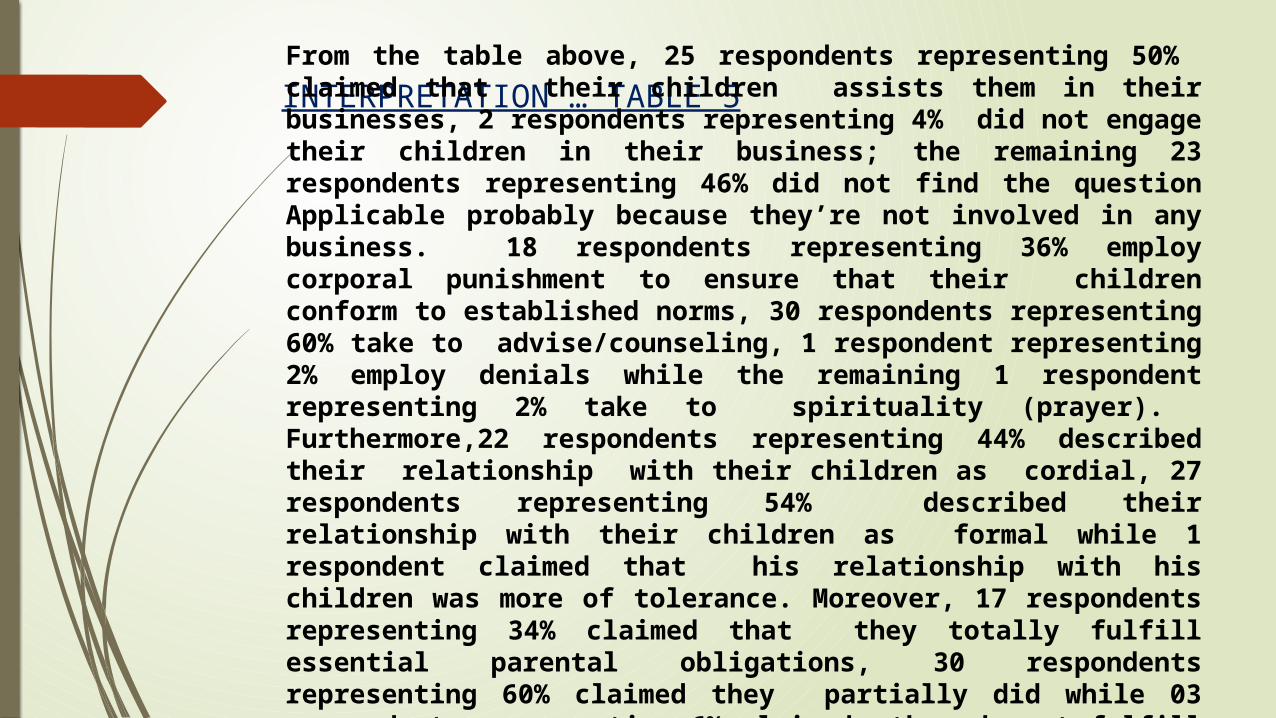
INTERPRETATION … TABLE 5From the table above, 25 respondents representing 50% claimed that their children assists them in their businesses, 2 respondents representing 4% did not engage their children in their business; the remaining 23 respondents representing 46% did not find the question Applicable probably because they’re not involved in any business. 18 respondents representing 36% employ corporal punishment to ensure that their children conform to established norms, 30 respondents representing 60% take to advise/counseling, 1 respondent representing 2% employ denials while the remaining 1 respondent representing 2% take to spirituality (prayer). Furthermore,22 respondents representing 44% described their relationship with their children as cordial, 27 respondents representing 54% described their relationship with their children as formal while 1 respondent claimed that his relationship with his children was more of tolerance. Moreover, 17 respondents representing 34% claimed that they totally fulfill essential parental obligations, 30 respondents representing 60% claimed they partially did while 03 respondents representing 6% claimed they do not fulfill their obligations as a parent.
INTERPRETATION … TABLE 5 … contd
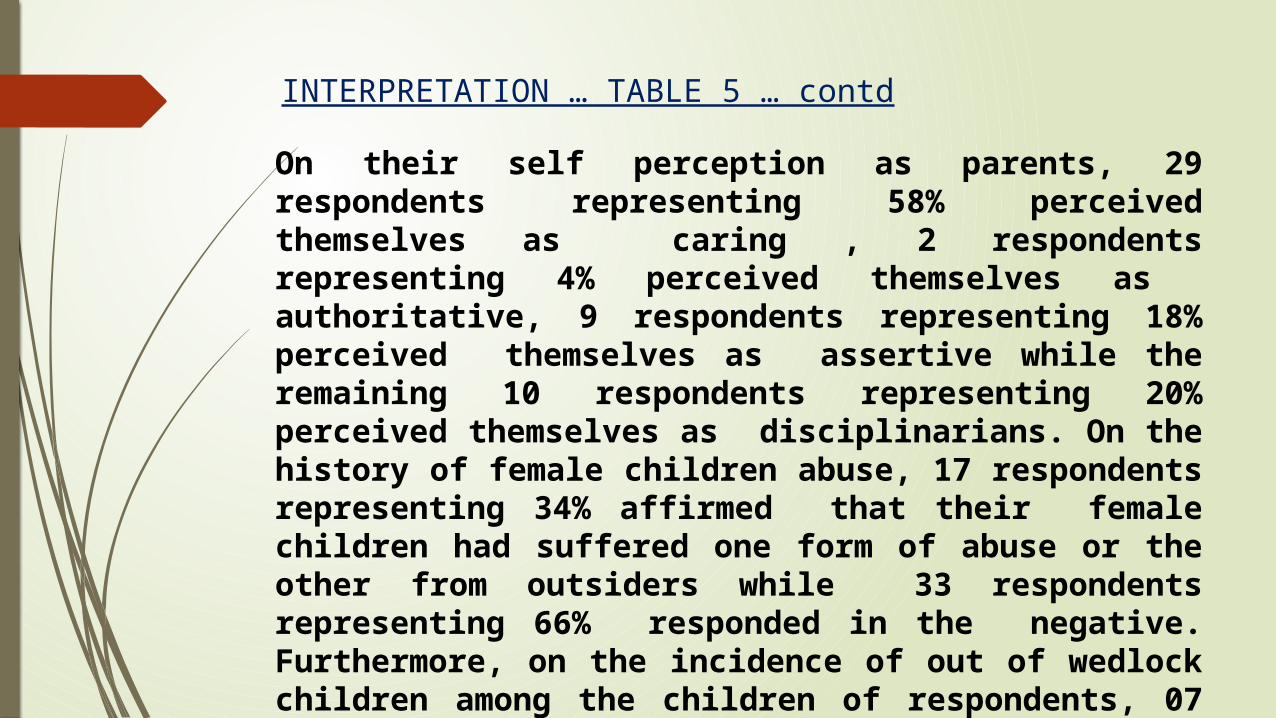
On their self perception as parents, 29 respondents representing 58% perceived themselves as caring , 2 respondents representing 4% perceived themselves as authoritative, 9 respondents representing 18% perceived themselves as assertive while the remaining 10 respondents representing 20% perceived themselves as disciplinarians. On the history of female children abuse, 17 respondents representing 34% affirmed that their female children had suffered one form of abuse or the other from outsiders while 33 respondents representing 66% responded in the negative. Furthermore, on the incidence of out of wedlock children among the children of respondents, 07 respondents representing 14% affirmed that at least one of their children had a child out of wedlock, while 43 respondents representing 86% responded in the negative.
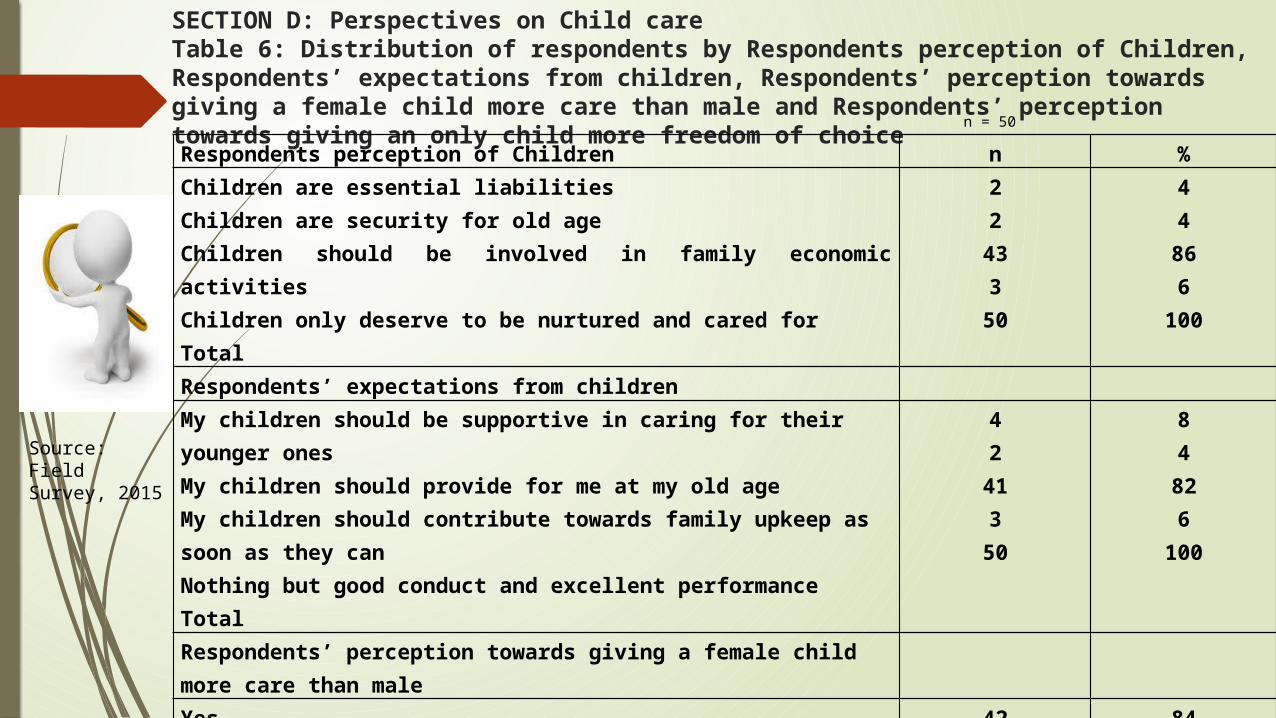
SECTION D: Perspectives on Child careTable 6: Distribution of respondents by Respondents perception of Children, Respondents’ expectations from children, Respondents’ perception towards giving a female child more care than male and Respondents’ perception towards giving an only child more freedom of choiceRespondents perception of Children n %Children are essential liabilitiesChildren are security for old ageChildren should be involved in family economic activitiesChildren only deserve to be nurtured and cared forTotal
22
433
50
44
866
100
Respondents’ expectations from childrenMy children should be supportive in caring for their younger onesMy children should provide for me at my old ageMy children should contribute towards family upkeep as soon as they canNothing but good conduct and excellent performanceTotal
42
413
50
84
826
100
Respondents’ perception towards giving a female child more care than maleYesNoTotal
428
50
8416
100
Respondents’ perception towards giving an only child more freedom of choiceYesNoTotal
446
50
8812
100
n = 50
Source: Field Survey, 2015
INTERPRETATION … TABLE 5
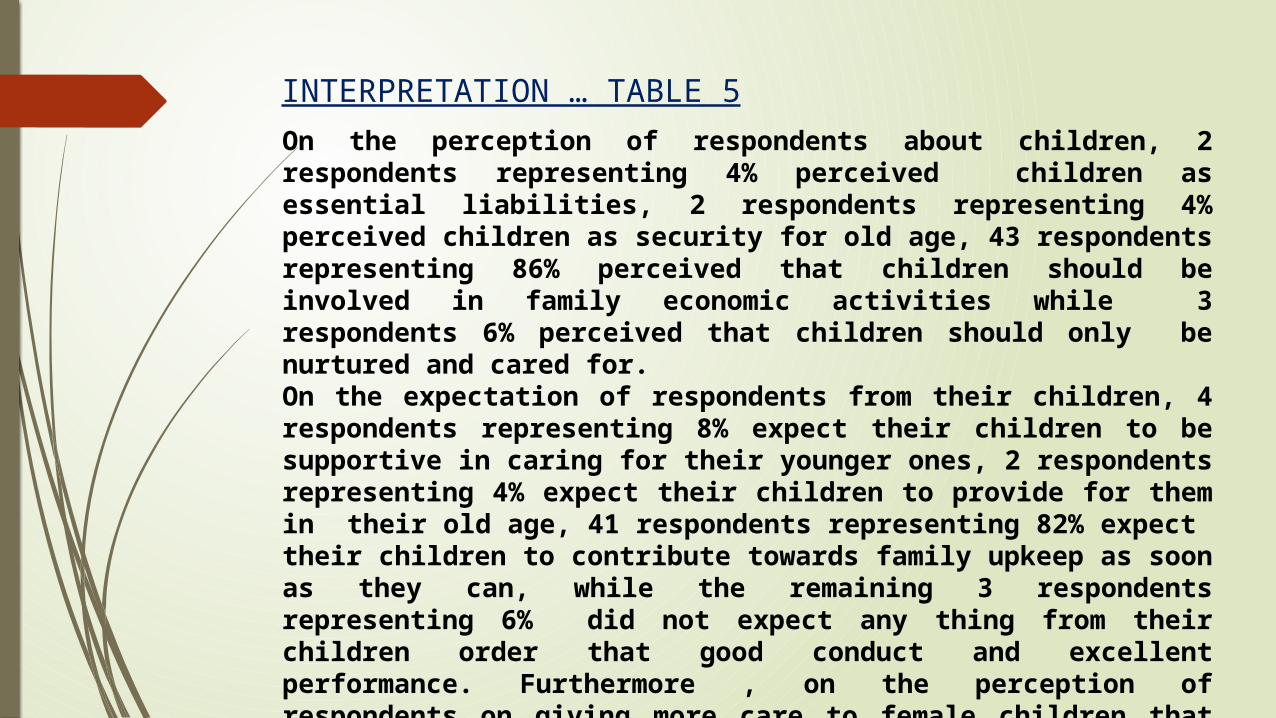
On the perception of respondents about children, 2 respondents representing 4% perceived children as essential liabilities, 2 respondents representing 4% perceived children as security for old age, 43 respondents representing 86% perceived that children should be involved in family economic activities while 3 respondents 6% perceived that children should only be nurtured and cared for. On the expectation of respondents from their children, 4 respondents representing 8% expect their children to be supportive in caring for their younger ones, 2 respondents representing 4% expect their children to provide for them in their old age, 41 respondents representing 82% expect their children to contribute towards family upkeep as soon as they can, while the remaining 3 respondents representing 6% did not expect any thing from their children order that good conduct and excellent performance. Furthermore , on the perception of respondents on giving more care to female children that male children, 42 respondents representing 84% believed that a female child should receive more care and attention than a male child while 8 respondents representing 16% negate the option. Furthermore, 44 respondents representing 88% agreed to give an only child more freedom of choice while 6 respondents representing 12% disagreed.
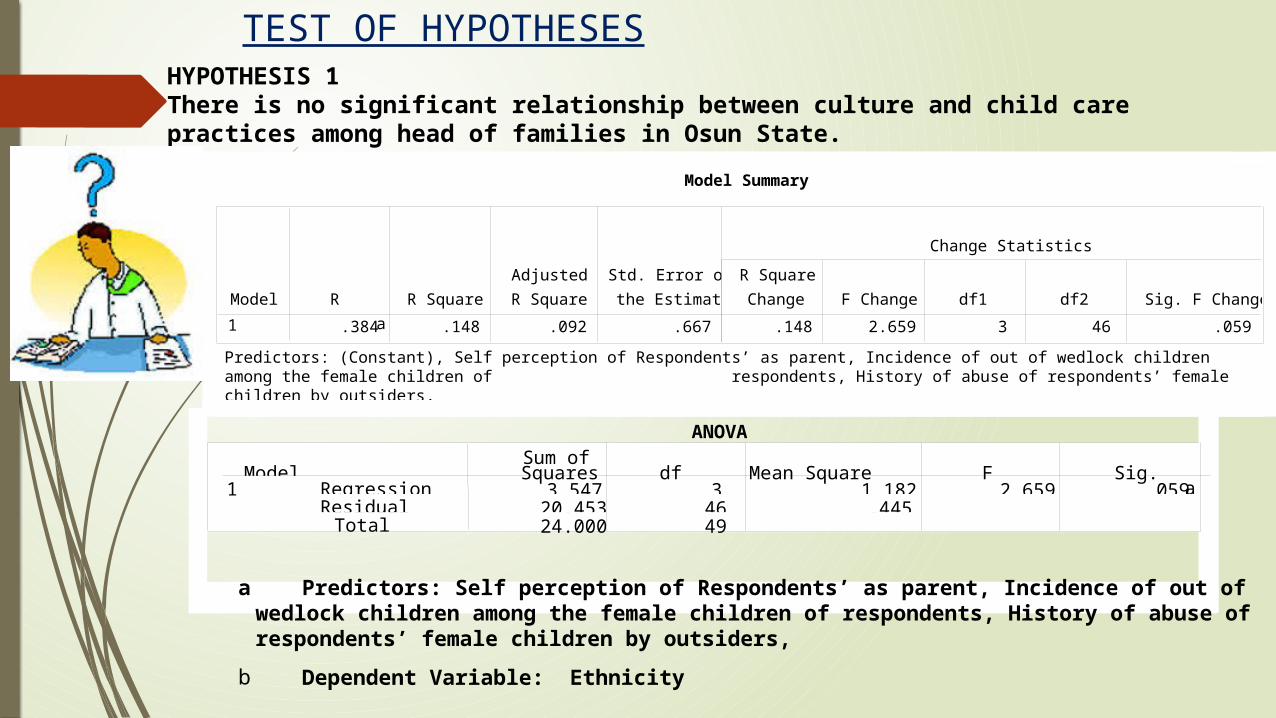
TEST OF HYPOTHESESHYPOTHESIS 1There is no significant relationship between culture and child care practices among head of families in Osun State.
Model Summary
.384a .148 .092 .667 .148 2.659 3 46 .059
Model
1
R R Square
Adjusted
R Square
Std. Error of
the Estimate
R Square
Change F Change df1 df2 Sig. F Change
Change Statistics
Predictors: (Constant), Self perception of Respondents’ as parent, Incidence of out of wedlock children among the female children of respondents, History of abuse of respondents’ female children by outsiders,
ANOVA
3.547 3 1.182 2.659 .059a20.453 46 .44524.000 49
RegressionResidual
Total
Model1
Sum ofSquares df Mean Square F Sig.
a Predictors: Self perception of Respondents’ as parent, Incidence of out of wedlock children among the female children of respondents, History of abuse of respondents’ female children by outsiders,
b Dependent Variable: Ethnicity
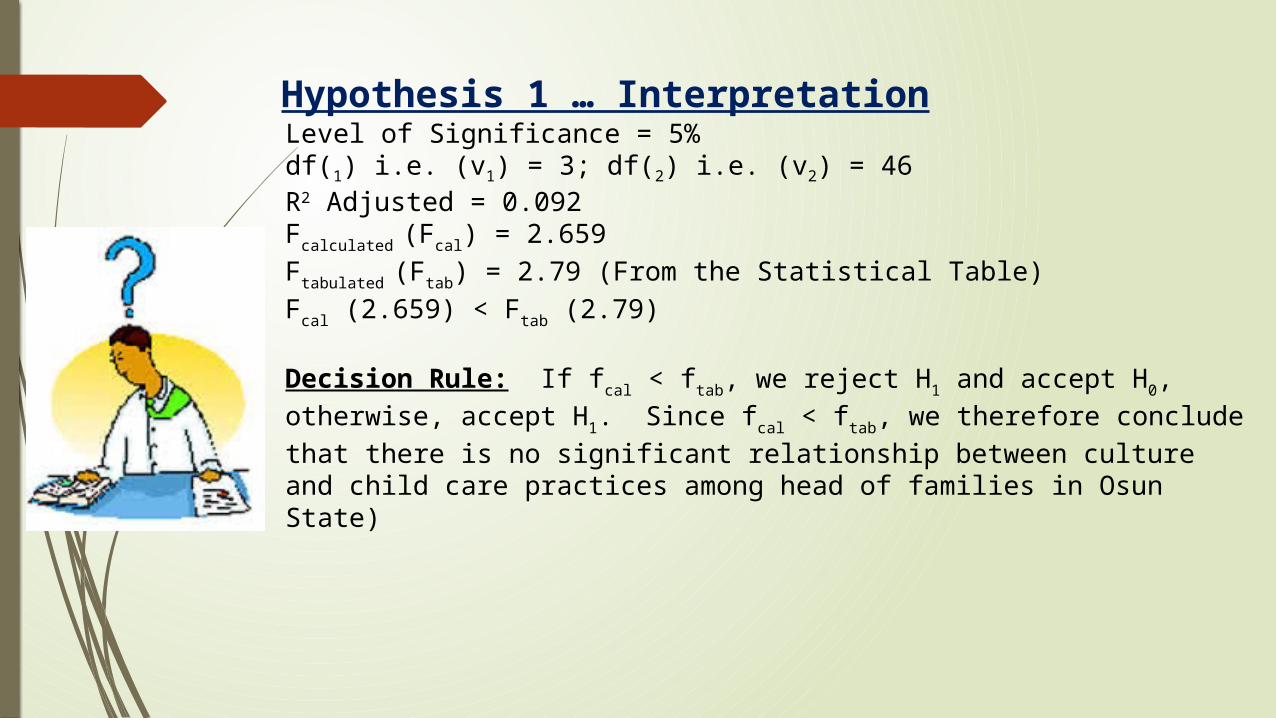
Hypothesis 1 … InterpretationLevel of Significance = 5%df(1) i.e. (v1) = 3; df(2) i.e. (v2) = 46R2 Adjusted = 0.092Fcalculated (Fcal) = 2.659Ftabulated (Ftab) = 2.79 (From the Statistical Table)Fcal (2.659) < Ftab (2.79)
Decision Rule: If fcal < ftab, we reject H1 and accept H0, otherwise, accept H1. Since fcal < ftab, we therefore conclude that there is no significant relationship between culture and child care practices among head of families in Osun State)
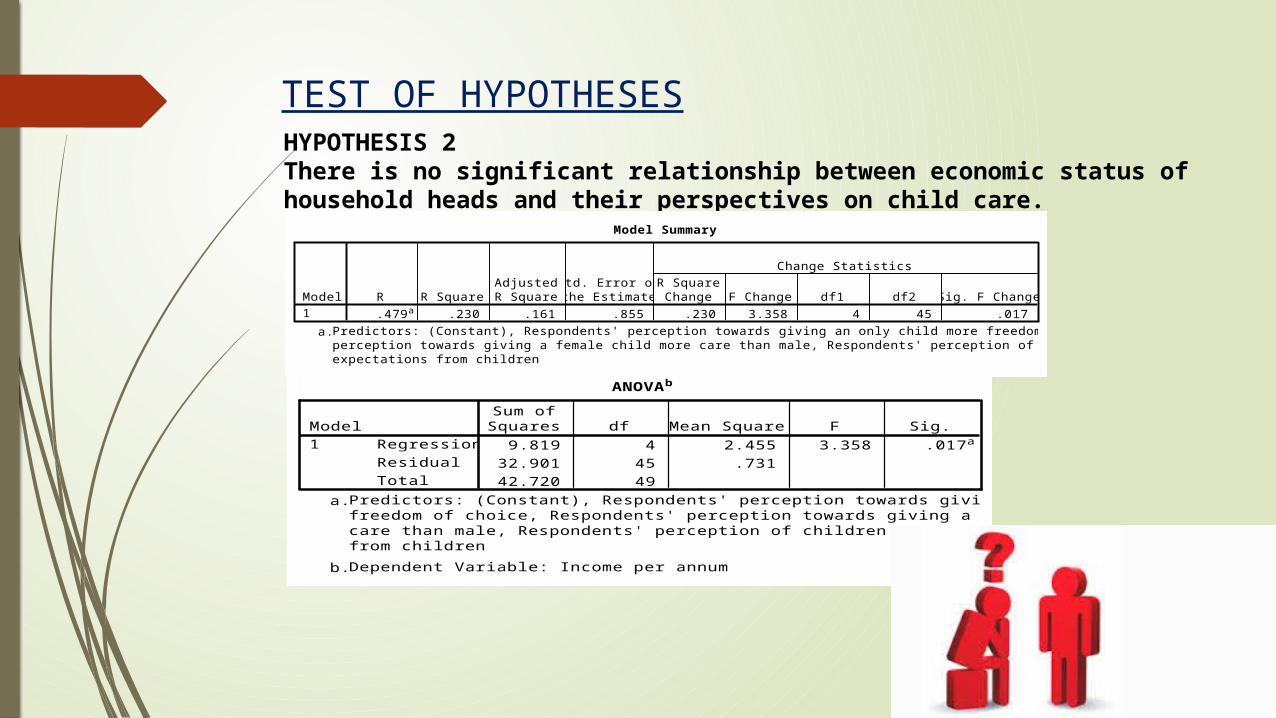
TEST OF HYPOTHESESHYPOTHESIS 2There is no significant relationship between economic status of household heads and their perspectives on child care.
Model Summary
.479a .230 .161 .855 .230 3.358 4 45 .017Model1
R R SquareAdjustedR Square
Std. Error ofthe Estimate
R SquareChange F Change df1 df2 Sig. F Change
Change Statistics
Predictors: (Constant), Respondents' perception towards giving an only child more freedom of choice, Respondents'perception towards giving a female child more care than male, Respondents' perception of children , Respondents'expectations from children
a.
ANOVAb
9.819 4 2.455 3.358 .017a
32.901 45 .731
42.720 49
Regression
Residual
Total
Model1
Sum ofSquares df Mean Square F Sig.
Predictors: (Constant), Respondents' perception towards giving an only child morefreedom of choice, Respondents' perception towards giving a female child morecare than male, Respondents' perception of children , Respondents' expectationsfrom children
a.
Dependent Variable: Income per annumb.
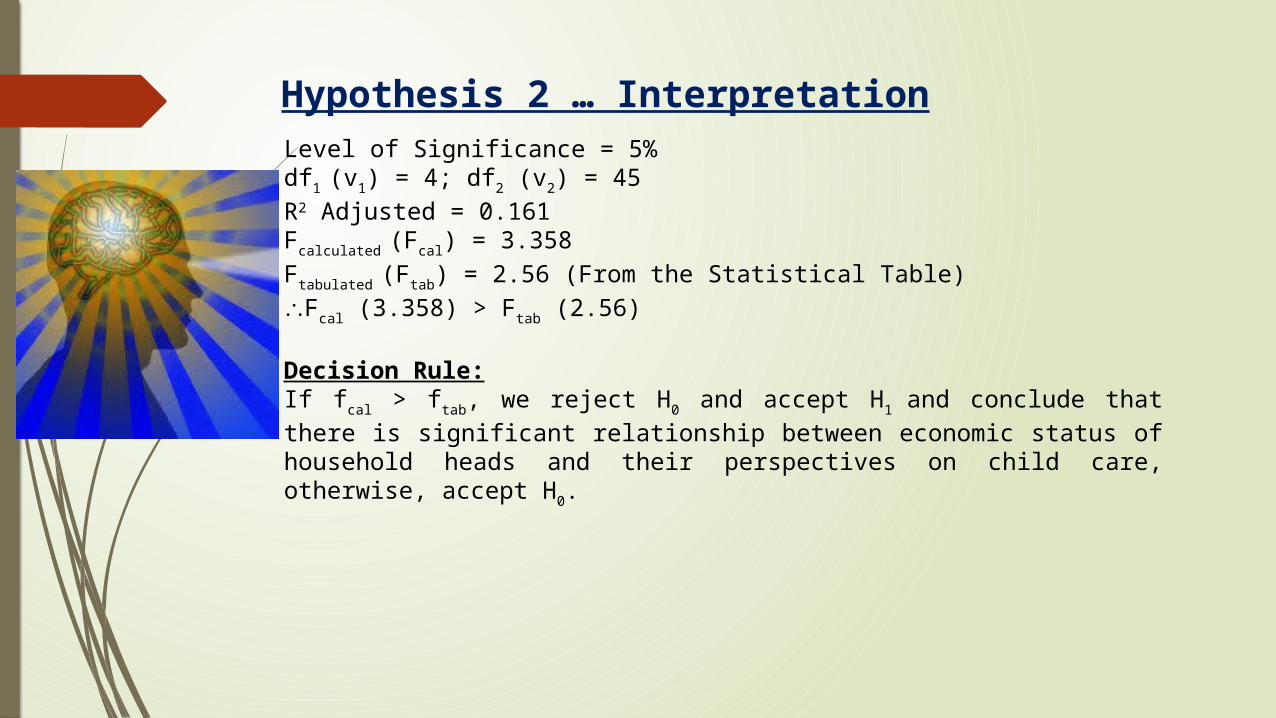
Hypothesis 2 … Interpretation
Level of Significance = 5%df1 (v1) = 4; df2 (v2) = 45R2 Adjusted = 0.161Fcalculated (Fcal) = 3.358Ftabulated (Ftab) = 2.56 (From the Statistical Table)Fcal (3.358) > Ftab (2.56)
Decision Rule: If fcal > ftab, we reject H0 and accept H1 and conclude that there is significant relationship between economic status of household heads and their perspectives on child care, otherwise, accept H0.
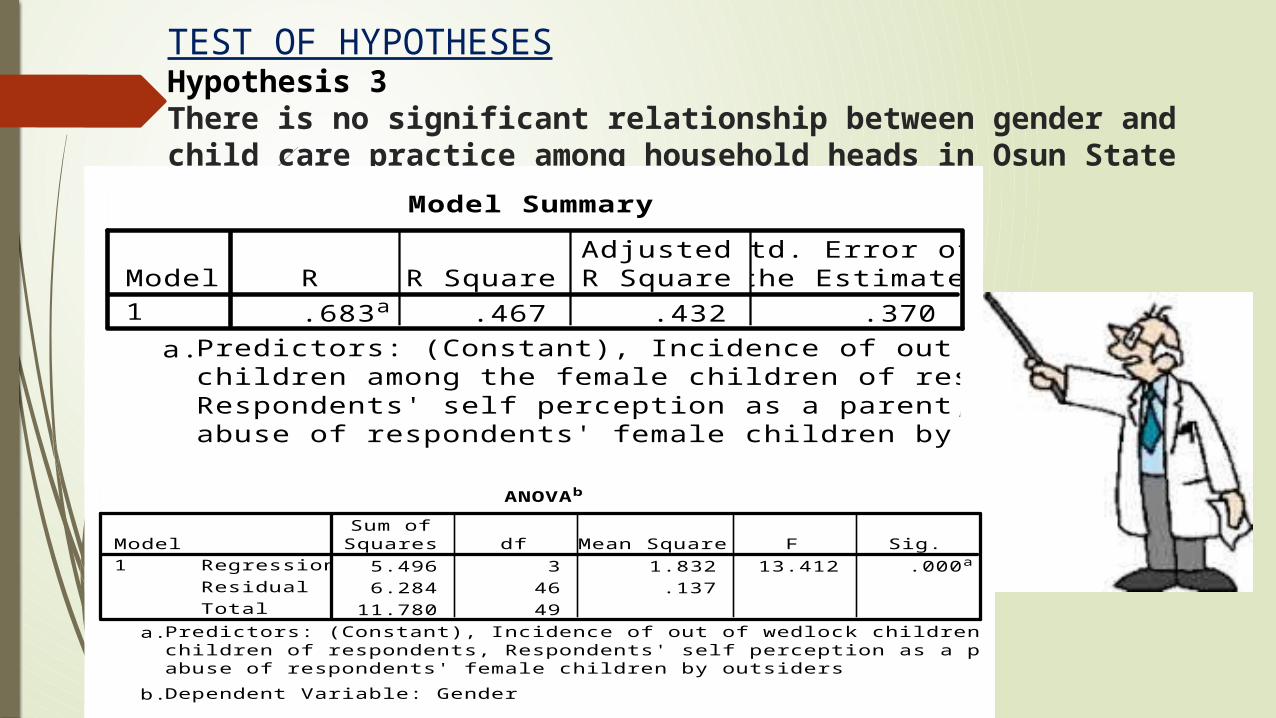
TEST OF HYPOTHESESHypothesis 3There is no significant relationship between gender and child care practice among household heads in Osun State
Model Summary
.683a .467 .432 .370Model1
R R SquareAdjustedR Square
Std. Error ofthe Estimate
Predictors: (Constant), Incidence of out of wedlockchildren among the female children of respondents,Respondents' self perception as a parent, History ofabuse of respondents' female children by outsiders
a.
ANOVAb
5.496 3 1.832 13.412 .000a
6.284 46 .137
11.780 49
Regression
Residual
Total
Model1
Sum ofSquares df Mean Square F Sig.
Predictors: (Constant), Incidence of out of wedlock children among the femalechildren of respondents, Respondents' self perception as a parent, History ofabuse of respondents' female children by outsiders
a.
Dependent Variable: Genderb.
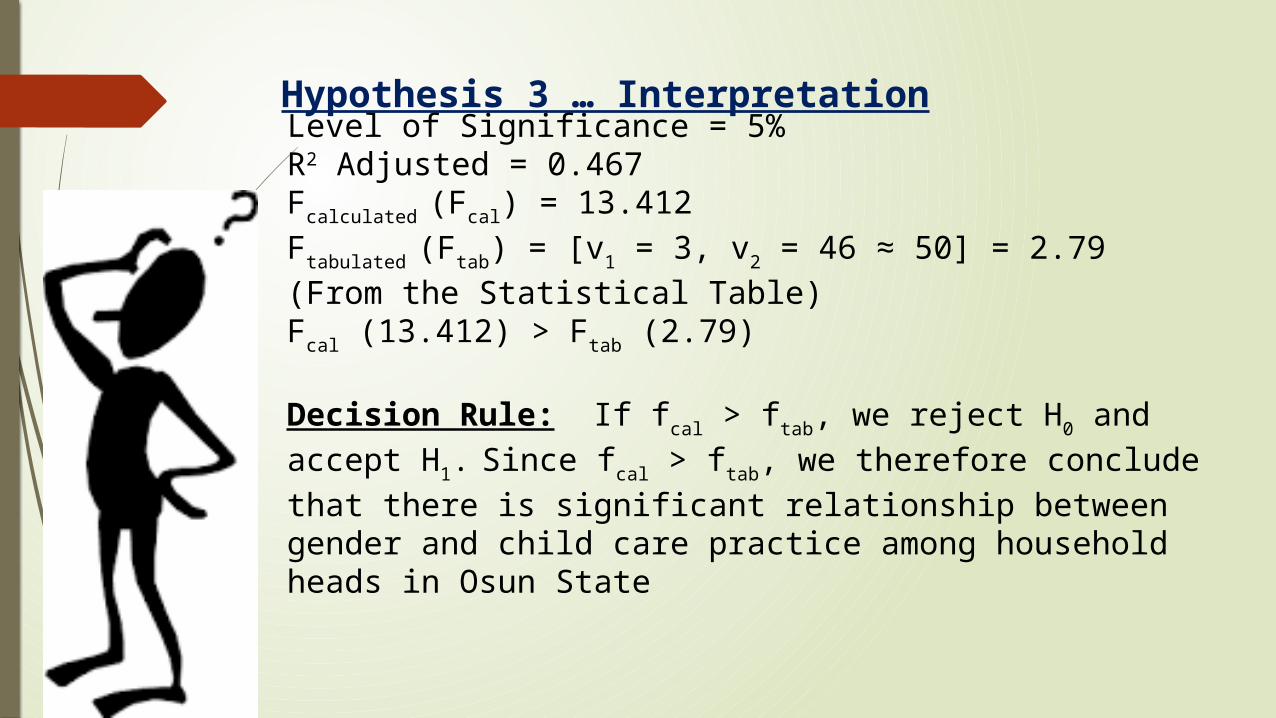
Hypothesis 3 … InterpretationLevel of Significance = 5%R2 Adjusted = 0.467Fcalculated (Fcal) = 13.412Ftabulated (Ftab) = [v1 = 3, v2 = 46 ≈ 50] = 2.79 (From the Statistical Table)Fcal (13.412) > Ftab (2.79)
Decision Rule: If fcal > ftab, we reject H0 and accept H1.
Since fcal > ftab, we therefore conclude that there is significant relationship between gender and child care practice among household heads in Osun State
CONCLUSION We conclude in this study that because what constitute childcare/
abuse cannot be generalized in all its ramifications ; effective discourse and intervention programmes on child care/abuse is only possible if determinants of abuse /care are well investigated. Contrary to apriori expectation, the study did not find any significant relationship between the cultural believe of household heads and their childcare practices in the study area. Nonetheless, a significant relationship was established between the economic status and the perspectives of household heads on childcare. Furthermore, a significant relationship was established between the gender of household heads and their child care practices.
The study recommends the need to broaden the mandate of child care intervention programmes and policy to include empowerment programmers for parents of vulnerable children, since the economic status of individuals has been proven to be an important determinant of child care. Furthermore , the capacity of female head of households should be developed to deliver effective child care practices