Embed Size (px)
Citation preview
Determinants of education expenditures and private vs. public divide in educational outcomes in Turkey
Elif Öznur Acar, Cankaya University
Seyit Mümin Cilasun , Atilim University
Burak Günalp, Hacettepe University
July 26, 2015
ERF, Cairo

1.Introduction
Turkey has a demographic window of opportunity
• working age population will rise until 2040s.• absorbing the new entrants into the labor market• high-quality education became crucial
Turkey’s educational outlook is still bleak
• Average years of schooling is 7 years• Low enrollment rates, but climbed rapidly after 1997• Poor PISA performance• Equity issues in access to education
2
Chapter 1: IntroductionDeterminants of education expenditures in Turkey Introduction
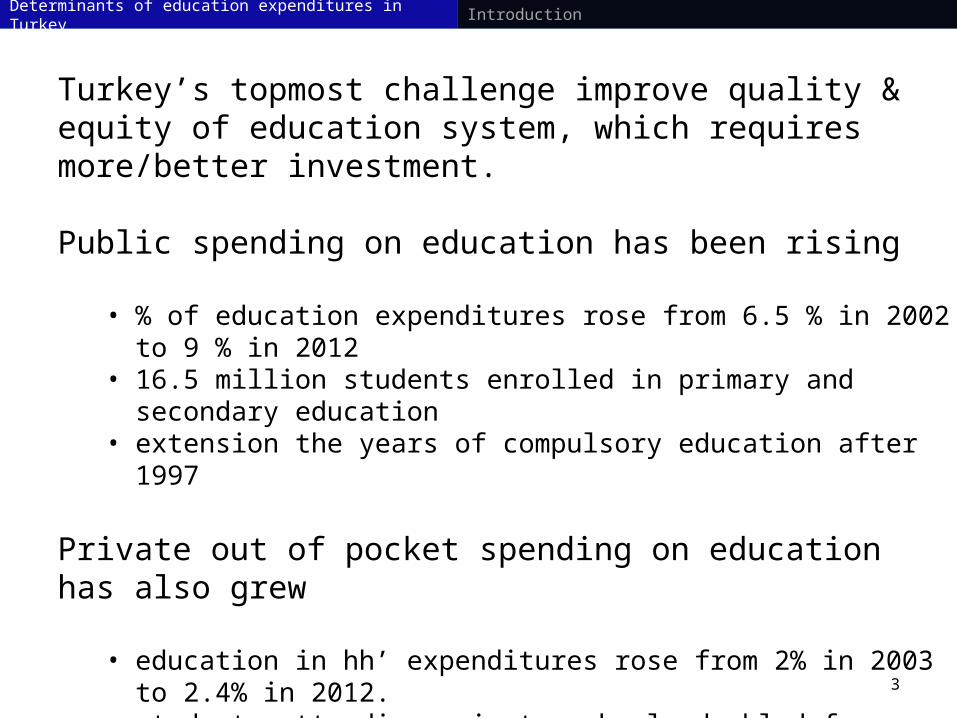
Turkey’s topmost challenge improve quality & equity of education system, which requires more/better investment.
Public spending on education has been rising
• % of education expenditures rose from 6.5 % in 2002 to 9 % in 2012
• 16.5 million students enrolled in primary and secondary education
• extension the years of compulsory education after 1997
Private out of pocket spending on education has also grew
• education in hh’ expenditures rose from 2% in 2003 to 2.4% in 2012.
• students attending private schools doubled from 1.7% to 3.3%
• private schools rose from 2.7% to 6.5% over 2002-2011 period.
• private schooling could aggravate the already low levels of intergenerational mobility in education and income
3
Chapter 1: IntroductionDeterminants of education expenditures in Turkey Introduction

4
Motivation, method and contributions• Motivation
• To investigate the determinants of household expenditures• To see whether income elasticity of education expenditures changed
• Method
– 2003, 2007, 2012 Household Budget Survey data– Tobit regression of education expenditures by income groups using a # of
household characteristics
• Contribution• Focus on demand for education, determinants of educ. expenditures • Adds to the limited literature on Turkey• Use Tobit model which considers possible left-censoring in the data
Determinants of education expenditures in Turkey Motivation, methodolgy and contributions

5
2. Overview of Education Policies in Turkey
Determinants of education expenditures in Turkey Overview of Education Policies in Turkey
0102030405060708090100
0
10
20
30
40
50
60
Popula
tion (
million)
Fert
ilit
y and m
ort
ality
rate
s(p
er
1000 p
eople
)
Population
Fertility rateMortality rate
0
20
40
60
80
100
Dependency rate (% of working age population)Fertility and mortality rates, population
• Youthful population of 77.7 m with 24.3 percent of its people <15 years old
• Undergoing a demographic transition process• Potential for demographic dividend between 2005 and 2040

6
Determinants of education expenditures in Turkey Overview of Education Policies in Turkey
3732
2928 36
35
24
43
38
48
17
45
65
42
21
4244
30
22
16
20
40
15
43
5814
1919
28
21
47
2362
58
1246
10
28
10
3898
60
64 26
15
2072
44
52
20
18
14
1841
51
43
13
41
37
43
36
7
2737
53
36
72
36
27
4025
36
10
41
39
42
34
3523
37
34
16
24
196260
3344
16
35
40
432241
23
20
42
21
TertiaryUpper secondary or post-secondary non-tertiaryBelow upper secondary
2
58
4452
29
45
4464
4235
6 30
7
6
12
65
6
11
Slovenia
Netherlands
Finland
Korea
Belgium
Slovak RepublicCzech Republic
Ireland
Sweden
Canada
France
Denmark
Austria
United States
United KingdomLuxembourg
Germany
OECD - Average
NorwayHungary
Israel
Australia
Switzerland
PolandEstonia
New ZealandIceland
PortugalMexico
Italy
31
Spain
14
Greece
Turkey
45
41
43
25
41
23
18
47
4340
25
67
2137
4123
3339
29
16
3941
50
27
44
35
52 22
9
2431
40
5113 57
37
30
645
14
9
39
43
9
4745
40
15
27
10
57
52
46
47
17 43
4836
3814 38
1340
36 5118 41
18 47
15
3125
561113
46
48
64
42
25-64 year-olds 25-34 year-olds

7
Determinants of education expenditures in Turkey Overview of Education Policies in Turkey
• Turkish modernization: state-centric educational project– The Law for the Unification of Education, 1924
• Compulsory primary education from 5 to 8 years, 1997– to enhance education opportunities for all children
• Decentralization reform, 2004 – local authorities given increased roles and
responsibilities
• “Constructivist education reform”, 2005– extension of the secondary school from 3 to 4 years– implementation of a new curriculum for elementary
education– net schooling rate in primary education: 98.7% in 2011-
2012– net enrollment rate for secondary education increased
• “4+4+4 Law”, 2012 – compulsory education is extended to 12 years, 3 levels of 4
years – students can enter technical or vocational schools in 5th
grade– age of entry to primary school is lowered to 66 months

8
• Critical challenges await on quality and equity issues Determinants of education expenditures in Turkey Overview of Education Policies in Turkey
636669
53
4247
51
293538
46
21
0
10
20
30
40
50
60
70
AverageScienceReading Math
2003 2009 2012
430 427
451 452
415421
440 444
505500 501 499
495489 490 489
400
420
440
460
480
500
520
2003 2006 2009 2012
TR-Boys TR-Girls
OECD Average-Boys OECD Average-Girls
423 424
445448
441447
464
475
454
463
400
410
420
430
440
450
460
470
480
2003 2006 2009 2012
Math Reading Science
Mean PISA scores in Turkey, by test
Mean PISA scores, by genderGap between Turkey and OECD average
Note: 40 points in PISA are equivalent one school year
52.2 52.1
42.1 42
36.8
32.2
24.521.6
46.6
30
26.4
10
15
20
25
30
35
40
45
50
55
60
2003 2006 2009 2012
Math Reading Science
Share of low achievers ( Below Level 2)in Turkey%
Gap
in P
ISA
poi
nts
wit
h O
EC
D
9
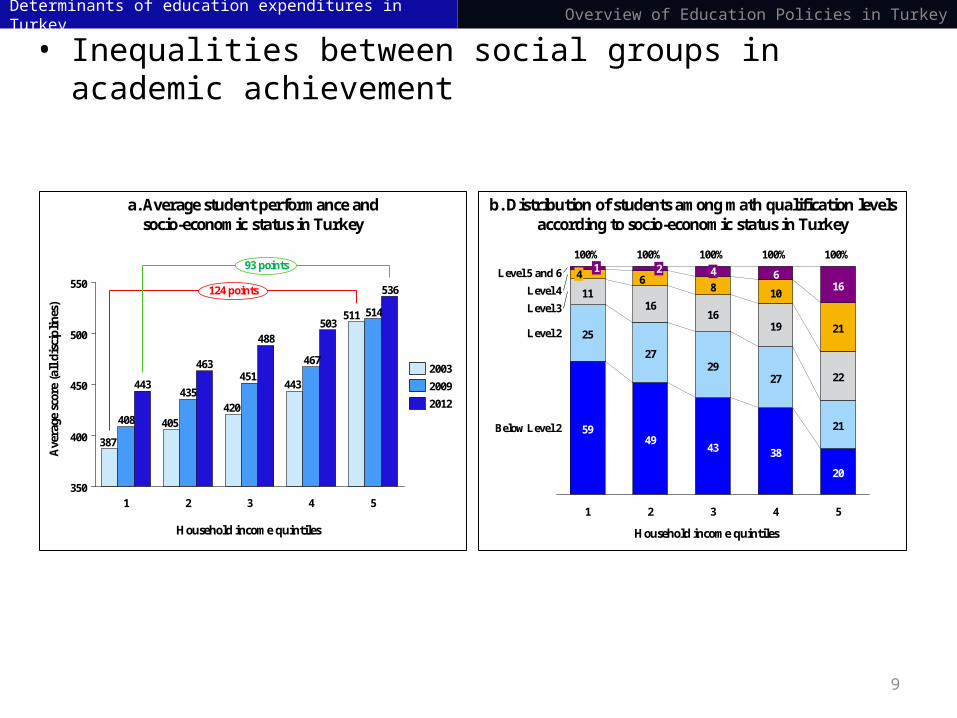
• Inequalities between social groups in academic achievement
Determinants of education expenditures in Turkey Overview of Education Policies in Turkey
511
443
420405
387
514
467
451
435
408
536
503488
463
443
350
400
450
500
550
3
93 points
1 542
124 points
2003
2012
2009
Ave
rage
sco
re (
all d
isci
pli
nes
)
Household income quintiles
25
27
1116
16
20
384349
59 21
2729
22
19 21
1086
166
Below Level 2
21100%
4
Level 4
3
Level 3
1
Level 5 and 6
2
100%
Level 2
100% 100%
4
100%
5
4
Household income quintiles
b. Distribution of students among math qualification levels according to socio-economic status in Turkey
a. Average student performance andsocio-economic status in Turkey
10
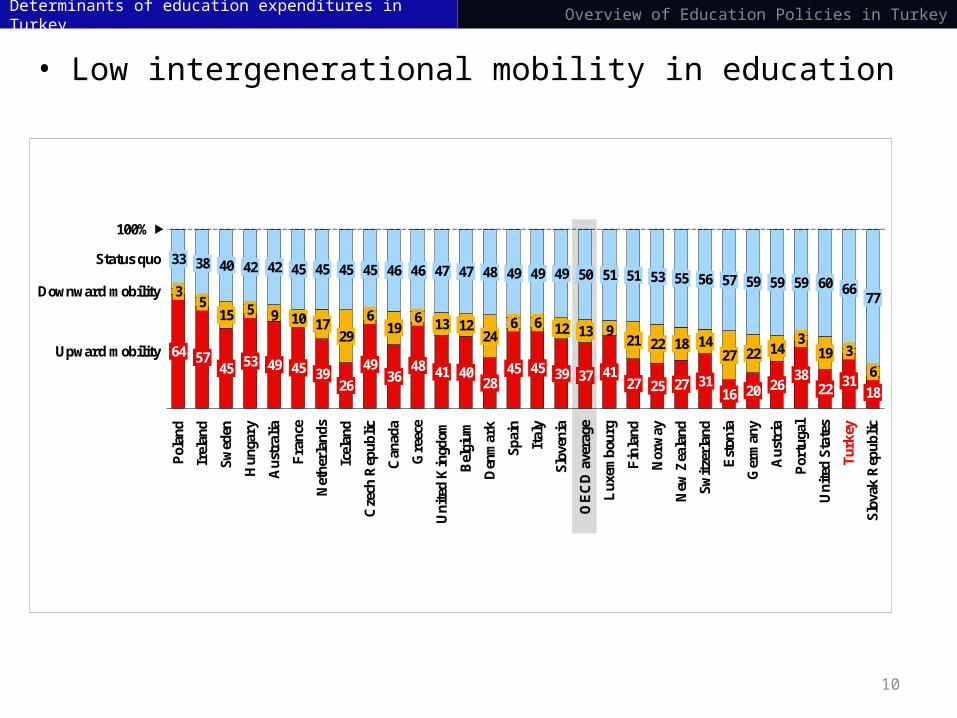
• Low intergenerational mobility in education
Determinants of education expenditures in Turkey Overview of Education Policies in Turkey
99
50
27
Lux
embo
urg
37
21
OE
CD
ave
rage
13
41
5151
4828
Bel
gium
Gre
ece
46
Can
ada
13
46
36
19
Cze
ch R
epub
lic
49 41
Den
mar
k
48
40
47
2412
Uni
ted
Kin
gdom
6
47
45 39
49
126
49
6
45
Spai
n
49
Ital
y
53
5
Swed
en
Irel
and
Pol
and
Status quo
Downward mobility
45
15 5
57
38 40
3
64
42
Upward mobility
33
Net
herl
ands
45
45
Icel
and
3949
45
6
45 45
17
Fra
nce
10
Aus
tral
ia42
Hun
gary
26
29
Nor
way
53
20
27
57
31
1414
56 59
New
Zea
land
22
Slov
enia
26
Swit
zerl
and
27
Ger
man
y
18
59
Est
onia
16
55
25
22
Fin
land
Aus
tria
18
100%
Uni
ted
Stat
es
77
Tur
key
22
60
Slov
ak R
epub
lic
31
66
Por
tuga
l
59
38 619
33

11
Determinants of education expenditures in Turkey Overview of Education Policies in Turkey
• Education expenditures increased both in absolute terms and as a share of central government budget since 2003
• Most was spent on building schools and classrooms
• Still, education expenditure per student both in primary and secondary level are lower than the OECD average.
• The share of private sources in education expenditures is higher than most OECD countries.
• The high share of private sources in total education expenditures is due to the dual institutional structure– public schools vs. private schools and dershanes– # of students attending private schools in total has
increased from 231,000 in 2003 to 651 in 2014

12
3. Survey of Literature
• Psacharopoulos, Arieira and Mattson (1997)
• Kanellopoulos and Psacharopoulos (1997); Psacharopoulos and Papakonstantinou (2005)
• Hashimoto and Health (1995)
• Qian and Smyth (2011)
• Glewwe and Patrinos (1999); Glewwe and Jacoby (2004); Huy (2012)
• Tansel (2002); Tansel and Bircan (2006); Smits and Hoşgör (2006); Hisarcıklılar, McKay and Wright (2010)
Survey of LiteratureDeterminants of education expenditures in Turkey
13
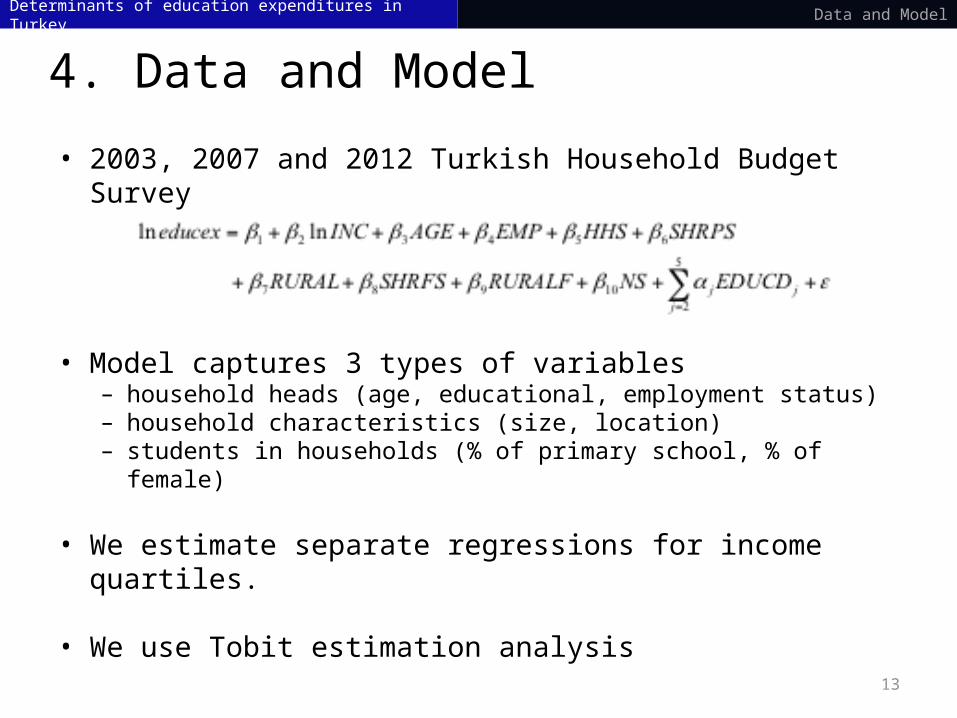
4. Data and Model
• 2003, 2007 and 2012 Turkish Household Budget Survey
• Model captures 3 types of variables– household heads (age, educational, employment status)– household characteristics (size, location)– students in households (% of primary school, % of female)
• We estimate separate regressions for income quartiles.
• We use Tobit estimation analysis
Determinants of education expenditures in Turkey Data and Model
14
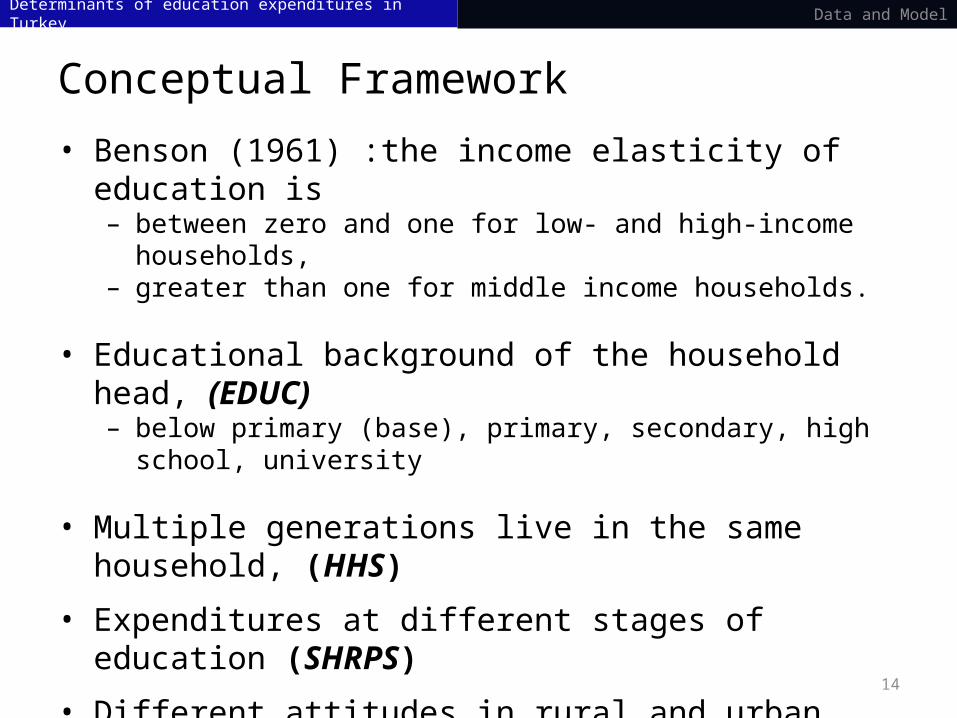
Conceptual Framework
• Benson (1961) :the income elasticity of education is– between zero and one for low- and high-income
households, – greater than one for middle income households.
• Educational background of the household head, (EDUC)– below primary (base), primary, secondary, high school,
university
• Multiple generations live in the same household, (HHS)
• Expenditures at different stages of education (SHRPS)
• Different attitudes in rural and urban areas (RURAL)
• Negative attitude towards girls’ (SHRFS), (RURALF)
• Control for the total # of students in the household (NS)
Determinants of education expenditures in Turkey
Turkey
Data and Model

15
Determinants of education expenditures in Turkey
Turkey
Summary Statistics
Data and Model
2003 2007 2012Variable
1st Q 2nd Q 3rd Q 4th Q 1st Q 2nd Q 3rd Q 4th Q 1st Q 2nd Q 3rd Q 4th Q
reeleducexp 44.90 93.06 186.88 542.56 68.48 205.24 328.29 947.31 114.72 201.16 335.25 1131.41
reely 2444.06 4271.59 6594.85 15334.93 4081.18 7410.28 11280.32 22427.89 4677.02 8095.98 12237.35 25977.23
educd1 0.19 0.10 0.07 0.04 0.25 0.09 0.04 0.04 0.19 0.09 0.04 0.03
educd2 0.65 0.59 0.46 0.33 0.59 0.59 0.48 0.33 0.59 0.52 0.41 0.23
educd3 0.09 0.13 0.13 0.10 0.08 0.12 0.12 0.10 0.11 0.15 0.13 0.09
educd4 0.07 0.15 0.23 0.26 0.07 0.16 0.23 0.27 0.10 0.19 0.25 0.22
educd5 0.00 0.02 0.10 0.27 0.01 0.03 0.13 0.26 0.01 0.05 0.16 0.42
age 41.74 43.26 44.04 45.09 42.32 43.61 44.36 44.71 44.02 44.11 45.10 45.24
emp 0.77 0.76 0.81 0.84 0.75 0.78 0.80 0.84 0.71 0.77 0.80 0.84
hhsize 5.28 4.99 4.90 4.80 5.22 4.89 4.66 4.61 4.61 4.43 4.29 4.26
primshare 0.83 0.78 0.74 0.71 0.87 0.79 0.74 0.70 0.76 0.72 0.65 0.66
rural 0.39 0.31 0.23 0.19 0.48 0.34 0.22 0.14 0.44 0.30 0.25 0.16
girlshare 0.39 0.36 0.35 0.34 0.45 0.47 0.48 0.46 0.45 0.47 0.48 0.47
totalstu 1.61 1.47 1.36 1.21 1.78 1.55 1.37 1.21 1.64 1.47 1.27 1.10

16
5.Estimation Results
• lnINC is significant for all years and income quartiles – a peak in the middle income quartiles and a decrease at
both ends of the income distribution • For the 1st quartile, H0: ε=1 is rejected at the 5 %
level of significance in 2003 and 2007, not in 2012. • For the 2nd quartile, ε >1 for all years. • For the 3rd quartile, ε is not significantly different
from 1 in 2003 and 2007, and statistically insignificant in 2012.
• For the 4th quartile, ε is not different from one in 2003 and 2007, while for 2012 it is statistically significantly >1
Determinants of education expenditures in Turkey
Turkey
Estimation Results

17
• Income elasticity of education increases over time for all.
• Head’s education has an increasingly positive effect – For the upper middle income and the top income
quartiles, the coefficients of EDUCD4 and EDUCD5 are always significant
– for the 2nd quartile in 2007, all households with a graduate head spend more than households whose heads lack a diploma
– in all income quartiles in 2012, household heads with a high-school degree invest more in education than those without any education
• HHS is highly significantly negative in all estimations.
• SHRPS is insignificant in almost all estimations.• Households in the urban areas spend more on
education than those in the rural areas in 2003. – In 2007, this finding weakens and holds only for lower-
income families; and in 2012, the coefficient of RURAL turns out to be insignificant for all income quartiles
Determinants of education expenditures in Turkey
Turkey
Estimation Results

18
Questions?