Embed Size (px)
Citation preview
# Oxford University Press 2006 Oxford Economic Papers (2006), 16 of 44All rights reserved doi:10.1093/oep/gpl024
The determinants of the global digitaldivide: a cross-country analysis ofcomputer and internet penetration
By Menzie D. Chinn* and Robert W. Fairliey
*Robert M. La Follette School of Public Affairs; and Department of Economics,
University of Wisconsin, 1180 Observatory Drive, Madison, WI 53706–1393, USA,
and NBER; e-mail: [email protected]
yDepartment of Economics, University of California, Santa Cruz, CA 95064, USA;
e-mail: [email protected]
To identify the determinants of cross-country disparities in personal computer and
internet penetration, we examine a panel of 161 countries over the 1999–2001 period.
Our candidate variables include economic variables (income per capita, years
of schooling, illiteracy, trade openness), demographic variables (youth and aged
dependency ratios, urbanization rate), infrastructure indicators (telephone density,
electricity consumption), telecommunications pricing measures, and regulatory
quality. With the exception of trade openness and the telecom pricing measures,
these variables enter in as statistically significant in most specifications for computer
use. A similar pattern holds true for internet use, except that telephone density and
aged dependency matter less. The global digital divide is mainly—but by no means
entirely—accounted for by income differentials. For computers, telephone density and
regulatory quality are of second and third importance, while for the Internet,
this ordering is reversed. The region-specific explanations for large disparities in com-
puter and Internet penetration are generally very similar. Our results suggest that
public investment in human capital, telecommunications infrastructure, and the
regulatory infrastructure may mitigate the gap in PC and Internet use.
JEL classifications: O30, L96.
1. IntroductionThe study of how new technologies have diffused throughout the economy
has been, and remains, a field of intense activity. Recent events, including the
acceleration of productivity growth in the United States since 1995, have only
served to heighten interest in this area since the acceleration appears to be
connected with greater investment in information and communication tech-
nologies (ICTs). The consensus view is that the acceleration in productivity
growth has been manifest at both the country and firm level of analysis
(Jorgenson, 2001). Admittedly, some debate remains over the exact origins
Oxford Economic Papers Advance Access published December 3, 2006
of the improved performance. While several studies have cast a skeptical eye
upon the ICT-productivity story (DiNardo and Pischke, 1997; Gordon, 2000),
the preponderance of the literature attributes the improvement to the introduction
of new technologies (Autor, et al., 1998; Council of Economic Advisers, 2001;
Brynjolfsson and Hitt, 2003).
Interest in the global diffusion of technology has also been spurred by arguments
that it may increase knowledge diffusion through improving communication
efficiency (e.g. Jovanovic and Rob, 1989), improve political engagement (Norris,
2001), and allow developing countries to ‘leapfrog’ traditional methods of increas-
ing productivity (Steinmueller, 2001). In this light, the striking international
differences in information and communication technology (ICT) diffusion that
exist today, often referred to as the ‘Global Digital Divide,’ may pose a serious
challenge to policymakers. Many developing countries have computer and Internet
penetration rates that are 1/100th of the rates found in North America and Europe.
For example, there are less than six personal computers per 1000 people in India,
whereas more than six out of ten people in the United States own a computer
(ITU, 2003).
Although these differences in technology diffusion may have substantial
economic consequences, the empirical literature aimed at identifying the causes
is limited. A few factors have been identified as being important, such as differ-
entials in income, human capital, regulatory effectiveness, and telecommunications
infrastructure (see Dasgupta et al., 2001, and Wallsten, 2005, for example), but
a definitive study is lacking. We remedy this deficiency in the literature with a
comprehensive econometric analysis of the determinants of computer and Internet
use that spans both developed and developing countries and includes a wide-range
of economic, demographic and policy factors. Most previous studies have been
limited in scope, either adopting a regional focus, or considering only a small
set of variables.
Our paper also provides the following innovation: in addition to isolating the
empirical determinants of computer and Internet use, we undertake a systematic
analysis of the relative importance of different factors in contributing to the
global digital divide. Borrowing from a technique commonly used to decompose
earnings gaps between groups (Blinder, 1993 and Oaxaca, 1993), we estimate
separate contributions from regional differences in income, human capital,
telecommunications infrastructure, and other factors.
The contribution results will allow us to directly address several issues that have
been discussed in the literature. One key question is the relative importance of
income in explaining the international digital divide. Many studies find a strong
positive relationship between technology use and income across countries and
within countries (see OECD 2001; US Department of Commerce, 2002; and
Quibria, et al., 2003, for example), while some point to other factors—such
as telecommunications access and pricing—as being of major importance (Mann
et al. 2000; and Dasgupta, et al., 2001).
m. d. chinn and r. w. fairlie 17 of 44
Another set of questions is prompted by findings in the recent growth literature
that highlight the roles of human capital and institutional factors. The channels
through which these factors affect growth are difficult to discern, but it is likely
that both exert at least some influence on the rate at which new technologies
are adopted.1 Hence, the first question is how important is human capital for
creating demand for information and communication technology services?
Computers may require substantial levels of education for use, but telephones
and the Internet may require very little, according to Dasgupta, et al. (2001).
Another question pertains to the impact of institutional regimes. Do factors
such as legal protections and regulatory quality matter even after accounting
for income? Wallsten (2005), among others, has focused on this issue.
To anticipate our results, we find that while income per capita is important
in explaining the digital divide, so too are factors such as the communication
infrastructure (as measured by telephone mainlines density), access to electricity,
the institutional environment in the form of regulatory efficacy and the protection
of property rights, and demographic characteristics. These findings inform our
conclusions regarding the first two hypotheses: the income per capita differential
accounts for the single most important component of the digital divide, but it
is not by any means the only component. Differences in the telecommunications
infrastructure are also important, but are not terribly important for the Internet
digital divide—rather it is more critical to the computer divide.
Additional results include a negative impact of urbanization on Internet use,
and perhaps most interestingly, a large (positive) impact of regulatory quality or
property rights on the Internet digital divide.2 The latter suggests that the diffusion
of the Internet may be particularly dependent upon the quality of institutions
prevailing in an economy. Finally, the results for demographic controls suggest
that the global digital divide would be even larger if developing countries had
an age composition that was more similar to the United States.
2. Surveying the literatureTo our knowledge, there are no systematic cross-country econometric analyses
of the determinants of PC and Internet use, spanning both developed and devel-
oping countries, and a period including the last few years. Many of the extant
studies have a regional focus, especially when assessing the spread of Internet use.
One of the most extensive cross-country studies of personal computer adoption
is by Caselli and Coleman (2001). They examine a dataset encompassing up
..........................................................................................................................................................................1 The literature ascribing a role to human capital is too voluminous to cite; the canonical references
include Barro (1991), whereas a recent survey is Temple (2001). For institutional factors, see Hall
and Jones (1999), Acemoglu et al. (2001), and Rodrik et al. (2004).2 These results contrast with those in Dedrick et al. (2003). Over the 1985–95 period, they find that aside
from the structure of the economy, per capita income, telecommunications infrastructure and human
capital, other factors do not matter substantially in the determination of ICT use for 31 countries.
18 of 44 the global digital divide
to 89 countries over the years 1970–90, focusing on the computer imports/worker
ratio, as a proxy measure for the investment in ICT. In attempting to explain
the variation in this variable, they rely upon a large set of variables, including
income per worker, investment per worker, structural descriptors (the sectoral
shares of agriculture and manufacturing), human capital, imports and exports
from and to the OECD. They also include an institutional variable, in this case
an index of property rights. Openness to imports from OECD countries, the level
of educational attainment, and the index of property rights are three notable
variables than enter with statistical significance.
Pohjola (2003) studies observed investment in information and communication
technology in 49 countries over a more recent period, 1993–2000. He regresses
ICT investment per capita on income per capita, the relative price of ICT equip-
ment, human capital measures, the share of agriculture and openness to inter-
national trade. In addition to finding the typically high elasticity of ICT
investment with respect to income (around unity), he also detects a major
role for human capital and a negative impact of agriculture’s importance in
the economy.3
As a more recent technological innovation, there are far fewer examples of
cross-country analyses of the determinants of Internet use. One cross-country
study was conducted by Dasgupta, et al. (2001). They examine Internet use in
a sample of 44 countries, spanning both OECD and developing countries, from
1990 to 1997.4 Their variable of focus is the Internet to telephone mainlines
ratio as a dependent variable. The growth rate in this variable over the sample
period is related to initial (1990) values of the Internet to telephone mainlines
ratio, the urban population, income per capita, and an index of competition
policy, as well as some regional dummies. The results—including a negative
impact of income per capita—are somewhat difficult to interpret for a number
of reasons. First, the sample period is quite early—1990–97. Even at the end
of the sample, many countries still had very low levels of Internet penetration,
so the lessons that one can draw from the analysis are tentative. Second,
the inclusion of regional dummies complicates the interpretation of the income
variable coefficient.5
Kiiski and Pohjola (2002) examine a more recent sample, 1995–2000, and use
a more conventional measure of the Internet—namely Internet hosts per 1000
inhabitants. In a broad sample encompassing about sixty OECD and developing
..........................................................................................................................................................................3 Unlike other cross country studies, a price variable is included, and enters into the regressions
with statistical significance. However, since the price variable is the same for all countries in the
panel (the US deflator for computer purchases), it is unclear what interpretation to attribute to this
result. The price index is highly trended (downward) so the inclusion of the price index probably
mimics that of a time trend.4 See Hargittai (1999) for an analysis of per-capita Internet hosts across a sample of 18 countries in 1998.5 In addition, the dependent variable is somewhat unconventional: internet subscribers expressed as
a ratio to telephone mainlines. This implies a long run unitary elasticity of subscribers to phone lines.
m. d. chinn and r. w. fairlie 19 of 44
countries, the five year growth in this variable is related to income per capita,
telephone access costs, and the average years of schooling. More recently, focus
has switched to policy related variables. Most recently, Wallsten (2005) examines
a developing country sample of 45 countries in 2001. He relates Internet users and
Internet hosts to the standard variables as well as measures of regulatory regime
characteristics, including agency independence, transparency, and discretion.
Price regulation is also examined. One problem in interpretation arises from the
use of PCs per capita variable as a control variable. The inclusion of this variable
raises the possibility of simultaneity bias, among other things.
One interesting study with a regional focus is APEC (2002).6 The 21 economies
of APEC span a wider set of income per capita than those found in other studies,
and hence may be more informative than more regionally focused studies.7
APEC (2002) finds the user access cost (the cost of a 3 minute local call), political
freedom, income per capita in 1995 US dollars, an urban population proportion,
adult literacy rate, and the share of service valued added in GDP as statistically
important determinants. Access charges and the lack of political freedom
are negatively associated with Internet penetration, while income per capita, the
urban ratio, literacy, and a large service sector share are all positively associated.8
In a related line of research, recent studies have explored the determinants of the
digital divide between demographic groups within countries. For example, using
microdata from the US Current Population Survey, a few recent studies have
explored the causes of the digital divide across racial groups (Novak and
Hoffman, 1998; US Department of Commerce, 2000, and Fairlie, 2004). Racial
disparities in access to computers and the Internet appear to be primarily,
but not entirely, due to disparities in income and education, and language
barriers. Research using microdata from other countries suggests that income
and education are important determinants of computer ownership and Internet
use, and thus may contribute to digital divides within those countries (see for
example, OECD, 2001, for several countries; Primrose, 2003, for Australia;
Singh, 2004 for Canada; and Ono and Zavodny, 2004, for Japan).
Note that in none of the previous studies has there been a quantification of
the relative importance of different factors in explaining the digital divide.
That is, while there are a number of studies that relate per capita computer stock
and Internet penetration to purported determinants, or discuss the statistical
significance of the estimated coefficients, none of them decomposes the gaps
..........................................................................................................................................................................6 There are a number of additional studies that have a distinctly regional focus. See Estache et al. (2002),
who focus on Latin America. Mann and Rosen (2001) examine the Asia-Pacific economies, while
Oyelaran-Oyeyinka and Lal (2003) study the African experience.7 The United States has the highest income per capita in the grouping, at $31,600 in 2001, while Papua
New Guinea has the lowest at $897; the economies are located in both of the Americas, Asia, and
Oceania.8 The supporting study by Liu and San (undated) reports similar results for a broader sample, using a
Gompertz specification of technology diffusion.
20 of 44 the global digital divide
between, say, the United States and Africa, into portions attributable to regulatory
differences, or to telephone density.
3. DataData on technology use and telecommunications are from the International
Telecommunications Union’s (ITU) World Telecommunication Indicators
Database. The data are obtained primarily through annual questionnaires admini-
stered by the Telecommunications Development Bureau (BDT) of the ITU.
Supplemental information is obtained from reports from telecommunication
ministries, regulators, operators, and ITU staff. Detailed data are available on
telephone, personal computer, Internet, and other telecommunications and
electronics use. The ITU data also contain detailed information on telephone costs.
Computer and Internet penetration rates analysed below are derived from
the number of personal computers and Internet users per 100 people. These
measures of technology use from the ITU are the only ones available for a large
number of countries over the past several years. However, they may suffer from
three notable limitations. First, the number of personal computers may understate
the total use of computers in some countries in which mainframe computers are
prevalent (World Bank, 2003). This is probably less of a concern, however, focusing
on more recent data with the rise of networked PCs. Second, there is no informa-
tion on the quality of computers. Cross-country differences in the quality and
number of high-quality computers per person are likely to be large and possibly
larger than simple counts of the number of computers. Finally, the number of
Internet users is based on reported estimates of users, derivations from reported
Internet Access Provider (ISP) subscriber counts, or calculated by multiplying the
number of Internet hosts by an estimated multiplier. Thus, Internet use may
be understated, particularly in developing countries where many commercial
subscribers rent computers connected to the Internet (World Bank, 2003).9
The primary source for data on demographics, income, and other variables
included in the regression analysis is the World Bank’s World Development
Indicators database. We also use indices of rule of law and regulatory quality
drawn from the World Bank’s Governance Indicators database. The construction
and attributes of these indicators are described in much greater detail in Kaufmann
et al. (2003). Our primary measure of human capital, average years of schooling,
is derived from the World Bank’s Edstats. More details on all variables included
in the analysis are provided in the Appendix.
..........................................................................................................................................................................9 Estimates of the number of Internet hosts in a country may also have measurement problems
because they are based on country codes and do not necessarily capture the physical location of
the host. Furthermore, hosts that do not have a country code are assigned to the United States
(Wallsten, 2005).
m. d. chinn and r. w. fairlie 21 of 44
4. Cross-country differences in computer and Internetpenetration rates
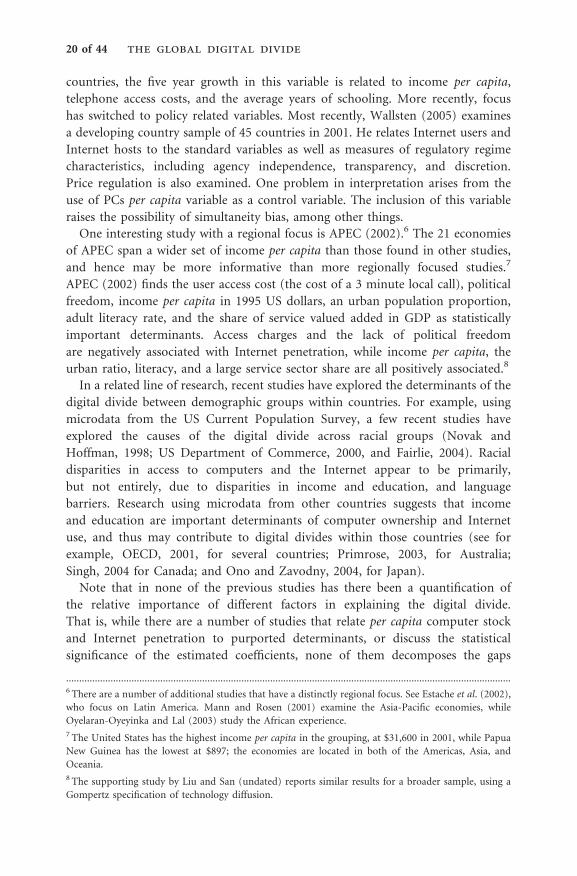
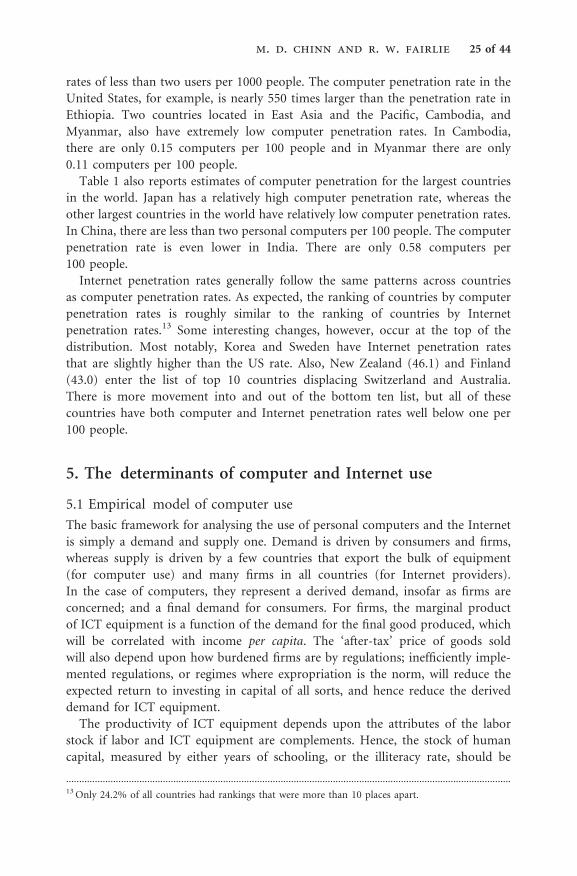
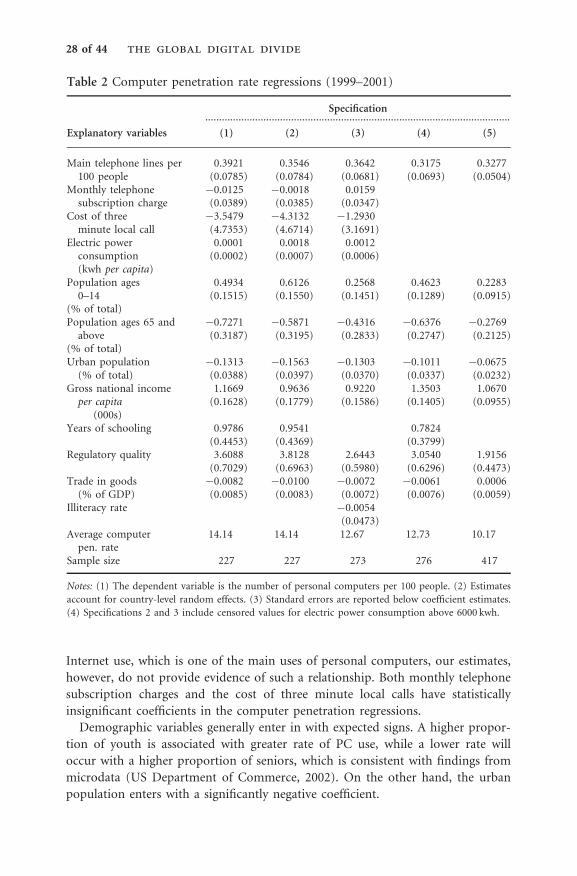
Computer and Internet use has grown rapidly over the past decade. As reported
in Fig. 1, there were only 2.5 personal computers per 100 people in the world in
1990. By 2001, the number of computers per 100 people had climbed to nearly
nine. Internet use grew from essentially zero in the early 1990s to 8.1% of the
world’s population by 2001.
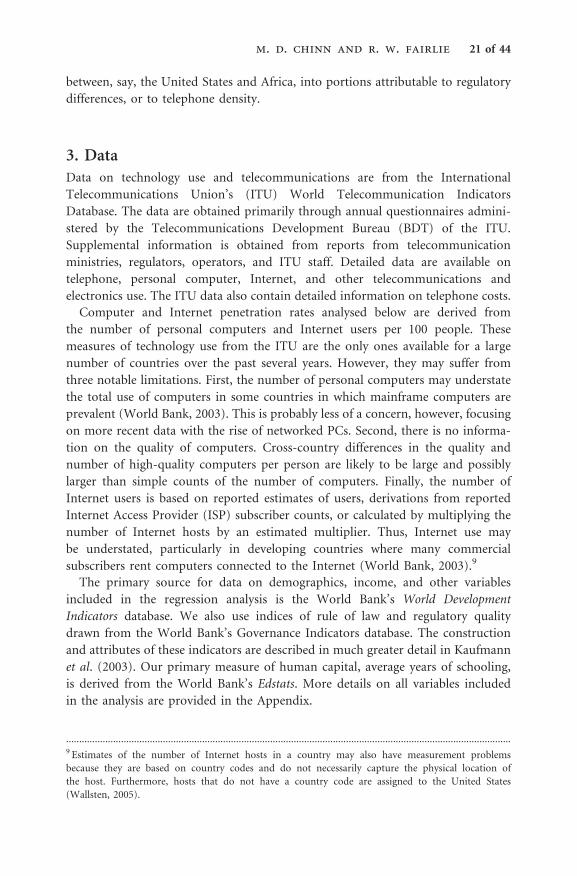
The relatively high current rates of use, however, mask large disparities across
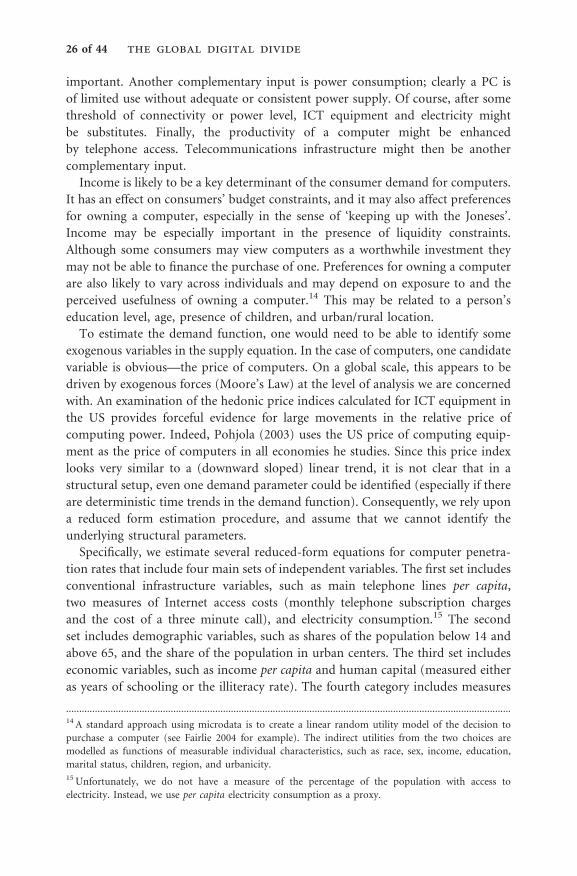
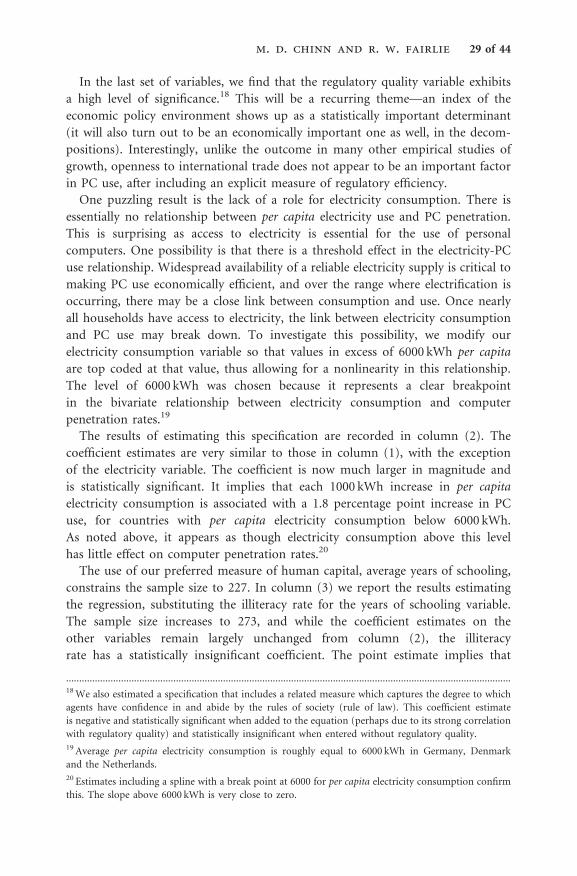
regions of the world.10 Figure 2 reports computer penetration rates by region
in 2001.11 In North America, there are 61.1 computers per 100 people, whereas
there are only 0.5 computers per 100 people in South Asia. Computer penetration
rates in Sub-Saharan Africa are also strikingly low with only 1.0 personal computers
per 100 people. Other regions have higher penetration rates, but none of these is
as large as one-third the North American rate. Even in Europe and Central Asia,
there exist only 18.1 personal computers per 100 people.
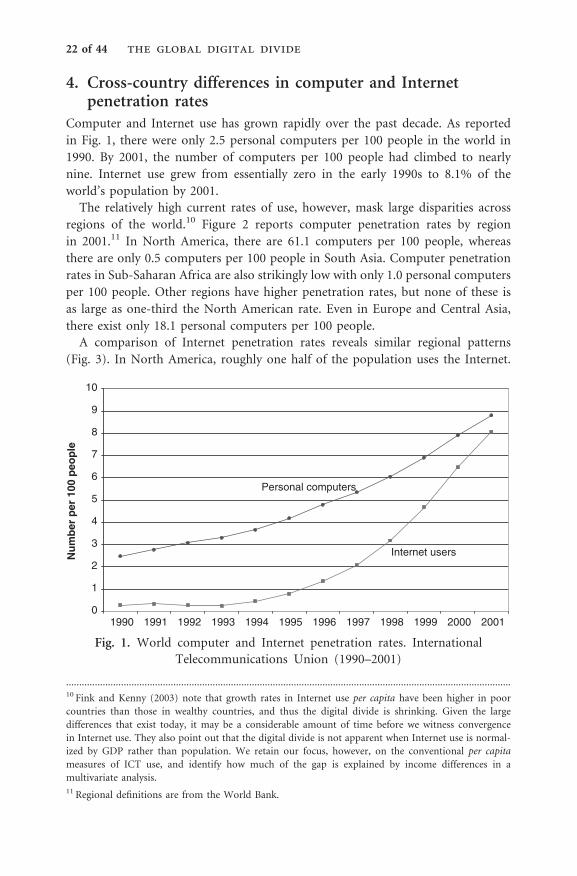
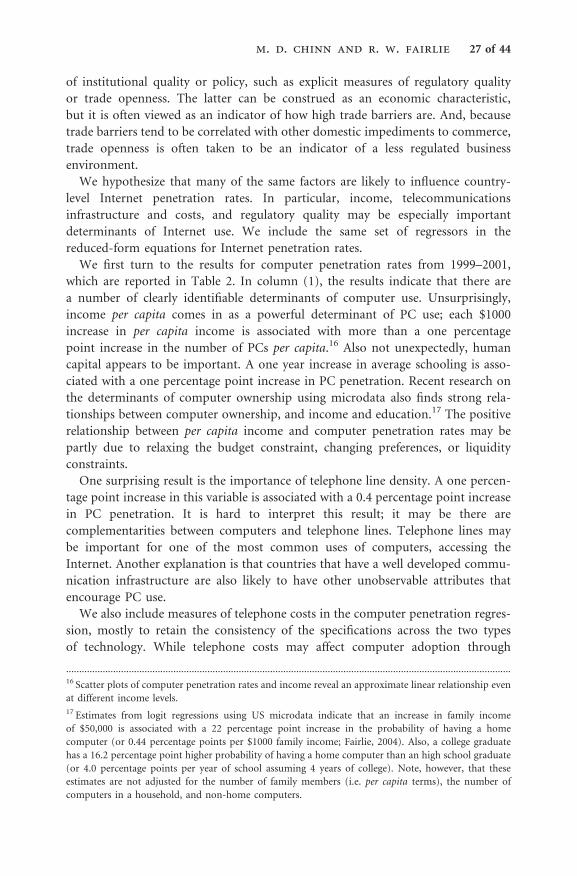
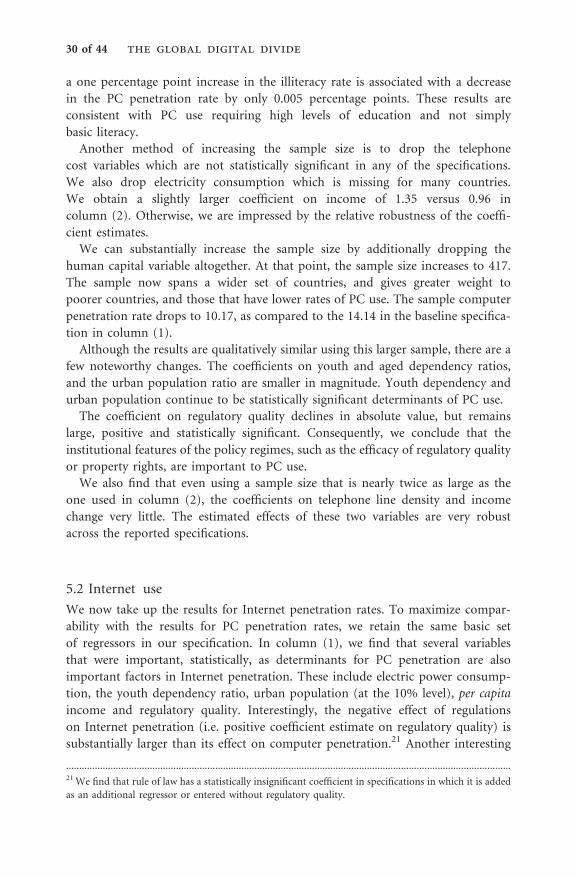
A comparison of Internet penetration rates reveals similar regional patterns
(Fig. 3). In North America, roughly one half of the population uses the Internet.
..........................................................................................................................................................................10 Fink and Kenny (2003) note that growth rates in Internet use per capita have been higher in poor
countries than those in wealthy countries, and thus the digital divide is shrinking. Given the large
differences that exist today, it may be a considerable amount of time before we witness convergence
in Internet use. They also point out that the digital divide is not apparent when Internet use is normal-
ized by GDP rather than population. We retain our focus, however, on the conventional per capita
measures of ICT use, and identify how much of the gap is explained by income differences in a
multivariate analysis.11 Regional definitions are from the World Bank.
0
1
2
3
4
5
6
7
8
9
10
1990 1991 1992 1993 1994 1995 1996 1997 1998 1999 2000 2001
Nu
mb
er p
er 1
00 p
eop
le
Internet users
Personal computers
Fig. 1. World computer and Internet penetration rates. International
Telecommunications Union (1990–2001)
22 of 44 the global digital divide
In contrast, slightly more than one half of one per cent of the population
uses the Internet in South Asia and Sub-Saharan Africa. Internet use is higher
in Europe and Central Asia with 16.5 users per 100 people, but very low in
other regions of the world. Internet penetration rates in East Asia and the
Pacific, Latin America and the Caribbean, and The Middle East and Africa are
only 6.9, 5.0, and 2.4 per 100 people, respectively.
6.1
18.1
5.9 4.0
61.1
0.5 1.00
10
20
30
40
50
60
70
80
90
100
East Asia &Pacfic
Europe &Central Asia
Sub-SaharanAfrica
Per
son
al c
om
pu
ters
per
100
peo
ple
Latin America &Caribbean
Middle East andNorth Africa
North America South Asia
Fig. 2. Regional computer penetration rates. International Telecommunications
Union (2001)
6.9
16.5
5.0 2.4
49.8
0.6 0.70
10
20
30
40
50
60
70
80
90
100
East Asia & Pacfic
Europe &Central Asia
Latin America &Caribbean
Middle East andNorth Africa
North America Sub-SaharanAfrica
Inte
rnet
Use
rs p
er 1
00 p
eop
le
South Asia
Fig. 3. Regional Internet penetration rates. International Telecommunications
Union (2001)
m. d. chinn and r. w. fairlie 23 of 44
Examining computer and Internet penetration rates across countries also reveals
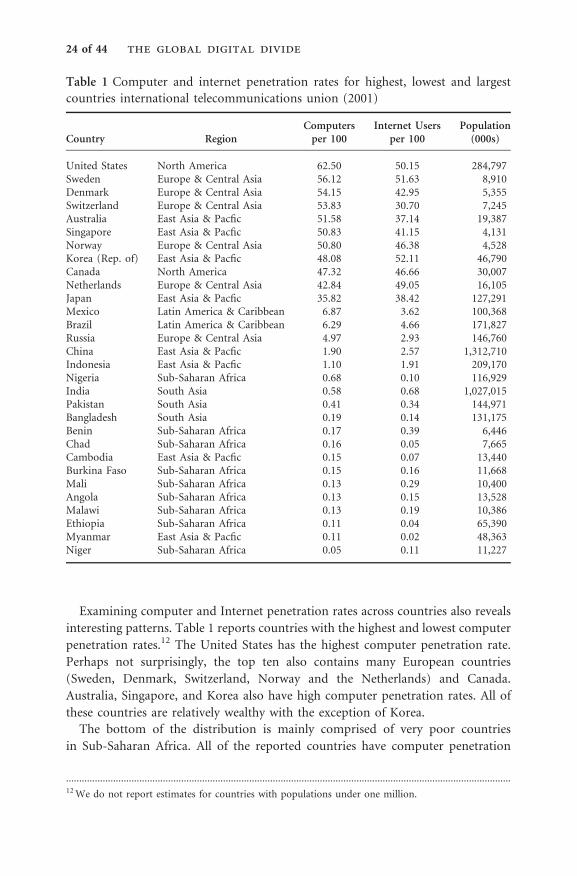
interesting patterns. Table 1 reports countries with the highest and lowest computer
penetration rates.12 The United States has the highest computer penetration rate.
Perhaps not surprisingly, the top ten also contains many European countries
(Sweden, Denmark, Switzerland, Norway and the Netherlands) and Canada.
Australia, Singapore, and Korea also have high computer penetration rates. All of
these countries are relatively wealthy with the exception of Korea.
The bottom of the distribution is mainly comprised of very poor countries
in Sub-Saharan Africa. All of the reported countries have computer penetration
..........................................................................................................................................................................12 We do not report estimates for countries with populations under one million.
Table 1 Computer and internet penetration rates for highest, lowest and largest
countries international telecommunications union (2001)
Country RegionComputersper 100
Internet Usersper 100
Population(000s)
United States North America 62.50 50.15 284,797Sweden Europe & Central Asia 56.12 51.63 8,910Denmark Europe & Central Asia 54.15 42.95 5,355Switzerland Europe & Central Asia 53.83 30.70 7,245Australia East Asia & Pacfic 51.58 37.14 19,387Singapore East Asia & Pacfic 50.83 41.15 4,131Norway Europe & Central Asia 50.80 46.38 4,528Korea (Rep. of) East Asia & Pacfic 48.08 52.11 46,790Canada North America 47.32 46.66 30,007Netherlands Europe & Central Asia 42.84 49.05 16,105Japan East Asia & Pacfic 35.82 38.42 127,291Mexico Latin America & Caribbean 6.87 3.62 100,368Brazil Latin America & Caribbean 6.29 4.66 171,827Russia Europe & Central Asia 4.97 2.93 146,760China East Asia & Pacfic 1.90 2.57 1,312,710Indonesia East Asia & Pacfic 1.10 1.91 209,170Nigeria Sub-Saharan Africa 0.68 0.10 116,929India South Asia 0.58 0.68 1,027,015Pakistan South Asia 0.41 0.34 144,971Bangladesh South Asia 0.19 0.14 131,175Benin Sub-Saharan Africa 0.17 0.39 6,446Chad Sub-Saharan Africa 0.16 0.05 7,665Cambodia East Asia & Pacfic 0.15 0.07 13,440Burkina Faso Sub-Saharan Africa 0.15 0.16 11,668Mali Sub-Saharan Africa 0.13 0.29 10,400Angola Sub-Saharan Africa 0.13 0.15 13,528Malawi Sub-Saharan Africa 0.13 0.19 10,386Ethiopia Sub-Saharan Africa 0.11 0.04 65,390Myanmar East Asia & Pacfic 0.11 0.02 48,363Niger Sub-Saharan Africa 0.05 0.11 11,227
24 of 44 the global digital divide
rates of less than two users per 1000 people. The computer penetration rate in the
United States, for example, is nearly 550 times larger than the penetration rate in
Ethiopia. Two countries located in East Asia and the Pacific, Cambodia, and
Myanmar, also have extremely low computer penetration rates. In Cambodia,
there are only 0.15 computers per 100 people and in Myanmar there are only
0.11 computers per 100 people.
Table 1 also reports estimates of computer penetration for the largest countries
in the world. Japan has a relatively high computer penetration rate, whereas the
other largest countries in the world have relatively low computer penetration rates.
In China, there are less than two personal computers per 100 people. The computer
penetration rate is even lower in India. There are only 0.58 computers per
100 people.
Internet penetration rates generally follow the same patterns across countries
as computer penetration rates. As expected, the ranking of countries by computer
penetration rates is roughly similar to the ranking of countries by Internet
penetration rates.13 Some interesting changes, however, occur at the top of the
distribution. Most notably, Korea and Sweden have Internet penetration rates
that are slightly higher than the US rate. Also, New Zealand (46.1) and Finland
(43.0) enter the list of top 10 countries displacing Switzerland and Australia.
There is more movement into and out of the bottom ten list, but all of these
countries have both computer and Internet penetration rates well below one per
100 people.
5. The determinants of computer and Internet use
5.1 Empirical model of computer use
The basic framework for analysing the use of personal computers and the Internet
is simply a demand and supply one. Demand is driven by consumers and firms,
whereas supply is driven by a few countries that export the bulk of equipment
(for computer use) and many firms in all countries (for Internet providers).
In the case of computers, they represent a derived demand, insofar as firms are
concerned; and a final demand for consumers. For firms, the marginal product
of ICT equipment is a function of the demand for the final good produced, which
will be correlated with income per capita. The ‘after-tax’ price of goods sold
will also depend upon how burdened firms are by regulations; inefficiently imple-
mented regulations, or regimes where expropriation is the norm, will reduce the
expected return to investing in capital of all sorts, and hence reduce the derived
demand for ICT equipment.
The productivity of ICT equipment depends upon the attributes of the labor
stock if labor and ICT equipment are complements. Hence, the stock of human
capital, measured by either years of schooling, or the illiteracy rate, should be
..........................................................................................................................................................................13 Only 24.2% of all countries had rankings that were more than 10 places apart.
m. d. chinn and r. w. fairlie 25 of 44
important. Another complementary input is power consumption; clearly a PC is
of limited use without adequate or consistent power supply. Of course, after some
threshold of connectivity or power level, ICT equipment and electricity might
be substitutes. Finally, the productivity of a computer might be enhanced
by telephone access. Telecommunications infrastructure might then be another
complementary input.
Income is likely to be a key determinant of the consumer demand for computers.
It has an effect on consumers’ budget constraints, and it may also affect preferences
for owning a computer, especially in the sense of ‘keeping up with the Joneses’.
Income may be especially important in the presence of liquidity constraints.
Although some consumers may view computers as a worthwhile investment they
may not be able to finance the purchase of one. Preferences for owning a computer
are also likely to vary across individuals and may depend on exposure to and the
perceived usefulness of owning a computer.14 This may be related to a person’s
education level, age, presence of children, and urban/rural location.
To estimate the demand function, one would need to be able to identify some
exogenous variables in the supply equation. In the case of computers, one candidate
variable is obvious—the price of computers. On a global scale, this appears to be
driven by exogenous forces (Moore’s Law) at the level of analysis we are concerned
with. An examination of the hedonic price indices calculated for ICT equipment in
the US provides forceful evidence for large movements in the relative price of
computing power. Indeed, Pohjola (2003) uses the US price of computing equip-
ment as the price of computers in all economies he studies. Since this price index
looks very similar to a (downward sloped) linear trend, it is not clear that in a
structural setup, even one demand parameter could be identified (especially if there
are deterministic time trends in the demand function). Consequently, we rely upon
a reduced form estimation procedure, and assume that we cannot identify the
underlying structural parameters.
Specifically, we estimate several reduced-form equations for computer penetra-
tion rates that include four main sets of independent variables. The first set includes
conventional infrastructure variables, such as main telephone lines per capita,
two measures of Internet access costs (monthly telephone subscription charges
and the cost of a three minute call), and electricity consumption.15 The second
set includes demographic variables, such as shares of the population below 14 and
above 65, and the share of the population in urban centers. The third set includes
economic variables, such as income per capita and human capital (measured either
as years of schooling or the illiteracy rate). The fourth category includes measures
..........................................................................................................................................................................14 A standard approach using microdata is to create a linear random utility model of the decision to
purchase a computer (see Fairlie 2004 for example). The indirect utilities from the two choices are
modelled as functions of measurable individual characteristics, such as race, sex, income, education,
marital status, children, region, and urbanicity.15 Unfortunately, we do not have a measure of the percentage of the population with access to
electricity. Instead, we use per capita electricity consumption as a proxy.
26 of 44 the global digital divide
of institutional quality or policy, such as explicit measures of regulatory quality
or trade openness. The latter can be construed as an economic characteristic,
but it is often viewed as an indicator of how high trade barriers are. And, because
trade barriers tend to be correlated with other domestic impediments to commerce,
trade openness is often taken to be an indicator of a less regulated business
environment.
We hypothesize that many of the same factors are likely to influence country-
level Internet penetration rates. In particular, income, telecommunications
infrastructure and costs, and regulatory quality may be especially important
determinants of Internet use. We include the same set of regressors in the
reduced-form equations for Internet penetration rates.
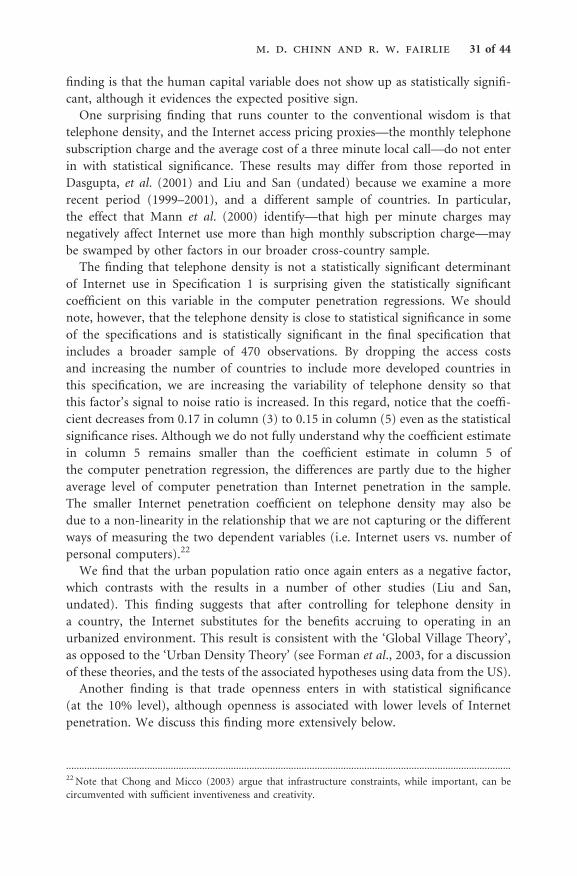
We first turn to the results for computer penetration rates from 1999–2001,
which are reported in Table 2. In column (1), the results indicate that there are
a number of clearly identifiable determinants of computer use. Unsurprisingly,
income per capita comes in as a powerful determinant of PC use; each $1000
increase in per capita income is associated with more than a one percentage
point increase in the number of PCs per capita.16 Also not unexpectedly, human
capital appears to be important. A one year increase in average schooling is asso-
ciated with a one percentage point increase in PC penetration. Recent research on
the determinants of computer ownership using microdata also finds strong rela-
tionships between computer ownership, and income and education.17 The positive
relationship between per capita income and computer penetration rates may be
partly due to relaxing the budget constraint, changing preferences, or liquidity
constraints.
One surprising result is the importance of telephone line density. A one percen-
tage point increase in this variable is associated with a 0.4 percentage point increase
in PC penetration. It is hard to interpret this result; it may be there are
complementarities between computers and telephone lines. Telephone lines may
be important for one of the most common uses of computers, accessing the
Internet. Another explanation is that countries that have a well developed commu-
nication infrastructure are also likely to have other unobservable attributes that
encourage PC use.
We also include measures of telephone costs in the computer penetration regres-
sion, mostly to retain the consistency of the specifications across the two types
of technology. While telephone costs may affect computer adoption through
..........................................................................................................................................................................16 Scatter plots of computer penetration rates and income reveal an approximate linear relationship even
at different income levels.17 Estimates from logit regressions using US microdata indicate that an increase in family income
of $50,000 is associated with a 22 percentage point increase in the probability of having a home
computer (or 0.44 percentage points per $1000 family income; Fairlie, 2004). Also, a college graduate
has a 16.2 percentage point higher probability of having a home computer than an high school graduate
(or 4.0 percentage points per year of school assuming 4 years of college). Note, however, that these
estimates are not adjusted for the number of family members (i.e. per capita terms), the number of
computers in a household, and non-home computers.
m. d. chinn and r. w. fairlie 27 of 44
Internet use, which is one of the main uses of personal computers, our estimates,
however, do not provide evidence of such a relationship. Both monthly telephone
subscription charges and the cost of three minute local calls have statistically
insignificant coefficients in the computer penetration regressions.
Demographic variables generally enter in with expected signs. A higher propor-
tion of youth is associated with greater rate of PC use, while a lower rate will
occur with a higher proportion of seniors, which is consistent with findings from
microdata (US Department of Commerce, 2002). On the other hand, the urban
population enters with a significantly negative coefficient.
Table 2 Computer penetration rate regressions (1999–2001)
Specification..............................................................................................................
Explanatory variables (1) (2) (3) (4) (5)
Main telephone lines per100 people
0.3921(0.0785)
0.3546(0.0784)
0.3642(0.0681)
0.3175(0.0693)
0.3277(0.0504)
Monthly telephonesubscription charge
�0.0125(0.0389)
�0.0018(0.0385)
0.0159(0.0347)
Cost of threeminute local call
�3.5479(4.7353)
�4.3132(4.6714)
�1.2930(3.1691)
Electric powerconsumption(kwh per capita)
0.0001(0.0002)
0.0018(0.0007)
0.0012(0.0006)
Population ages0–14
(% of total)
0.4934(0.1515)
0.6126(0.1550)
0.2568(0.1451)
0.4623(0.1289)
0.2283(0.0915)
Population ages 65 andabove
(% of total)
�0.7271(0.3187)
�0.5871(0.3195)
�0.4316(0.2833)
�0.6376(0.2747)
�0.2769(0.2125)
Urban population(% of total)
�0.1313(0.0388)
�0.1563(0.0397)
�0.1303(0.0370)
�0.1011(0.0337)
�0.0675(0.0232)
Gross national incomeper capita
(000s)
1.1669(0.1628)
0.9636(0.1779)
0.9220(0.1586)
1.3503(0.1405)
1.0670(0.0955)
Years of schooling 0.9786(0.4453)
0.9541(0.4369)
0.7824(0.3799)
Regulatory quality 3.6088(0.7029)
3.8128(0.6963)
2.6443(0.5980)
3.0540(0.6296)
1.9156(0.4473)
Trade in goods(% of GDP)
�0.0082(0.0085)
�0.0100(0.0083)
�0.0072(0.0072)
�0.0061(0.0076)
0.0006(0.0059)
Illiteracy rate �0.0054(0.0473)
Average computerpen. rate
14.14 14.14 12.67 12.73 10.17
Sample size 227 227 273 276 417
Notes: (1) The dependent variable is the number of personal computers per 100 people. (2) Estimates
account for country-level random effects. (3) Standard errors are reported below coefficient estimates.
(4) Specifications 2 and 3 include censored values for electric power consumption above 6000 kwh.
28 of 44 the global digital divide
In the last set of variables, we find that the regulatory quality variable exhibits
a high level of significance.18 This will be a recurring theme—an index of the
economic policy environment shows up as a statistically important determinant
(it will also turn out to be an economically important one as well, in the decom-
positions). Interestingly, unlike the outcome in many other empirical studies of
growth, openness to international trade does not appear to be an important factor
in PC use, after including an explicit measure of regulatory efficiency.
One puzzling result is the lack of a role for electricity consumption. There is
essentially no relationship between per capita electricity use and PC penetration.
This is surprising as access to electricity is essential for the use of personal
computers. One possibility is that there is a threshold effect in the electricity-PC
use relationship. Widespread availability of a reliable electricity supply is critical to
making PC use economically efficient, and over the range where electrification is
occurring, there may be a close link between consumption and use. Once nearly
all households have access to electricity, the link between electricity consumption
and PC use may break down. To investigate this possibility, we modify our
electricity consumption variable so that values in excess of 6000 kWh per capita
are top coded at that value, thus allowing for a nonlinearity in this relationship.
The level of 6000 kWh was chosen because it represents a clear breakpoint
in the bivariate relationship between electricity consumption and computer
penetration rates.19
The results of estimating this specification are recorded in column (2). The
coefficient estimates are very similar to those in column (1), with the exception
of the electricity variable. The coefficient is now much larger in magnitude and
is statistically significant. It implies that each 1000 kWh increase in per capita
electricity consumption is associated with a 1.8 percentage point increase in PC
use, for countries with per capita electricity consumption below 6000 kWh.
As noted above, it appears as though electricity consumption above this level
has little effect on computer penetration rates.20
The use of our preferred measure of human capital, average years of schooling,
constrains the sample size to 227. In column (3) we report the results estimating
the regression, substituting the illiteracy rate for the years of schooling variable.
The sample size increases to 273, and while the coefficient estimates on the
other variables remain largely unchanged from column (2), the illiteracy
rate has a statistically insignificant coefficient. The point estimate implies that
..........................................................................................................................................................................18 We also estimated a specification that includes a related measure which captures the degree to which
agents have confidence in and abide by the rules of society (rule of law). This coefficient estimate
is negative and statistically significant when added to the equation (perhaps due to its strong correlation
with regulatory quality) and statistically insignificant when entered without regulatory quality.19 Average per capita electricity consumption is roughly equal to 6000 kWh in Germany, Denmark
and the Netherlands.20 Estimates including a spline with a break point at 6000 for per capita electricity consumption confirm
this. The slope above 6000 kWh is very close to zero.
m. d. chinn and r. w. fairlie 29 of 44
a one percentage point increase in the illiteracy rate is associated with a decrease
in the PC penetration rate by only 0.005 percentage points. These results are
consistent with PC use requiring high levels of education and not simply
basic literacy.
Another method of increasing the sample size is to drop the telephone
cost variables which are not statistically significant in any of the specifications.
We also drop electricity consumption which is missing for many countries.
We obtain a slightly larger coefficient on income of 1.35 versus 0.96 in
column (2). Otherwise, we are impressed by the relative robustness of the coeffi-
cient estimates.
We can substantially increase the sample size by additionally dropping the
human capital variable altogether. At that point, the sample size increases to 417.
The sample now spans a wider set of countries, and gives greater weight to
poorer countries, and those that have lower rates of PC use. The sample computer
penetration rate drops to 10.17, as compared to the 14.14 in the baseline specifica-
tion in column (1).
Although the results are qualitatively similar using this larger sample, there are a
few noteworthy changes. The coefficients on youth and aged dependency ratios,
and the urban population ratio are smaller in magnitude. Youth dependency and
urban population continue to be statistically significant determinants of PC use.
The coefficient on regulatory quality declines in absolute value, but remains
large, positive and statistically significant. Consequently, we conclude that the
institutional features of the policy regimes, such as the efficacy of regulatory quality
or property rights, are important to PC use.
We also find that even using a sample size that is nearly twice as large as the
one used in column (2), the coefficients on telephone line density and income
change very little. The estimated effects of these two variables are very robust
across the reported specifications.
5.2 Internet use
We now take up the results for Internet penetration rates. To maximize compar-
ability with the results for PC penetration rates, we retain the same basic set
of regressors in our specification. In column (1), we find that several variables
that were important, statistically, as determinants for PC penetration are also
important factors in Internet penetration. These include electric power consump-
tion, the youth dependency ratio, urban population (at the 10% level), per capita
income and regulatory quality. Interestingly, the negative effect of regulations
on Internet penetration (i.e. positive coefficient estimate on regulatory quality) is
substantially larger than its effect on computer penetration.21 Another interesting
..........................................................................................................................................................................21 We find that rule of law has a statistically insignificant coefficient in specifications in which it is added
as an additional regressor or entered without regulatory quality.
30 of 44 the global digital divide
finding is that the human capital variable does not show up as statistically signifi-
cant, although it evidences the expected positive sign.
One surprising finding that runs counter to the conventional wisdom is that
telephone density, and the Internet access pricing proxies—the monthly telephone
subscription charge and the average cost of a three minute local call—do not enter
in with statistical significance. These results may differ from those reported in
Dasgupta, et al. (2001) and Liu and San (undated) because we examine a more
recent period (1999–2001), and a different sample of countries. In particular,
the effect that Mann et al. (2000) identify—that high per minute charges may
negatively affect Internet use more than high monthly subscription charge—may
be swamped by other factors in our broader cross-country sample.
The finding that telephone density is not a statistically significant determinant
of Internet use in Specification 1 is surprising given the statistically significant
coefficient on this variable in the computer penetration regressions. We should
note, however, that the telephone density is close to statistical significance in some
of the specifications and is statistically significant in the final specification that
includes a broader sample of 470 observations. By dropping the access costs
and increasing the number of countries to include more developed countries in
this specification, we are increasing the variability of telephone density so that
this factor’s signal to noise ratio is increased. In this regard, notice that the coeffi-
cient decreases from 0.17 in column (3) to 0.15 in column (5) even as the statistical
significance rises. Although we do not fully understand why the coefficient estimate
in column 5 remains smaller than the coefficient estimate in column 5 of
the computer penetration regression, the differences are partly due to the higher
average level of computer penetration than Internet penetration in the sample.
The smaller Internet penetration coefficient on telephone density may also be
due to a non-linearity in the relationship that we are not capturing or the different
ways of measuring the two dependent variables (i.e. Internet users vs. number of
personal computers).22
We find that the urban population ratio once again enters as a negative factor,
which contrasts with the results in a number of other studies (Liu and San,
undated). This finding suggests that after controlling for telephone density in
a country, the Internet substitutes for the benefits accruing to operating in an
urbanized environment. This result is consistent with the ‘Global Village Theory’,
as opposed to the ‘Urban Density Theory’ (see Forman et al., 2003, for a discussion
of these theories, and the tests of the associated hypotheses using data from the US).
Another finding is that trade openness enters in with statistical significance
(at the 10% level), although openness is associated with lower levels of Internet
penetration. We discuss this finding more extensively below.
..........................................................................................................................................................................22 Note that Chong and Micco (2003) argue that infrastructure constraints, while important, can be
circumvented with sufficient inventiveness and creativity.
m. d. chinn and r. w. fairlie 31 of 44
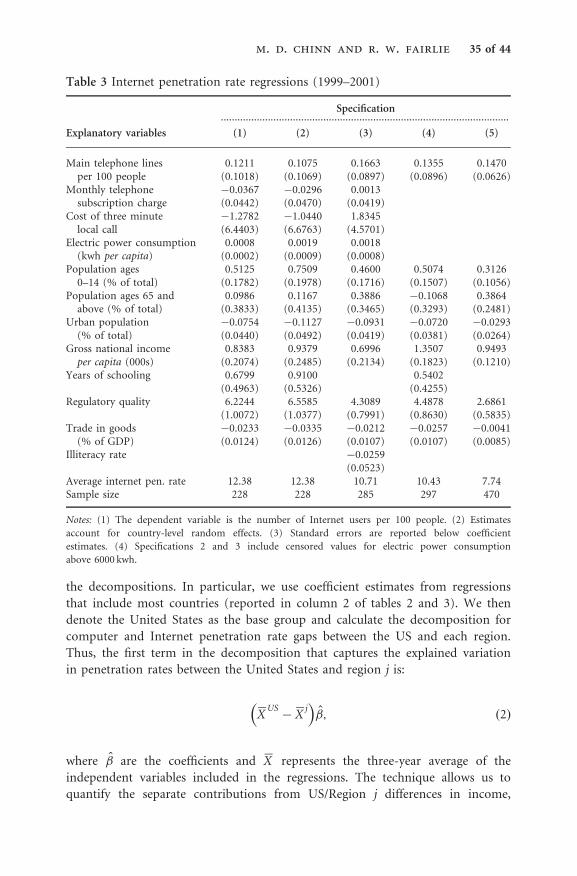
Most of these results are robust to modifications to the regression specification,
including allowance for a threshold effect in electricity consumption (column (2)).
In this particular specification, the coefficient on electricity consumption doubles
in magnitude and becomes statistically significant, while the human capital
variable becomes borderline significant. Substituting in a different proxy measure
for human capital—the illiteracy rate—expands the sample size considerably
(reported in column (3)), but does not yield a statistically significant effect for
human capital, while the inferences regarding the other coefficients are generally
unchanged, with the exception of the telephone density variable (which is now
significant at the 10% level).
Dropping the access price proxies, along with the electricity consumption
variable, but reverting to the years of schooling human capital variable, results
in the estimates reported in column (4). With the exception of the income coeffi-
cient, which is larger, the coefficients imply smaller effects than those in column
(2). Moreover, the human capital variable is not statistically significant in this
specification.
Column (5) reports the results for a specification that omits the schooling, access
price and electricity consumption variables. Omission of these variables once again
increases the sample size considerably, to 470 observations. In this much larger
sample that encompasses more developing countries, one finds that telephone
density is now statistically significant. The coefficient increases from 0.12 to 0.15
with a large decline in the standard error.
We also find statistically significant coefficients on the youth dependency ratio,
per capita income, and regulatory quality. Interestingly, urbanization is no longer a
statistically significant factor, suggesting that this is not a robust determinant of
Internet use.
Trade openness is not statistically significant in its effects on Internet penetra-
tion. At the same time, regulatory quality has an attenuated impact; the coefficient
estimate has declined from a value of 6.2 in the baseline specification to 2.7,
along with a near halving of the standard errors. This pattern of results suggests
to us that trade openness as defined in our data set is reflecting the effects of
large closed economies like the US in the data set. The finding of a positive
effect of trade openness in other studies may reflect the omission of a regulatory/
policy variable such as the one we include in our regressions.
In sum, we identify electricity power consumption, youth dependency, income
per capita and regulatory quality as having strong relationships with Internet pene-
tration. While a priori we believe telephone density and human capital to be
important factors as well, the results do not bear out these beliefs in a broad sample.
5.3 Robustness checks
To check the sensitivity of our results we estimated several additional regressions.
We first estimated a model for computer penetration rates that includes country
fixed effects. Although our panel only includes three years, the results are
32 of 44 the global digital divide
somewhat informative. We are concerned that there are unobserved country-level
factors that may be correlated with some of the explanatory variables leading
to biased coefficient estimates. Overall, the results are fairly similar to those from
the random effects model. The coefficient estimates on income and telephone lines
are slightly larger, and the coefficient estimate on regulatory quality is slightly
smaller. The main exceptions are that the coefficient estimates on electric power
consumption is much larger in the fixed effects model than the random effects
model and the coefficient estimate on years of schooling is negative and implausibly
large in absolute value. The coefficient estimate on years of schooling, which is now
�10.0484, may be the result of multicollinearity with the country fixed effects
because this variable does not change much over time.
We also estimated a fixed effects model for Internet penetration rates. The
coefficient estimates on the telecommunications variables remain statistically insig-
nificant, and the coefficient on electrical power consumption is now much smaller
and is no longer statistically significant. The coefficients on the population variables
are much larger in the fixed effects regression and seem implausible. For example,
the coefficient estimates, which are both statistically significant, imply that
an increase of only one percentage point in the shares of the population that are
ages 0–14 and 65 and over are associated with Internet penetration rates that
are 3.84 and 5.61 percentage points higher, respectively. We also find large increases
in the coefficients on GNI and years of schooling. The coefficient on years of
schooling of 4.77 seems somewhat implausible. Finally, the coefficient on regulatory
quality is somewhat smaller and the coefficient on trade is somewhat larger.
Overall, the fixed effects results differ from the random effects model with a few
cases in which the coefficients are implausibly large. Because of this concern,
the relatively short time period of three years, and the loss of substantial cross-
sectional variation we do not focus on the fixed effects results below. Furthermore,
the contribution estimates that we present in the following section preclude the
use of fixed effects.
We also estimated models that weight countries by their population. Large
countries, such as China and India, contribute substantially to identifying the
coefficients in this model. Overall, the coefficient estimates in the computer pene-
tration regressions are similar. The coefficients on telephone lines and electric
power consumption are slightly smaller, and the coefficients on income, years
of schooling and regulatory quality are slightly larger. Somewhat surprisingly,
the weighted estimates are not overly sensitive to the exclusion of China and India.
For the Internet penetration rate regressions, we also find similar estimates after
weighting by population. In particular, we find that the coefficients on electric
power consumption, income, and regulatory quality are now slightly larger.
The coefficient on years of schooling is slightly smaller and the coefficient on
telephone lines remains statistically insignificant, but is now negative and small.
These estimates are also not sensitive to excluding China and India.
We also estimated random effects models using an extended period:
1995 to 2001. In the computer regressions we find a larger coefficient on
m. d. chinn and r. w. fairlie 33 of 44
income, but smaller coefficients on years of schooling and regulatory quality. The
coefficient on telephone lines is very similar. The coefficient on electric
power consumption is now negative, but statistically insignificant. In the Internet
regressions, the coefficients on income and telephone lines are larger, and the
coefficients on years of schooling and regulatory quality are smaller. Surprisingly,
the coefficient on electric power consumption is large, negative and statistically
significant. We are concerned, however, that 1995 to 1998 includes a period of time
when annual growth rates in computer and Internet penetration rates were increas-
ing rapidly.
6. Explanations for the global digital divide
6.1 Methodology
The regression analysis presented above reveals that factors such as income, human
capital, telecommunications, electricity, and regulatory quality, may contribute to
the global digital divide. The analysis, however, does not identify the relative
importance of these factors in contributing to the alarming differences in computer
and Internet penetration rates across regions of the world. Another unanswered
question is whether the explanations for low technology penetration rates differ
across regions of the world.
To explore these issues further we borrow from a technique of decomposing
inter-group differences in a dependent variable into those due to different
observable characteristics across groups and those due to different ‘prices’ of
characteristics of groups (see Blinder, 1973, and Oaxaca, 1973). The technique
has been widely used to decompose earnings gaps between whites and blacks
or men and women using microdata. The Blinder-Oaxaca technique, however,
can be used to decompose a gap between any two groups or even countries.
In particular, the difference between an outcome, Y, for group i and j can be
expressed as:
Y�i
� Y�j
¼ X�i
� X�j
� ��̂i þ X
�j�̂i � �̂j
� �; ð1Þ
where X�i
is a row vector of average values for the individual-level characteristics
and �̂i is a vector of coefficient estimates for group i. The first term in the decom-
position represents the part of the gap that is due to group differences in average
values of the independent variables, and the second term represents the part due
to differences in the group processes determining the outcome, which is often
referred to as the ‘unexplained’ component. The first term can be further decom-
posed into the separate contributions from group differences in specific variables
and is the focus of the following analysis.
The technique is commonly modified to use coefficients from a pooled
sample of both groups, �̂, to weight the first expression in the decomposition
(see Oaxaca and Ransom, 1994, for example). We adopt this approach to calculate
34 of 44 the global digital divide
the decompositions. In particular, we use coefficient estimates from regressions
that include most countries (reported in column 2 of tables 2 and 3). We then
denote the United States as the base group and calculate the decomposition for
computer and Internet penetration rate gaps between the US and each region.
Thus, the first term in the decomposition that captures the explained variation
in penetration rates between the United States and region j is:
X�US
� X�j
� ��̂; ð2Þ
where �̂ are the coefficients and X�
represents the three-year average of the
independent variables included in the regressions. The technique allows us to
quantify the separate contributions from US/Region j differences in income,
Table 3 Internet penetration rate regressions (1999–2001)
Specification........................................................................................................
Explanatory variables (1) (2) (3) (4) (5)
Main telephone linesper 100 people
0.1211(0.1018)
0.1075(0.1069)
0.1663(0.0897)
0.1355(0.0896)
0.1470(0.0626)
Monthly telephonesubscription charge
�0.0367(0.0442)
�0.0296(0.0470)
0.0013(0.0419)
Cost of three minutelocal call
�1.2782(6.4403)
�1.0440(6.6763)
1.8345(4.5701)
Electric power consumption(kwh per capita)
0.0008(0.0002)
0.0019(0.0009)
0.0018(0.0008)
Population ages0–14 (% of total)
0.5125(0.1782)
0.7509(0.1978)
0.4600(0.1716)
0.5074(0.1507)
0.3126(0.1056)
Population ages 65 andabove (% of total)
0.0986(0.3833)
0.1167(0.4135)
0.3886(0.3465)
�0.1068(0.3293)
0.3864(0.2481)
Urban population(% of total)
�0.0754(0.0440)
�0.1127(0.0492)
�0.0931(0.0419)
�0.0720(0.0381)
�0.0293(0.0264)
Gross national incomeper capita (000s)
0.8383(0.2074)
0.9379(0.2485)
0.6996(0.2134)
1.3507(0.1823)
0.9493(0.1210)
Years of schooling 0.6799(0.4963)
0.9100(0.5326)
0.5402(0.4255)
Regulatory quality 6.2244(1.0072)
6.5585(1.0377)
4.3089(0.7991)
4.4878(0.8630)
2.6861(0.5835)
Trade in goods(% of GDP)
�0.0233(0.0124)
�0.0335(0.0126)
�0.0212(0.0107)
�0.0257(0.0107)
�0.0041(0.0085)
Illiteracy rate �0.0259(0.0523)
Average internet pen. rate 12.38 12.38 10.71 10.43 7.74Sample size 228 228 285 297 470
Notes: (1) The dependent variable is the number of Internet users per 100 people. (2) Estimates
account for country-level random effects. (3) Standard errors are reported below coefficient
estimates. (4) Specifications 2 and 3 include censored values for electric power consumption
above 6000 kwh.
m. d. chinn and r. w. fairlie 35 of 44
human capital, telephones, and other factors, to the gaps in computer and Internet
penetration rates.
6.2 Computer use contributions
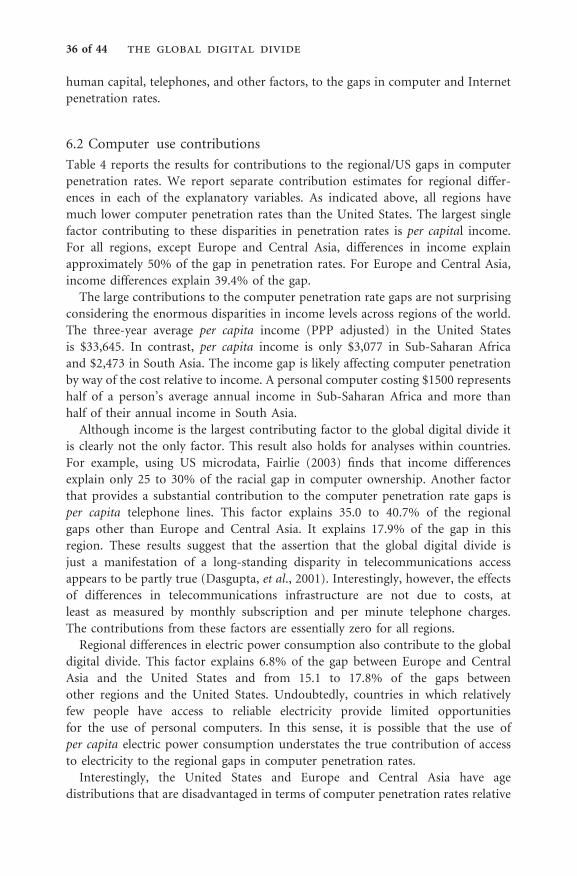
Table 4 reports the results for contributions to the regional/US gaps in computer
penetration rates. We report separate contribution estimates for regional differ-
ences in each of the explanatory variables. As indicated above, all regions have
much lower computer penetration rates than the United States. The largest single
factor contributing to these disparities in penetration rates is per capital income.
For all regions, except Europe and Central Asia, differences in income explain
approximately 50% of the gap in penetration rates. For Europe and Central Asia,
income differences explain 39.4% of the gap.
The large contributions to the computer penetration rate gaps are not surprising
considering the enormous disparities in income levels across regions of the world.
The three-year average per capita income (PPP adjusted) in the United States
is $33,645. In contrast, per capita income is only $3,077 in Sub-Saharan Africa
and $2,473 in South Asia. The income gap is likely affecting computer penetration
by way of the cost relative to income. A personal computer costing $1500 represents
half of a person’s average annual income in Sub-Saharan Africa and more than
half of their annual income in South Asia.
Although income is the largest contributing factor to the global digital divide it
is clearly not the only factor. This result also holds for analyses within countries.
For example, using US microdata, Fairlie (2003) finds that income differences
explain only 25 to 30% of the racial gap in computer ownership. Another factor
that provides a substantial contribution to the computer penetration rate gaps is
per capita telephone lines. This factor explains 35.0 to 40.7% of the regional
gaps other than Europe and Central Asia. It explains 17.9% of the gap in this
region. These results suggest that the assertion that the global digital divide is
just a manifestation of a long-standing disparity in telecommunications access
appears to be partly true (Dasgupta, et al., 2001). Interestingly, however, the effects
of differences in telecommunications infrastructure are not due to costs, at
least as measured by monthly subscription and per minute telephone charges.
The contributions from these factors are essentially zero for all regions.
Regional differences in electric power consumption also contribute to the global
digital divide. This factor explains 6.8% of the gap between Europe and Central
Asia and the United States and from 15.1 to 17.8% of the gaps between
other regions and the United States. Undoubtedly, countries in which relatively
few people have access to reliable electricity provide limited opportunities
for the use of personal computers. In this sense, it is possible that the use of
per capita electric power consumption understates the true contribution of access
to electricity to the regional gaps in computer penetration rates.
Interestingly, the United States and Europe and Central Asia have age
distributions that are disadvantaged in terms of computer penetration rates relative
36 of 44 the global digital divide
to the rest of the world. The population in the United States is comprised
of a lower percentage of children (ages 0–14) and a higher percentage of the
elderly (ages 65 and over) than the rest of the world with the exception of
Europe and Central Asia. The older population distribution in the United States
combined with the negative relationship between age and computer penetration
works to widen the technology gaps as evidenced by the negative contributions
reported in table 4. In other words, if other regions of the world had an age
distribution that was more similar to the United States the gaps in computer
penetration rates would be even larger than they currently are. The one exception
is for Europe and Central Asia. For this region the older age distribution explains
part of the computer penetration rate gap.
Table 4 Contribution estimates for computer penetration rate gaps (1999–2001)
East Asiaand
Pacific
Europeand
Central Asia
Latin Americaand
Caribbean
Middle Eastand
North AfricaSouthAsia
Sub-SaharanAfrica
Computerpenetration rate
5.39 23.40 5.00 3.57 0.43 1.68
US Rate 56.86 56.86 56.86 56.86 56.86 56.86Gap 51.47 33.46 51.86 53.29 56.43 55.18
Contribution from differences in:
Main telephone lines per 18.27 5.98 18.13 19.41 22.55 22.45
100 people 35.5% 17.9% 35.0% 36.4% 40.0% 40.7%Monthly telephone �0.03 �0.03 �0.02 �0.05 0.00 �0.03
subscription charge 0.0% �0.1% 0.0% �0.1% 0.0% 0.0%Cost of three minute 0.30 0.66 0.58 0.17 0.46 0.96
local call 0.6% 2.0% 1.1% 0.3% 0.8% 1.7%Electric power 8.22 2.28 7.81 8.41 10.07 9.10
consumption(kwh per capita)
16.0% 6.8% 15.1% 15.8% 17.8% 16.5%
Population ages 0–14 �2.58 1.70 �6.37 �8.41 �8.24 �12.23(% of total) �5.0% 5.1% �12.3% �15.8% �14.6% �22.2%
Population ages 65 and �3.15 1.13 �4.26 �4.88 �4.70 �5.41above (% of total) �6.1% 3.4% �8.2% �9.2% �8.3% �9.8%
Urban population �5.48 �0.21 �0.10 �3.24 �7.75 �5.73(% of total) �10.7% �0.6% �0.2% �6.1% �13.7% �10.4%
Gross national income 26.86 13.20 25.69 27.40 30.04 29.45per capita (000s) 52.2% 39.4% 49.5% 51.4% 53.2% 53.4%
Years of schooling 5.12 3.53 5.66 6.19 7.04 7.929.9% 10.6% 10.9% 11.6% 12.5% 14.4%
Regulatory quality 5.95 1.59 4.25 7.88 6.49 6.4211.6% 4.7% 8.2% 14.8% 11.5% 11.6%
Trade in goods 0.25 0.34 0.15 0.19 0.04 0.22(% of GDP) 0.5% 1.0% 0.3% 0.4% 0.1% 0.4%
Note: The coefficient estimates used in these calculations are from Specification 2 of Table 2. See text for
more details on calculations.
m. d. chinn and r. w. fairlie 37 of 44
The percentage of the population living in urban areas also provides a negative
contribution in the decompositions. Most regions have substantially more ‘rural’
populations than the United States resulting in an advantaged geographical
distribution in terms of computer use. The computer penetration rate gaps with
the United States would be from 6.1 to 13.7% higher if these regions had a similar
percentage of the population living in urban areas. The two exceptions are Europe
and Central Asia, and Latin America and the Caribbean, which have comparably
sized urban populations.
Human capital disparities, as measured by years of schooling, are important
in contributing to the global digital divide. Differences in education explain
from 9.9 to 14.4% of the gaps in computer penetration rates. The average
number of years of school range from 3.7 years in Sub-Saharan Africa to 8.3
years in Europe and Central Asia. In contrast, the average years of schooling in
the United States is 12.1 years. Computers apparently require substantial levels of
education for use, limiting demand in countries with relatively low levels of human
capital. Hence, we confirm the findings of Caselli and Coleman (2001) and Pohjola
(2003). This finding is significant because it indicates that even after controlling
for differences in income, human capital disparities are important in creating a
global digital divide. A parallel result can be found in research using US microdata
to explain the digital divide across racial groups. Demand for computers increases
significantly with higher levels of education, resulting in large independent con-
tributions from education to gaps in computer use (Fairlie, 2003).
Regional differences in regulatory quality appear to contribute greatly to the
global digital divide. These differences explain roughly 10% of the gap in computer
penetration rates for most regions. In the Middle East and North Africa,
differences in regulatory quality explain nearly 15% of the gap in computer pene-
tration. In Europe and Central Asia where regulatory quality is more similar to
the United States this factor explains only 4.7% of the gap. Apparently, regulation
has a negative net effect on technology adoption, partially explaining why many
developing countries have low computer penetration rates, which is broadly
consistent with the findings in Caselli and Coleman (2001). They find that their
institutional variable—an index of property rights—has a positive effect on
computer investment in their largest sample. While in some of their smaller
samples, including those that are less subject to measurement error, the effect
is not always statistically significant, we find this effect to be robust across our
specifications.
Finally, openness to trade, as measured by the percentage of GDP represented
by trade in goods, is not an important factor in contributing to the global
digital divide. For none of the regions can this factor explain more than 1% of
the gap in computer penetration rates. This outcome contrasts strongly with
the Caselli and Coleman (2001) finding that computer investment, measured
as computer imports, is highly dependent upon openness to imports from the
OECD countries. Their interpretation of this finding is that this effect represents
a knowledge spillover from importing manufactured goods.
38 of 44 the global digital divide
6.3 Internet decomposition results
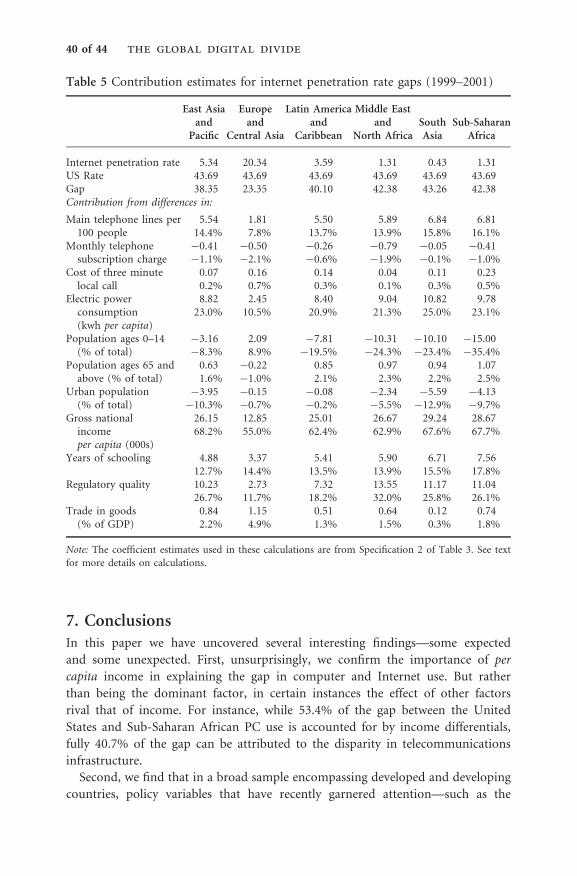
Table 5 reports the results for contributions to regional/US gaps in Internet
penetration rates. The most important factor contributing to the gaps is income.
Regional differences in gross national income per capita explain from 55.0 to 68.2%
of the Internet penetration gaps. Although the contributions to the Internet gaps
are larger than the contributions to the computer gaps in percentage terms,
the actual contributions are similar. Surprisingly, access to telephones plays a
smaller role in contributing to the regional gaps in Internet penetration rates.
Telephone lines per capital explain from 7.8 to 16.1% of the gaps in Internet
penetration rates. Furthermore, regional differences in monthly subscription or
per call charges explain essentially none of the gap in Internet penetration rates.
The global digital divide measured in Internet use appears to only partly be due
to long-standing disparity in telecommunications access and is not related to
differential telecommunications costs.
Access to electricity is also crucial to Internet use. Regional differences in electric
power consumption explain 10.5% of the Internet penetration rate gap
between Europe and Central Asia and the United States, and 20.9 to 25.0% of
the Internet penetrations rates between other regions and the United States.
The actual contributions are similar to those from the computer penetration
rate decompositions.
Similar to the results presented above, the age distribution of the United States,
and Europe and Central Asia limit the overall magnitude of the global digital
divide. The effect, however, is entirely because of the relatively small percentage
of children in these countries and not because of the relatively large percentage
of the elderly compared to other regions of the world.
The relatively urban United States also lessens the global digital divide.
The Internet penetration rate gaps would be larger for most regions as evidenced
by the negative contribution estimates. However, this effect is fairly small.
Interestingly, our estimated coefficient is opposite in sign from those obtained by
Dasgupta et al. (2001) and APEC (2002). This suggests that the identified urban
effect may be sensitive to sample or specification or both.
Regional differences in education levels appear to explain part of the gap,
however, some caution is warranted in interpreting these results as they are
based on a statistically insignificant coefficient estimate. The point estimate
implies similar contributions as those for the computer penetration rate
decompositions.
The most notable difference between the results for the Internet penetration
rate gaps and those for the computer penetration rate gaps is the substantially
larger magnitude of contributions from regional differences in regulatory quality.
Differences in regulatory quality explain 11.7% of the gap between Europe/Central
Asia and the United States and 18.2 to 32.0% of the gap between other regions
and the United States. Again, these findings are consistent with those of Wallsten
(2005) and suggest that regulation overall negatively affects Internet use.
m. d. chinn and r. w. fairlie 39 of 44
7. ConclusionsIn this paper we have uncovered several interesting findings—some expected
and some unexpected. First, unsurprisingly, we confirm the importance of per
capita income in explaining the gap in computer and Internet use. But rather
than being the dominant factor, in certain instances the effect of other factors
rival that of income. For instance, while 53.4% of the gap between the United
States and Sub-Saharan African PC use is accounted for by income differentials,
fully 40.7% of the gap can be attributed to the disparity in telecommunications
infrastructure.
Second, we find that in a broad sample encompassing developed and developing
countries, policy variables that have recently garnered attention—such as the
Table 5 Contribution estimates for internet penetration rate gaps (1999–2001)
East Asiaand
Pacific
Europeand
Central Asia
Latin Americaand
Caribbean
Middle Eastand
North AfricaSouthAsia
Sub-SaharanAfrica
Internet penetration rate 5.34 20.34 3.59 1.31 0.43 1.31US Rate 43.69 43.69 43.69 43.69 43.69 43.69Gap 38.35 23.35 40.10 42.38 43.26 42.38Contribution from differences in:
Main telephone lines per 5.54 1.81 5.50 5.89 6.84 6.81100 people 14.4% 7.8% 13.7% 13.9% 15.8% 16.1%
Monthly telephone �0.41 �0.50 �0.26 �0.79 �0.05 �0.41subscription charge �1.1% �2.1% �0.6% �1.9% �0.1% �1.0%
Cost of three minute 0.07 0.16 0.14 0.04 0.11 0.23local call 0.2% 0.7% 0.3% 0.1% 0.3% 0.5%
Electric power 8.82 2.45 8.40 9.04 10.82 9.78consumption 23.0% 10.5% 20.9% 21.3% 25.0% 23.1%(kwh per capita)
Population ages 0–14 �3.16 2.09 �7.81 �10.31 �10.10 �15.00(% of total) �8.3% 8.9% �19.5% �24.3% �23.4% �35.4%
Population ages 65 and 0.63 �0.22 0.85 0.97 0.94 1.07above (% of total) 1.6% �1.0% 2.1% 2.3% 2.2% 2.5%
Urban population �3.95 �0.15 �0.08 �2.34 �5.59 �4.13(% of total) �10.3% �0.7% �0.2% �5.5% �12.9% �9.7%
Gross national 26.15 12.85 25.01 26.67 29.24 28.67incomeper capita (000s)
68.2% 55.0% 62.4% 62.9% 67.6% 67.7%
Years of schooling 4.88 3.37 5.41 5.90 6.71 7.5612.7% 14.4% 13.5% 13.9% 15.5% 17.8%
Regulatory quality 10.23 2.73 7.32 13.55 11.17 11.0426.7% 11.7% 18.2% 32.0% 25.8% 26.1%
Trade in goods 0.84 1.15 0.51 0.64 0.12 0.74(% of GDP) 2.2% 4.9% 1.3% 1.5% 0.3% 1.8%
Note: The coefficient estimates used in these calculations are from Specification 2 of Table 3. See text
for more details on calculations.
40 of 44 the global digital divide
pricing of telecommunications access—do not show up as statistically or economi-
cally important in explaining the Internet gap. This result should not be construed
as implying that pricing policies are not important. Rather, it suggests that such
issues are swamped by economic, demographic and institutional factors in samples
with widely varying Internet penetration rates. Previous studies highlighting
this issue had focused on relatively narrow sets of countries, such as the OECD
countries.
Flowing from this conclusion is the third point: the quality of regulation is of
great importance. Differences in regulatory quality generally account for large
portions of the gaps in technology use. For instance, 32.0% of the US-Middle
East/North Africa Internet gap is associated with the difference in regulatory
quality. In other words, our estimates suggest that nearly one-third of the
Internet penetration rate gap might be closed if countries in the Middle East
and North Africa had similar regulatory quality as the United States.
We do not wish to imply that all our results are new or unexpected. Indeed,
some are quite consistent with the extant literature on the determinants of the
digital divide. For instance, education does covary positively with the degree of
PC and Internet use. But the degree to which the difference in Internet rates
depends upon this variable is surprisingly small. For most of the regions,
the effect of lower education is only about half the magnitude of the gap attribu-
table to differences in regulatory efficiency.
Acknowledgements
We thank seminar participants at Yale University and the World Bank, and Joe Altonji,Eileen Brooks, Alberto Chong, Ezter Hargittai, Valery Lazarev, and Justin Marion for helpfulcomments and suggestions. Fairlie was partially funded by the William T. Grant Foundationand the Community Technology Foundation of California. The views contained hereinare solely those of the authors, and do not necessarily represent those of the institutionswith which the authors are associated.
References
Acemoglu, D., Johnson, S., and Robinson, J.A. (2001) The colonial origins of comparativedevelopment: an empirical investigation, American Economic Review, 91, 1369–401.
APEC Economic Committee (2002) The New Economy in APEC: Innovations, Digital Divideand Policy, APEC Secretariat, Singapore, October.
Autor, D., Katz, L., and Krueger, A. (1998) Computing inequality: have computers changedthe labor market? Quarterly Journal of Economics, 113, 1169–213.
Barro, R.J. (1991) Economic growth in a cross section of countries, Quarterly Journalof Economics, 106, 407–443.
Blinder, A.S. (1973) Wage discrimination: reduced form and structural variables, Journalof Human Resources, 8, 436–55.
Brynjolfsson, E. and Hitt, L. (2003) Computing productivity: firm-level evidence,Review of Economics and Statistics, 85, 793–808.
m. d. chinn and r. w. fairlie 41 of 44
Caselli, F. and Coleman, W.J., II (2001) Cross-country technology diffusion: the caseof computers, American Economic Review, 91, 328–35.
Chong, A. and Micco, A. (2003) The Internet and the ability to innovate in Latin America,Emerging Markets Review, 4, 53–72.
Council of Economic Advisers (2001) Economic Report of the President, 2001,US Government Printing Office, Washington, DC.
Dasgupta, S., Lall, S., and Wheeler, D. (2001) Policy reform, economic growth andthe digital divide: an econometric analysis, Working Paper No. 2567, World Bank,Washington, DC.
Dedrick, J., Gurbaxani, V., and Kraemer, K. (2003) Information technology and economicperformance: a critical review of the empirical evidence, ACM Computing Surveys, 35, 1–28.
Estache, A., Manacorda, M. and Valletti, T.M. (2002) Telecommunication reforms, accessregulation and internet adoption in Latin America, Economı́a, 2, 153–217.
Fairlie, R.W. (2004) Race and the digital divide, Contributions to Economic Analysis & Policy,The Berkeley Electronic Journals, 3, Article 15, 1–38.
Fink, C. and Kenny, C. (2003) W(h)ither the digital divide? Info, The Journal of Policy,Regulation and Strategy for Telecommunications, 5, 15–24.
Forman, C., Goldfarb, A., and Greenstein, S. (2003) How did location affect adoption ofthe commercial Internet? Global village, urban density and industry composition, WorkingPaper No. 9979, NBER, Cambridge, MA.
Gordon, R.J. (2000) Does the ‘new economy’ measure up to the great inventions of the past?Journal of Economic Perspectives, 14, 49–76.
Hall, R. and Jones, C.I. (1999) Why do some countries produce so much more output perworker than others? Quarterly Journal of Economics, 114, 83–116.
Hargittai, E. (1999) Weaving the Western Web: explaining differences in internet connec-tivity among OECD Countries, Telecommunications Policy, 23, 701–18.
International Telecommunications Union (2003) World Telecommunication IndicatorsDatabase.
Jorgenson, D. (2001) Information technology and the US economy, American EconomicReview, 91, 1–32.
Kaufmann, D., Kraay, A., and Mastruzzi, M. (2003) Governance matters III: Governanceindicators for 1996–2002, Development and Comp Systems 0308001, Economics WorkingPaper Archive at WUSTL., St Louis, MO.
Kiiski, S. and Pohjola, M. (2002) Cross-country diffusion of the internet, InformationEconomics and Policy, 14, 297–310.
Liu, M.-C. and San, G. (undated) Social conditions and the digital divide: examining the roleof internet diffusion, mimeo, Chung-Hua Institution for Economic Research, Taipei.
Mann, C., Eckert, S.E., and Knight, S.C. (2000) Global Electronic Commerce: A Policy Primer,Institute for International Economics, Washington, DC.
Mann, C.L. and Rosen., D.H. (2001) The New Economy and APEC, APEC Secretariat,Singapore, October.
Norris, P. (2001) Digital Divide: Civic Engagement, Information Poverty, and the InternetWorldwide, Cambridge University Press, Cambridge.
42 of 44 the global digital divide
Oaxaca, R. (1973) Male-female wage differentials in urban labor markets, InternationalEconomic Review, 14, 693–709.
Oaxaca, R. and Ransom, M. (1994) On discrimination and the decomposition of wagedifferentials, Journal of Econometrics, 61, 5–21.
OECD (2001) Understanding the Digital Divide, Organization for Economic Cooperationand Development, Paris.
Ono, H. and Zavodny, M. (2004) Gender differences in information technology usage:a US-Japan comparison, Working Paper No. 2004–2, Federal Reserve Bank of Atlanta.
Oyelaran-Oyeyinka, B. and Lal, K. (2003) The internet diffusion in Sub-Saharan Africa:a cross-country analysis, Institute for New Technologies Discussion Paper No. 2003–5,UN University, Helsinki.
Pohjola, M. (2003) The adoption and diffusion of ICT across countries: Patterns anddeterminants, The New Economy Handbook, Academic Press, New York.
Primrose, J. (2003) 2001 Census: computer and internet use, Census Paper No. 03/03,Australian Bureau of Statistics, Canberra.
Quibria, M. G., Ahmed, S.N., Tschang, T., and Reyes-Macasaquit, M.-L. (2003)Digital divide: Determinants and policies with special reference to Asia, Journal of AsianEconomics, 13, 811–25.
Rodrik, D., Subramanian, A., and Trebbi, A. (2004) Institutions rule: the primacyof institutions over geography and integration in economic development, Journalof Economic Growth, 9, 131–65.
Singh, V. (2004) Factors associated with household internet use in Canada, 1998–2000, Ruraland Small Town Canada Analysis Bulletin, Statistics Canada, Catalogue no. 21–006-XIE, 5.
Steinmueller, W. E. (2001) ICTs and the possibilities of leapfrogging by developingcountries, International Labour Review, 140, 193–210.
Temple, J. (2001) Growth effects of education and social capital in the OECD countries,OECD Economic Studies, 33, 58–101.
US Department of Commerce (2000) Falling Through the Net: Toward Digital Inclusion,US Government Printing Office, Washington, DC.
US Department of Commerce (2002) A Nation Online: How Americans are ExpandingTheir Use of the Internet, US Government Printing Office, Washington, DC.
Wallsten, S. (2005) Regulation and internet use in developing countries, EconomicDevelopment and Cultural Change, 53, 501–23.
World Bank (2003) World Development Indicators, World Bank, Washington, DC, availableat: http://www.worldbank.org/data/wdi2002/index.htm
Appendix
Variable Descriptions and Sources
Key:ITU: International Telecommunications Union, World Telecommunication Indicators
Database.WDI: World Bank, World Development Indicators.ES: World Bank, EdStats.
m. d. chinn and r. w. fairlie 43 of 44
KKM: Kaufman, Kraay, and Mastruzzi (2003).Personal computers per 100 people: Estimates are derived from annual questionnaires
supplemented by other sources. Source: ITU.Internet users per 100 people: The number of Internet users is based on reported
estimates, derivations based on reported Internet Access Provider (ISP) subscriber counts,
or calculated by multiplying the number of hosts by an estimated multiplier. Source: ITU.Main telephone lines per 100 people: Main telephone lines refer to telephone lines
connecting a customer’s equipment (e.g. telephone set, facsimile machine) to the Public
Switched Telephone Network (PSTN) and which have a dedicated port on a telephone
exchange. For most countries, main lines also include public payphones. Source: ITU.Monthly telephone subscription charge: The monthly telephone subscription charge
is the average of the residential and business subscription charges and is converted to
international dollars using purchasing power parity rates provided by the World Bank.
Monthly subscription refers to the recurring fixed charge for subscribing to the Public
Switched Telephone Network. The charge covers the rental of the line but not the rental
of the terminal (e.g., telephone set) where the terminal equipment market is liberalized.
Source: ITU, WDI, and authors’ calculations.Cost of three minute local call: The cost of a three minute local call during peak rates
is converted to international dollars using purchasing power parity rates provided by the
World Bank. Source: ITU, WDI, and authors’ calculations.Electric power consumption (kwh per capita).: Source: WDI.Population ages 0–14 (% of total): Source: WDI.Population ages 65 and above (% of total): Source: WDI.Urban population (% of total): Source: WDI.Gross national income per capita: Gross national income is converted to international
dollars using purchasing power parity rates provided by the World Bank. An international
dollar has the same purchasing power over GNI as a US dollar has in the United States.
Source: WDI.Trade in goods (% of GDP): Sum of exports and imports, divided by GDP. Source: WDI.Years of schooling: Average years of schooling of adults. Source: ES.Regulatory quality: The regulatory quality index focuses specifically on the policies,
including measures of the incidence of market-unfriendly policies such as price controls
or inadequate bank supervision, as well as perceptions of the burdens imposed by excessive
regulation in areas such as foreign trade and business development. Source: KKM.Rule of law: A composite index that includes several indicators which measure the
extent to which agents have confidence in and abide by the rules of society. These include
perceptions of the incidence of crime, the effectiveness and predictability of the judiciary,
and the enforceability of contracts. An Unobserved Component Model (UCM) is used
to aggregate the various responses in the broad 6 clusters where the weights are proportional
to the reliability of each source. The resulting estimates of governance have an expected
value (across countries) of zero, and a standard deviation (across countries) of one.
Source: KKM.
44 of 44 the global digital divide