Embed Size (px)
Citation preview
Addressing Land Issues for Smart Cities
04/21/15 1Dr. Reshmy Nair
Dr. Reshmy NairAssociate Professor
Centre for Excellence in Management of land Acquisition, Resettlement and Rehabilitation, ASCI, Hyderabad
04/21/15 Dr. Reshmy Nair 2
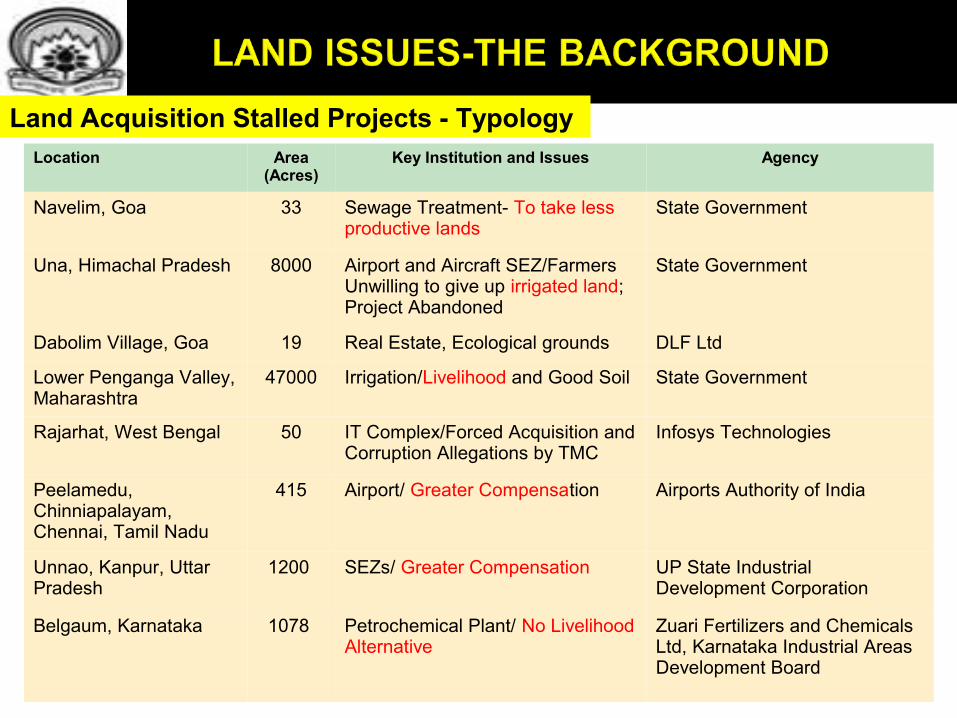
Location Area(Acres)
Key Institution and Issues Agency
Navelim, Goa 33 Sewage Treatment- To take less productive lands
State Government
Una, Himachal Pradesh 8000 Airport and Aircraft SEZ/Farmers Unwilling to give up irrigated land; Project Abandoned
State Government
Dabolim Village, Goa 19 Real Estate, Ecological grounds DLF Ltd
Lower Penganga Valley, Maharashtra
47000 Irrigation/Livelihood and Good Soil State Government
Rajarhat, West Bengal 50 IT Complex/Forced Acquisition and Corruption Allegations by TMC
Infosys Technologies
Peelamedu, Chinniapalayam, Chennai, Tamil Nadu
415 Airport/ Greater Compensation Airports Authority of India
Unnao, Kanpur, Uttar Pradesh
1200 SEZs/ Greater Compensation UP State Industrial Development Corporation
Belgaum, Karnataka 1078 Petrochemical Plant/ No Livelihood Alternative
Zuari Fertilizers and Chemicals Ltd, Karnataka Industrial Areas Development Board
Land Acquisition Stalled Projects - Typology
04/21/15 Dr. Reshmy Nair 3
“Despite its immense potential and promise, by many accounts, India continues to suffer from poverty. A third of its population still lives in extreme poverty-possibly the highest incidence outside sub-Saharan Africa-and many people still lack access to basic services and opportunities such as sanitation, healthcare and quality schooling. The infant mortality and malnutrition incidences are among the highest in the world while we have the second shortest life expectancy in Asia. To a lesser extent, its large informal economy and its lack of a universal social safety net show that India remains largely a poor country that is developing with large disparities within its society”.
The Global Competitiveness Report, 2014-15, World Economic Forum (WEF)
04/21/15 Dr. Reshmy Nair 4
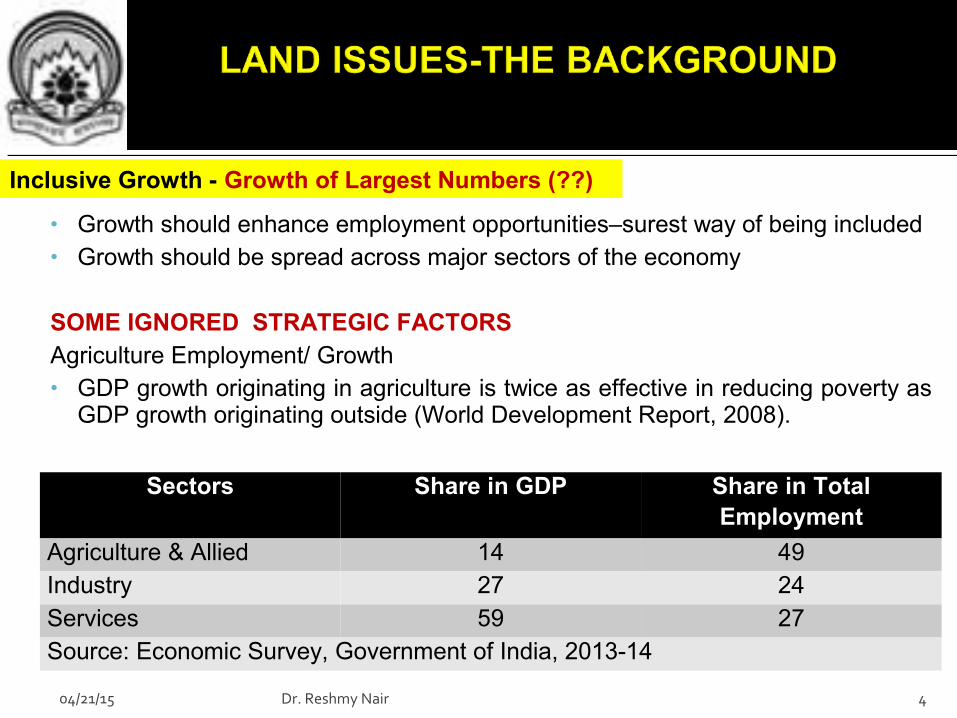
• Growth should enhance employment opportunities–surest way of being included• Growth should be spread across major sectors of the economy
SOME IGNORED STRATEGIC FACTORSAgriculture Employment/ Growth• GDP growth originating in agriculture is twice as effective in reducing poverty as
GDP growth originating outside (World Development Report, 2008).
Inclusive Growth - Growth of Largest Numbers (??)
Sectors Share in GDP Share in Total Employment
Agriculture & Allied 14 49Industry 27 24Services 59 27Source: Economic Survey, Government of India, 2013-14
04/21/15 Dr. Reshmy Nair 5
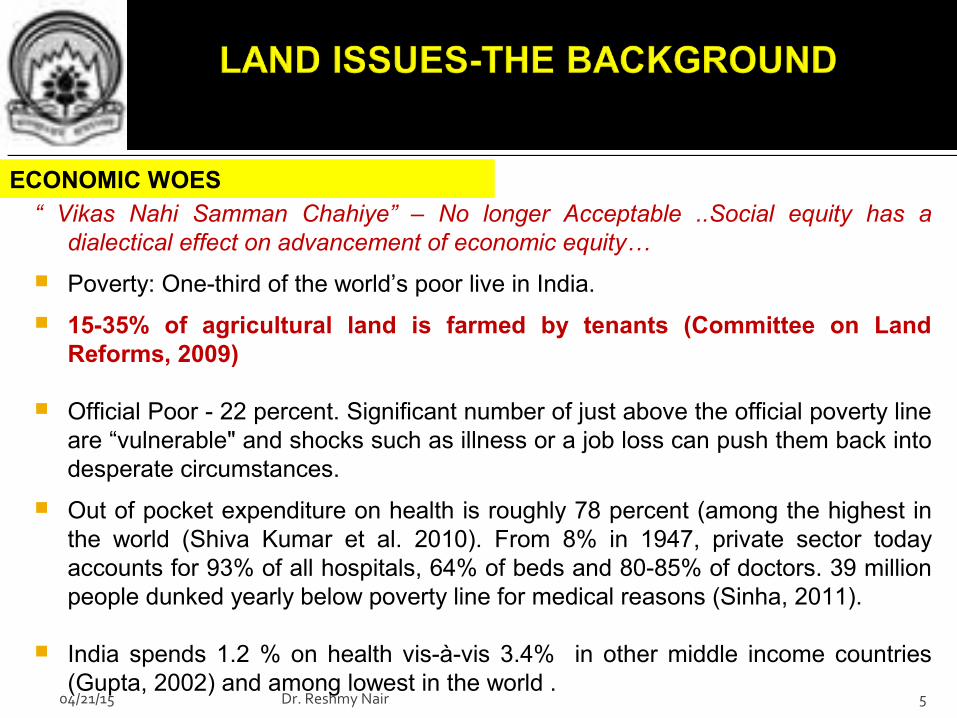
“ Vikas Nahi Samman Chahiye” – No longer Acceptable ..Social equity has a dialectical effect on advancement of economic equity…
Poverty: One-third of the world’s poor live in India.
15-35% of agricultural land is farmed by tenants (Committee on Land Reforms, 2009)
Official Poor - 22 percent. Significant number of just above the official poverty line
are “vulnerable" and shocks such as illness or a job loss can push them back into desperate circumstances.
Out of pocket expenditure on health is roughly 78 percent (among the highest in the world (Shiva Kumar et al. 2010). From 8% in 1947, private sector today accounts for 93% of all hospitals, 64% of beds and 80-85% of doctors. 39 million people dunked yearly below poverty line for medical reasons (Sinha, 2011).
India spends 1.2 % on health vis-à-vis 3.4% in other middle income countries (Gupta, 2002) and among lowest in the world .
ECONOMIC WOES
04/21/15 Dr. Reshmy Nair 6
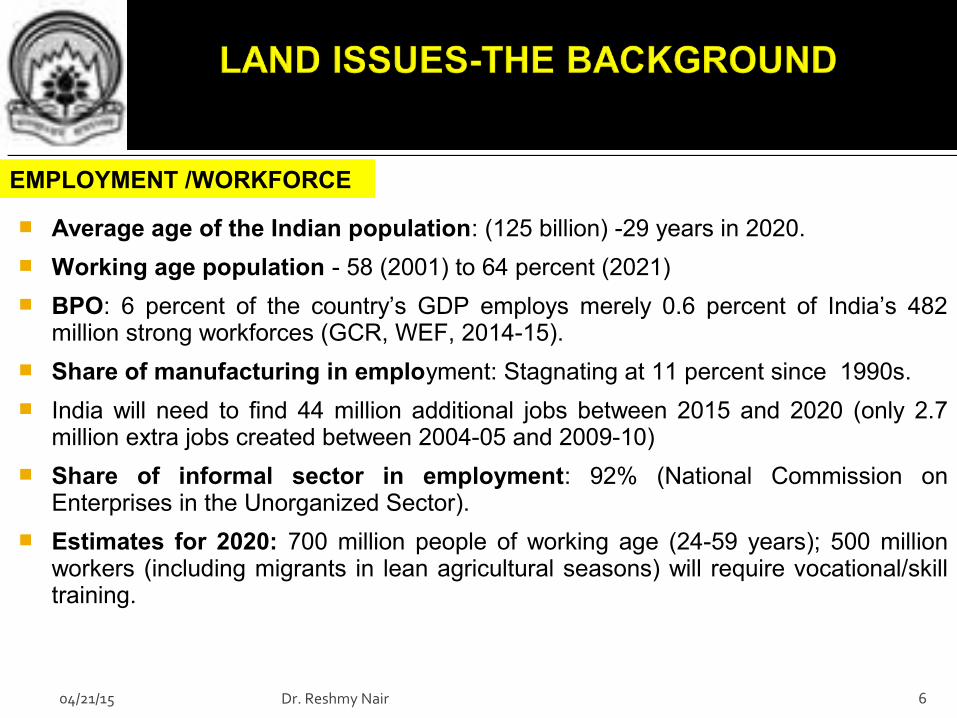
Average age of the Indian population: (125 billion) -29 years in 2020.
Working age population - 58 (2001) to 64 percent (2021)
BPO: 6 percent of the country’s GDP employs merely 0.6 percent of India’s 482 million strong workforces (GCR, WEF, 2014-15).
Share of manufacturing in employment: Stagnating at 11 percent since 1990s.
India will need to find 44 million additional jobs between 2015 and 2020 (only 2.7 million extra jobs created between 2004-05 and 2009-10)
Share of informal sector in employment: 92% (National Commission on Enterprises in the Unorganized Sector).
Estimates for 2020: 700 million people of working age (24-59 years); 500 million workers (including migrants in lean agricultural seasons) will require vocational/skill training.
EMPLOYMENT /WORKFORCE
04/21/15 Dr. Reshmy Nair 7
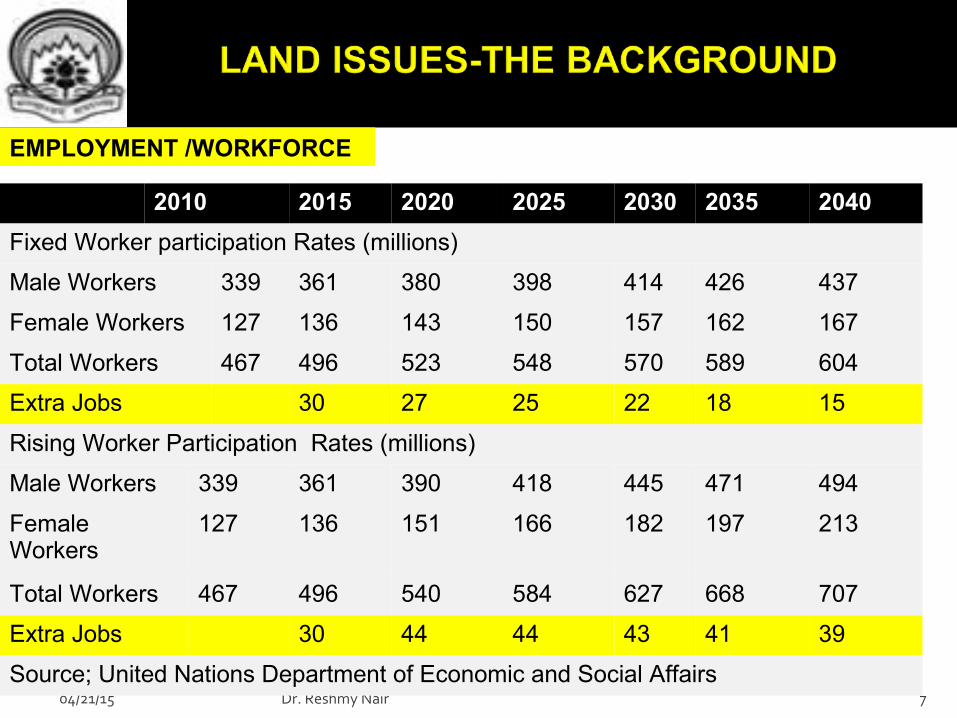
EMPLOYMENT /WORKFORCE
2010 2015 2020 2025 2030 2035 2040
Fixed Worker participation Rates (millions)
Male Workers 339 361 380 398 414 426 437
Female Workers 127 136 143 150 157 162 167
Total Workers 467 496 523 548 570 589 604
Extra Jobs 30 27 25 22 18 15
Rising Worker Participation Rates (millions)
Male Workers 339 361 390 418 445 471 494
Female Workers
127 136 151 166 182 197 213
Total Workers 467 496 540 584 627 668 707
Extra Jobs 30 44 44 43 41 39
Source; United Nations Department of Economic and Social Affairs
04/21/15 Dr. Reshmy Nair 8
• Largest share of workforce - greatest numbers• Lacklustre growth of agriculture since the early 1990s• Double digit food price inflation-a grim reminder• Less than 45% of land under assured irrigation. Poverty rates in
irrigated districts one-third than in districts without irrigation (World Bank 2005).
????
Productivity Enhancement – declining relative price of food – secondary expansion for other sectors (direct and indirect)
Better educational preparedness – farm and for decrease in overcrowding of workforce
Dynamic Agriculture – Strategic Factor
04/21/15 Dr. Reshmy Nair 9
Historical Injustice in Development Induced Displacement
Highly Inequitable Growth Process
Time/Cost Overruns due to Protest Induced Delays
Development as a “Win-Win” situation for all
LAA, 1894: Perceived Low Compensation, Lack of Sustainable Livelihood Llternative, Lack of Transparency/ Consultations, Acquisition for any Public Purpose, Misuse of Urgency Provisions etc.
Land Acquisition Stalled Projects - Typology
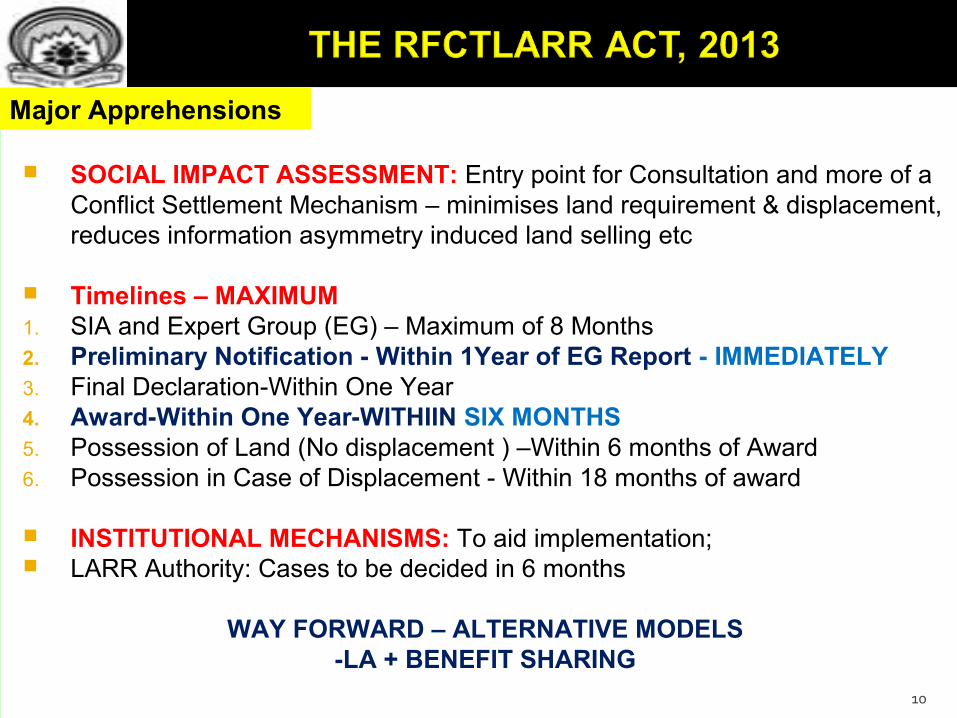
SOCIAL IMPACT ASSESSMENT: Entry point for Consultation and more of a Conflict Settlement Mechanism – minimises land requirement & displacement, reduces information asymmetry induced land selling etc
Timelines – MAXIMUM1. SIA and Expert Group (EG) – Maximum of 8 Months2. Preliminary Notification - Within 1Year of EG Report - IMMEDIATELY3. Final Declaration-Within One Year4. Award-Within One Year-WITHIIN SIX MONTHS5. Possession of Land (No displacement ) –Within 6 months of Award 6. Possession in Case of Displacement - Within 18 months of award
INSTITUTIONAL MECHANISMS: To aid implementation; LARR Authority: Cases to be decided in 6 months
WAY FORWARD – ALTERNATIVE MODELS-LA + BENEFIT SHARING
10
Major Apprehensions
04/21/15 Dr. Reshmy Nair 11
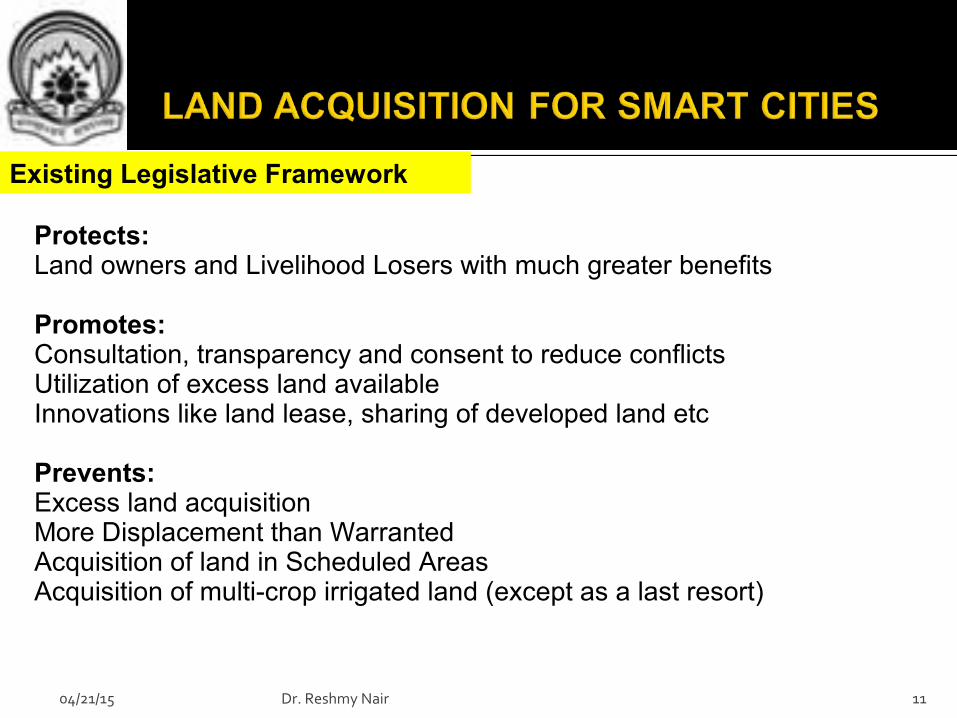
Protects:Land owners and Livelihood Losers with much greater benefits
Promotes:Consultation, transparency and consent to reduce conflictsUtilization of excess land available Innovations like land lease, sharing of developed land etc
Prevents:Excess land acquisitionMore Displacement than WarrantedAcquisition of land in Scheduled AreasAcquisition of multi-crop irrigated land (except as a last resort)
Existing Legislative Framework
04/21/15 Dr. Reshmy Nair 12
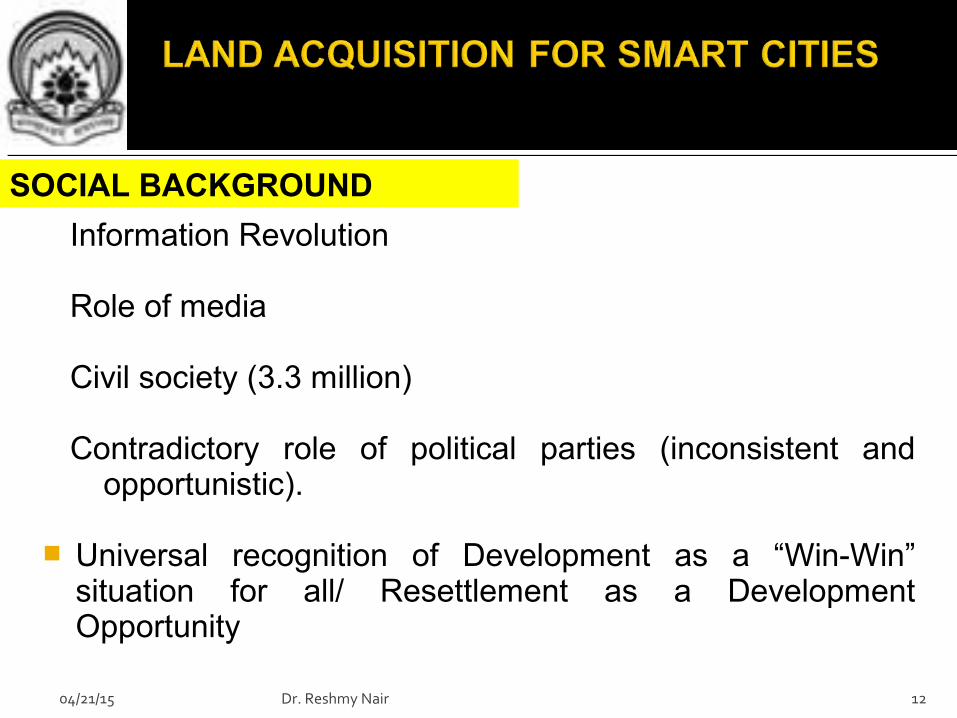
Information Revolution
Role of media
Civil society (3.3 million)
Contradictory role of political parties (inconsistent and opportunistic).
Universal recognition of Development as a “Win-Win” situation for all/ Resettlement as a Development Opportunity
SOCIAL BACKGROUND
04/21/15 Dr. Reshmy Nair 13
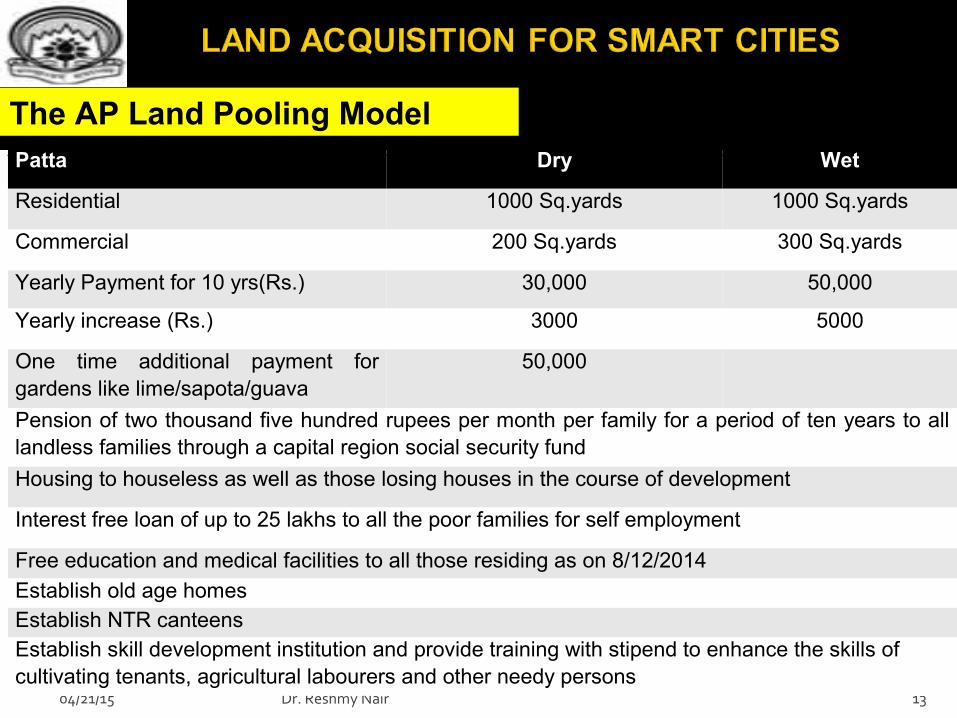
The AP Land Pooling ModelPatta Dry Wet
Residential 1000 Sq.yards 1000 Sq.yards
Commercial 200 Sq.yards 300 Sq.yards
Yearly Payment for 10 yrs(Rs.) 30,000 50,000
Yearly increase (Rs.) 3000 5000
One time additional payment for gardens like lime/sapota/guava
50,000
Pension of two thousand five hundred rupees per month per family for a period of ten years to all landless families through a capital region social security fund
Housing to houseless as well as those losing houses in the course of development
Interest free loan of up to 25 lakhs to all the poor families for self employment
Free education and medical facilities to all those residing as on 8/12/2014
Establish old age homesEstablish NTR canteensEstablish skill development institution and provide training with stipend to enhance the skills of cultivating tenants, agricultural labourers and other needy persons
04/21/15 Dr. Reshmy Nair 14
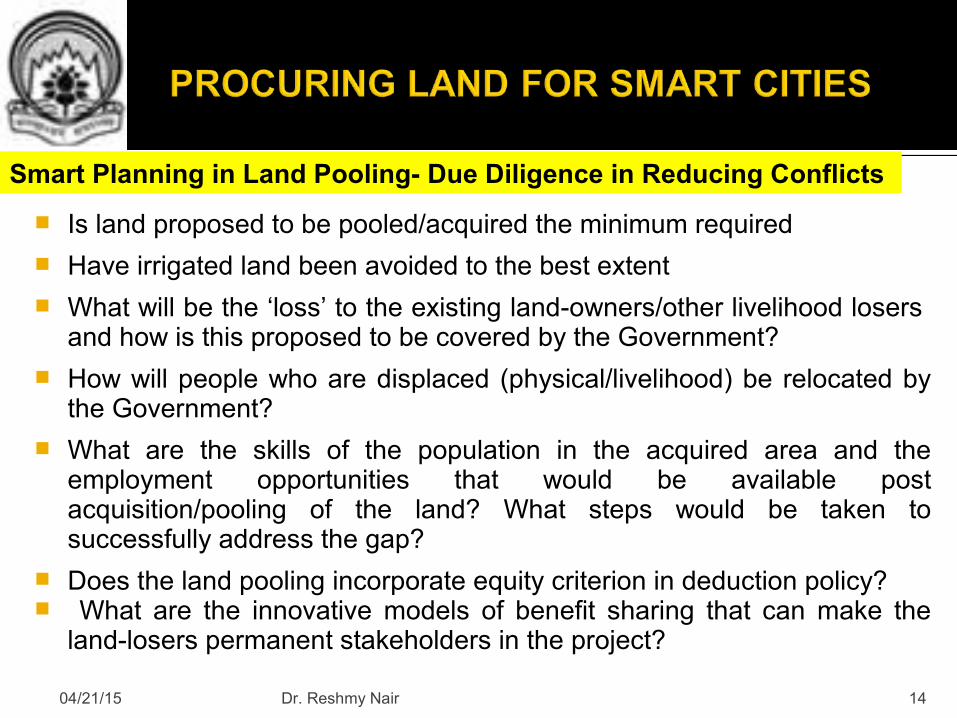
Is land proposed to be pooled/acquired the minimum required
Have irrigated land been avoided to the best extent
What will be the ‘loss’ to the existing land-owners/other livelihood losers and how is this proposed to be covered by the Government?
How will people who are displaced (physical/livelihood) be relocated by the Government?
What are the skills of the population in the acquired area and the employment opportunities that would be available post acquisition/pooling of the land? What steps would be taken to successfully address the gap?
Does the land pooling incorporate equity criterion in deduction policy? What are the innovative models of benefit sharing that can make the
land-losers permanent stakeholders in the project?
Smart Planning in Land Pooling- Due Diligence in Reducing Conflicts