Embed Size (px)
Citation preview
This project is funded by the European Union. The views expressed on this document can in no way be taken
to reflect the official opinion of the European Union.
Low Emission Strategy Development for Rajkot using
GPC for GHG Emissions Baseline
Soumya ChaturvedulaProgramme Coordinator (Energy & Climate)
ICLEI South Asia16th April 2015
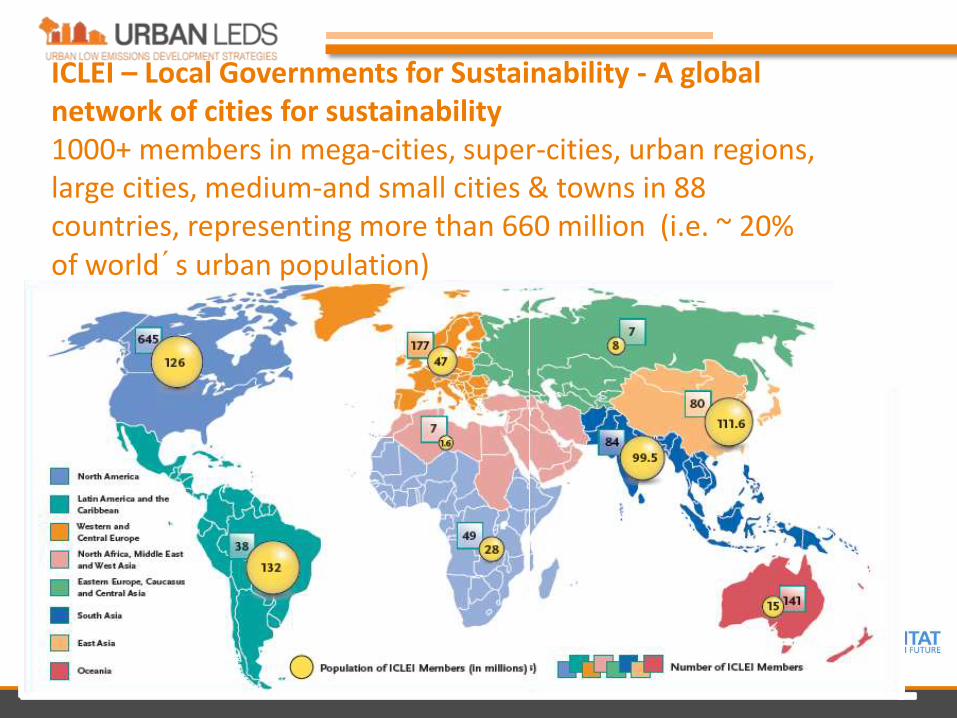
ICLEI – Local Governments for Sustainability - A global network of cities for sustainability1000+ members in mega-cities, super-cities, urban regions, large cities, medium-and small cities & towns in 88 countries, representing more than 660 million (i.e. ~ 20% of world´s urban population)

The Asian cities network 182 cities
Bangladesh, Bhutan, China, Chinese Taipei, India, Indonesia, Japan, Maldives, Mongolia, Nepal, Philippines, Republic of Korea, Sri Lanka, Thailand
211 million inhabitants
36% of the population represented by ICLEI cities worldwide
2013: 7 offices
Japan, Korea, South Asia, Southeast Asia, East asia, Indonesia, Kaoshiung2014: 2 offices+ China, Chinese Taipei
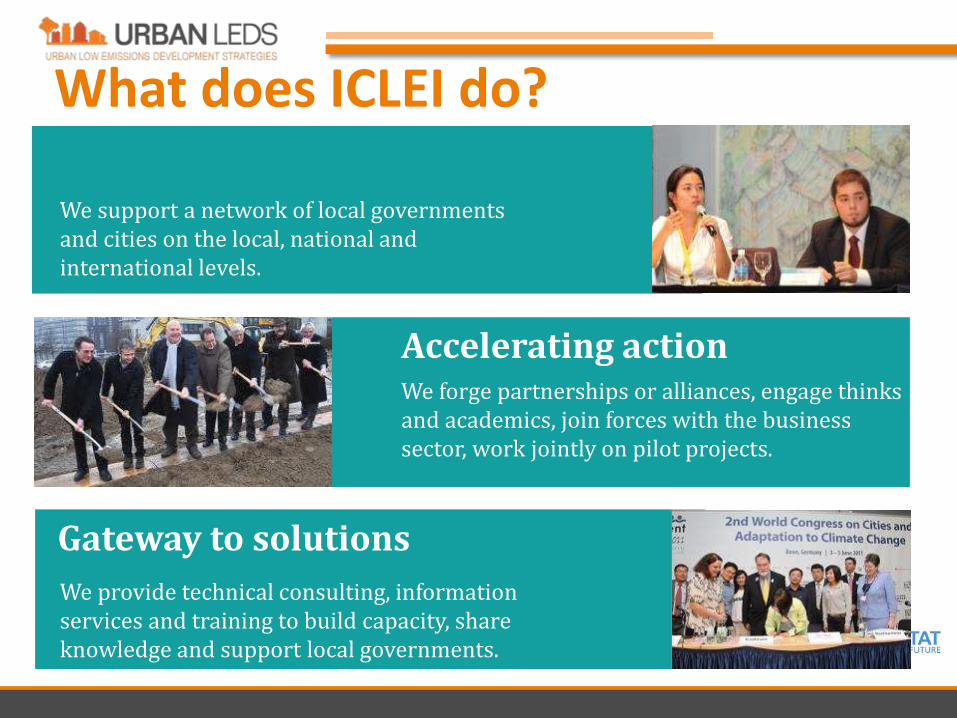
What does ICLEI do?
We support a network of local governments and cities on the local, national and international levels.
We forge partnerships or alliances, engage thinks and academics, join forces with the business sector, work jointly on pilot projects.
Accelerating action
Gateway to solutions
We provide technical consulting, information services and training to build capacity, share knowledge and support local governments.
www.iclei.org
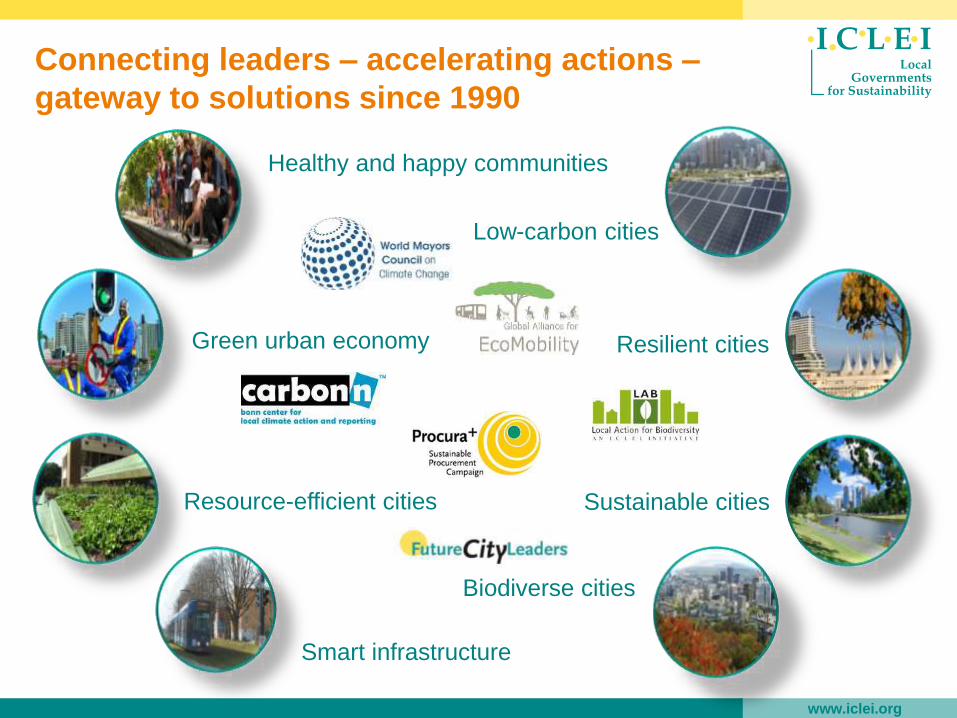
Connecting leaders – accelerating actions –
gateway to solutions since 1990
Resilient cities
Sustainable citiesResource-efficient cities
Biodiverse cities
Low-carbon cities
Smart infrastructure
Green urban economy
Healthy and happy communities
This project is funded by the European Union. The views expressed on this document can in no way be taken
to reflect the official opinion of the European Union.
GPC Compliant Rajkot GHG Emissions Inventory
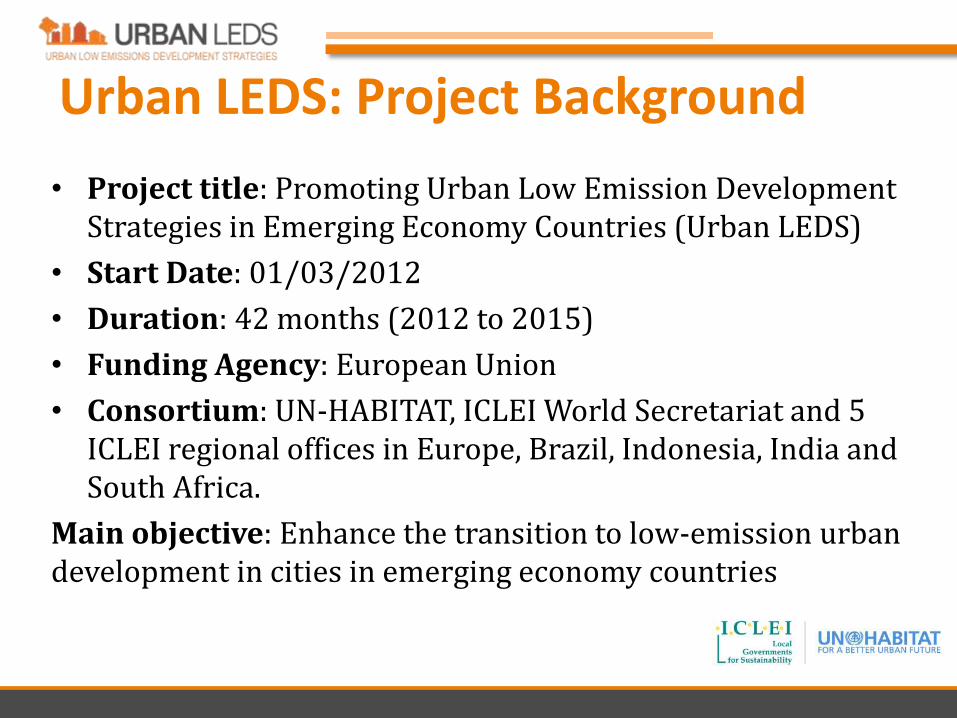
Urban LEDS: Project Background
• Project title: Promoting Urban Low Emission Development Strategies in Emerging Economy Countries (Urban LEDS)
• Start Date: 01/03/2012
• Duration: 42 months (2012 to 2015)
• Funding Agency: European Union
• Consortium: UN-HABITAT, ICLEI World Secretariat and 5 ICLEI regional offices in Europe, Brazil, Indonesia, India and South Africa.
Main objective: Enhance the transition to low-emission urban development in cities in emerging economy countries

I.Analyze
Commit & mobilize
1.1 Secure initial commitment1.2 Set up institutional structures 1.3 Identify & engage stakeholder group(s)
Assess frameworks
2.1 Review relevant contexts 2.2 Conduct community assessment2.3 Record and forecast greenhouse gas emissions
Identify priorities
3.1 Re-orient urban development priorities3.2 Draft low emission development strategic vision3.3 Consult stakeholders and inform council
Develop action plan
4.1 Identify potential solutions & assess multi-impact feasibility4.2 Discuss and define appropriate LED solutions 4.3 Set targets and key performance indicators
Prepare & approve
5.1 Detail identified LED solutions 5.2 Select financing model 5.3 Develop and approve final version of Urban-LED action plan
6.1 Develop institutional arrangements and capacity 6.2 Form alliances and partnerships6.3 Mobilize financial resources
III.Accelerate
II.Act
Monitor
7.1 Develop a process monitoring & evaluation system 7.2 Develop a project Measuring, Reporting & Verification process7.3 Implement MRV process
Evaluate& report
8.1 Evaluate progress 8.2 Remove barriers and institutionalize8.3 Report achievements regularly
Enhance
9.1 Optimize GHG inventory9.2 Identify/review LED priority areas9.3 Re-define & scale-up Urban-LED strategy
1
2 3
4
5
6
78
9Implement policies & actions
GCC Steps
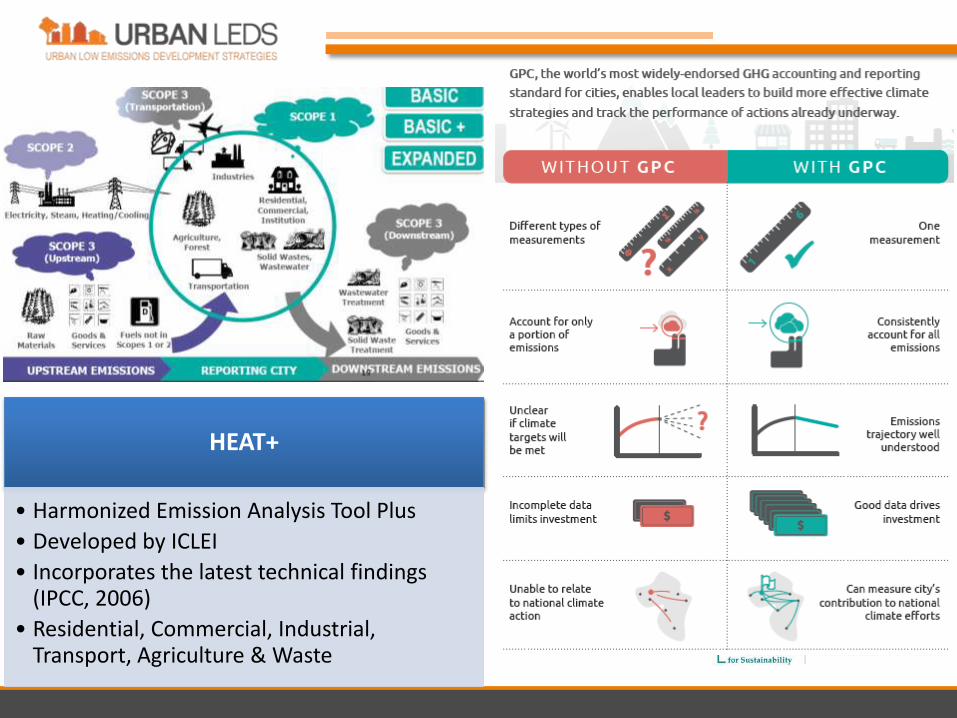
HEAT+
• Harmonized Emission Analysis Tool Plus
• Developed by ICLEI
• Incorporates the latest technical findings (IPCC, 2006)
• Residential, Commercial, Industrial, Transport, Agriculture & Waste
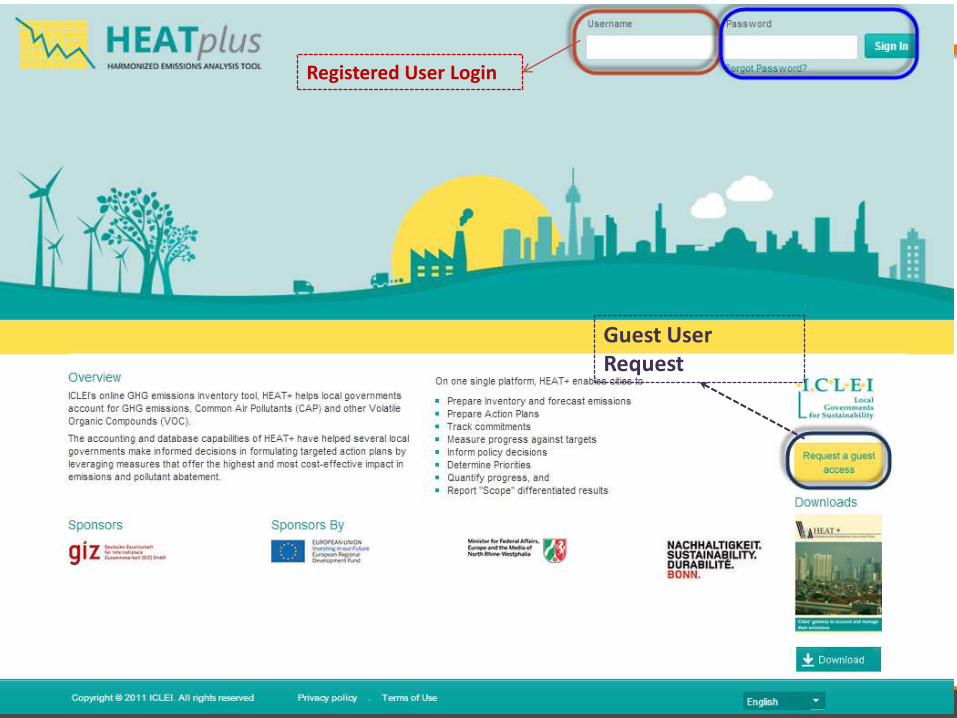
Registered User Login
Guest User Request
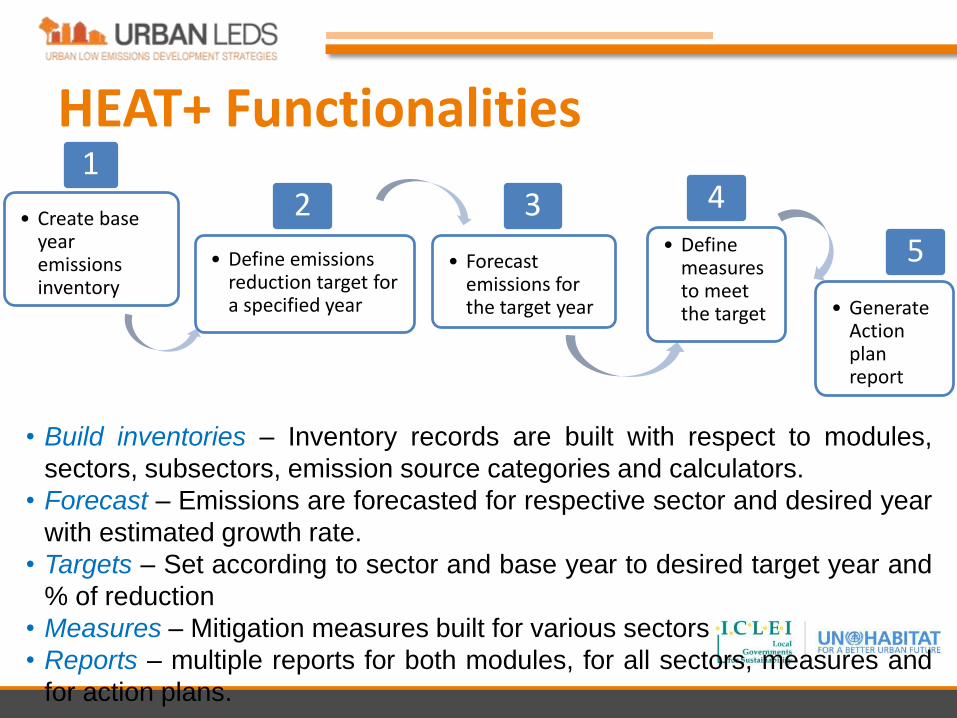
HEAT+ Functionalities
• Build inventories – Inventory records are built with respect to modules,
sectors, subsectors, emission source categories and calculators.
• Forecast – Emissions are forecasted for respective sector and desired year
with estimated growth rate.
• Targets – Set according to sector and base year to desired target year and
% of reduction
• Measures – Mitigation measures built for various sectors
• Reports – multiple reports for both modules, for all sectors, measures and
for action plans.
• Create base year emissions inventory
1
• Define emissions reduction target for a specified year
2
• Forecast emissions for the target year
3• Define
measures to meet the target
4
• Generate Action plan report
5
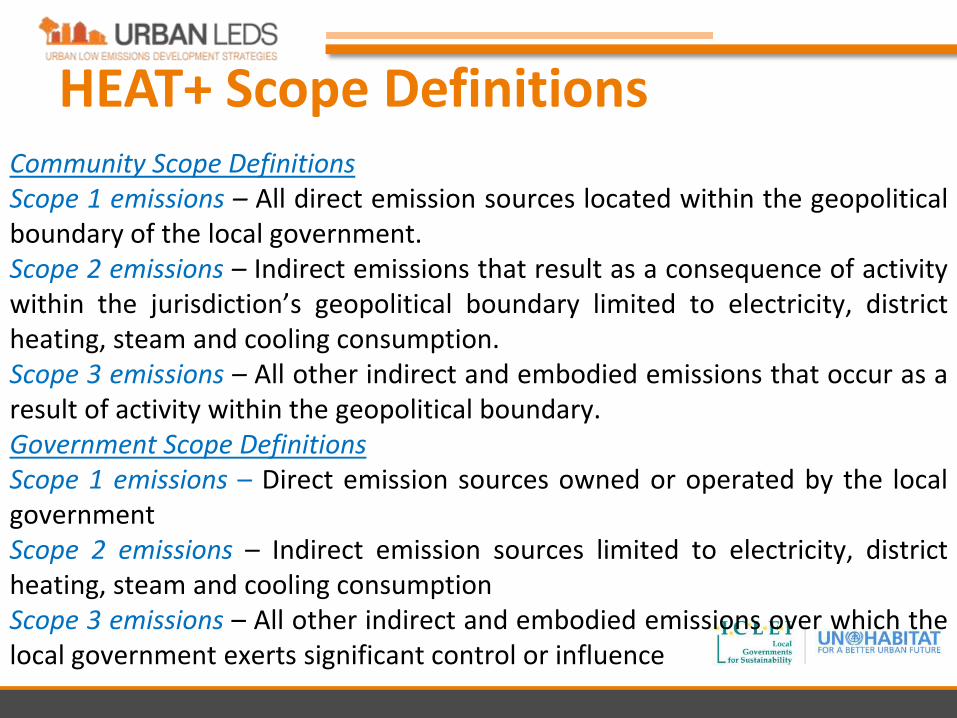
HEAT+ Scope DefinitionsCommunity Scope DefinitionsScope 1 emissions – All direct emission sources located within the geopoliticalboundary of the local government.Scope 2 emissions – Indirect emissions that result as a consequence of activitywithin the jurisdiction’s geopolitical boundary limited to electricity, districtheating, steam and cooling consumption.Scope 3 emissions – All other indirect and embodied emissions that occur as aresult of activity within the geopolitical boundary.Government Scope DefinitionsScope 1 emissions – Direct emission sources owned or operated by the localgovernmentScope 2 emissions – Indirect emission sources limited to electricity, districtheating, steam and cooling consumptionScope 3 emissions – All other indirect and embodied emissions over which thelocal government exerts significant control or influence
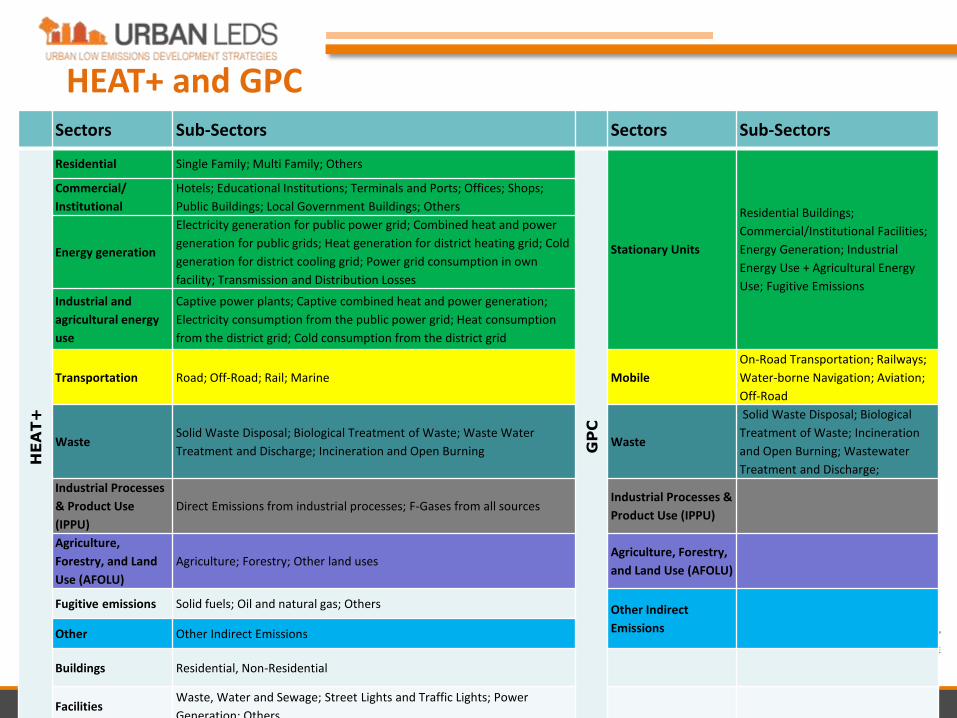
HEAT+ and GPCSectors Sub-Sectors Sectors Sub-Sectors
HEAT+
Residential Single Family; Multi Family; Others
GPC
Stationary Units
Residential Buildings;
Commercial/Institutional Facilities;
Energy Generation; Industrial
Energy Use + Agricultural Energy
Use; Fugitive Emissions
Commercial/
Institutional
Hotels; Educational Institutions; Terminals and Ports; Offices; Shops;
Public Buildings; Local Government Buildings; Others
Energy generation
Electricity generation for public power grid; Combined heat and power
generation for public grids; Heat generation for district heating grid; Cold
generation for district cooling grid; Power grid consumption in own
facility; Transmission and Distribution Losses
Industrial and
agricultural energy
use
Captive power plants; Captive combined heat and power generation;
Electricity consumption from the public power grid; Heat consumption
from the district grid; Cold consumption from the district grid
Transportation Road; Off-Road; Rail; Marine Mobile
On-Road Transportation; Railways;
Water-borne Navigation; Aviation;
Off-Road
WasteSolid Waste Disposal; Biological Treatment of Waste; Waste Water
Treatment and Discharge; Incineration and Open BurningWaste
Solid Waste Disposal; Biological
Treatment of Waste; Incineration
and Open Burning; Wastewater
Treatment and Discharge;
Industrial Processes
& Product Use
(IPPU)
Direct Emissions from industrial processes; F-Gases from all sources Industrial Processes &
Product Use (IPPU)
Agriculture,
Forestry, and Land
Use (AFOLU)
Agriculture; Forestry; Other land usesAgriculture, Forestry,
and Land Use (AFOLU)
Fugitive emissions Solid fuels; Oil and natural gas; Others Other Indirect
EmissionsOther Other Indirect Emissions
Buildings Residential, Non-Residential
FacilitiesWaste, Water and Sewage; Street Lights and Traffic Lights; Power
Generation; Others
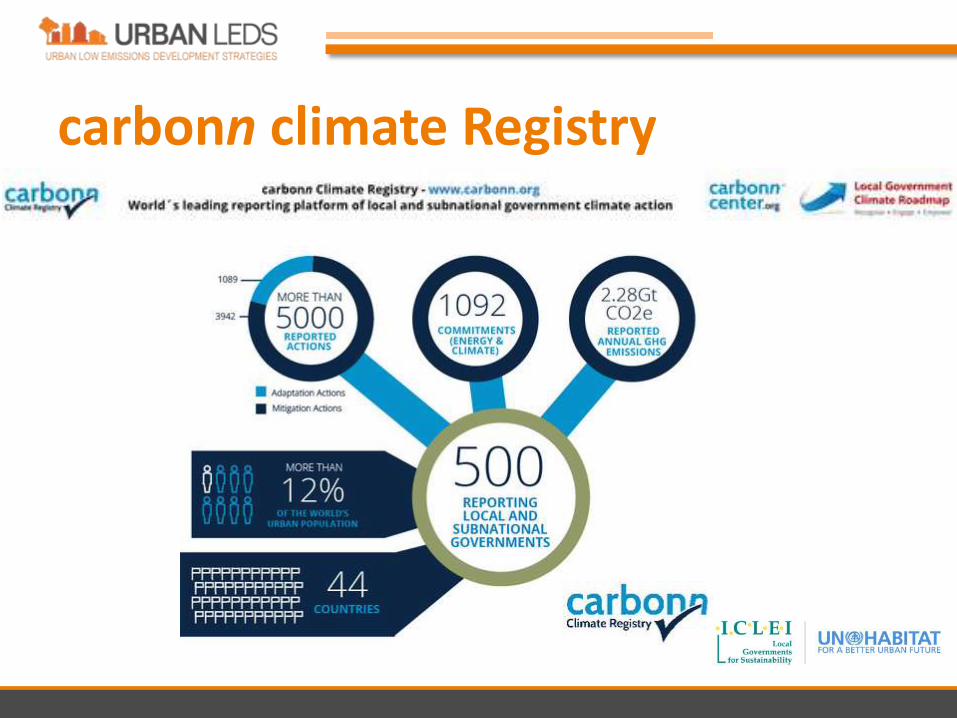
carbonn climate Registry
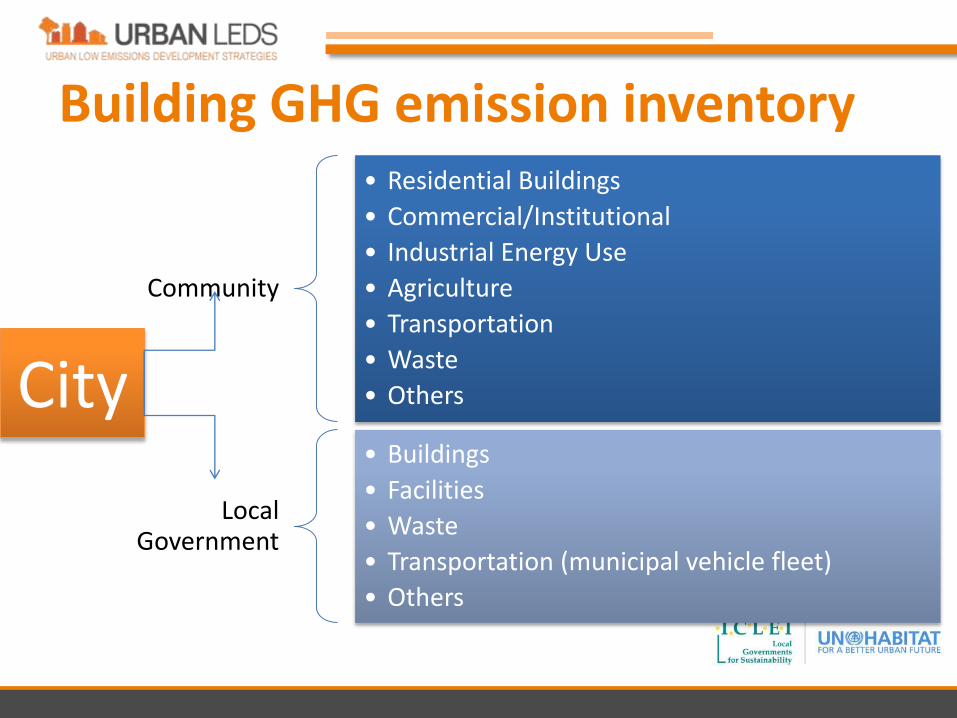
Building GHG emission inventory
Community
• Residential Buildings
• Commercial/Institutional
• Industrial Energy Use
• Agriculture
• Transportation
• Waste
• Others
Local Government
• Buildings
• Facilities
• Waste
• Transportation (municipal vehicle fleet)
• Others
City
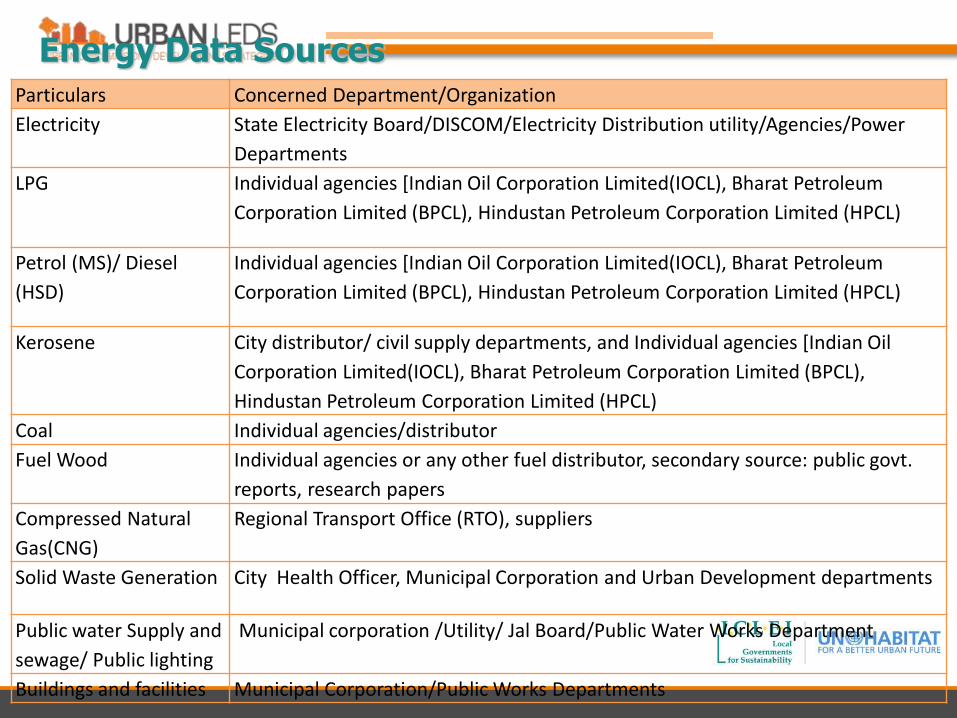
Particulars Concerned Department/Organization
Electricity State Electricity Board/DISCOM/Electricity Distribution utility/Agencies/Power
Departments
LPG Individual agencies [Indian Oil Corporation Limited(IOCL), Bharat Petroleum
Corporation Limited (BPCL), Hindustan Petroleum Corporation Limited (HPCL)
Petrol (MS)/ Diesel
(HSD)
Individual agencies [Indian Oil Corporation Limited(IOCL), Bharat Petroleum
Corporation Limited (BPCL), Hindustan Petroleum Corporation Limited (HPCL)
Kerosene City distributor/ civil supply departments, and Individual agencies [Indian Oil
Corporation Limited(IOCL), Bharat Petroleum Corporation Limited (BPCL),
Hindustan Petroleum Corporation Limited (HPCL)
Coal Individual agencies/distributor
Fuel Wood Individual agencies or any other fuel distributor, secondary source: public govt.
reports, research papers
Compressed Natural
Gas(CNG)
Regional Transport Office (RTO), suppliers
Solid Waste Generation City Health Officer, Municipal Corporation and Urban Development departments
Public water Supply and
sewage/ Public lighting
Municipal corporation /Utility/ Jal Board/Public Water Works Department
Buildings and facilities Municipal Corporation/Public Works Departments
Energy Data Sources

Residential38.4%
Commercial9.4%
Industrial14.8%
Transportation, 37.4%
Sector-wise Energy Consumption, 2012-13
Electricity20.5%
Diesel20.2%
Petrol9.7%
CNG7.5%
PNG11.4%
LPG22.2%
Kerosene8.5%
Fuel-wise Consumption, 2012-13
Residential50%
Commercial16%
Industrial34%
Sector-wise Electricity Consumption, 2012-13
Rajkot City Baseline Energy Use
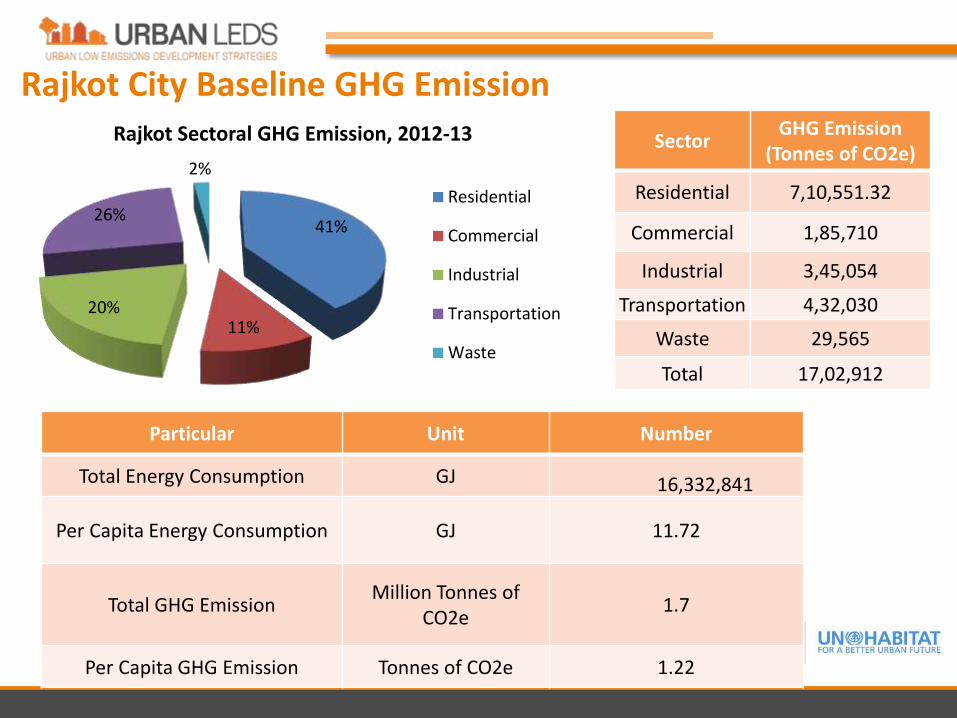
41%
11%20%
26%
2%
Rajkot Sectoral GHG Emission, 2012-13
Residential
Commercial
Industrial
Transportation
Waste
SectorGHG Emission
(Tonnes of CO2e)
Residential 7,10,551.32
Commercial 1,85,710
Industrial 3,45,054
Transportation 4,32,030
Waste 29,565
Total 17,02,912
Particular Unit Number
Total Energy Consumption GJ 16,332,841
Per Capita Energy Consumption GJ 11.72
Total GHG EmissionMillion Tonnes of
CO2e1.7
Per Capita GHG Emission Tonnes of CO2e 1.22
Rajkot City Baseline GHG Emission
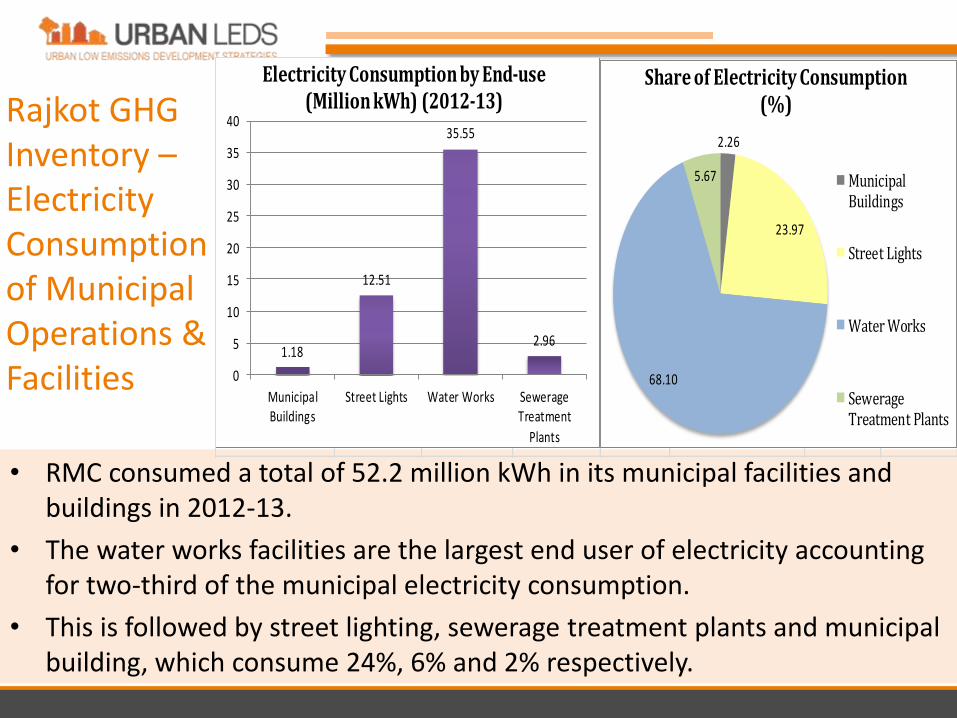
• RMC consumed a total of 52.2 million kWh in its municipal facilities and buildings in 2012-13.
• The water works facilities are the largest end user of electricity accounting for two-third of the municipal electricity consumption.
• This is followed by street lighting, sewerage treatment plants and municipal building, which consume 24%, 6% and 2% respectively.
Rajkot GHG Inventory –Electricity Consumption of Municipal Operations & Facilities
1.18
12.51
35.55
2.96
0
5
10
15
20
25
30
35
40
MunicipalBuildings
Street Lights Water Works SewerageTreatment
Plants
Electricity Consumption by End-use (Million kWh) (2012-13)
2.26
23.97
68.10
5.67
Share of Electricity Consumption (%)
MunicipalBuildings
Street Lights
Water Works
SewerageTreatment Plants
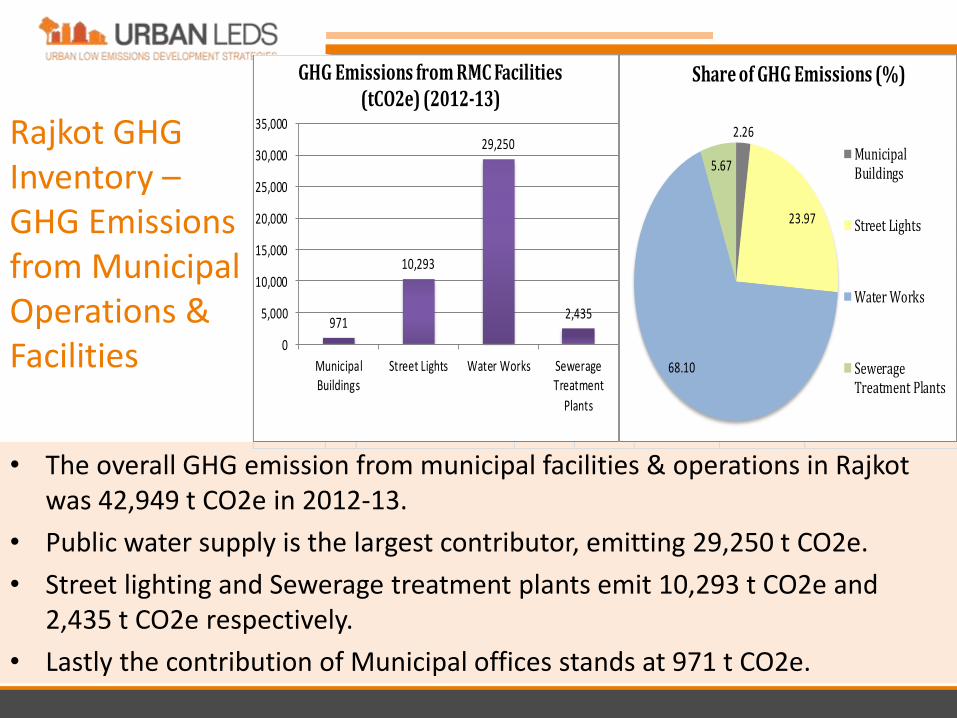
• The overall GHG emission from municipal facilities & operations in Rajkot was 42,949 t CO2e in 2012-13.
• Public water supply is the largest contributor, emitting 29,250 t CO2e.
• Street lighting and Sewerage treatment plants emit 10,293 t CO2e and 2,435 t CO2e respectively.
• Lastly the contribution of Municipal offices stands at 971 t CO2e.
Rajkot GHG Inventory –GHG Emissions from Municipal Operations & Facilities
971
10,293
29,250
2,435
0
5,000
10,000
15,000
20,000
25,000
30,000
35,000
MunicipalBuildings
Street Lights Water Works SewerageTreatment
Plants
GHG Emissions from RMC Facilities (tCO2e) (2012-13)
2.26
23.97
68.10
5.67
Share of GHG Emissions (%)
MunicipalBuildings
Street Lights
Water Works
SewerageTreatment Plants

LEDS Development ProcessBaseline Assessment•Service Provision•Resource Availability•Energy Use•GHG emission
Development Process•CDP, CMP•Solar Master Plan•SFCP•Municipal Budget
Sectoral Service Demand Forecasting•Local Government Operations•Community
Sectoral Energy Demand and GHG Forecasting
LEDS Visioning & Goal Setting
LEDS Strategy & Action Plan•Implementation Plan•Financial Plan
Integration with current planning framework in Local Authority
LEDS Development
Process

Statistical Analysis to forecast energy demand & future service level demand
Identify & predict influencing parameters (e.g.: PNG consumption: Cost of PNG, No. of Connections)
Time Series Data of Sectoral Energy Consumption, Demography, Land Use & Existing Service Levels
Energy Demand & Service Provision Forecast

1.57 Million
GJ
152.51 thousand
tonnes CO2e
3.15 Million
GJ
305 thousand
tonnes CO2e
3.05 Million tonnes CO2e
31.47 Million GJ
RAJKOT - Low Emissions Development Strategy (LEDS) Actions
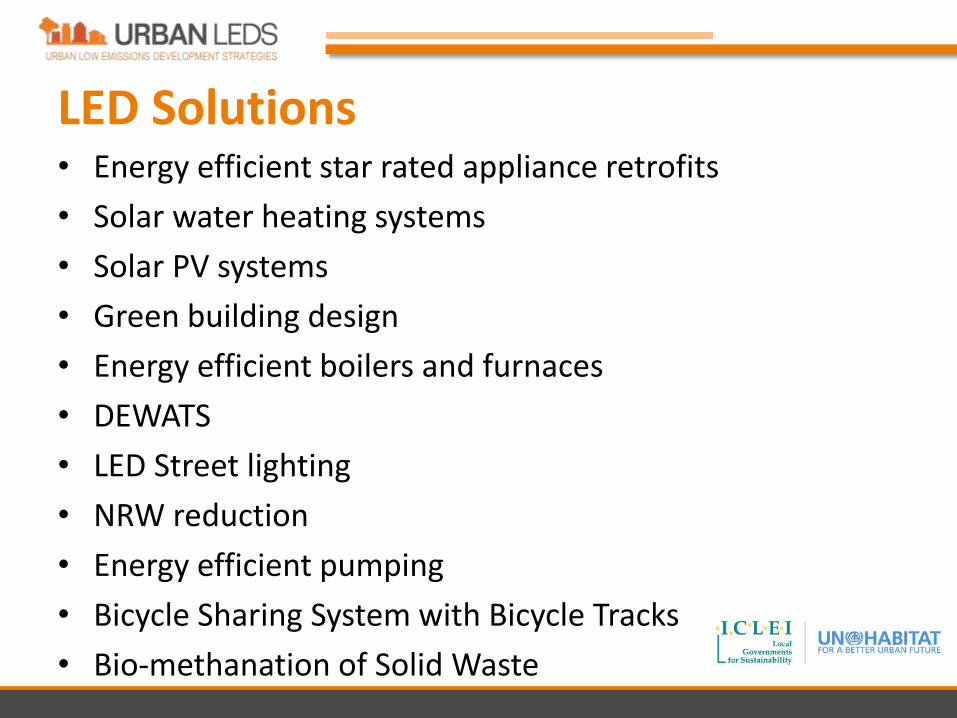
• Energy efficient star rated appliance retrofits
• Solar water heating systems
• Solar PV systems
• Green building design
• Energy efficient boilers and furnaces
• DEWATS
• LED Street lighting
• NRW reduction
• Energy efficient pumping
• Bicycle Sharing System with Bicycle Tracks
• Bio-methanation of Solid Waste
LED Solutions

Solutions for Rajkot city - Residential
EquipmentElectricity
Consumption (MU)
Energy Efficiency measures - star rated appliances
Energy saving (%)Potential Energy
saving (MU)
Fans 237 33 78
Lighting 195 50 98
Refrigeration 91 50 45
Air Conditioning 49 20 9.8
TV 27 40 11
Residential sector electricity consumption (2019-2020)=699.53 Million Units
Star rated appliance retrofits in 50,000 HHs by 2020: 27.5 MU saving/yrStar rated appliance retrofits in 100,000 HHs by 2020: 55 MU saving/yr
Solutions for Rajkot city - Residential
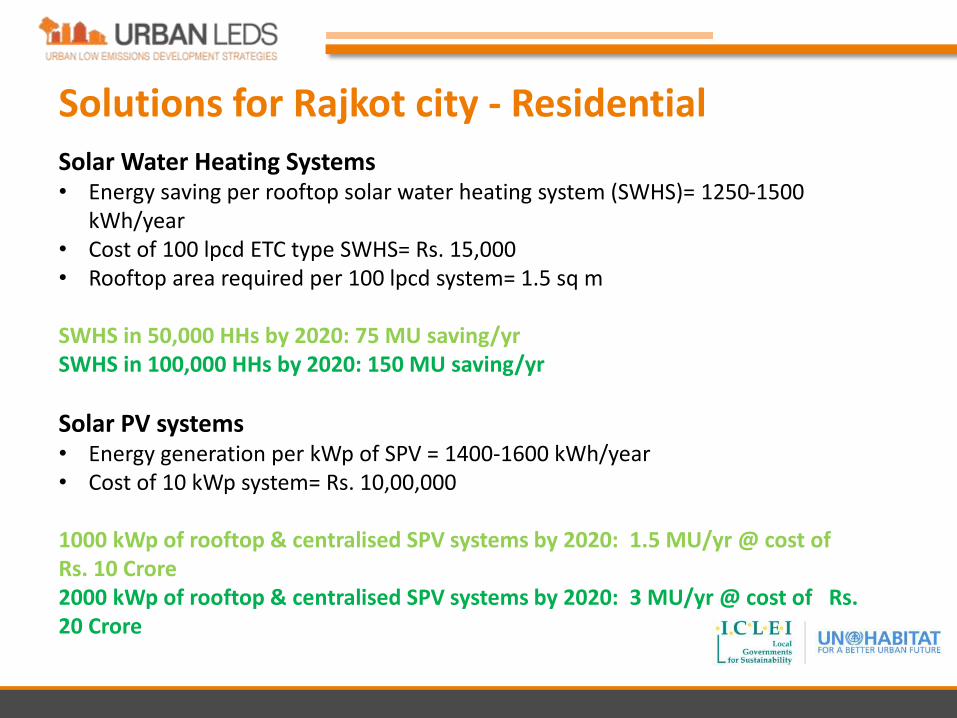
Solar Water Heating Systems• Energy saving per rooftop solar water heating system (SWHS)= 1250-1500
kWh/year• Cost of 100 lpcd ETC type SWHS= Rs. 15,000• Rooftop area required per 100 lpcd system= 1.5 sq m
SWHS in 50,000 HHs by 2020: 75 MU saving/yrSWHS in 100,000 HHs by 2020: 150 MU saving/yr
Solar PV systems• Energy generation per kWp of SPV = 1400-1600 kWh/year• Cost of 10 kWp system= Rs. 10,00,000
1000 kWp of rooftop & centralised SPV systems by 2020: 1.5 MU/yr @ cost of Rs. 10 Crore 2000 kWp of rooftop & centralised SPV systems by 2020: 3 MU/yr @ cost of Rs. 20 Crore
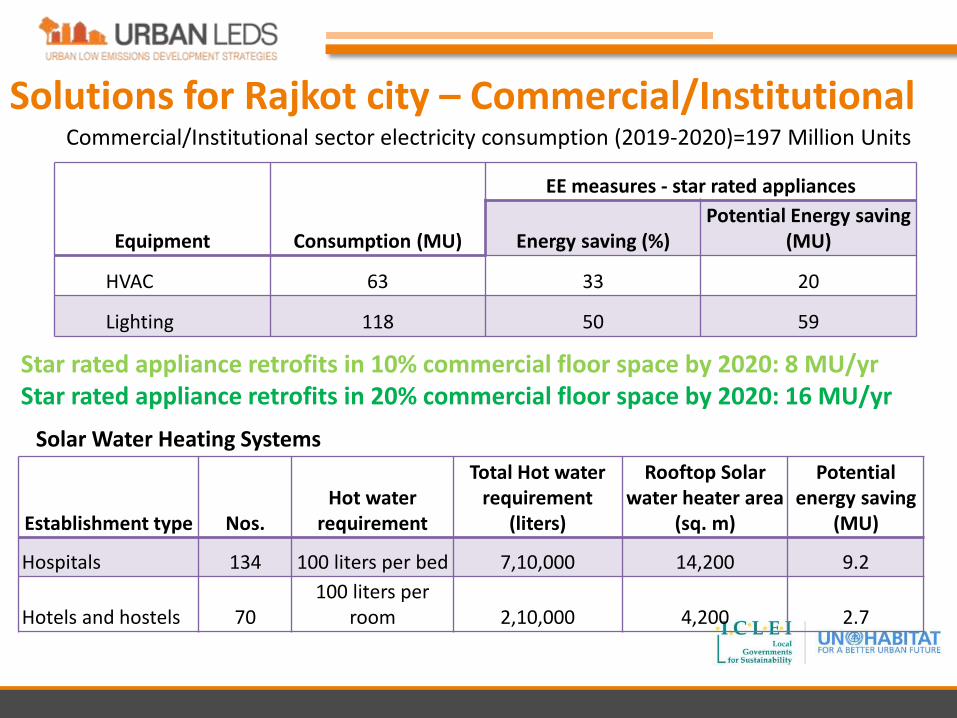
Solutions for Rajkot city – Commercial/Institutional
Equipment Consumption (MU)
EE measures - star rated appliances
Energy saving (%)Potential Energy saving
(MU)
HVAC 63 33 20
Lighting 118 50 59
Commercial/Institutional sector electricity consumption (2019-2020)=197 Million Units
Establishment type Nos.Hot water
requirement
Total Hot water requirement
(liters)
Rooftop Solar water heater area
(sq. m)
Potential energy saving
(MU)
Hospitals 134 100 liters per bed 7,10,000 14,200 9.2
Hotels and hostels 70100 liters per
room 2,10,000 4,200 2.7
Star rated appliance retrofits in 10% commercial floor space by 2020: 8 MU/yrStar rated appliance retrofits in 20% commercial floor space by 2020: 16 MU/yr
Solar Water Heating Systems
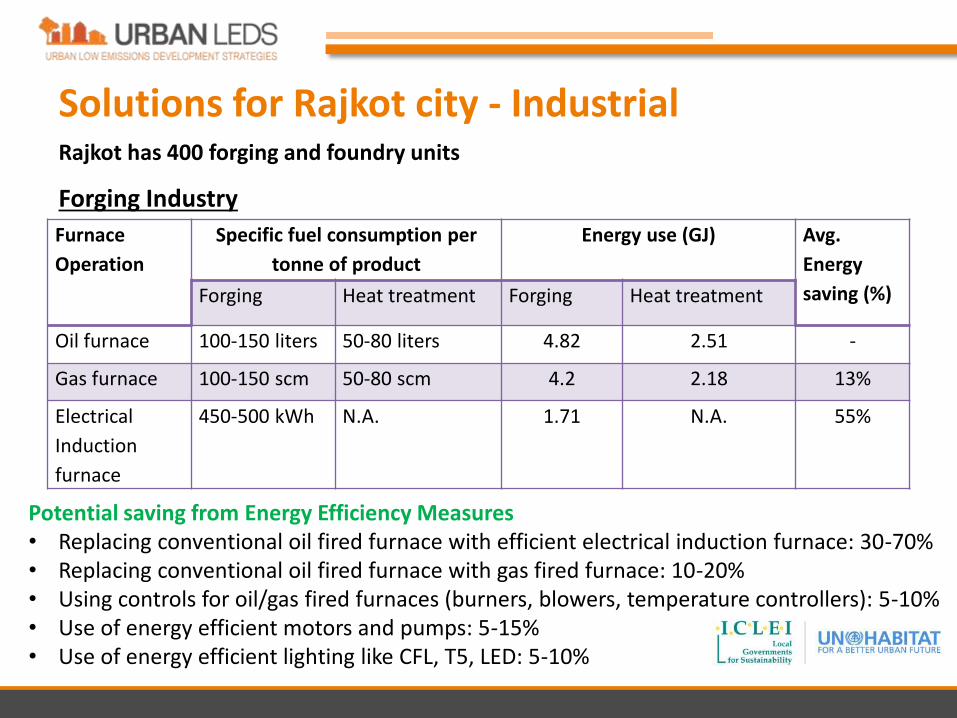
Furnace
Operation
Specific fuel consumption per
tonne of product
Energy use (GJ) Avg.
Energy
saving (%)Forging Heat treatment Forging Heat treatment
Oil furnace 100-150 liters 50-80 liters 4.82 2.51 -
Gas furnace 100-150 scm 50-80 scm 4.2 2.18 13%
Electrical
Induction
furnace
450-500 kWh N.A. 1.71 N.A. 55%
Solutions for Rajkot city - IndustrialRajkot has 400 forging and foundry units
Potential saving from Energy Efficiency Measures• Replacing conventional oil fired furnace with efficient electrical induction furnace: 30-70%• Replacing conventional oil fired furnace with gas fired furnace: 10-20%• Using controls for oil/gas fired furnaces (burners, blowers, temperature controllers): 5-10%• Use of energy efficient motors and pumps: 5-15%• Use of energy efficient lighting like CFL, T5, LED: 5-10%
Forging Industry
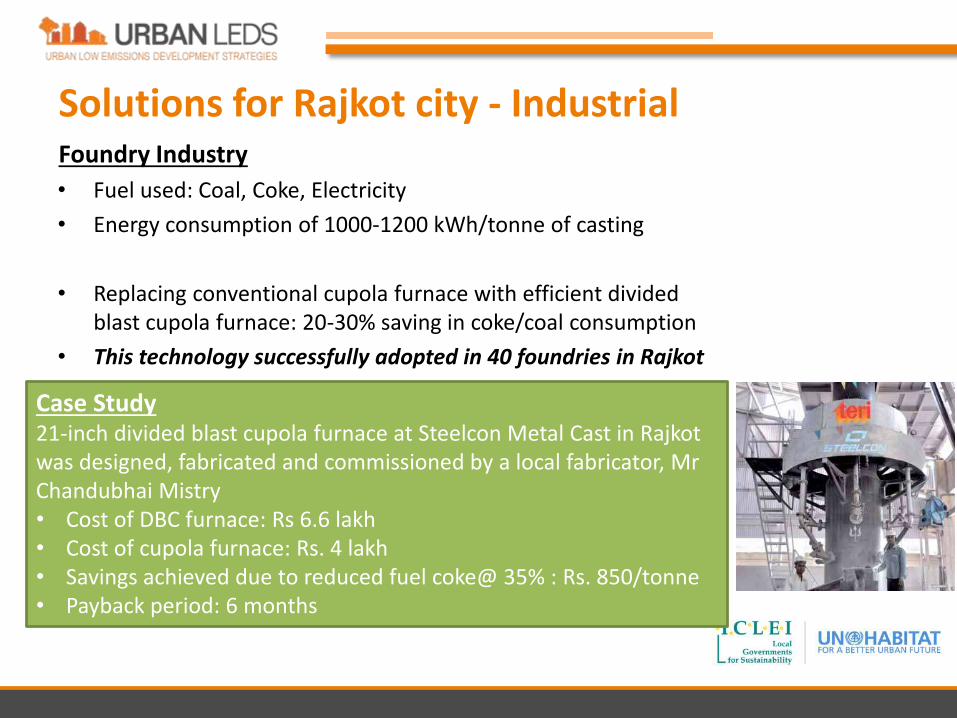
Solutions for Rajkot city - IndustrialFoundry Industry
• Fuel used: Coal, Coke, Electricity
• Energy consumption of 1000-1200 kWh/tonne of casting
• Replacing conventional cupola furnace with efficient divided blast cupola furnace: 20-30% saving in coke/coal consumption
• This technology successfully adopted in 40 foundries in Rajkot
Case Study21-inch divided blast cupola furnace at Steelcon Metal Cast in Rajkot was designed, fabricated and commissioned by a local fabricator, MrChandubhai Mistry• Cost of DBC furnace: Rs 6.6 lakh• Cost of cupola furnace: Rs. 4 lakh• Savings achieved due to reduced fuel coke@ 35% : Rs. 850/tonne• Payback period: 6 months
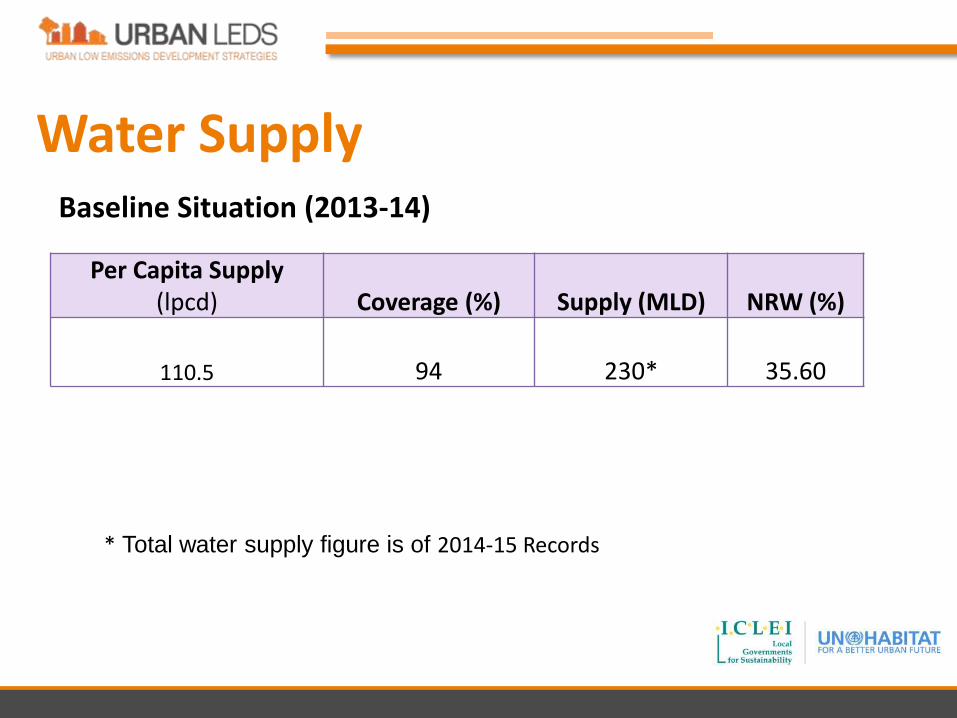
Per Capita Supply (lpcd) Coverage (%) Supply (MLD) NRW (%)
110.5 94 230* 35.60
Water SupplyBaseline Situation (2013-14)
* Total water supply figure is of 2014-15 Records
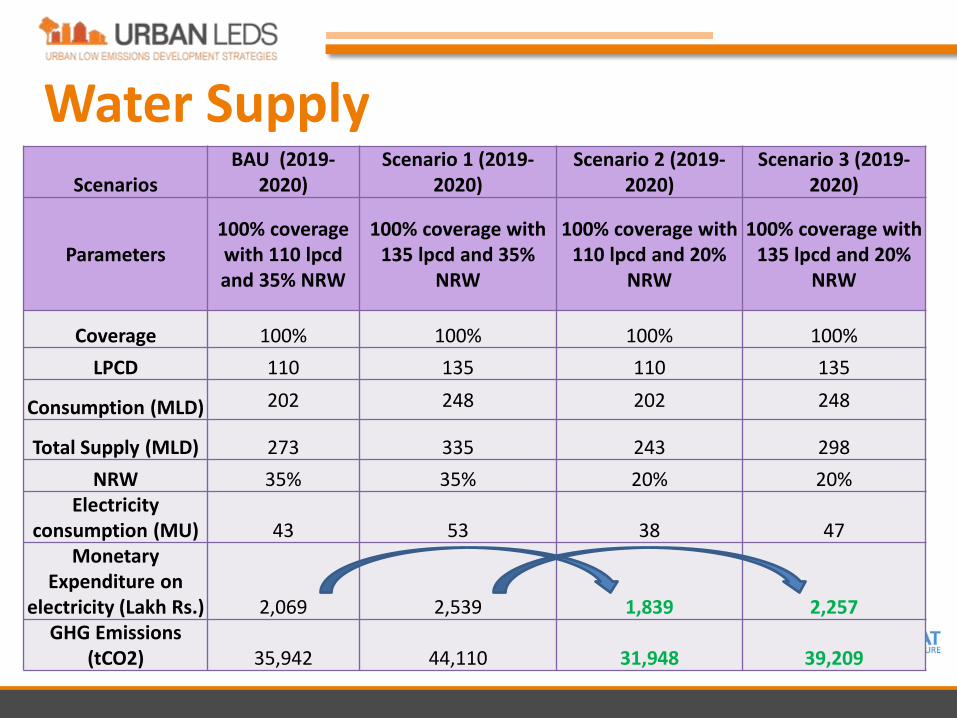
Water SupplyScenarios
BAU (2019-2020)
Scenario 1 (2019-2020)
Scenario 2 (2019-2020)
Scenario 3 (2019-2020)
Parameters100% coverage with 110 lpcdand 35% NRW
100% coverage with 135 lpcd and 35%
NRW
100% coverage with 110 lpcd and 20%
NRW
100% coverage with 135 lpcd and 20%
NRW
Coverage 100% 100% 100% 100%
LPCD 110 135 110 135
Consumption (MLD) 202 248 202 248
Total Supply (MLD) 273 335 243 298
NRW 35% 35% 20% 20%Electricity
consumption (MU) 43 53 38 47 Monetary
Expenditure on electricity (Lakh Rs.) 2,069 2,539 1,839 2,257
GHG Emissions (tCO2) 35,942 44,110 31,948 39,209
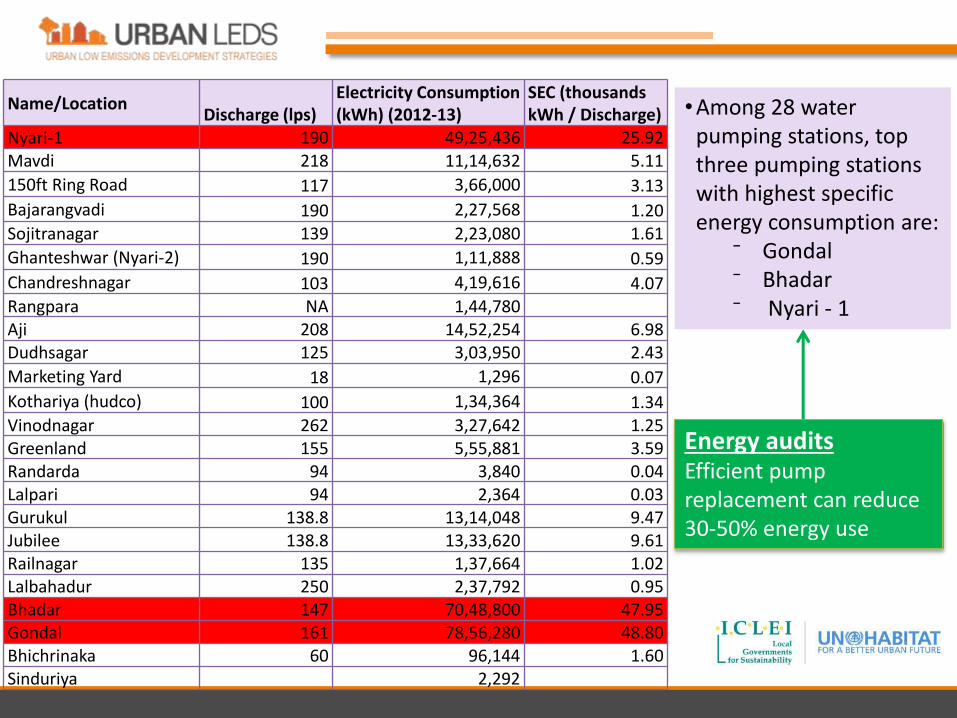
Name/LocationDischarge (lps)
Electricity Consumption (kWh) (2012-13)
SEC (thousands kWh / Discharge)
Nyari-1 190 49,25,436 25.92Mavdi 218 11,14,632 5.11
150ft Ring Road 117 3,66,000 3.13
Bajarangvadi 190 2,27,568 1.20Sojitranagar 139 2,23,080 1.61
Ghanteshwar (Nyari-2) 190 1,11,888 0.59
Chandreshnagar 103 4,19,616 4.07Rangpara NA 1,44,780Aji 208 14,52,254 6.98Dudhsagar 125 3,03,950 2.43
Marketing Yard 18 1,296 0.07
Kothariya (hudco) 100 1,34,364 1.34Vinodnagar 262 3,27,642 1.25Greenland 155 5,55,881 3.59Randarda 94 3,840 0.04Lalpari 94 2,364 0.03Gurukul 138.8 13,14,048 9.47Jubilee 138.8 13,33,620 9.61Railnagar 135 1,37,664 1.02Lalbahadur 250 2,37,792 0.95Bhadar 147 70,48,800 47.95Gondal 161 78,56,280 48.80Bhichrinaka 60 96,144 1.60Sinduriya 2,292
•Among 28 water pumping stations, top three pumping stations with highest specific energy consumption are:
⁻ Gondal⁻ Bhadar⁻ Nyari - 1
Energy auditsEfficient pump replacement can reduce 30-50% energy use
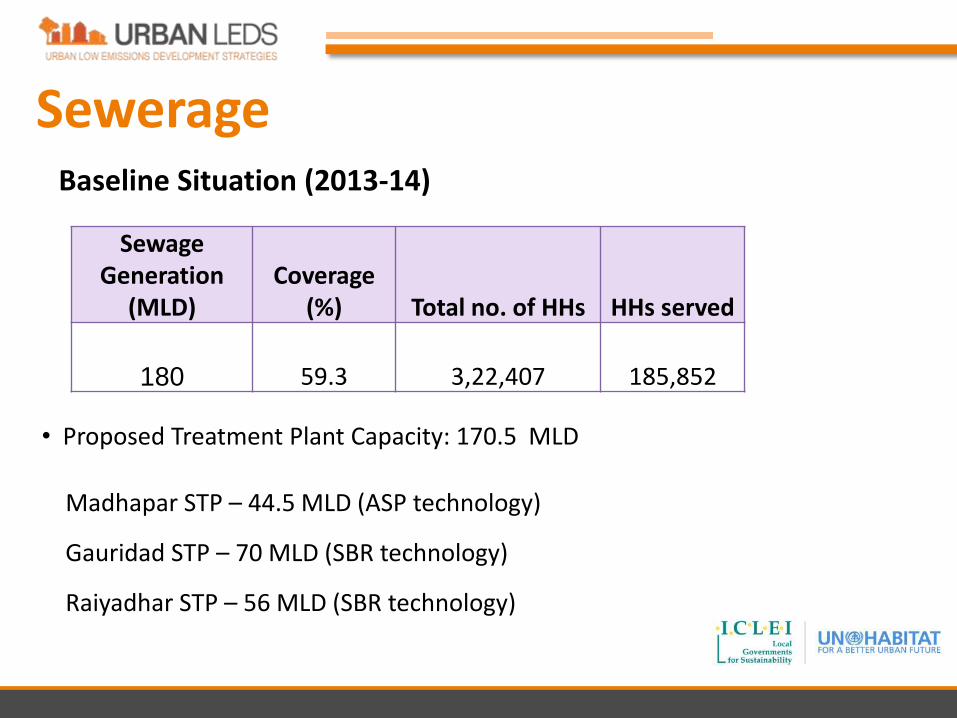
Sewerage
• Proposed Treatment Plant Capacity: 170.5 MLD
Madhapar STP – 44.5 MLD (ASP technology)
Gauridad STP – 70 MLD (SBR technology)
Raiyadhar STP – 56 MLD (SBR technology)
Baseline Situation (2013-14)
Sewage Generation
(MLD)Coverage
(%) Total no. of HHs HHs served
180 59.3 3,22,407 185,852
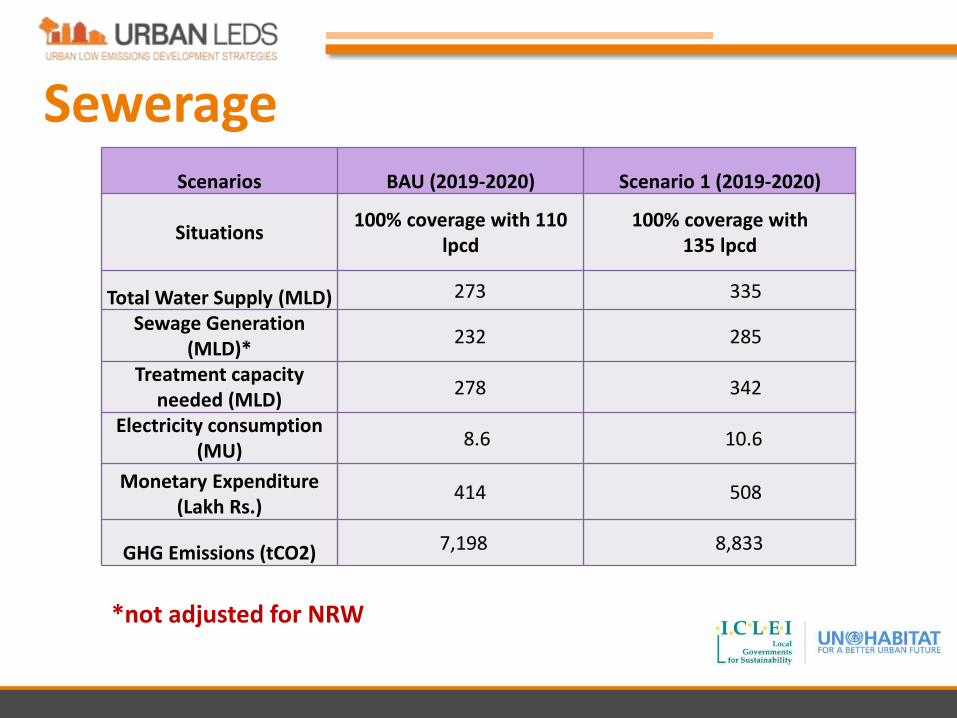
SewerageScenarios BAU (2019-2020) Scenario 1 (2019-2020)
Situations 100% coverage with 110
lpcd100% coverage with
135 lpcd
Total Water Supply (MLD) 273 335
Sewage Generation (MLD)*
232 285
Treatment capacity needed (MLD)
278 342
Electricity consumption (MU)
8.6 10.6
Monetary Expenditure (Lakh Rs.)
414 508
GHG Emissions (tCO2) 7,198 8,833
*not adjusted for NRW
Sewerage
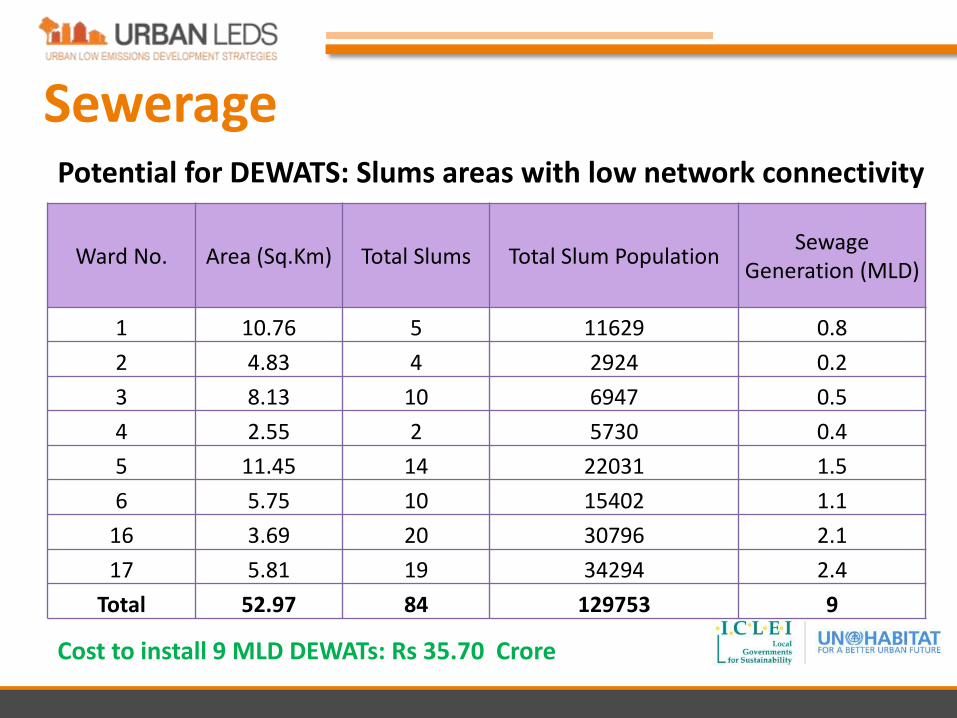
Ward No. Area (Sq.Km) Total Slums Total Slum PopulationSewage
Generation (MLD)
1 10.76 5 11629 0.8
2 4.83 4 2924 0.2
3 8.13 10 6947 0.5
4 2.55 2 5730 0.4
5 11.45 14 22031 1.5
6 5.75 10 15402 1.1
16 3.69 20 30796 2.1
17 5.81 19 34294 2.4
Total 52.97 84 129753 9
Cost to install 9 MLD DEWATs: Rs 35.70 Crore
Potential for DEWATS: Slums areas with low network connectivity
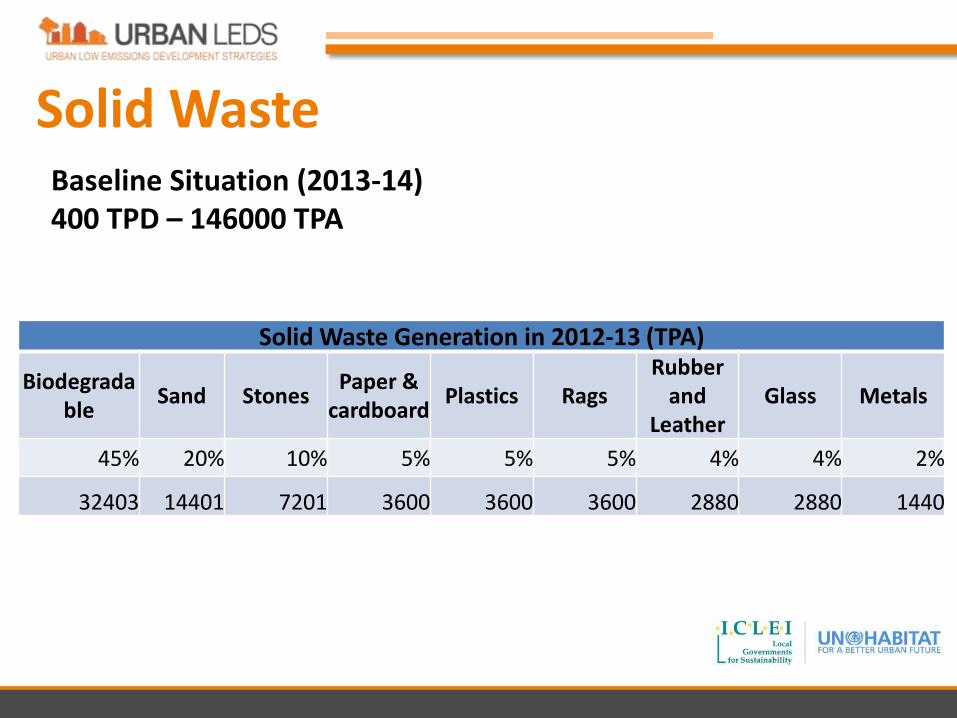
Solid Waste Baseline Situation (2013-14)400 TPD – 146000 TPA
Solid Waste Generation in 2012-13 (TPA)
Biodegradable
Sand StonesPaper &
cardboardPlastics Rags
Rubber and
LeatherGlass Metals
45% 20% 10% 5% 5% 5% 4% 4% 2%
32403 14401 7201 3600 3600 3600 2880 2880 1440
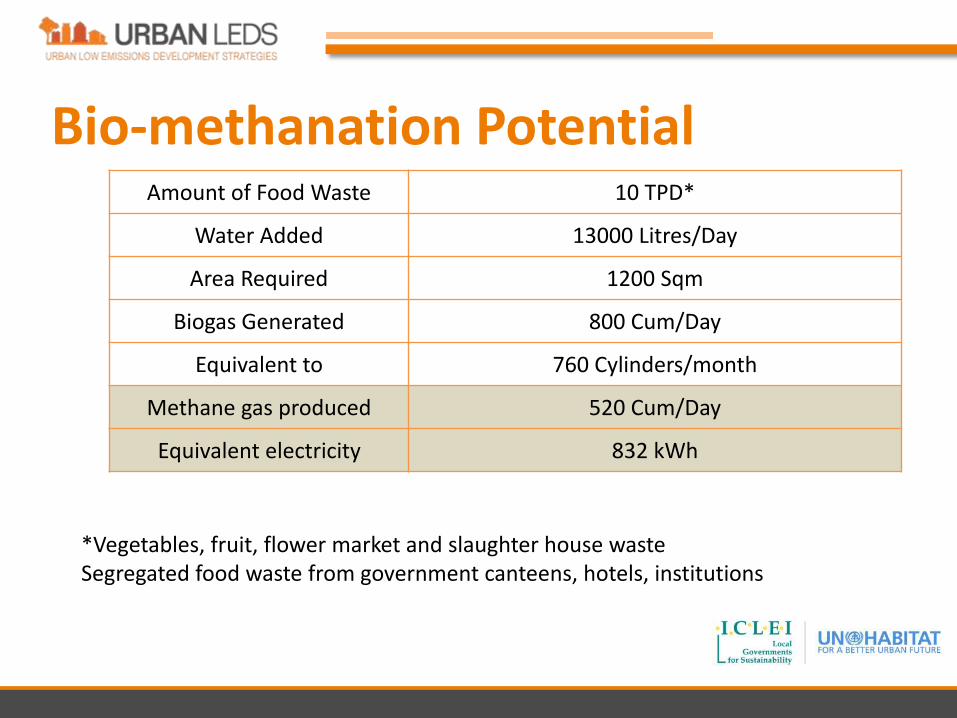
Bio-methanation PotentialAmount of Food Waste 10 TPD*
Water Added 13000 Litres/Day
Area Required 1200 Sqm
Biogas Generated 800 Cum/Day
Equivalent to 760 Cylinders/month
Methane gas produced 520 Cum/Day
Equivalent electricity 832 kWh
*Vegetables, fruit, flower market and slaughter house wasteSegregated food waste from government canteens, hotels, institutions
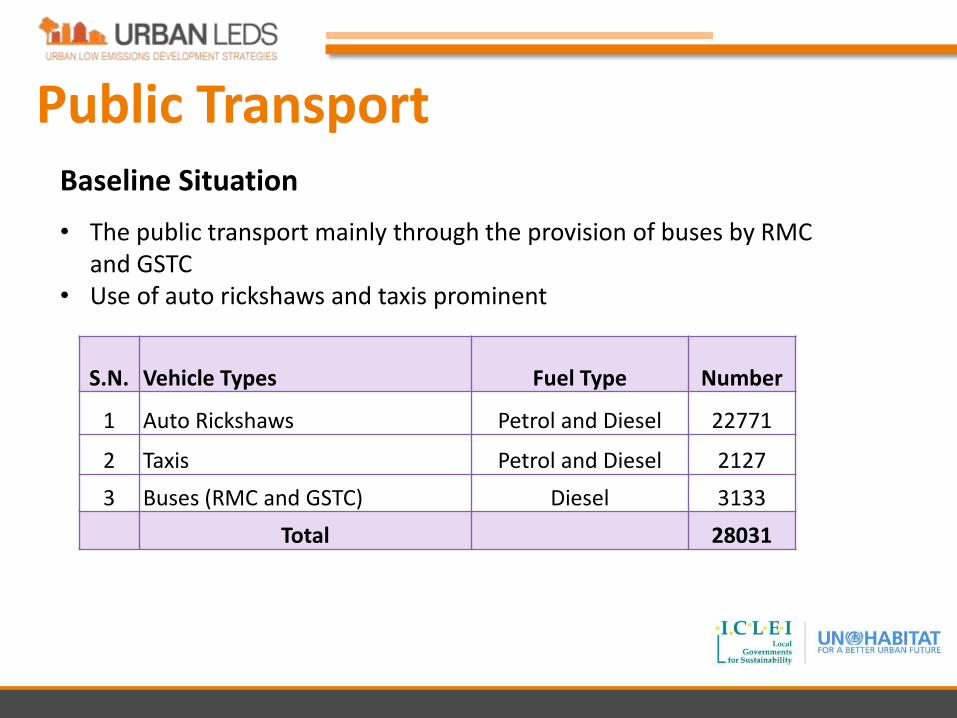
Public Transport
• The public transport mainly through the provision of buses by RMC and GSTC
• Use of auto rickshaws and taxis prominent
S.N. Vehicle Types Fuel Type Number
1 Auto Rickshaws Petrol and Diesel 22771
2 Taxis Petrol and Diesel 2127
3 Buses (RMC and GSTC) Diesel 3133
Total 28031
Baseline Situation
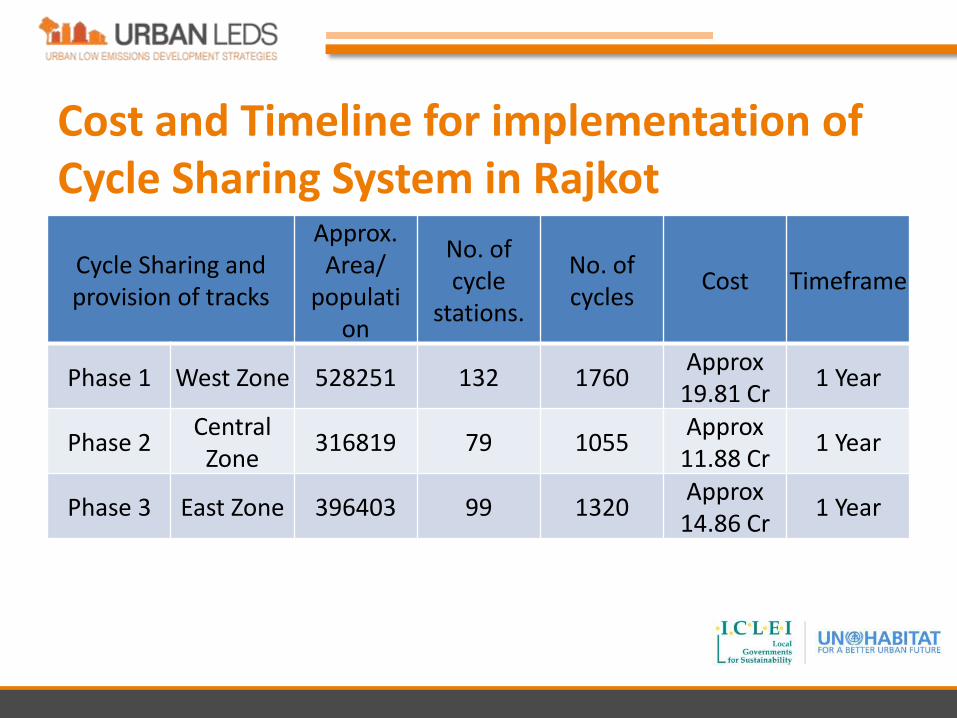
Cycle Sharing andprovision of tracks
Approx.Area/
population
No. ofcycle
stations.
No. ofcycles
Cost Timeframe
Phase 1 West Zone 528251 132 1760Approx
19.81 Cr1 Year
Phase 2Central
Zone316819 79 1055
Approx 11.88 Cr
1 Year
Phase 3 East Zone 396403 99 1320Approx
14.86 Cr1 Year
Cost and Timeline for implementation of Cycle Sharing System in Rajkot
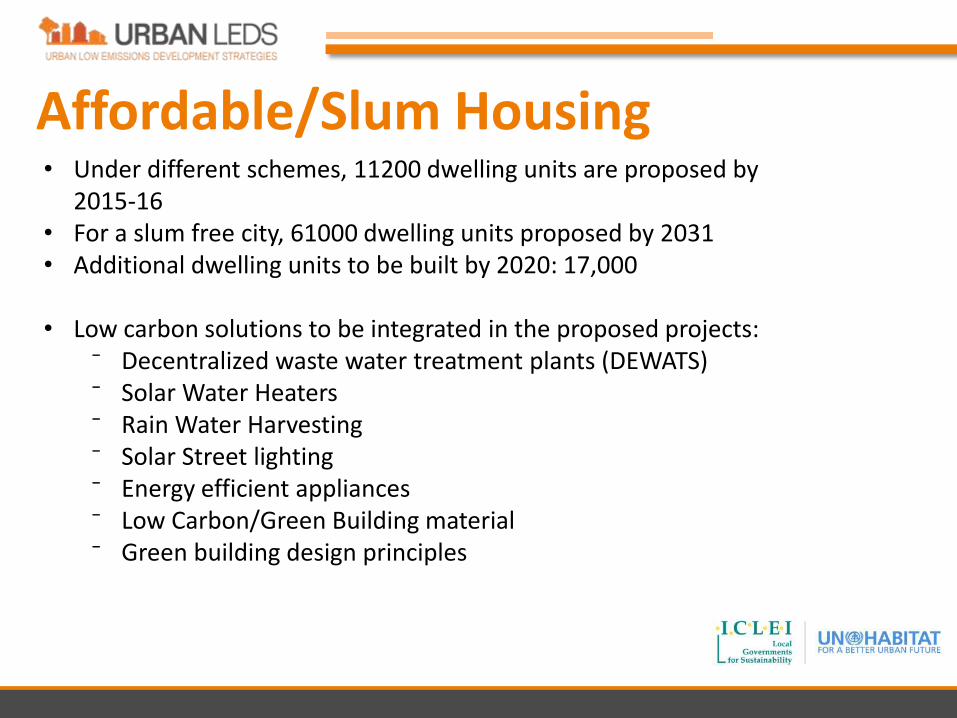
Affordable/Slum Housing• Under different schemes, 11200 dwelling units are proposed by
2015-16 • For a slum free city, 61000 dwelling units proposed by 2031• Additional dwelling units to be built by 2020: 17,000
• Low carbon solutions to be integrated in the proposed projects:⁻ Decentralized waste water treatment plants (DEWATS)⁻ Solar Water Heaters⁻ Rain Water Harvesting⁻ Solar Street lighting⁻ Energy efficient appliances⁻ Low Carbon/Green Building material⁻ Green building design principles
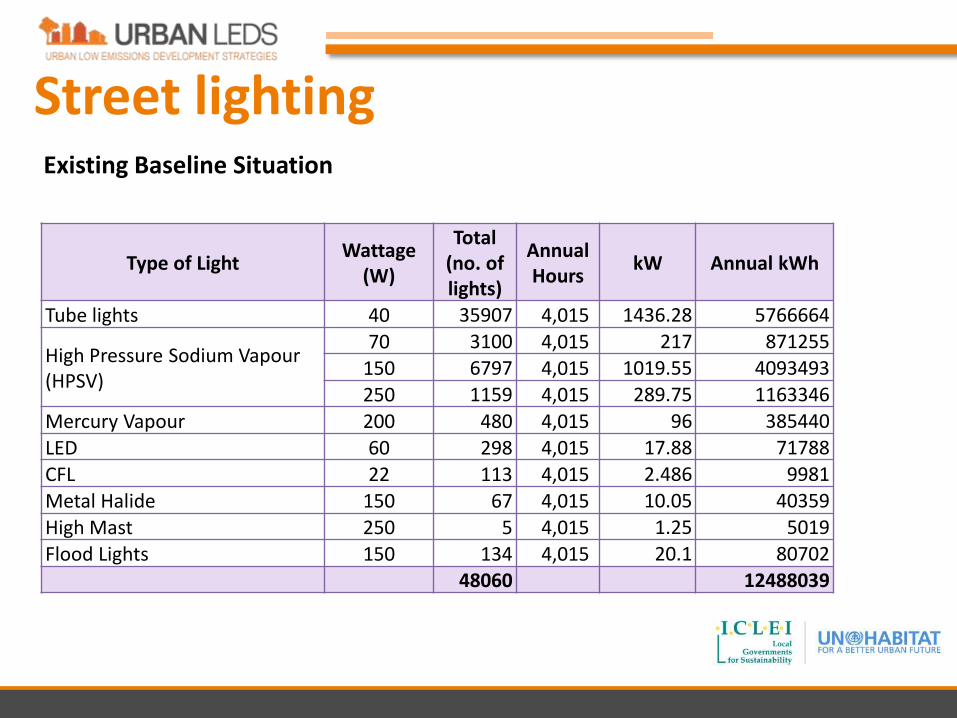
Street lighting
Type of LightWattage
(W)
Total (no. of lights)
Annual Hours
kW Annual kWh
Tube lights 40 35907 4,015 1436.28 5766664
High Pressure Sodium Vapour (HPSV)
70 3100 4,015 217 871255
150 6797 4,015 1019.55 4093493
250 1159 4,015 289.75 1163346
Mercury Vapour 200 480 4,015 96 385440
LED 60 298 4,015 17.88 71788
CFL 22 113 4,015 2.486 9981
Metal Halide 150 67 4,015 10.05 40359
High Mast 250 5 4,015 1.25 5019
Flood Lights 150 134 4,015 20.1 8070248060 12488039
Existing Baseline Situation
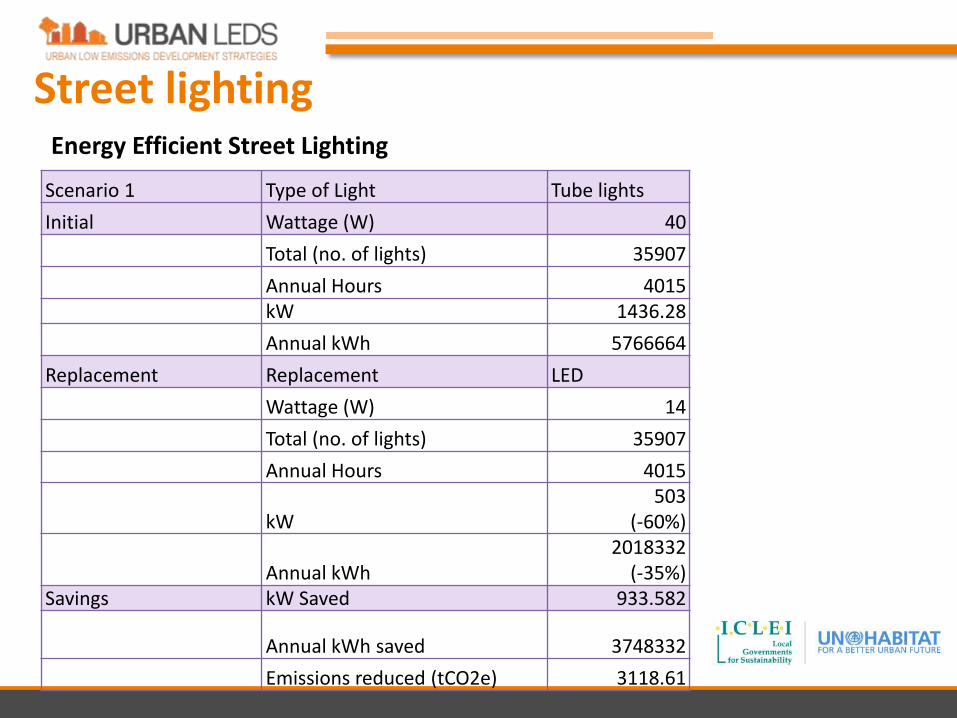
Street lighting
Scenario 1 Type of Light Tube lights
Initial Wattage (W) 40
Total (no. of lights) 35907
Annual Hours 4015kW 1436.28
Annual kWh 5766664
Replacement Replacement LED
Wattage (W) 14
Total (no. of lights) 35907
Annual Hours 4015
kW503
(-60%)
Annual kWh2018332
(-35%)Savings kW Saved 933.582
Annual kWh saved 3748332
Emissions reduced (tCO2e) 3118.61
Energy Efficient Street Lighting
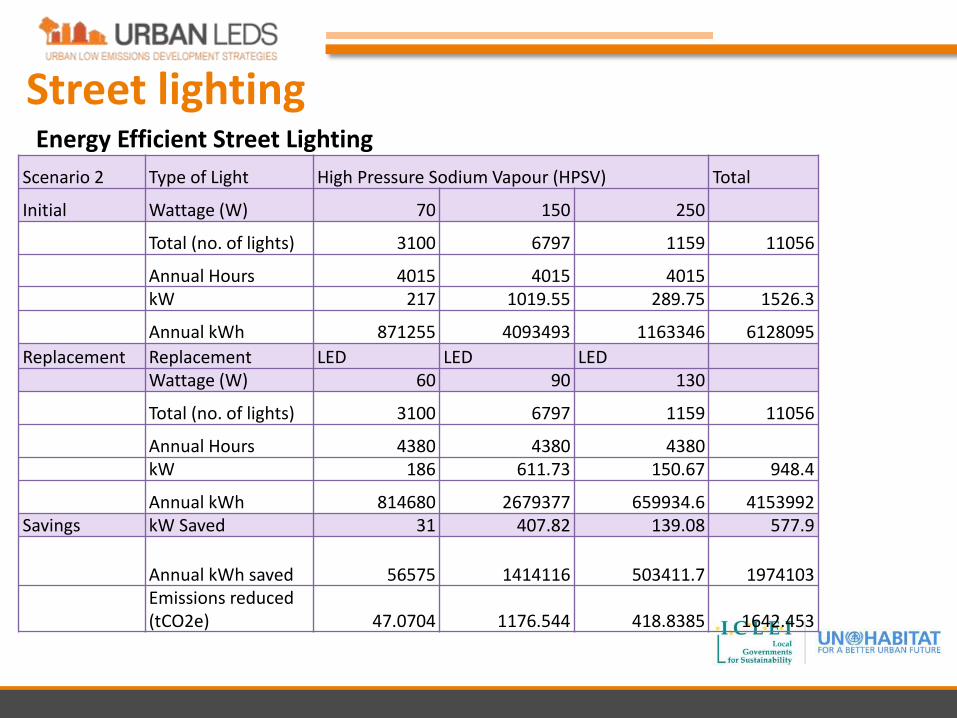
Street lighting
Scenario 2 Type of Light High Pressure Sodium Vapour (HPSV) Total
Initial Wattage (W) 70 150 250
Total (no. of lights) 3100 6797 1159 11056
Annual Hours 4015 4015 4015kW 217 1019.55 289.75 1526.3
Annual kWh 871255 4093493 1163346 6128095
Replacement Replacement LED LED LEDWattage (W) 60 90 130
Total (no. of lights) 3100 6797 1159 11056
Annual Hours 4380 4380 4380kW 186 611.73 150.67 948.4
Annual kWh 814680 2679377 659934.6 4153992Savings kW Saved 31 407.82 139.08 577.9
Annual kWh saved 56575 1414116 503411.7 1974103Emissions reduced (tCO2e) 47.0704 1176.544 418.8385 1642.453
Energy Efficient Street Lighting
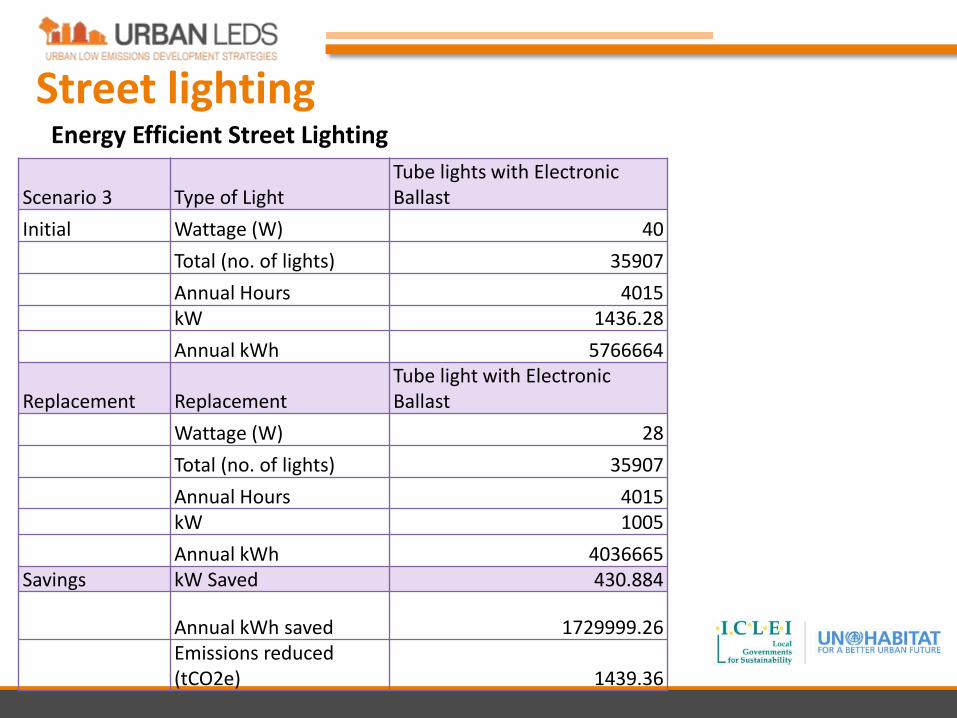
Street lighting
Scenario 3 Type of LightTube lights with Electronic Ballast
Initial Wattage (W) 40
Total (no. of lights) 35907
Annual Hours 4015kW 1436.28
Annual kWh 5766664
Replacement ReplacementTube light with Electronic Ballast
Wattage (W) 28
Total (no. of lights) 35907
Annual Hours 4015kW 1005
Annual kWh 4036665Savings kW Saved 430.884
Annual kWh saved 1729999.26Emissions reduced (tCO2e) 1439.36
Energy Efficient Street Lighting
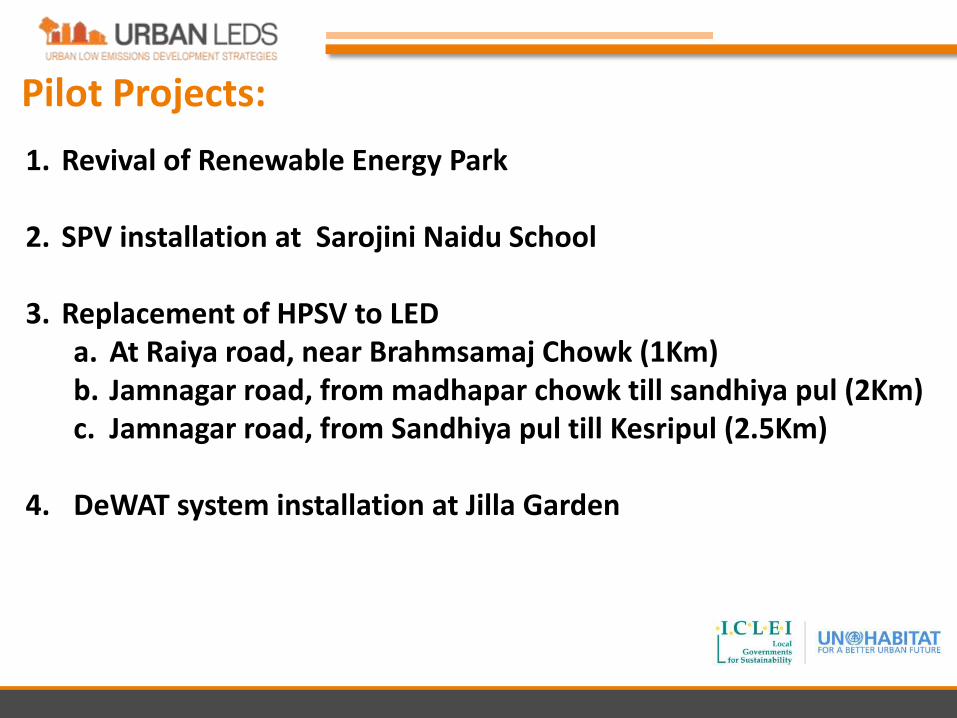
Pilot Projects:
1. Revival of Renewable Energy Park
2. SPV installation at Sarojini Naidu School
3. Replacement of HPSV to LEDa. At Raiya road, near Brahmsamaj Chowk (1Km)b. Jamnagar road, from madhapar chowk till sandhiya pul (2Km)c. Jamnagar road, from Sandhiya pul till Kesripul (2.5Km)
4. DeWAT system installation at Jilla Garden
• ICLEI – Local Governments for Sustainability at: www.iclei.org
• ICLEI – Local Governments for Sustainability, South Asia at:
www.iclei.org/sa
• Email: [email protected]
THANK YOU


![Credit Management Rajkot Nagarik Sahakari Bank Ltd[1]. - Rajkot](https://img.pdfslide.us/doc/110x75/5467aa80b4af9f3a3f8b5905/credit-management-rajkot-nagarik-sahakari-bank-ltd1-rajkot.jpg)