Embed Size (px)
Citation preview
Preliminary Findings from First Survey
RoundEmily McNulty
November 2014
Project: Policies and Institutions for Achieving
the Virtuous Food-Energy-Water Nexus in
Sub-Saharan Africa
Contents
1. Description of first survey round2. Micro-level overview of study area
• Food: Farm production, food security• Water: Irrigation practices, irrigation scheme
preferences, willingness to contribute to irrigation schemes
• Energy: Fuel sources, improved cookstove use, WTP for improved cookstoves
3. Upcoming research steps4. Discussion
2
Description of first survey round
3
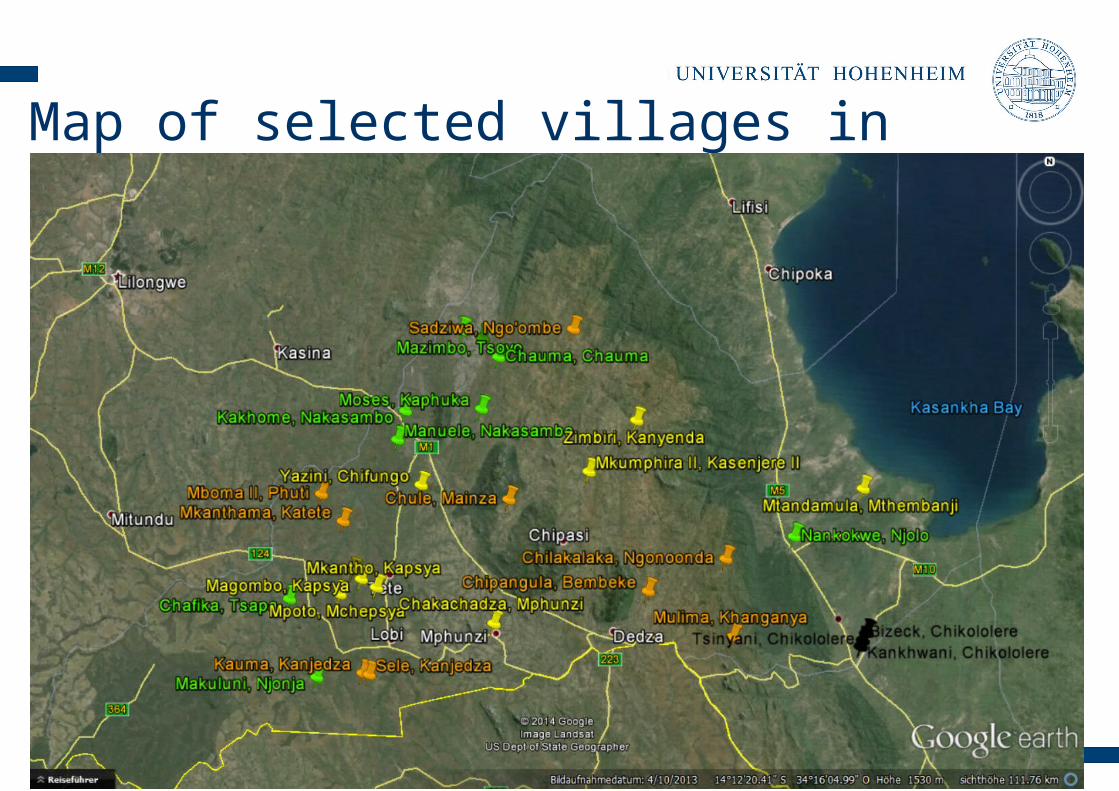
Map of selected villages in Dedza
4
Micro-level overview of study area
5
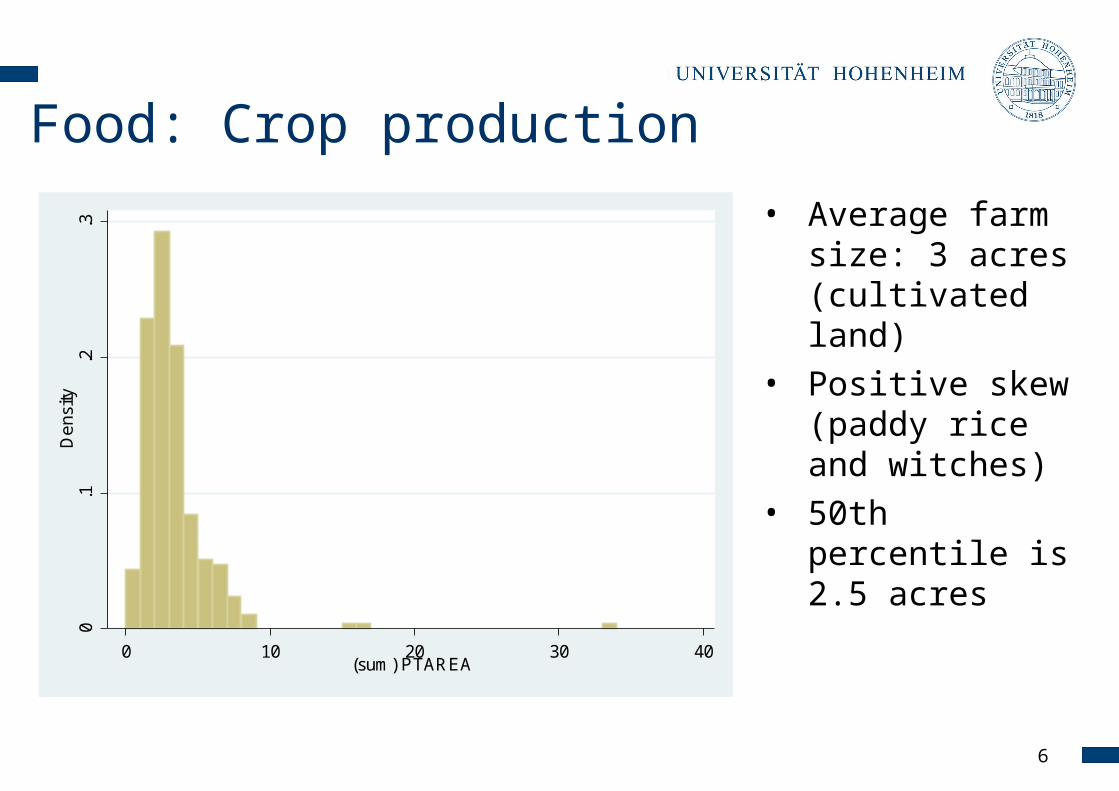
Food: Crop production
• Average farm size: 3 acres (cultivated land)
• Positive skew (paddy rice and witches)
• 50th percentile is 2.5 acres
6
0.1
.2.3
De
nsity
0 10 20 30 40(sum) PTAREA

Food: Crop production
7
Crop Yields (in Kg) per Household
Crop Mean 50th Percentile
Maize 1071 720Sorghum 94 30Millet 133 128Irish Potato 477 360
Sweet Potato 590 375Cassava 865 720Beans 419 78Lentils 117 117
Paddy Rice 3030 1801Sugarcane 135 135Pigeon Peas 262 176Cotton 421 150Soy 274 176Tobacco 156 80
Groundnuts 4206 164Vegetables 162 80Fruit 350 350Cowpeas 350 137

Food: Dietary diversity scores
8
• 10 food groups, roughly divided by nutrients provided
• Quick assessment (Kennedy, Ballard, & Dop, 2010)
• Household level• 24 hour recall period• Score is number of food
groups eaten
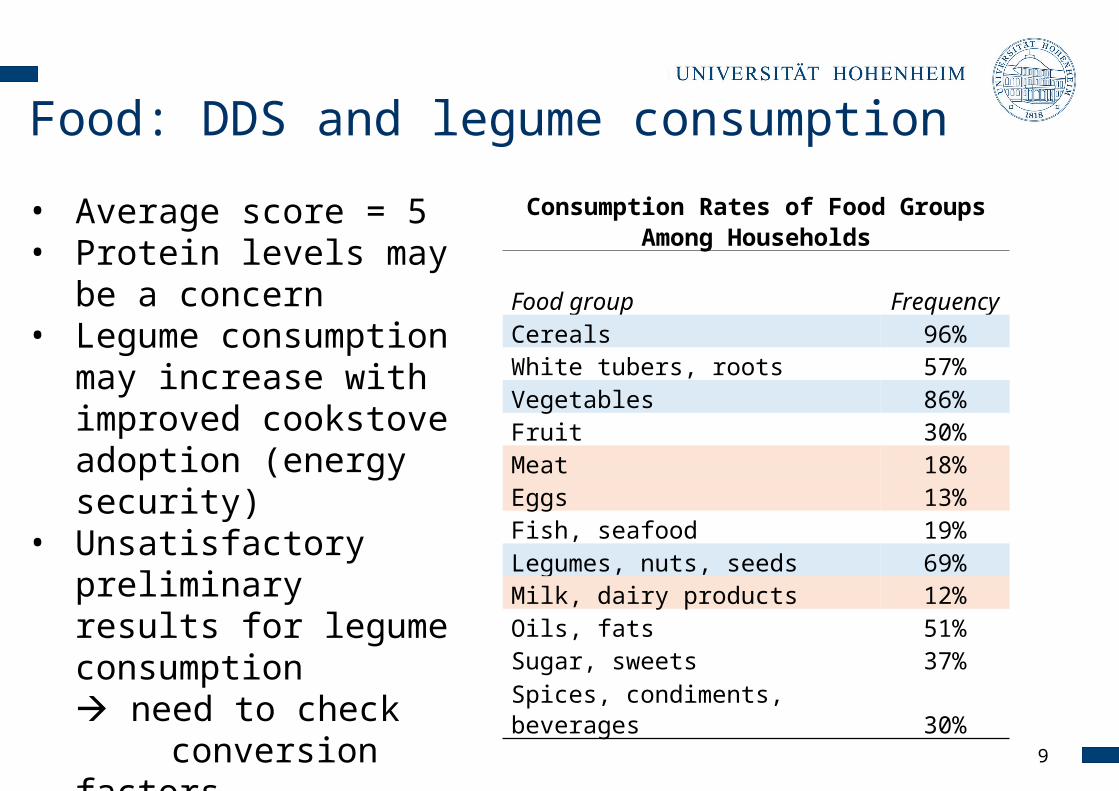
Food: DDS and legume consumption
9
• Average score = 5• Protein levels may be
a concern• Legume consumption
may increase with improved cookstove adoption (energy security)
• Unsatisfactory preliminary results for legume consumption need to check
conversion factors
Consumption Rates of Food Groups Among Households
Food group FrequencyCereals 96%White tubers, roots 57%Vegetables 86%Fruit 30%Meat 18%Eggs 13%Fish, seafood 19%Legumes, nuts, seeds 69%Milk, dairy products 12%Oils, fats 51%Sugar, sweets 37%
Spices, condiments, beverages 30%
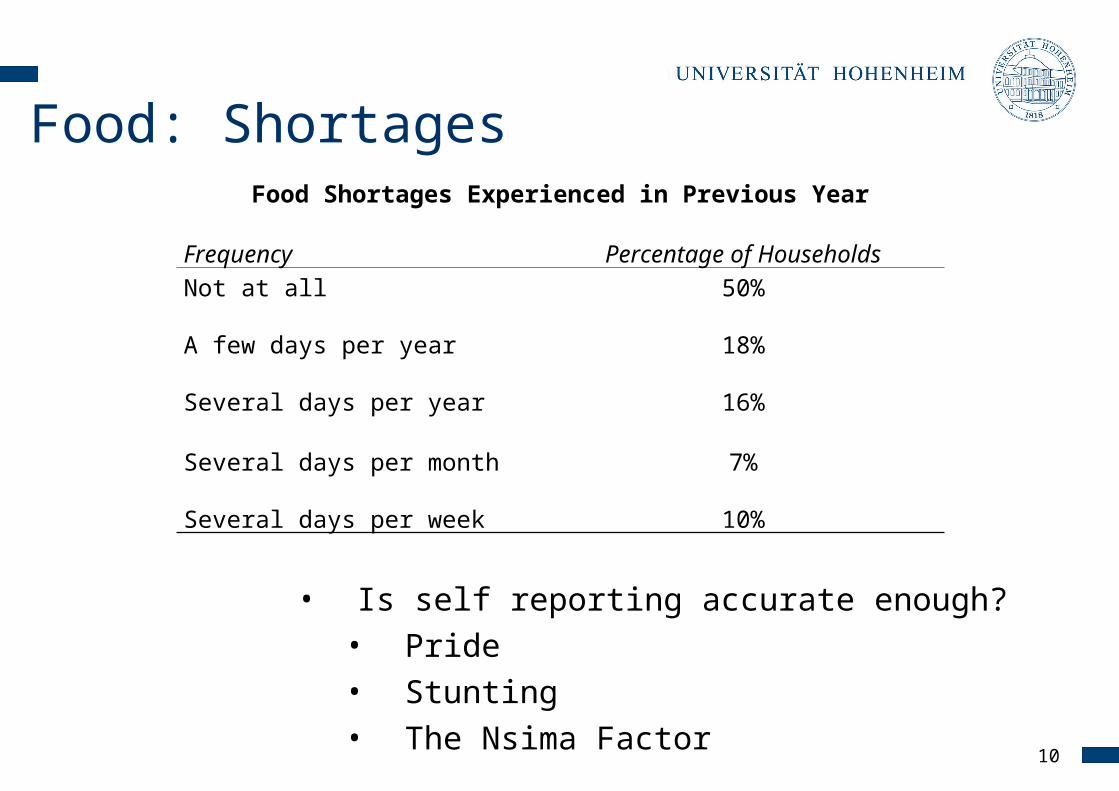
Food: Shortages
• Is self reporting accurate enough?• Pride• Stunting• The Nsima Factor
10
Food Shortages Experienced in Previous Year
Frequency Percentage of HouseholdsNot at all 50%
A few days per year 18%
Several days per year 16%
Several days per month 7%
Several days per week 10%
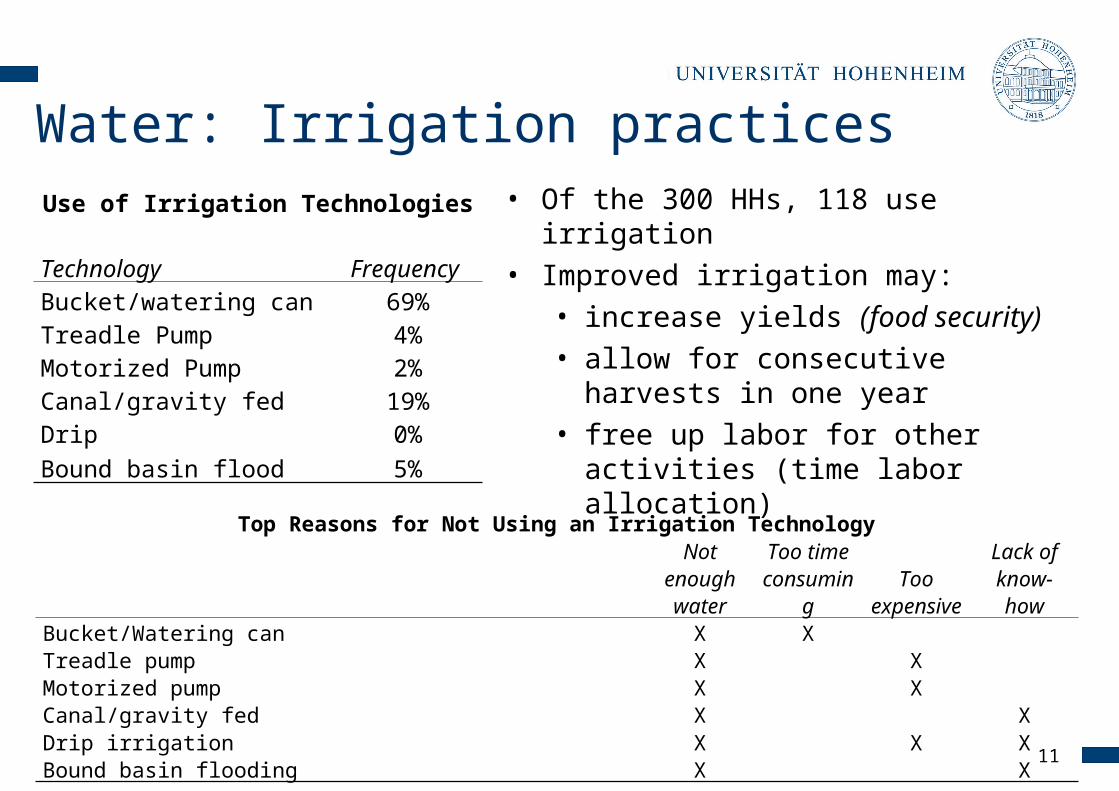
Water: Irrigation practices• Of the 300 HHs, 118 use irrigation• Improved irrigation may:
• increase yields (food security)• allow for consecutive harvests
in one year• free up labor for other activities
(time labor allocation)
11
Use of Irrigation Technologies
Technology Frequency Bucket/watering can 69%Treadle Pump 4%Motorized Pump 2%Canal/gravity fed 19%Drip 0%Bound basin flood 5%
Top Reasons for Not Using an Irrigation Technology
Not enough water
Too time consuming
Too expensive
Lack of know-how
Bucket/Watering can X XTreadle pump X XMotorized pump X XCanal/gravity fed X XDrip irrigation X X XBound basin flooding X X
Water: Willingness to contribute to hypothetical irrigation schemes
12
• Irrigation Management Transfer (IMT): two case studies in Likangala and Domasi (Nkhoma & Mulwafu, 2004)
• Farmers become the main stakeholders, take ownership over schemes: construct, maintain, manage
• Some difficulties in management transfer: what exactly are farmers willing to contribute?
Water: Willingness to contribute to hypothetical irrigation schemes
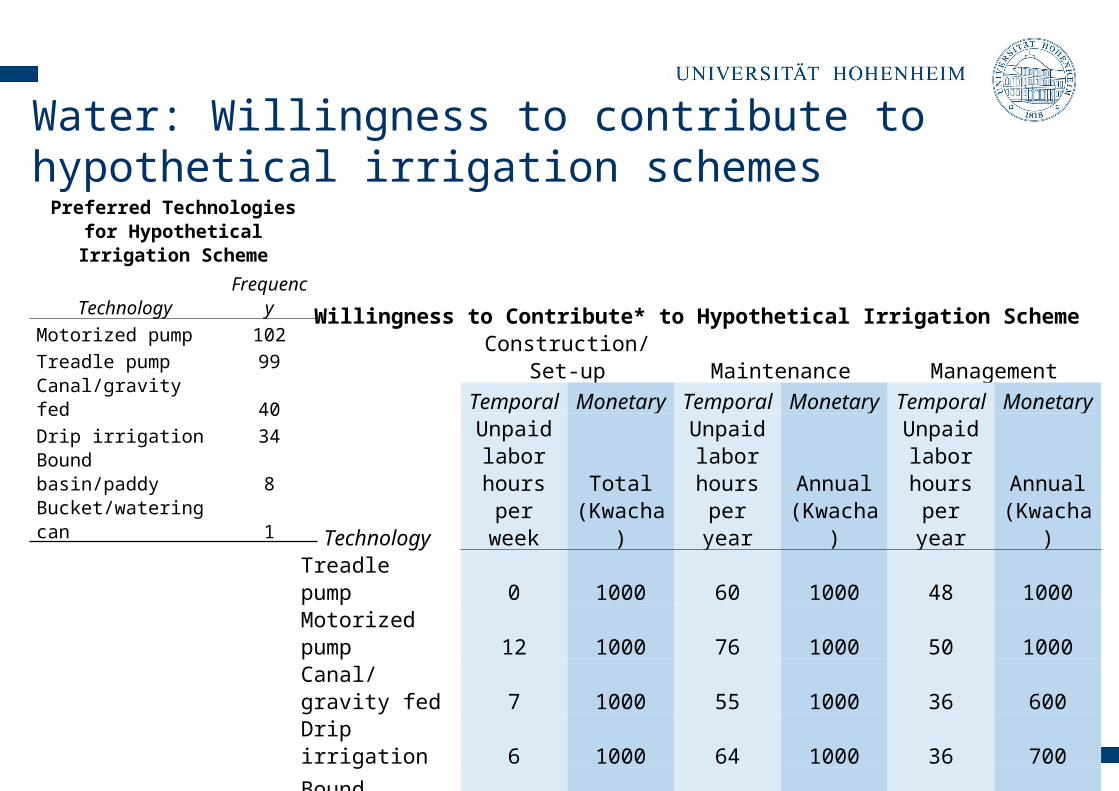
Preferred Technologies for Hypothetical Irrigation Scheme
Technology FrequencyMotorized pump 102Treadle pump 99Canal/gravity fed 40Drip irrigation 34Bound basin/paddy 8Bucket/watering can 1
13
Willingness to Contribute* to Hypothetical Irrigation SchemeConstruction/Set-up Maintenance Management
Temporal Monetary Temporal Monetary Temporal Monetary
Technology
Unpaid labor
hours per week
Total (Kwacha)
Unpaid labor
hours per year
Annual (Kwacha)
Unpaid labor
hours per year
Annual (Kwacha)
Treadle pump 0 1000 60 1000 48 1000Motorized pump 12 1000 76 1000 50 1000Canal/gravity fed 7 1000 55 1000 36 600Drip irrigation 6 1000 64 1000 36 700
Bound basin/paddy 5 625 20 700 15 500*50th percentile
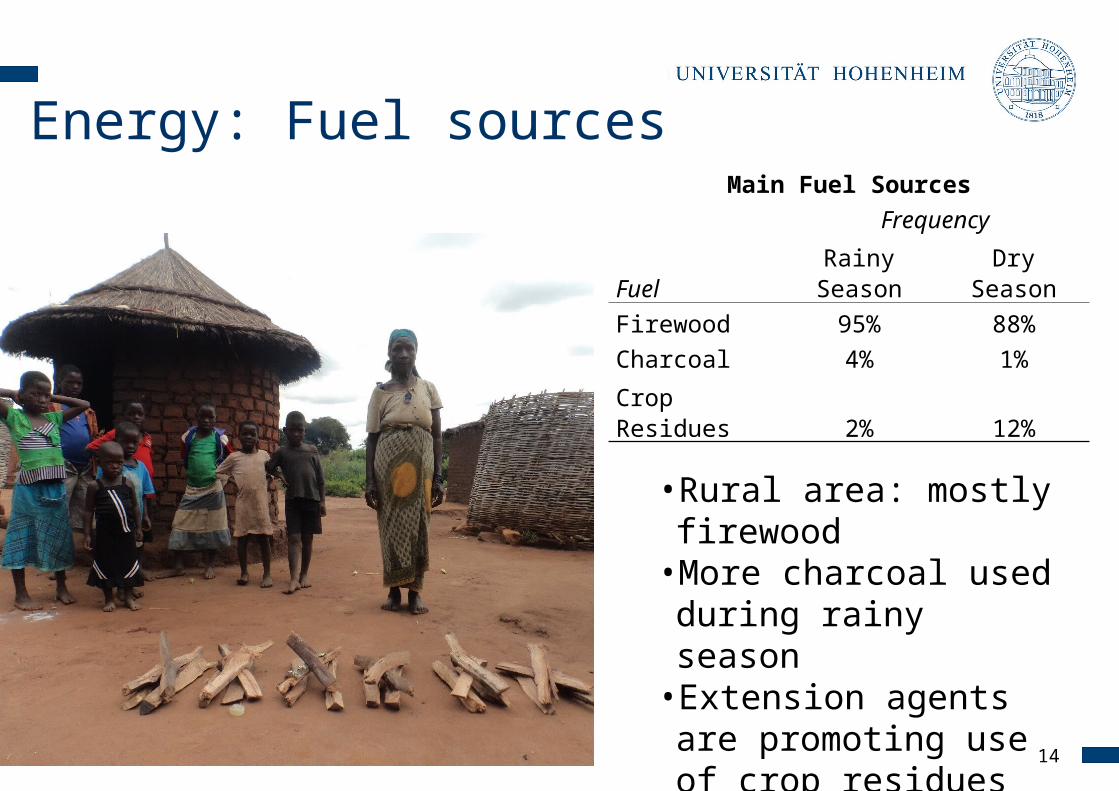
Energy: Fuel sources Main Fuel Sources
Frequency
Fuel Rainy Season Dry SeasonFirewood 95% 88%Charcoal 4% 1%
Crop Residues 2% 12%
14
• Rural area: mostly firewood
• More charcoal used during rainy season
• Extension agents are promoting use of crop residues

Energy: Cookstoves and health
15
Stove Related Health Issues*
Affliction** FrequencyIllness with a cough 44%Cough with short, rapid breaths 20%
Cough affected ability to work 22%
*of those present in the same room as the stove while the fire is active**in the six months preceding the survey
• 7% of those present in the kitchen while fire was active had at least one eye infection in the six months preceding the survey (food security)
Photos by RocketWorks and Stefan Meyer, 2014
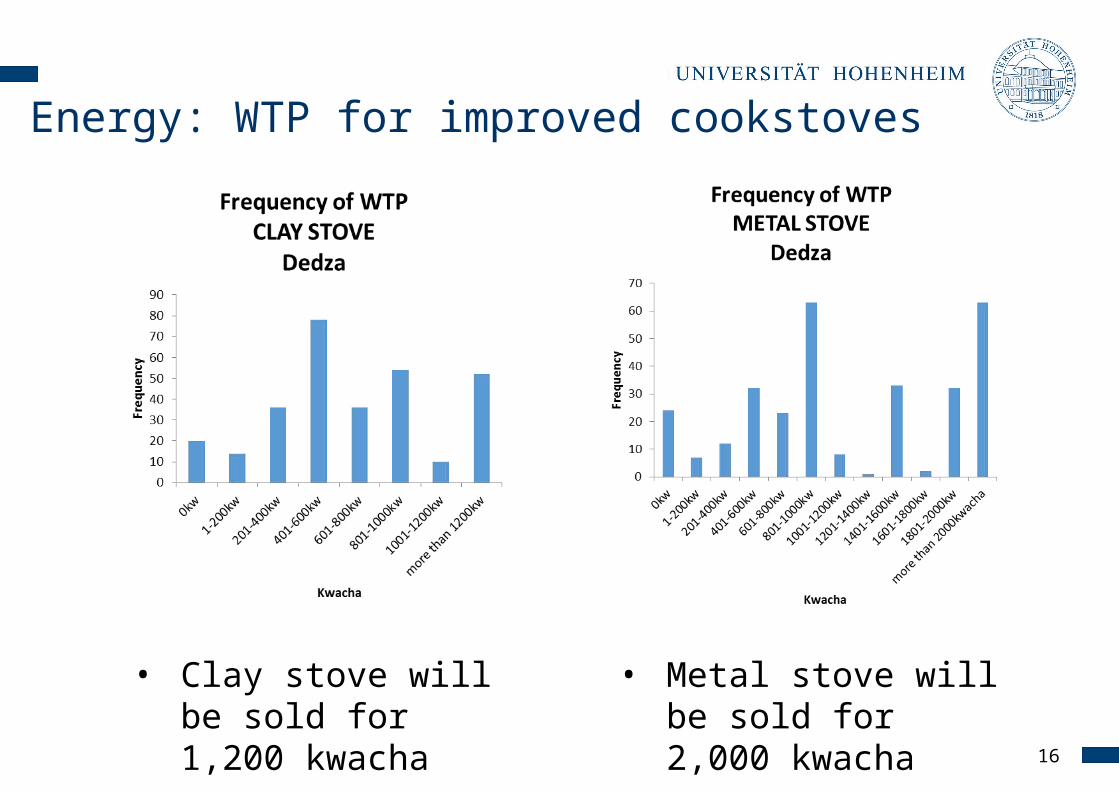
Energy: WTP for improved cookstoves
16
• Clay stove will be sold for 1,200 kwacha
• Metal stove will be sold for 2,000 kwacha

Upcoming research steps
• Sales of improved cookstoves • More detailed analyses, regressions, socioeconomic
characteristics and their impacts on variables• Choice experiment analyses
• Improved cookstove pricing, fuel reduction• Fertilizer coupons or cash transfers conditional on
agroforestry adoption• Second survey round (May to June 2015)
17

Discussion
Irrigation management transfer• What challenges are there?• Are there success stories yet? Elsewhere in SSA?Improved cookstoves• What does the future of ICS in Malawi look like? Is this a
political/donor fad?• What will it take for ICS producers to thrive in the free
market/without subsidy?
18
19
Sources
Kennedy, G., Ballard, T., & Dop, M. (2010). Guidelines for measuring household and individual dietary diversity. Nutrition and Consumer Protection Division, Food and Agriculture Organization of the United Nations. Retrieved October 10, 2014, from http://www.fao.org/docrep/014/i1983e/i1983e00.pdf
Nkhoma, B. G., & Mulwafu, W. O. (2004). The experience of irrigation management transfer in two irrigation schemes in Malawi, 1960s–2002. Physics and Chemistry of the Earth, Parts A/B/C, 29(15-18), 1327–1333. doi:10.1016/j.pce.2004.09.007