Embed Size (px)
Citation preview
www.bsc.es
BC3, 2015
What are climate anomalies and why are they important
Omar Bellprat, Francisco Doblas-Reyes, VirgnieGuemas, Chloé Prodhomme, Louis-Phillipe Caron
and the Climate Forecasting Unit26 May 2015
2
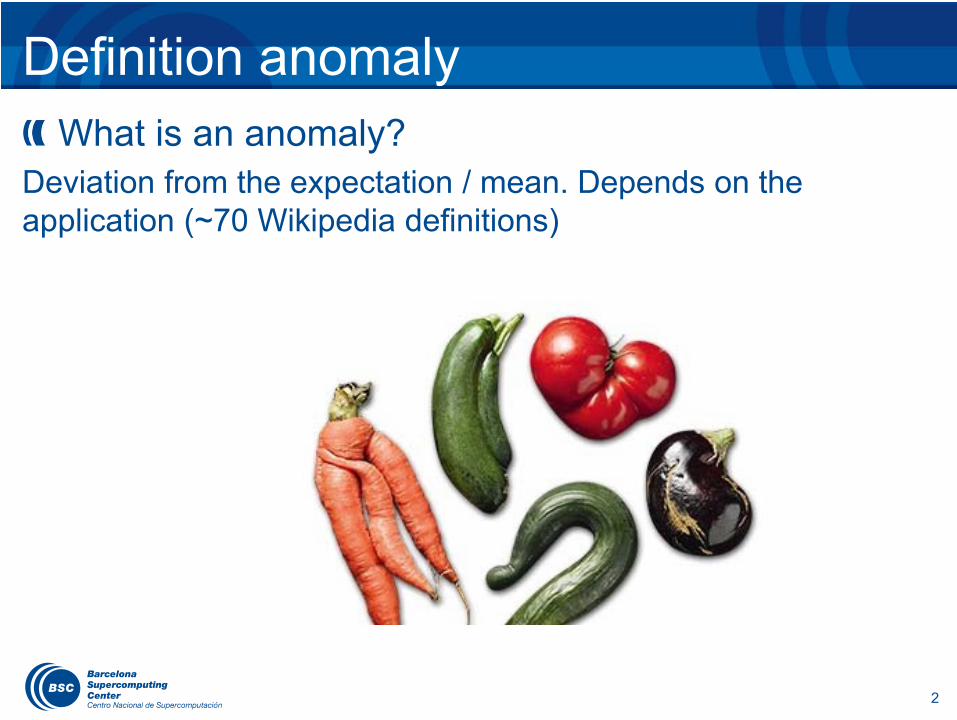
Definition anomalyWhat is an anomaly?
Deviation from the expectation / mean. Depends on the application (~70 Wikipedia definitions)
3
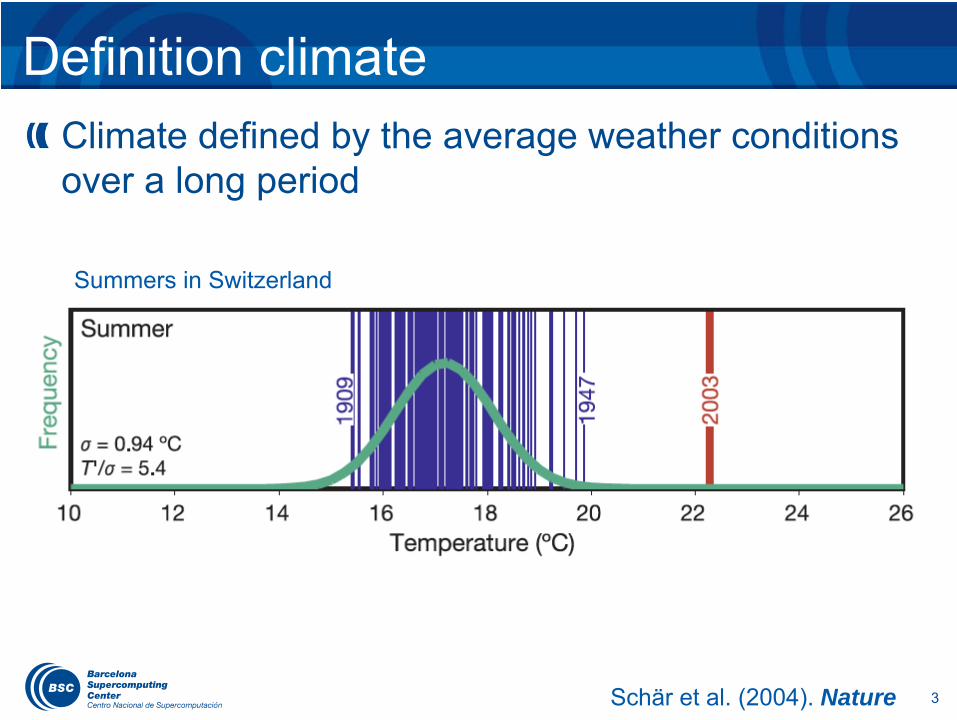
Definition climateClimate defined by the average weather conditions over a long period
Summers in Switzerland
Schär et al. (2004). Nature
4
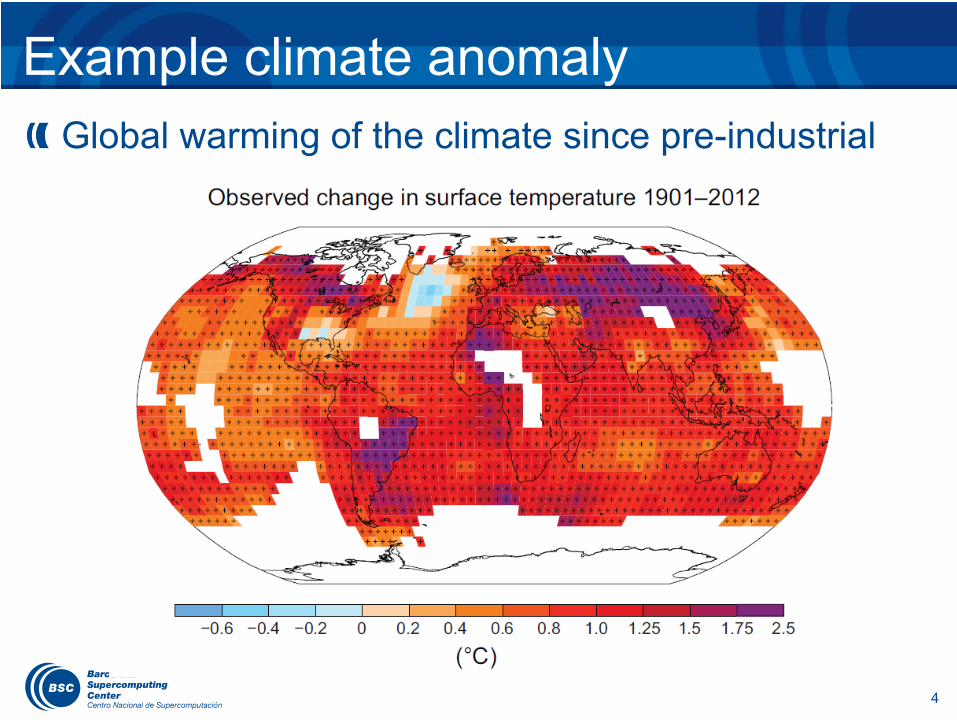
Example climate anomalyGlobal warming of the climate since pre-industrial
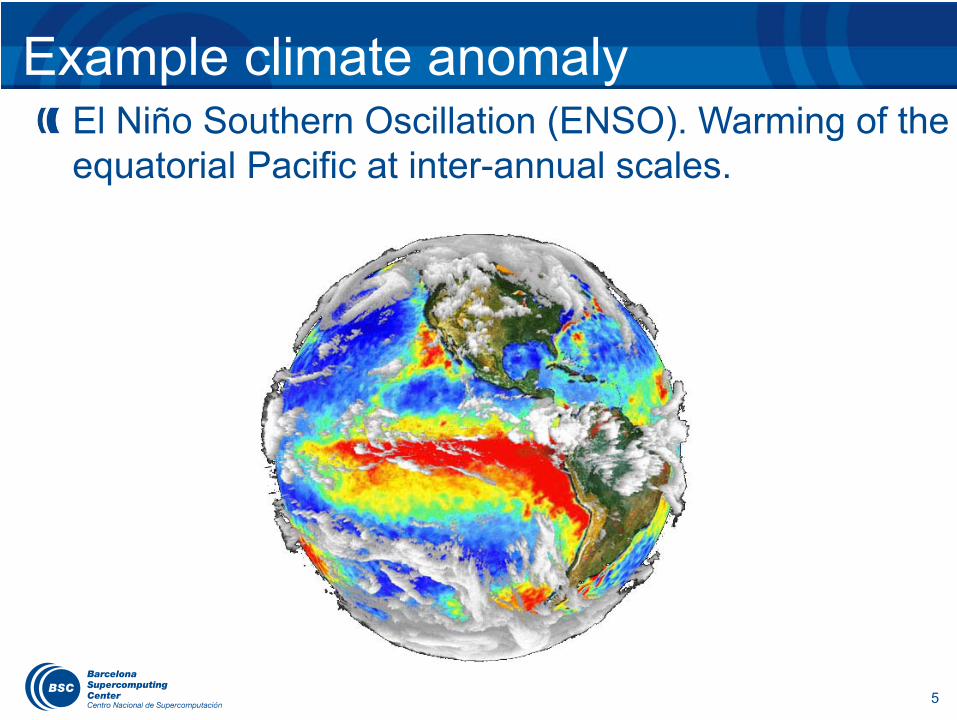
El Niño Southern Oscillation (ENSO). Warming of the equatorial Pacific at inter-annual scales.
5
Example climate anomaly
6
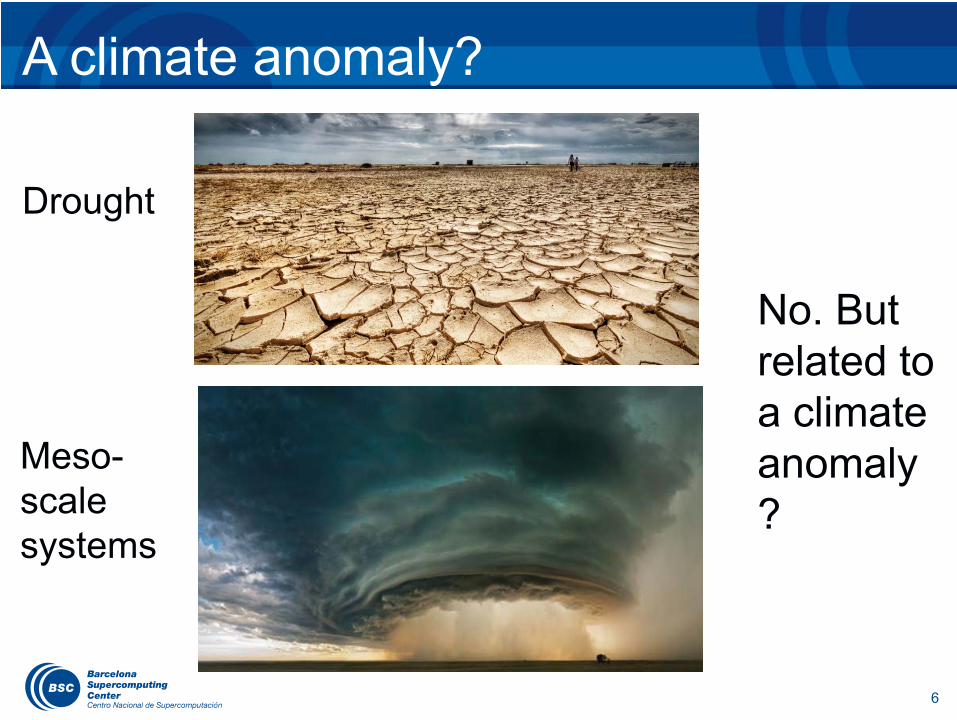
A climate anomaly?
No. But related to a climate anomaly?
Drought
Meso-scale systems
7
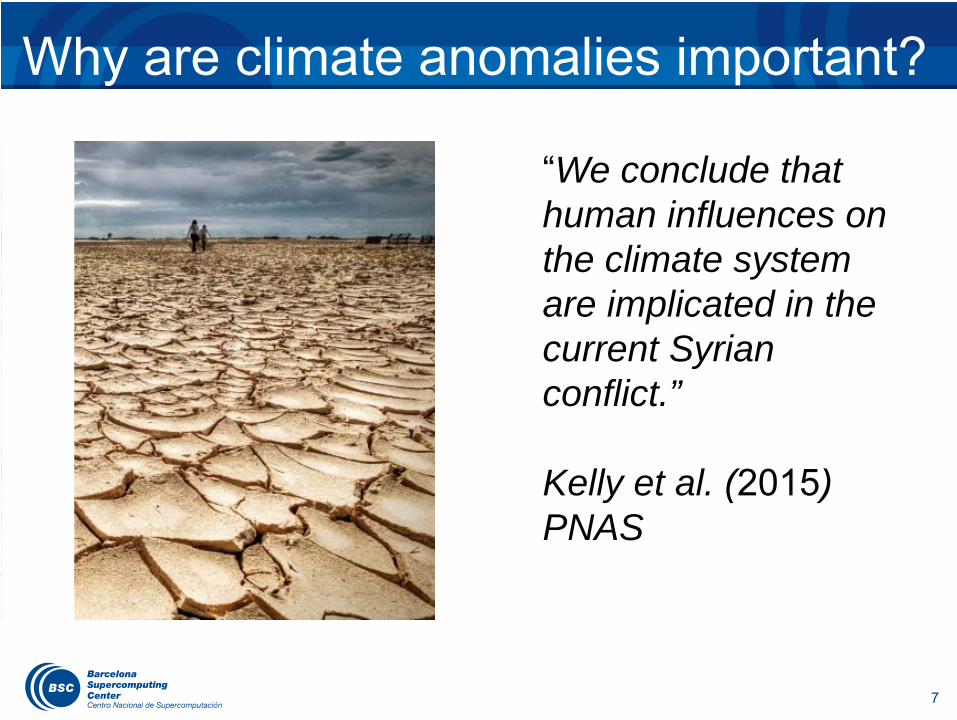
Why are climate anomalies important?
“We conclude that human influences on the climate system are implicated in the current Syrian conflict.”
Kelly et al. (2015)PNAS
8
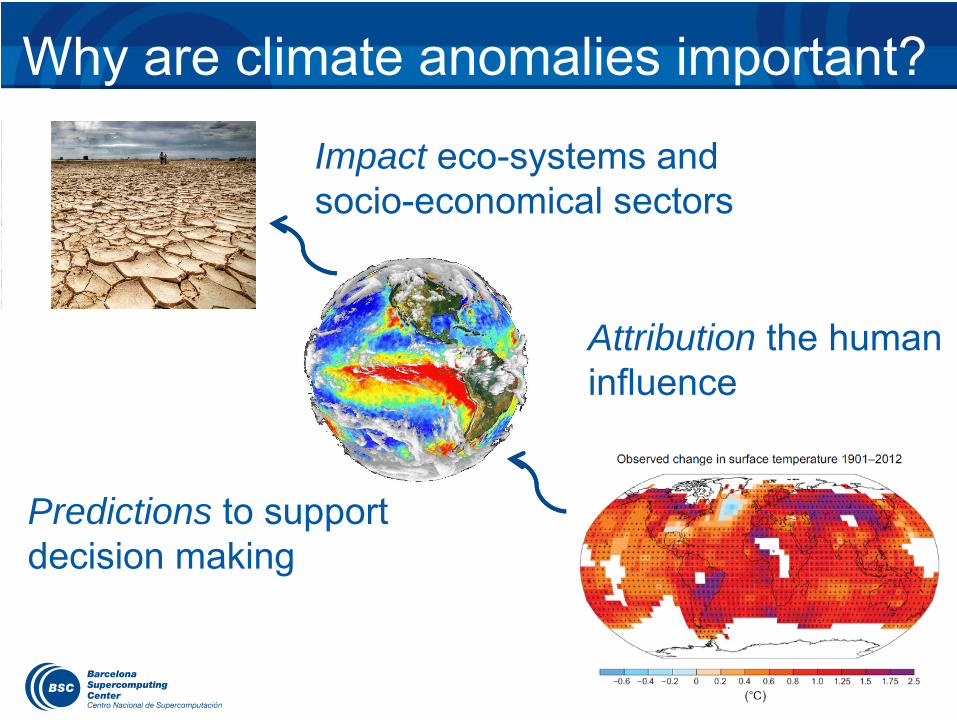
Why are climate anomalies important?
Attribution the human influence
Predictions to support decision making
Impact eco-systems and socio-economical sectors
9
1. Detection and attribution of climate trends2. Seasonal-to-decadal forecasting3. Attribution of extreme climate/weather events4. Climate services: How can we use this information?
Overview
10
1. Detection and attribution of climate trends2. Seasonal-to-decadal forecasting3. Attribution of extreme climate/weather events4. Climate services: How can we use this information?
Overview
11
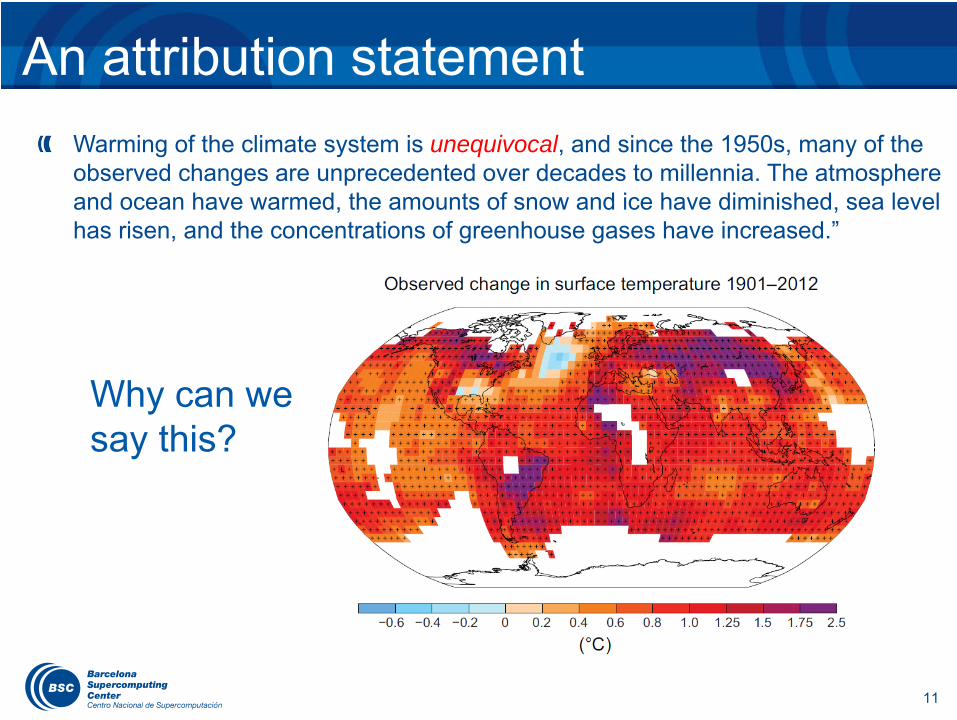
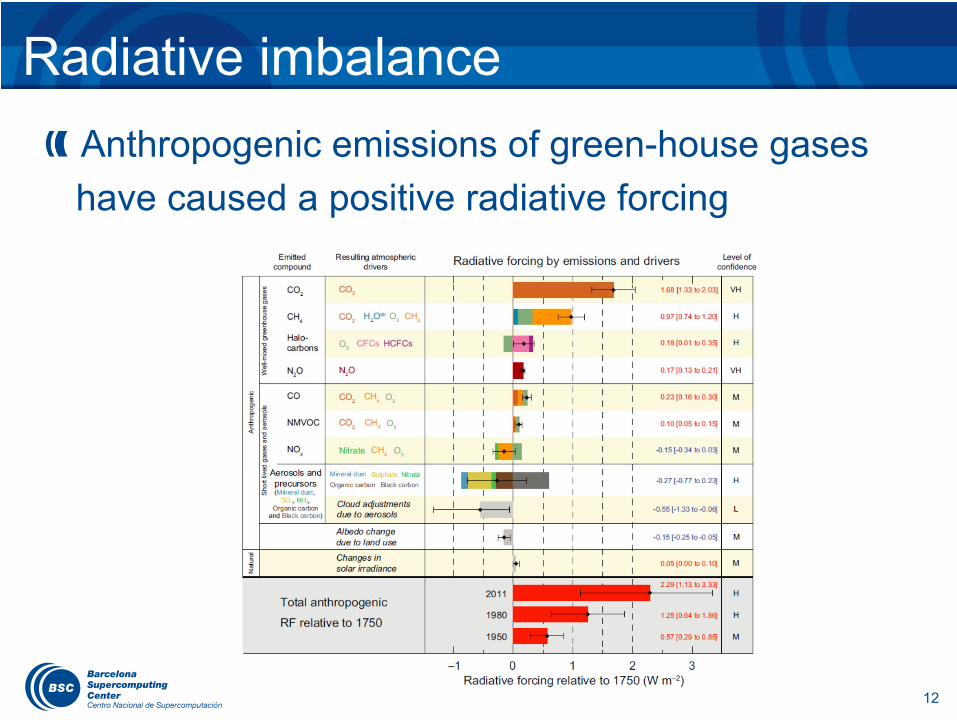
An attribution statementWarming of the climate system is unequivocal, and since the 1950s, many of the observed changes are unprecedented over decades to millennia. The atmosphere and ocean have warmed, the amounts of snow and ice have diminished, sea level has risen, and the concentrations of greenhouse gases have increased.”
Why can we say this?
12
Radiative imbalanceAnthropogenic emissions of green-house gaseshave caused a positive radiative forcing
13
Detection & Attribution (D&A)
“But knowing that the forcing is positive does not mean you have detected the cause of the observed warming ... “ F. Zwiers
Detection: Determine climate anomalies (trends) that can not be explained by natural variability only.
Attribution: Find causal factors that explain the climate anomaly and reject alternative explanations
14
Detection & Attribution (D&A)Climate models show that observed changes are consistent with expected changes to forcing and inconsistent alternative explanations
http://www.bloomberg.com/graphics/2015-whats-warming-the-world/
15
Detection & Attribution (D&A)
Carried out for many different spatial and temporal scales: e.g. attribution for each continent, tropospheric warming, stratospheric cooling (optimal fingerprinting), ice loss, hydrological cycle …
Attribution carried out on long-term climate change trends, what about shorter time-scales?
16
1. Detection and attribution of climate trends2. Seasonal-to-decadal forecasting3. Attribution of extreme climate/weather events4. Climate services: How can we use this information?
Overview
17
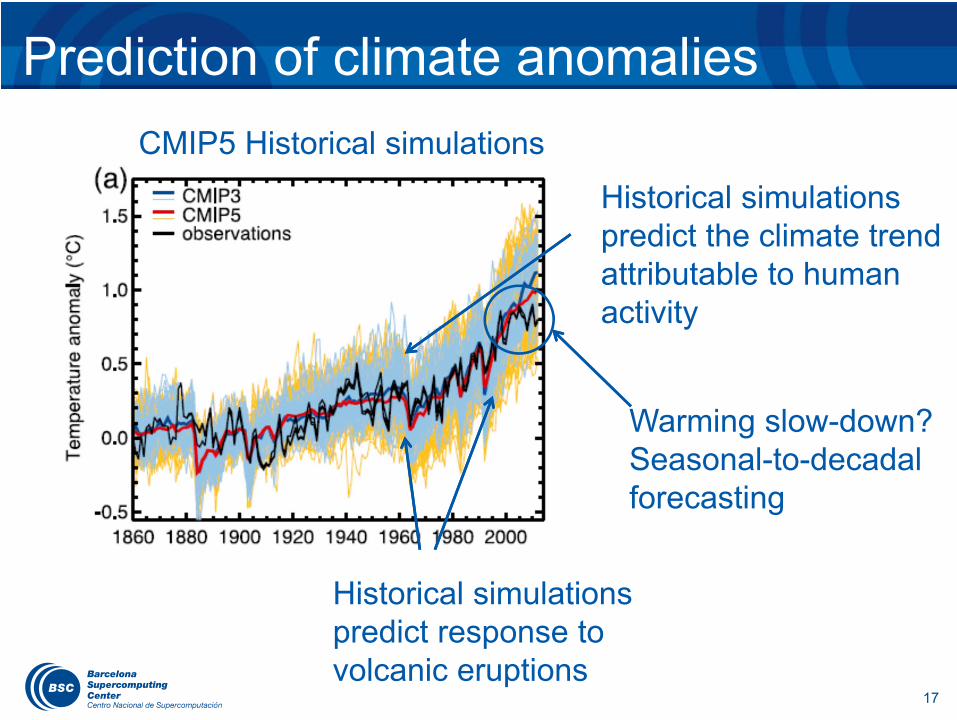
Prediction of climate anomalies
Historical simulations predict response to volcanic eruptions
Warming slow-down?Seasonal-to-decadalforecasting
Historical simulations predict the climate trend attributable to human activity
CMIP5 Historical simulations
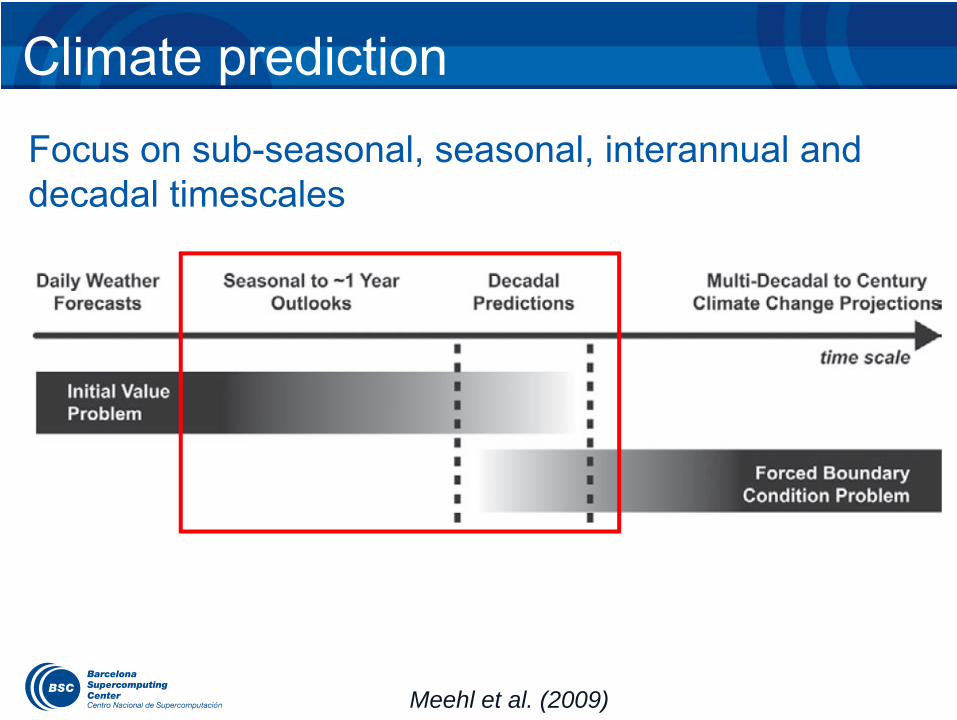
Climate prediction
Meehl et al. (2009)
Focus on sub-seasonal, seasonal, interannual and decadal timescales
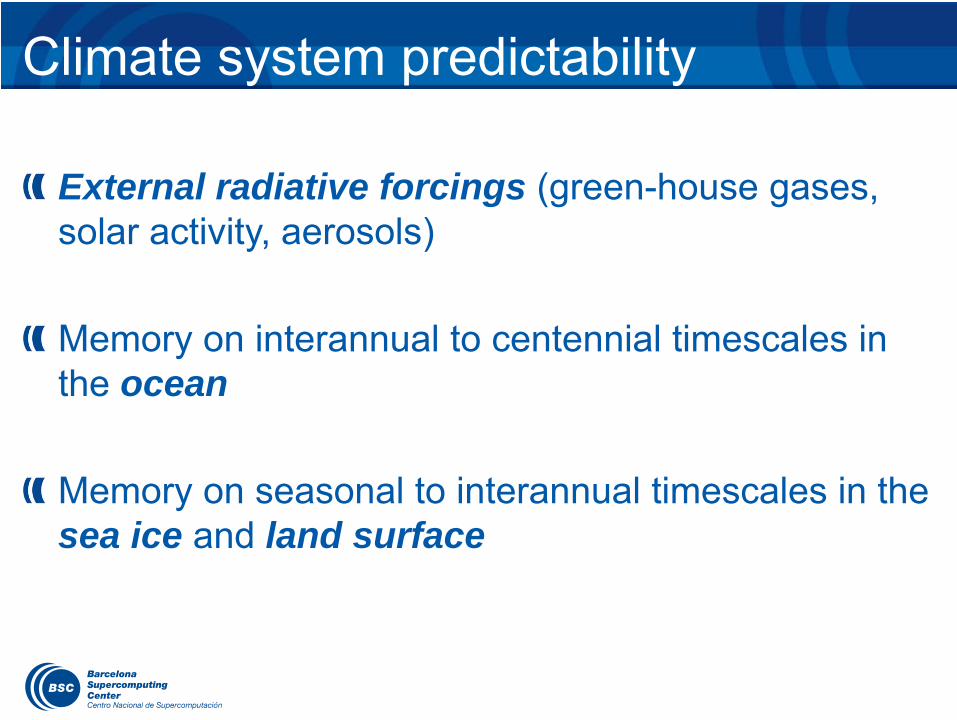
Climate system predictability
External radiative forcings (green-house gases, solar activity, aerosols)
Memory on interannual to centennial timescales in the ocean
Memory on seasonal to interannual timescales in the sea ice and land surface
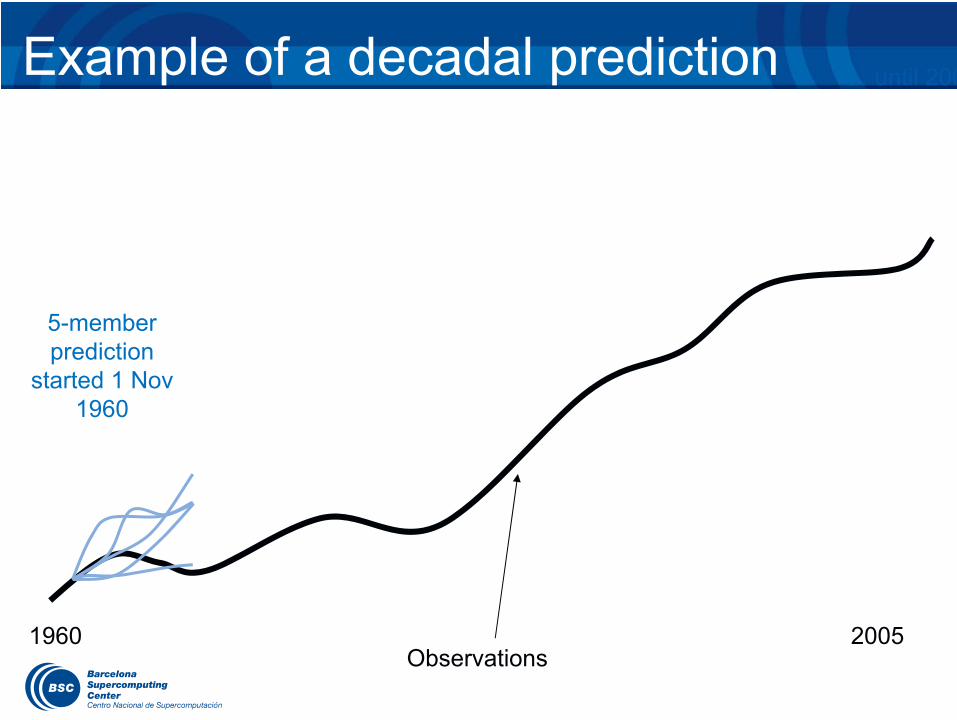
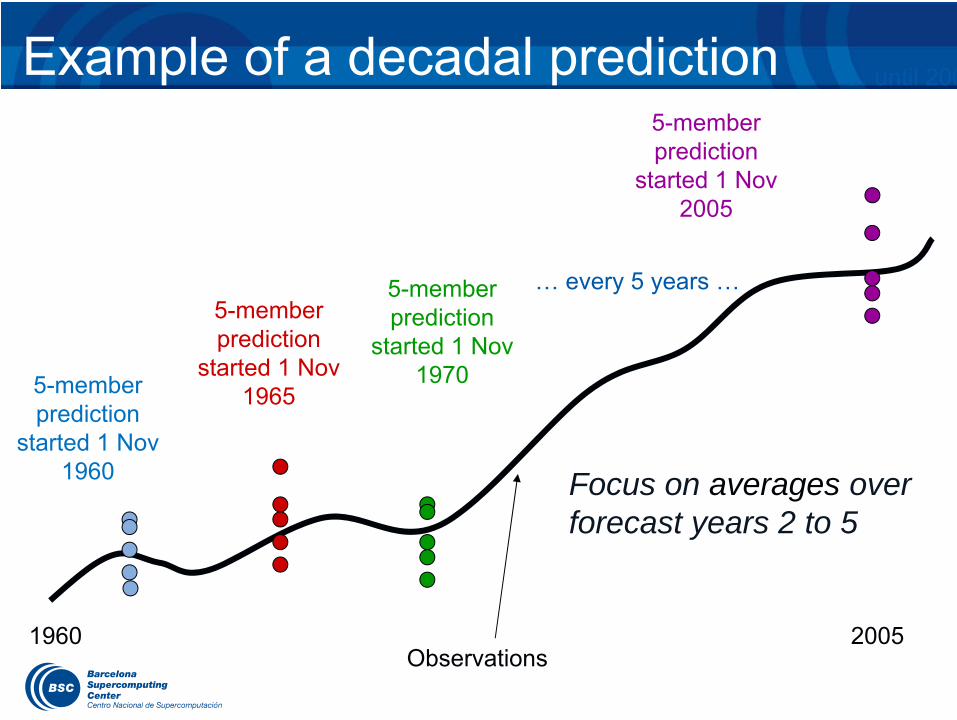
Example of a decadal prediction
Observations1960 2005
… until 200
5-member prediction
started 1 Nov 1960
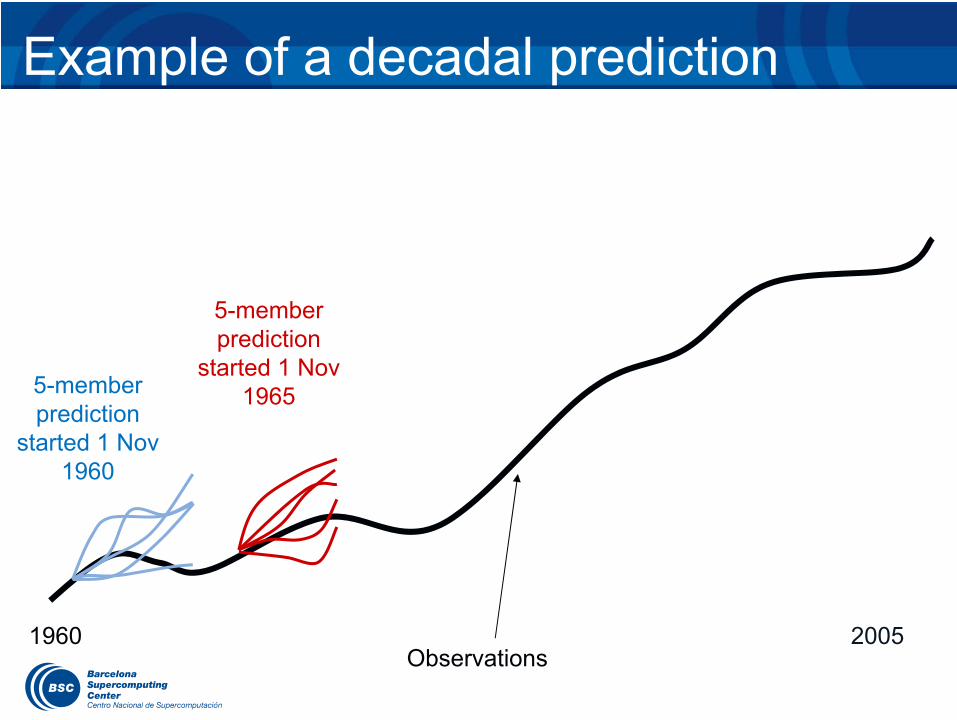
Example of a decadal prediction
Observations1960 2005
5-member prediction
started 1 Nov 19655-member
prediction started 1 Nov
1960
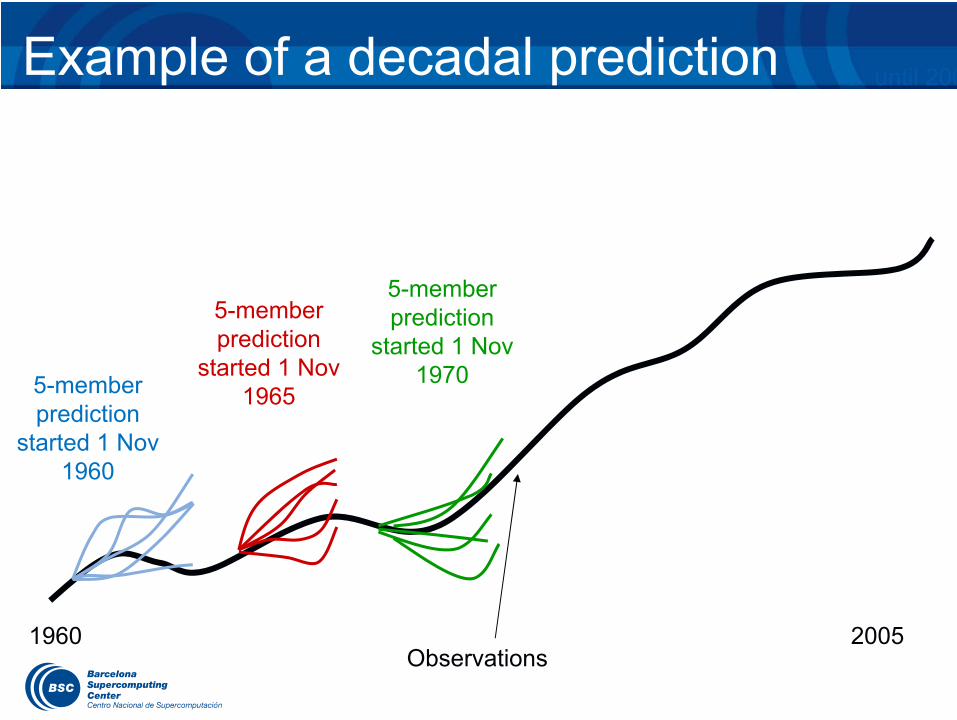
Example of a decadal prediction
Observations1960 2005
… until 200
5-member prediction
started 1 Nov 1970
5-member prediction
started 1 Nov 19655-member
prediction started 1 Nov
1960
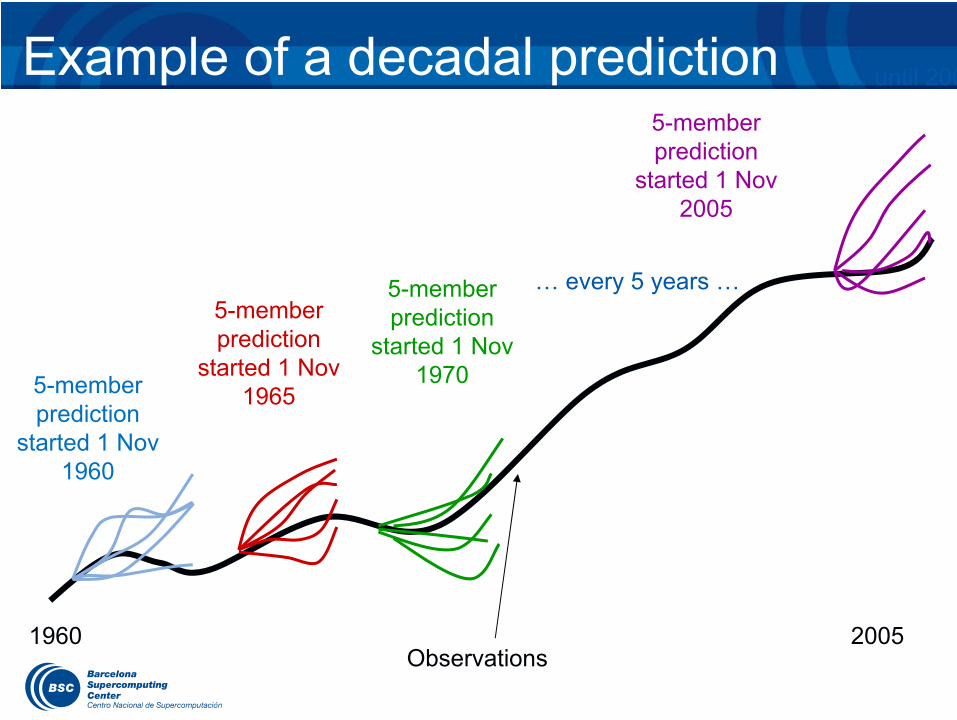
Example of a decadal prediction
Observations1960 2005
5-member prediction
started 1 Nov 2005
… until 200
5-member prediction
started 1 Nov 1970
5-member prediction
started 1 Nov 19655-member
prediction started 1 Nov
1960
… every 5 years …
Example of a decadal prediction
Observations1960 2005
5-member prediction
started 1 Nov 2005
… until 200
5-member prediction
started 1 Nov 1970
5-member prediction
started 1 Nov 19655-member
prediction started 1 Nov
1960 Focus on averages over forecast years 2 to 5
… every 5 years …
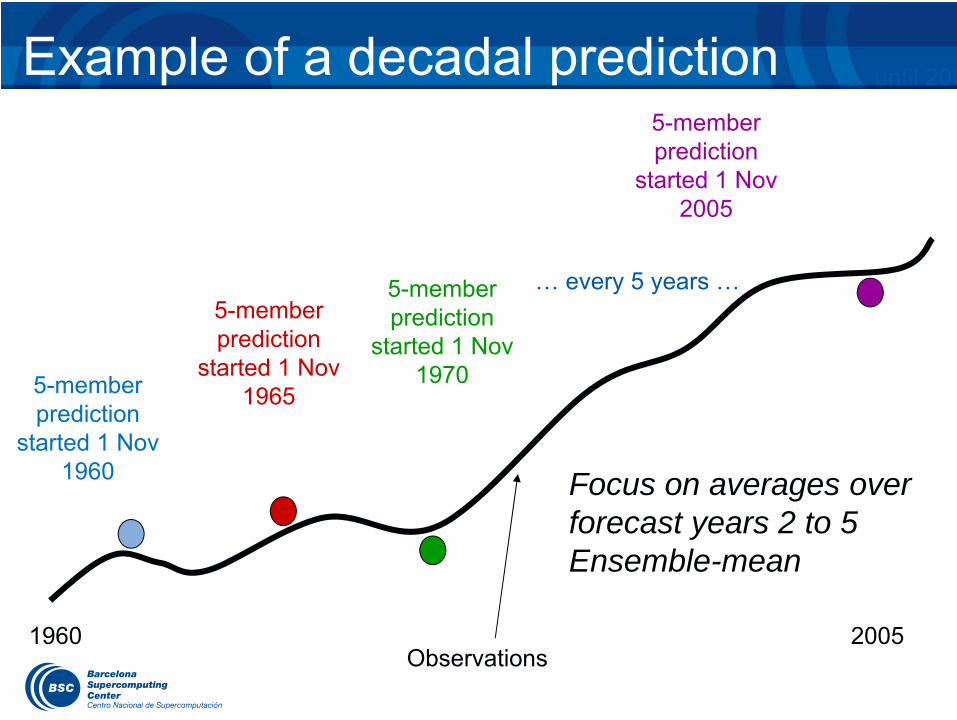
Example of a decadal prediction
Observations1960 2005
5-member prediction
started 1 Nov 2005
… every 5 years …
… until 200
5-member prediction
started 1 Nov 1970
5-member prediction
started 1 Nov 1965
Focus on averages over forecast years 2 to 5Ensemble-mean
5-member prediction
started 1 Nov 1960
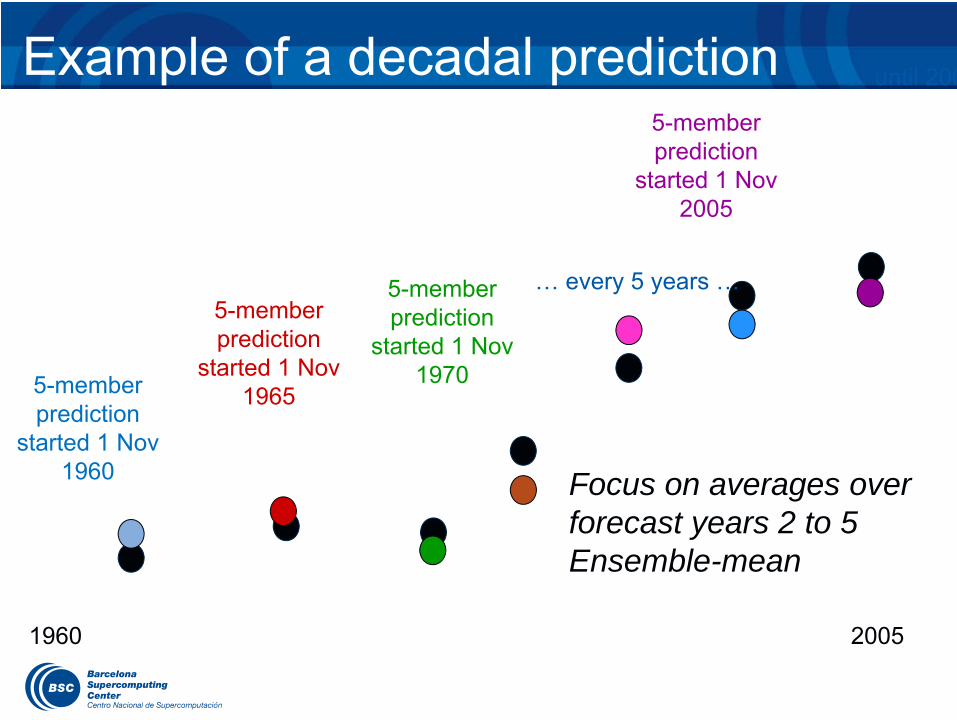
Example of a decadal prediction
1960 2005
… until 200
5-member prediction
started 1 Nov 2005
… every 5 years …5-member prediction
started 1 Nov 1970
5-member prediction
started 1 Nov 1965
Focus on averages over forecast years 2 to 5Ensemble-mean
5-member prediction
started 1 Nov 1960
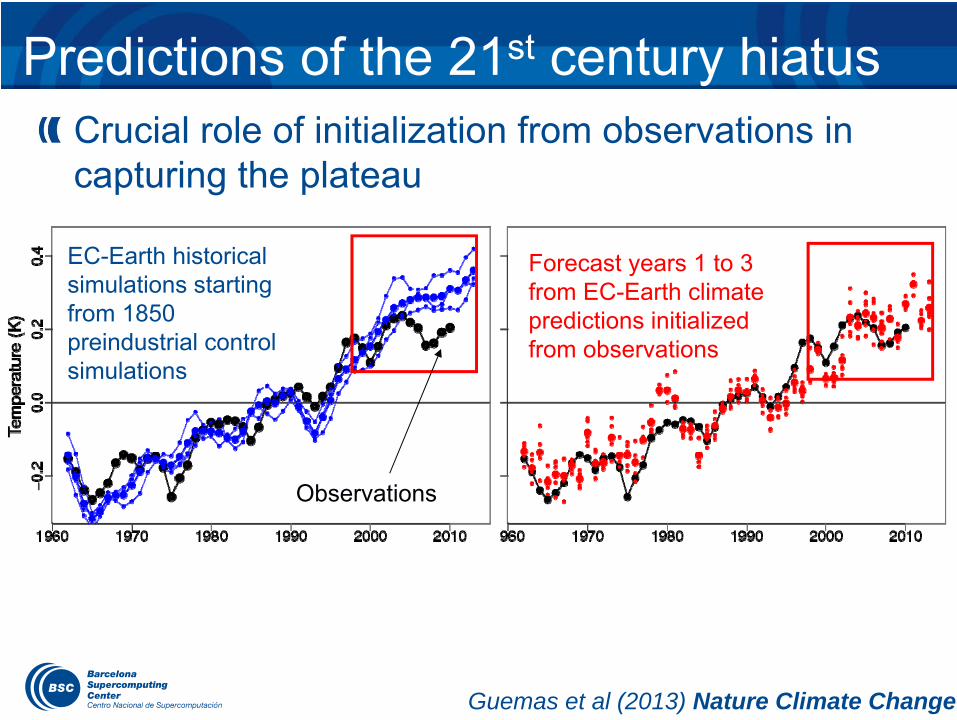
Predictions of the 21st century hiatus
Observations
EC-Earth historical simulations starting from 1850 preindustrial control simulations
Forecast years 1 to 3 from EC-Earth climate predictions initialized from observations
Guemas et al (2013) Nature Climate Change
Crucial role of initialization from observations in capturing the plateau
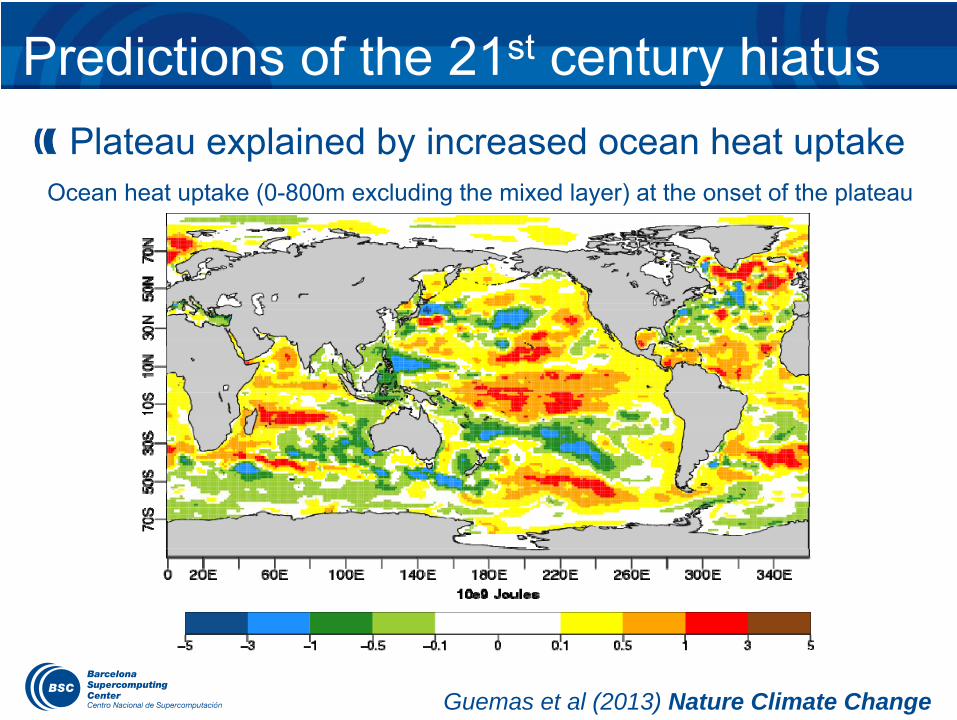
Predictions of the 21st century hiatus
Ocean heat uptake (0-800m excluding the mixed layer) at the onset of the plateau
Guemas et al (2013) Nature Climate Change
Plateau explained by increased ocean heat uptake
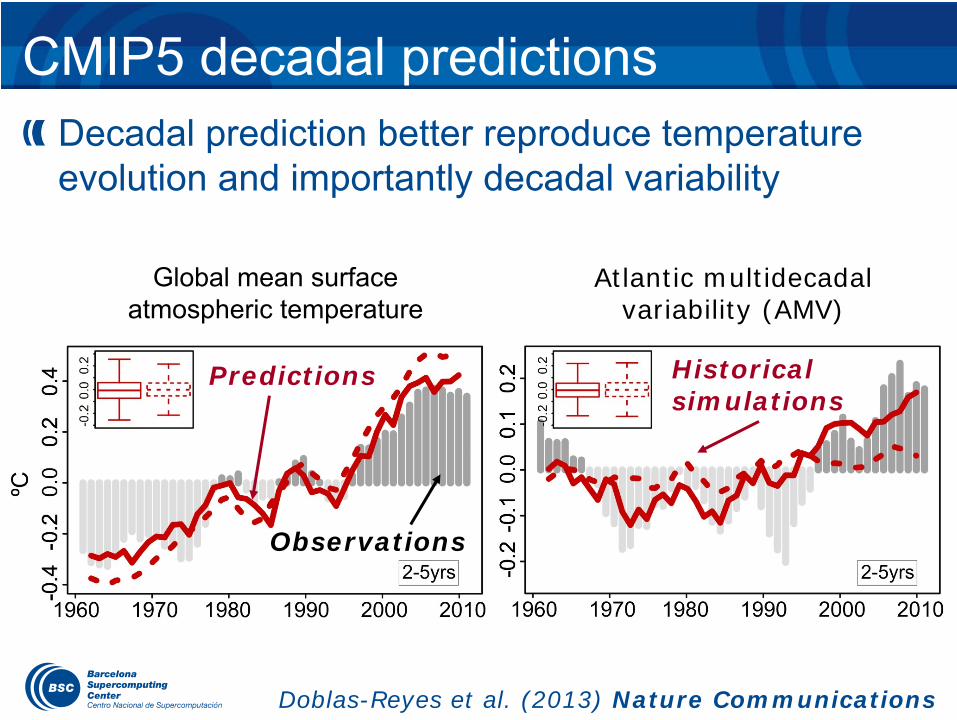
CMIP5 decadal predictions
Predictions Historical simulations
Observations
Atlantic multidecadalvariability (AMV)
Global mean surface atmospheric temperature
Doblas-Reyes et al. (2013) Nature Communications
Decadal prediction better reproduce temperature evolution and importantly decadal variability
30
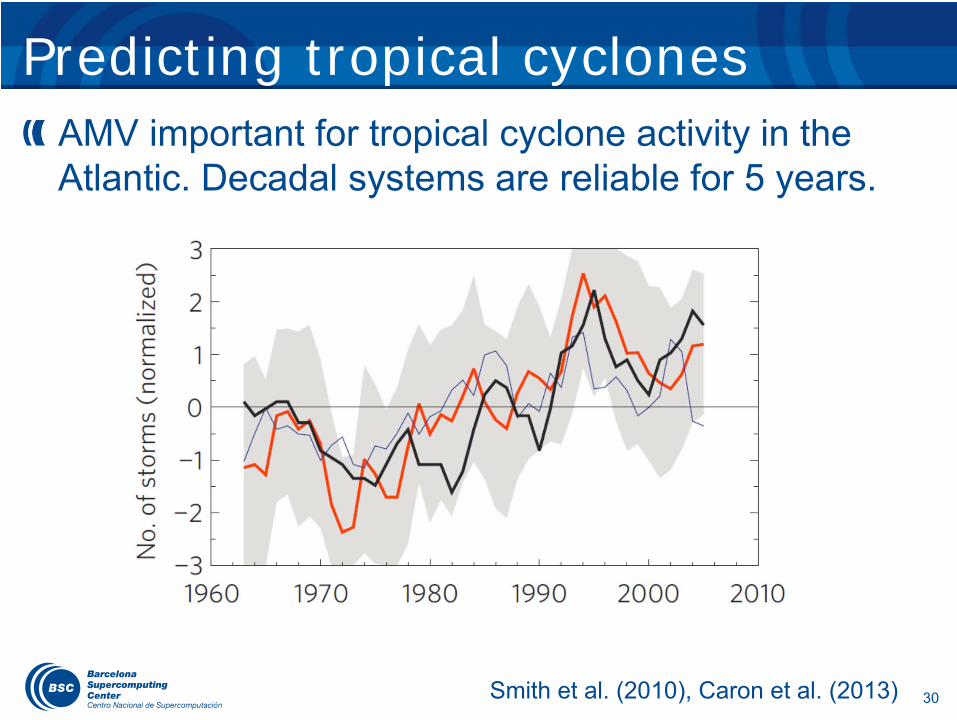
Predicting tropical cyclonesAMV important for tropical cyclone activity in the Atlantic. Decadal systems are reliable for 5 years.
Smith et al. (2010), Caron et al. (2013)
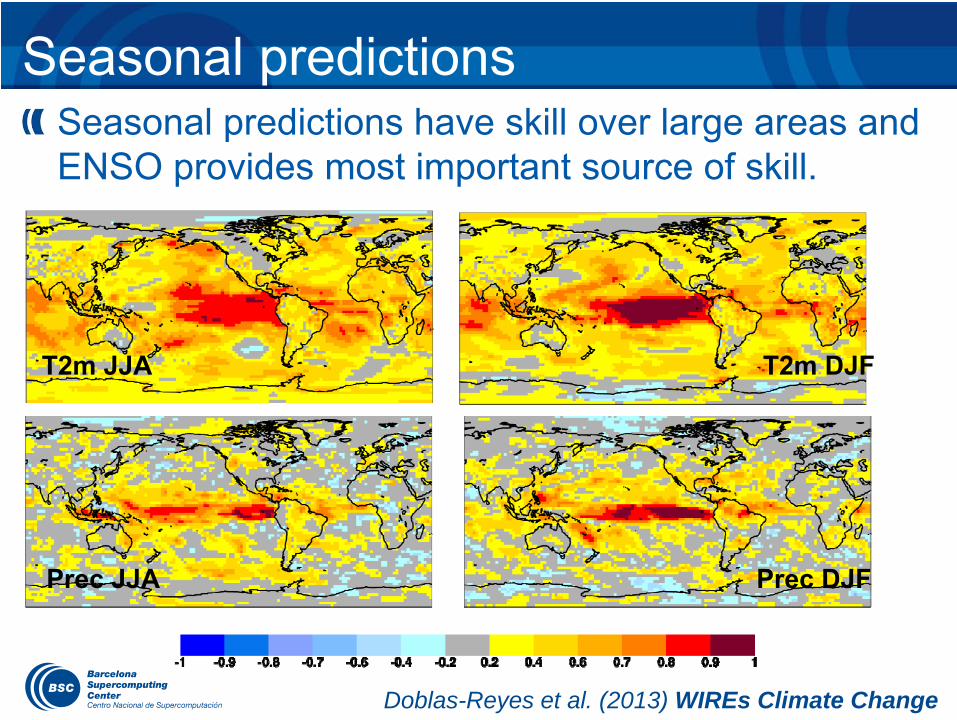
Seasonal predictions
T2m DJF
Prec JJA Prec DJF
Doblas-Reyes et al. (2013) WIREs Climate Change
T2m JJA
Seasonal predictions have skill over large areas and ENSO provides most important source of skill.
32
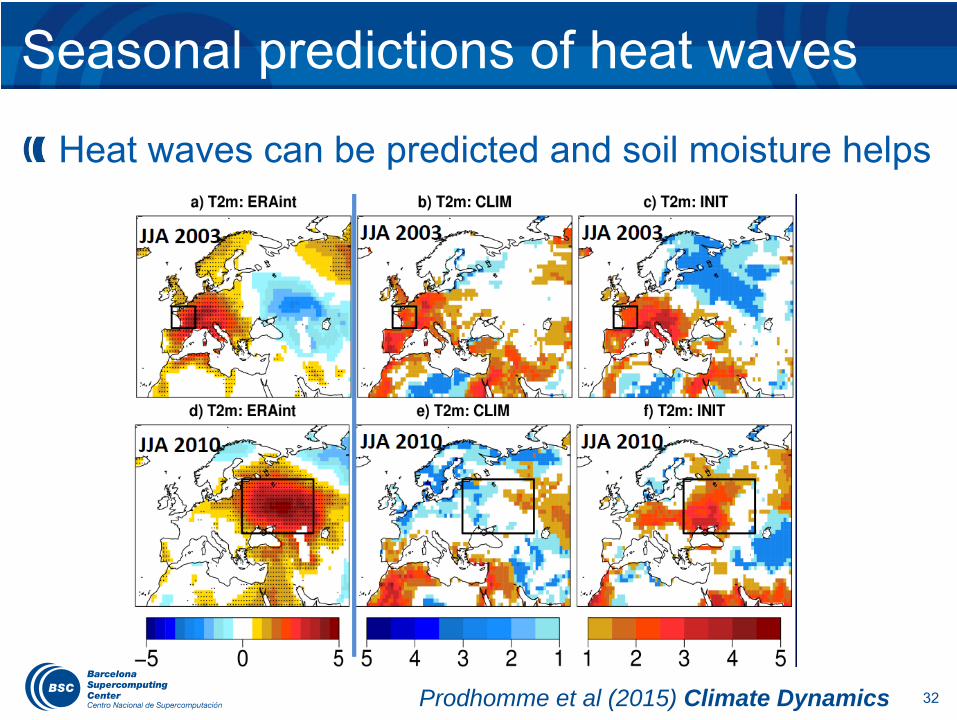
Seasonal predictions of heat waves
Prodhomme et al (2015) Climate Dynamics
Heat waves can be predicted and soil moisture helps
33
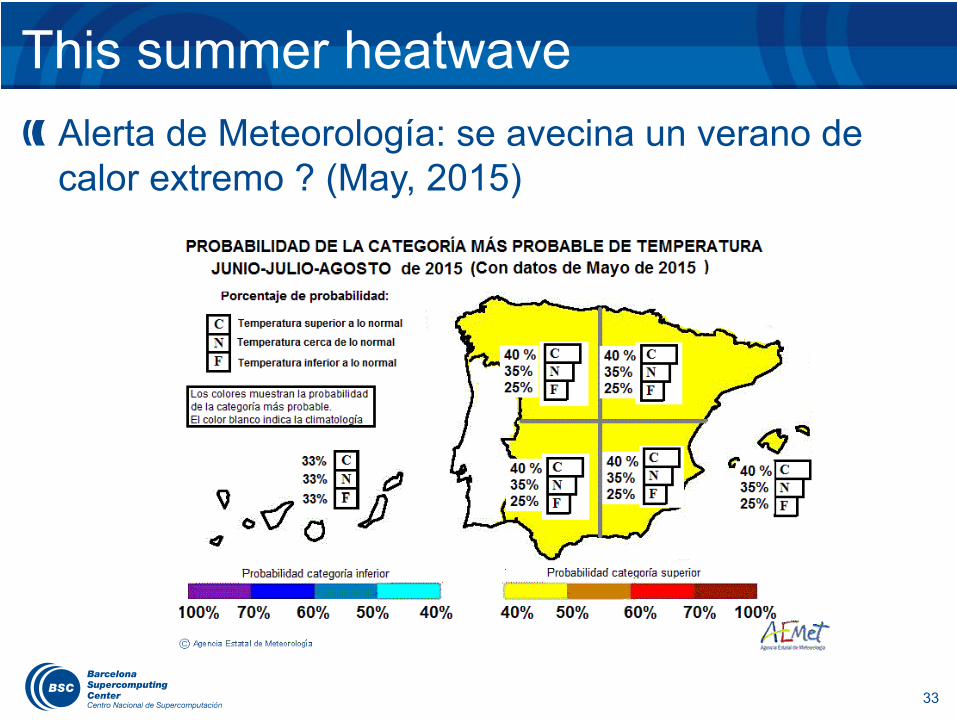
Alerta de Meteorología: se avecina un verano de calor extremo ? (May, 2015)
This summer heatwave
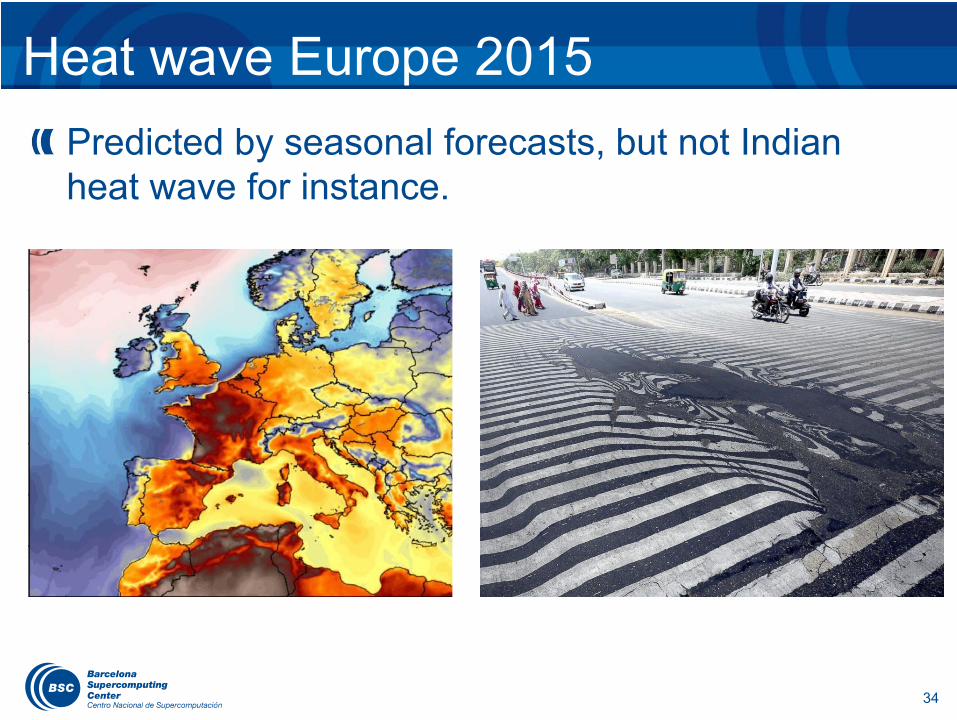
34
Heat wave Europe 2015Predicted by seasonal forecasts, but not Indian heat wave for instance.
35
1. Detection and attribution I: Climate trends2. Seasonal-to-decadal forecasting3. Detection and attribution II: Extreme events4. Climate services: How can we use this information?
Overview
36
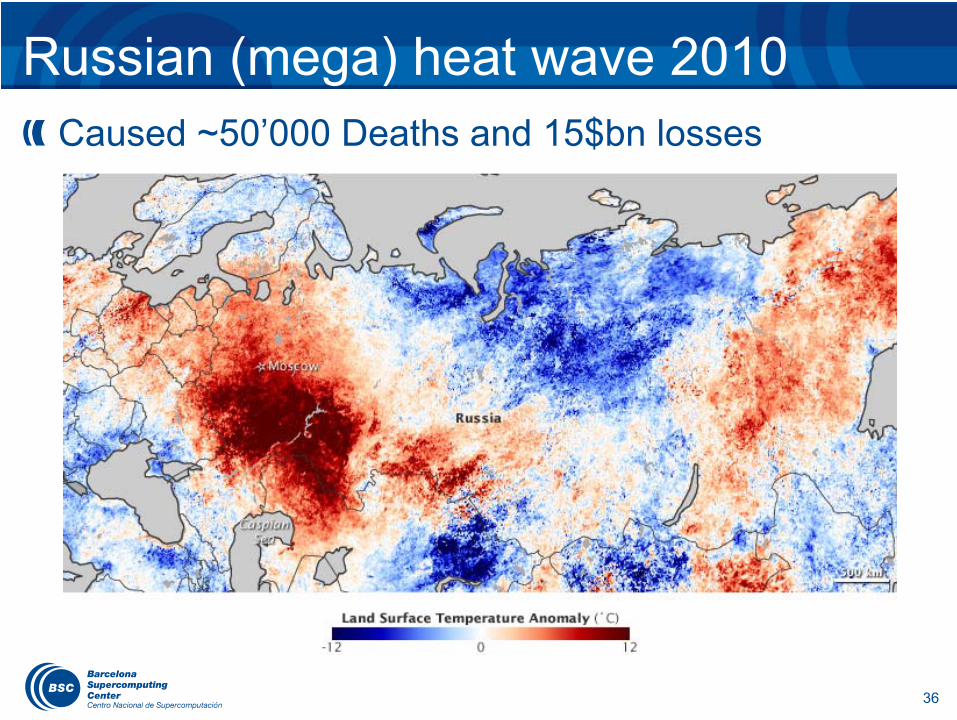
Russian (mega) heat wave 2010Caused ~50’000 Deaths and 15$bn losses
37
Was it due tclimate cha
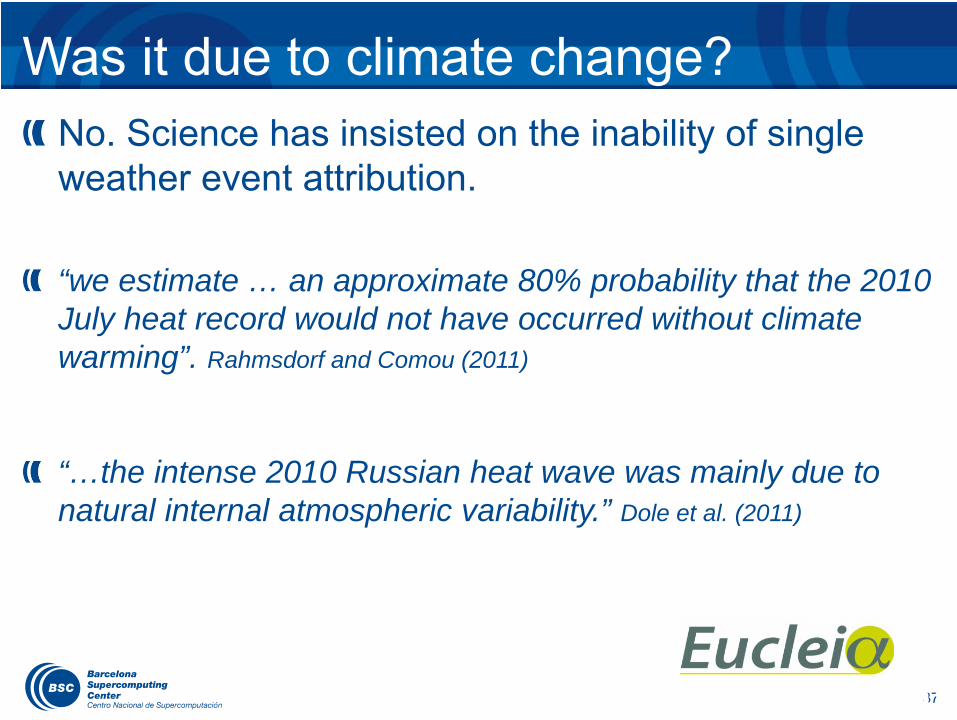
No. Science has insisted on the inability of single weather event attribution.
“we estimate … an approximate 80% probability that the 2010 July heat record would not have occurred without climate warming”. Rahmsdorf and Comou (2011)
“…the intense 2010 Russian heat wave was mainly due to natural internal atmospheric variability.” Dole et al. (2011)
Was it due to climate change?
38
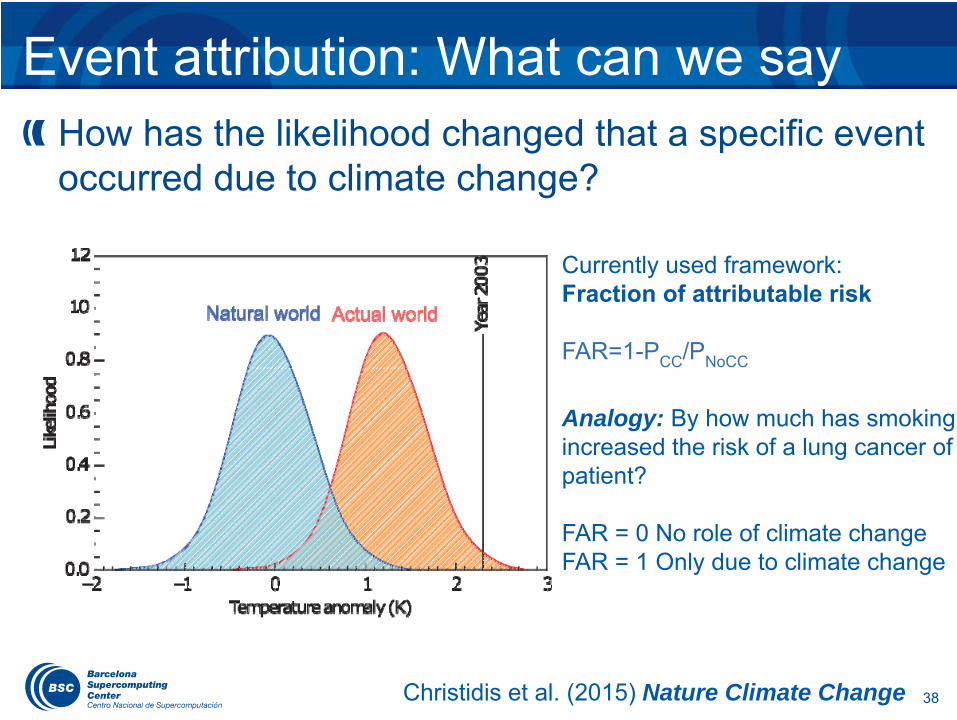
Event attribution: What can we sayHow has the likelihood changed that a specific event occurred due to climate change?
Currently used framework:Fraction of attributable risk
FAR=1-PCC/PNoCC
Analogy: By how much has smoking increased the risk of a lung cancer of patient?
FAR = 0 No role of climate changeFAR = 1 Only due to climate change
Christidis et al. (2015) Nature Climate Change
39
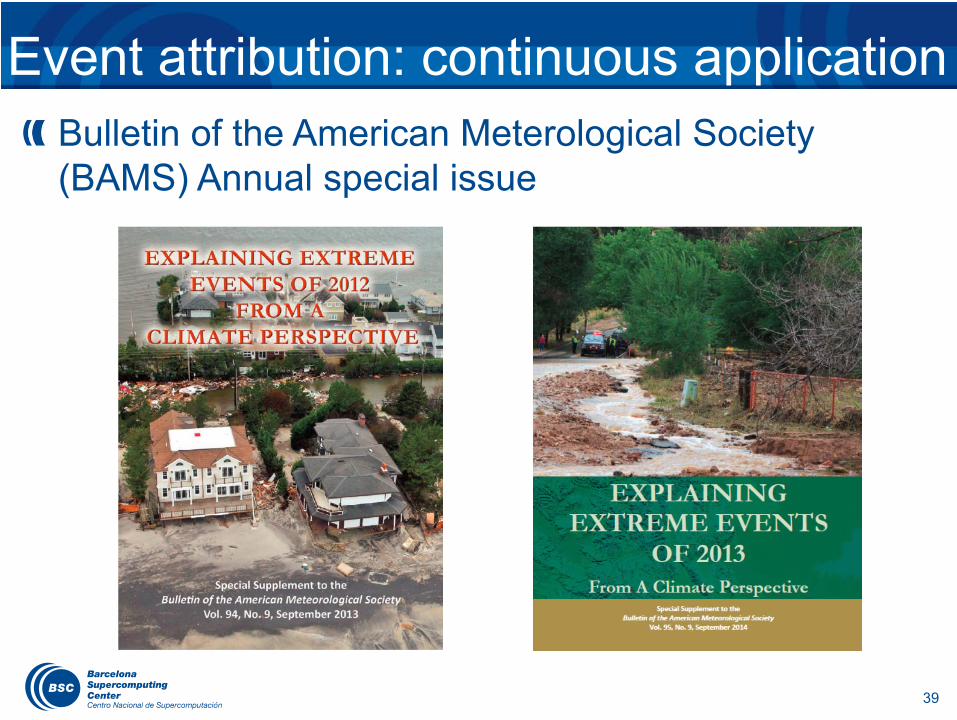
Event attribution: continuous applicationBulletin of the American Meterological Society (BAMS) Annual special issue
40
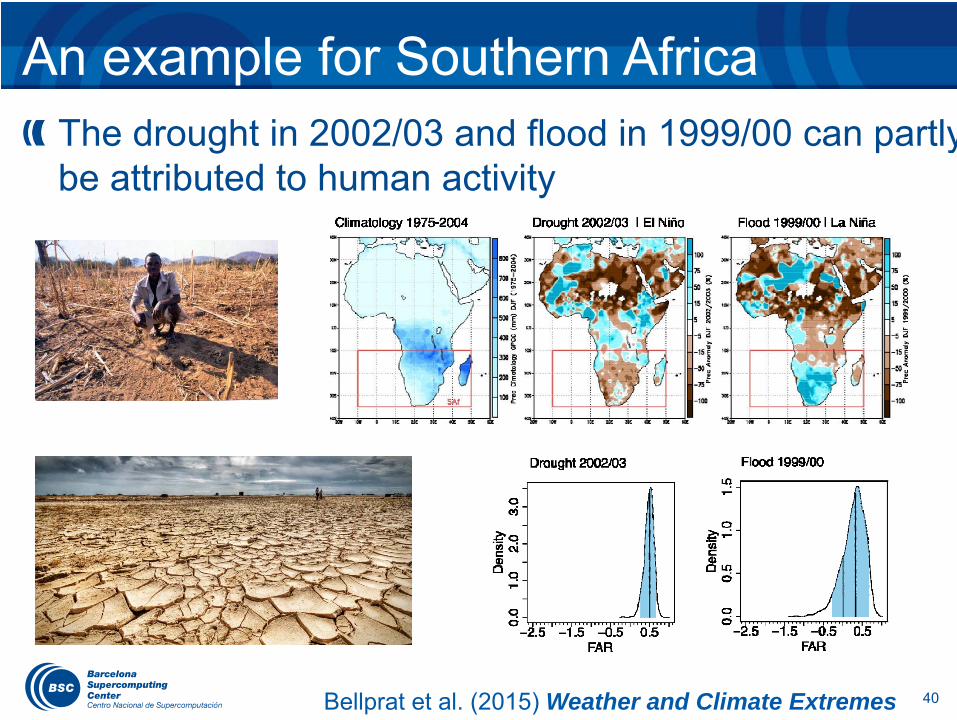
An example for Southern AfricaThe drought in 2002/03 and flood in 1999/00 can partlybe attributed to human activity
Bellprat et al. (2015) Weather and Climate Extremes
41
1. Detection and attribution of climate trends2. Seasonal-to-decadal forecasting3. Attribution of extreme climate/weather events4. Climate services: How can we use this information?
Overview
42
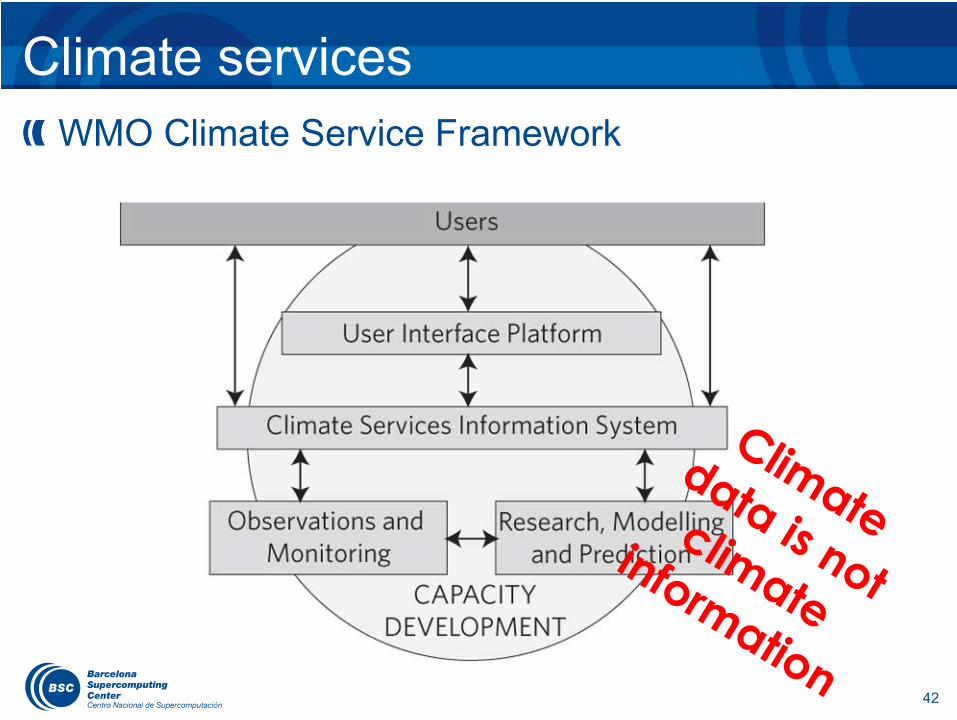
Climate servicesWMO Climate Service Framework
43
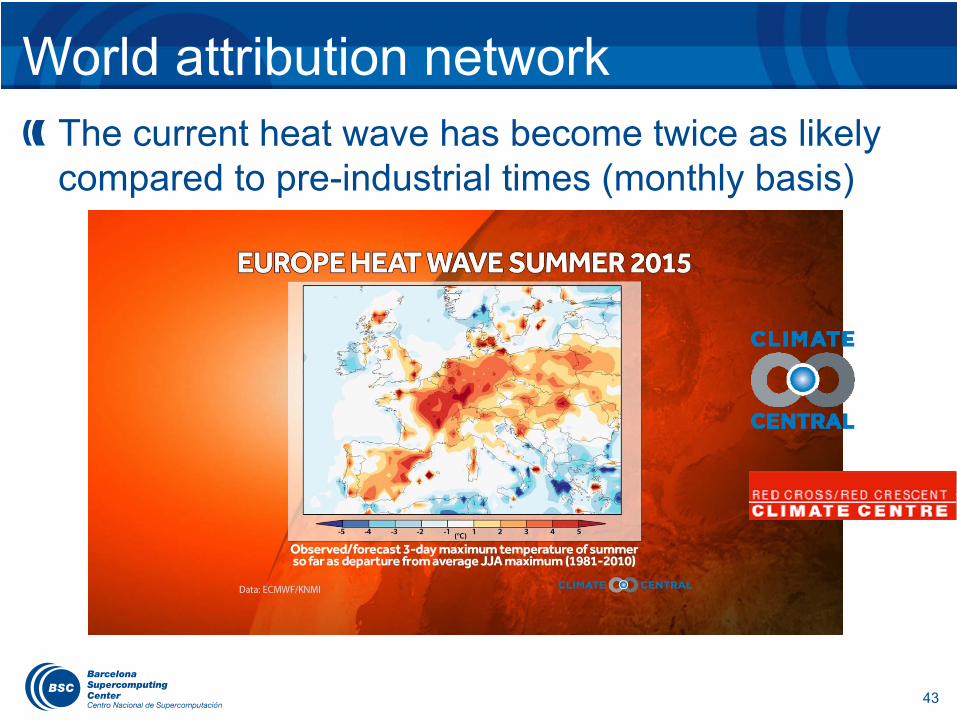
World attribution networkThe current heat wave has become twice as likely compared to pre-industrial times (monthly basis)
44
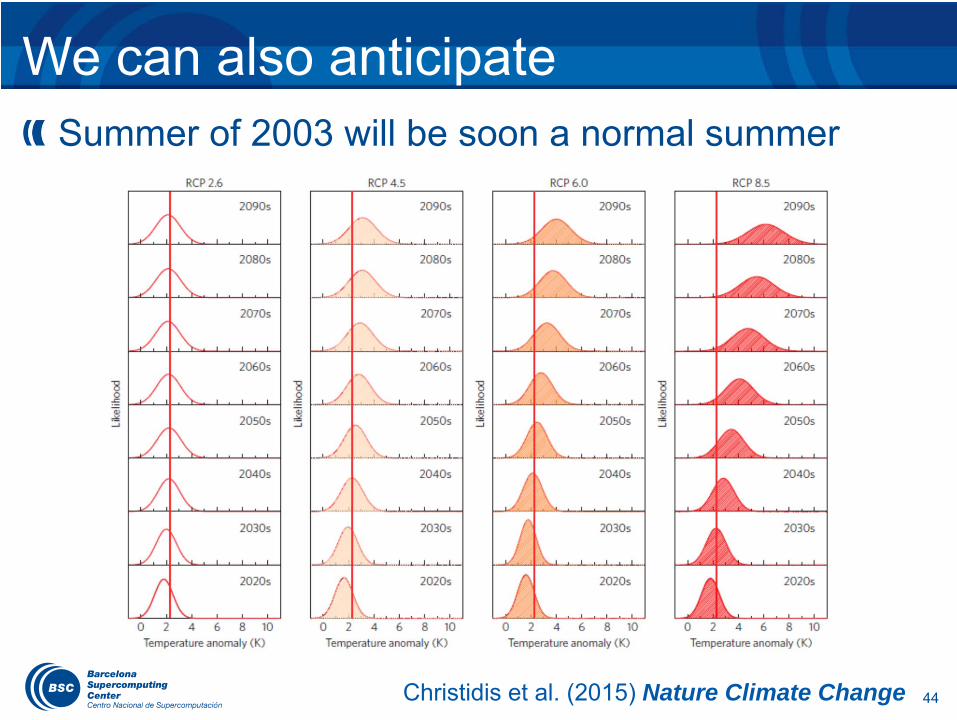
We can also anticipate Summer of 2003 will be soon a normal summer
Christidis et al. (2015) Nature Climate Change
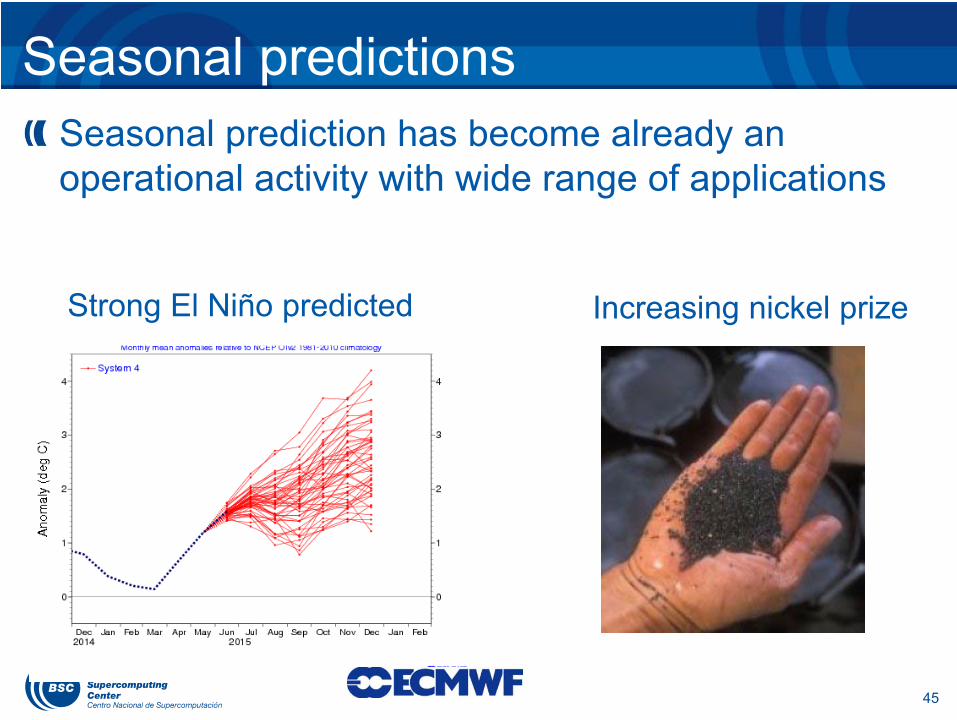
Seasonal prediction has become already an operational activity with wide range of applications
45
Seasonal predictions
Strong El Niño predicted Increasing nickel prize
46
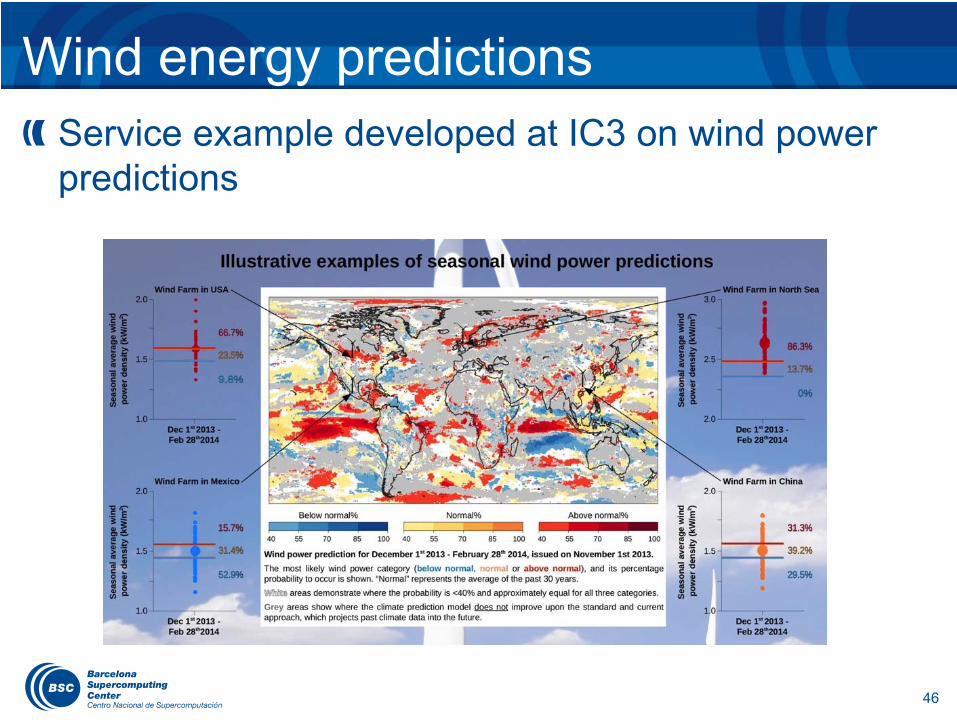
Wind energy predictionsService example developed at IC3 on wind power predictions
47
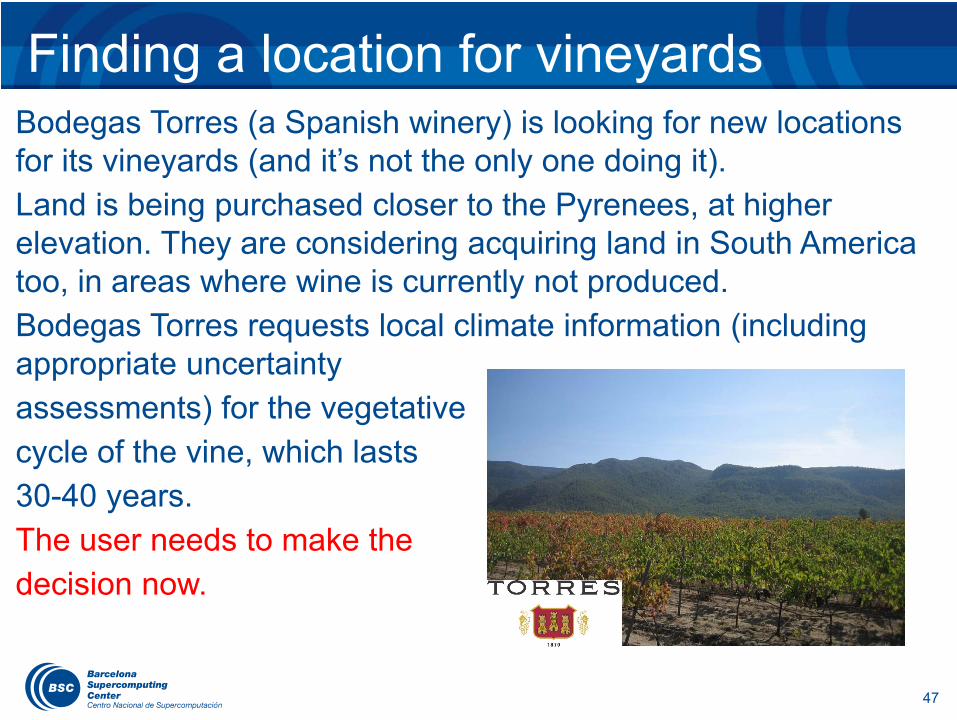
Finding a location for vineyardsBodegas Torres (a Spanish winery) is looking for new locations for its vineyards (and it’s not the only one doing it).Land is being purchased closer to the Pyrenees, at higher elevation. They are considering acquiring land in South America too, in areas where wine is currently not produced.Bodegas Torres requests local climate information (including appropriate uncertaintyassessments) for the vegetativecycle of the vine, which lasts30-40 years.The user needs to make thedecision now.
48
Conclusions and discussionUsing climate models we are able to predict climate anomalies and provide a service to society, an ongoing activity called “climate services”
Attribution shows that climate change is man made and extreme events are already more likely because of it. Event attribution helps us to inform the public.
“Maybe we should no longer care about uncertainties of climate projections by the end of the century (2100) as we will adapt to it anyway, we have to take decisions now, climate change is already happening”
49
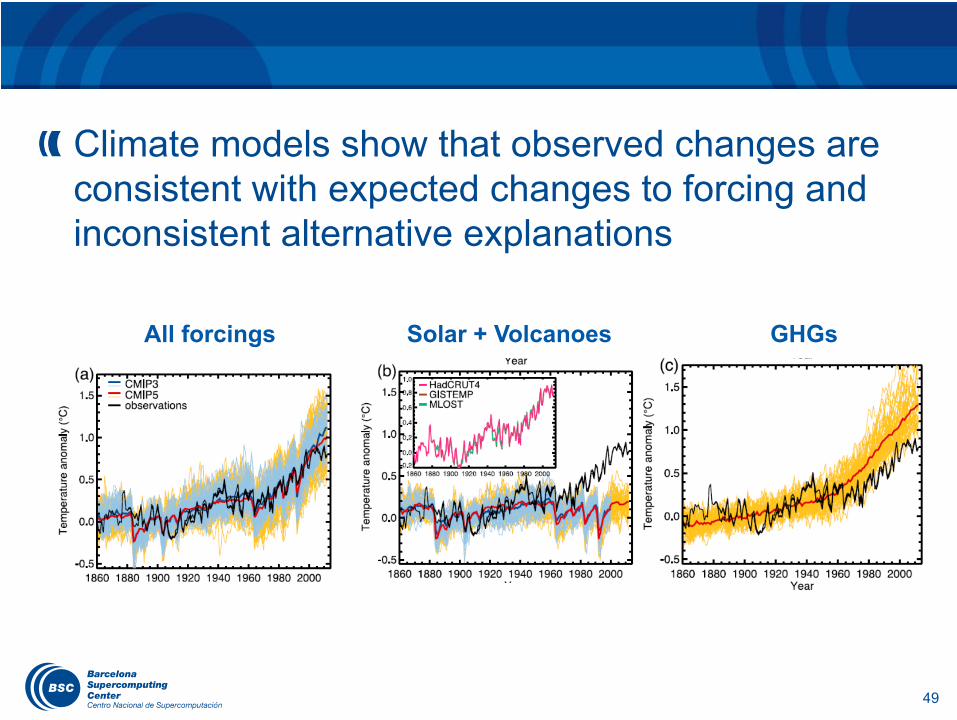
All forcings Solar + Volcanoes GHGs
Climate models show that observed changes are consistent with expected changes to forcing and inconsistent alternative explanations
50
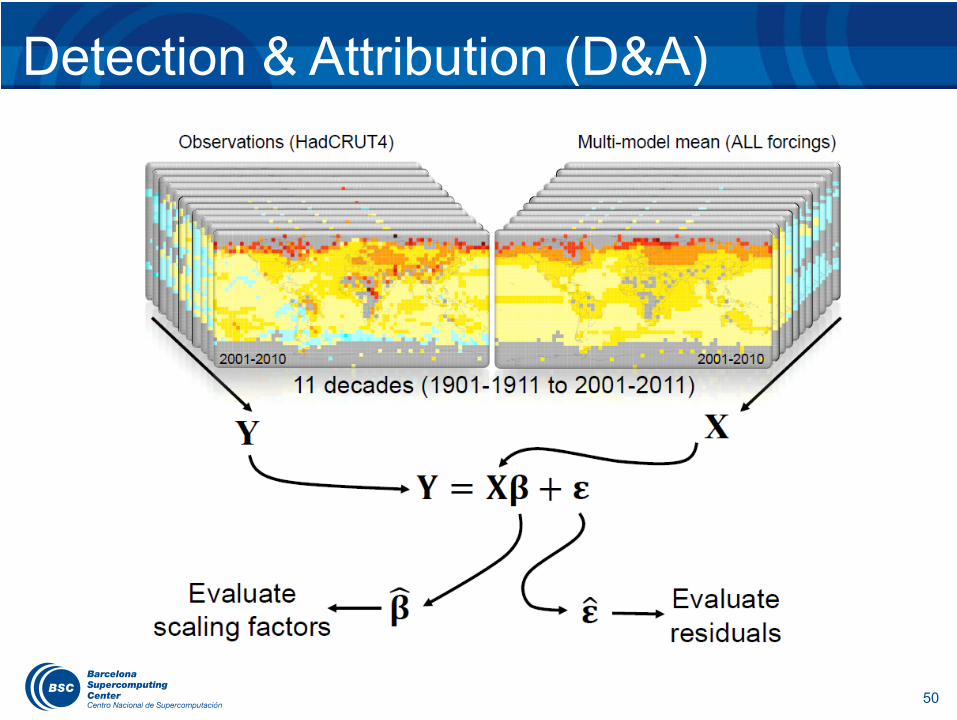
Detection & Attribution (D&A)
51
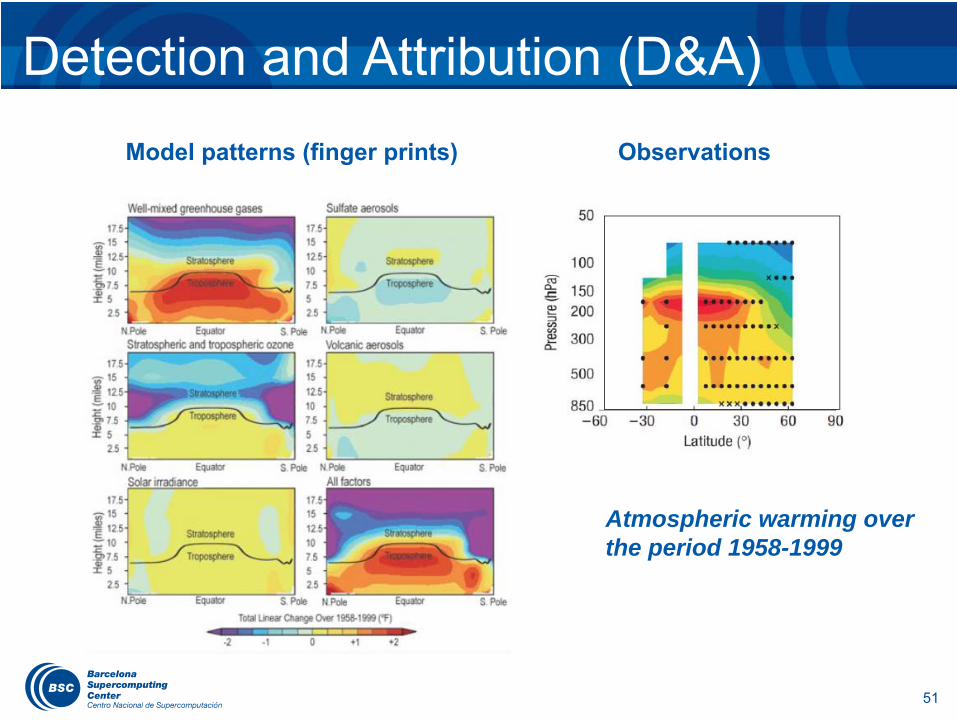
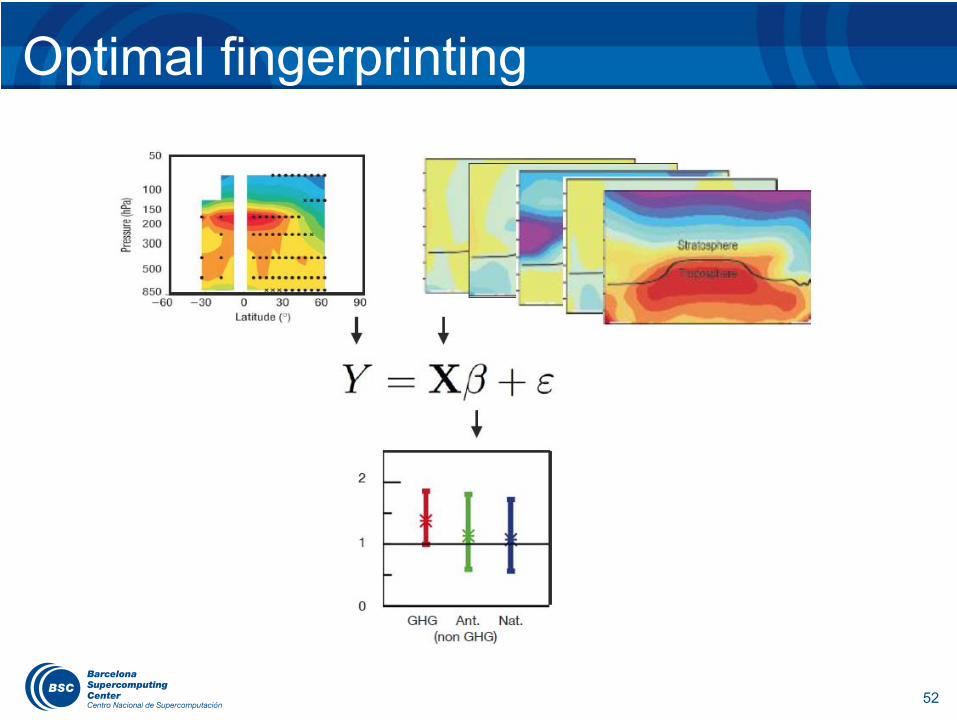
Detection and Attribution (D&A)Model patterns (finger prints) Observations
Atmospheric warming over the period 1958-1999
52
Optimal fingerprinting
53
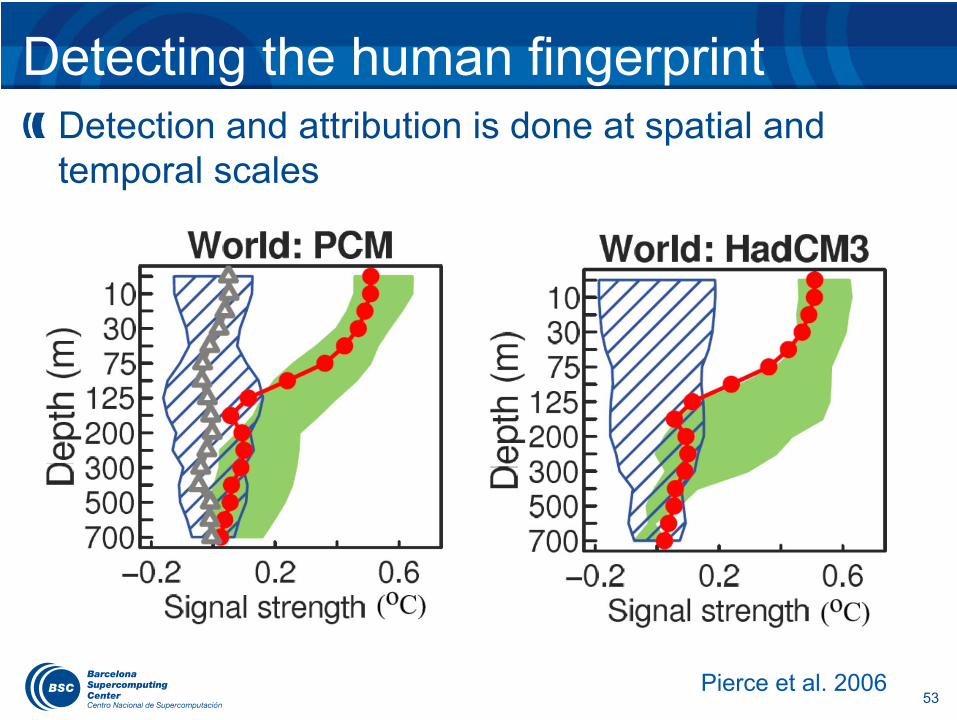
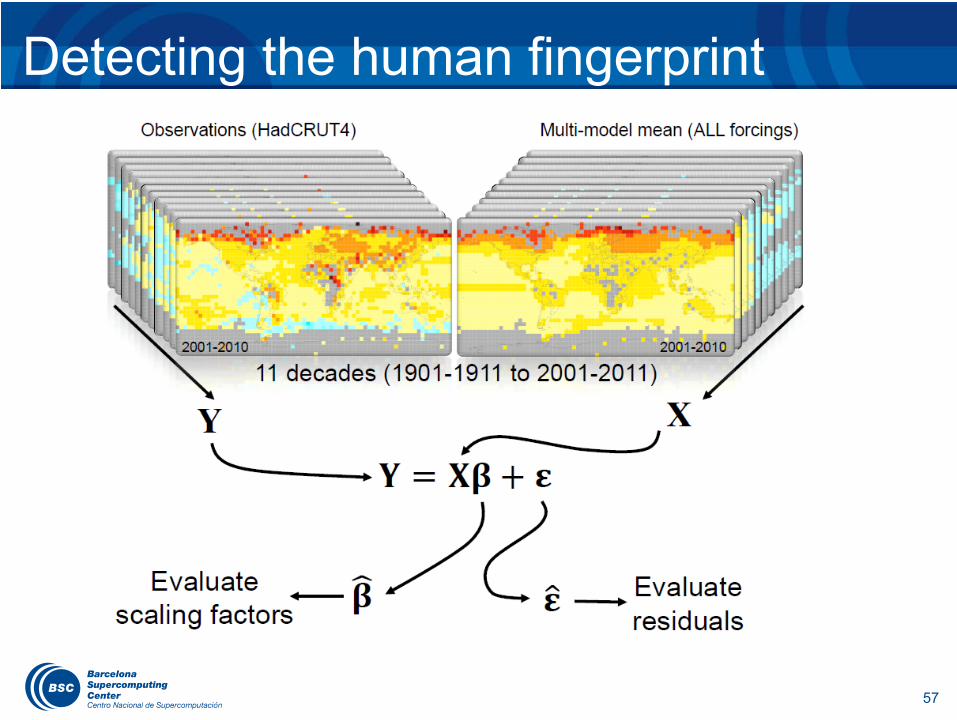
Detecting the human fingerprintDetection and attribution is done at spatial and temporal scales
Pierce et al. 2006
54
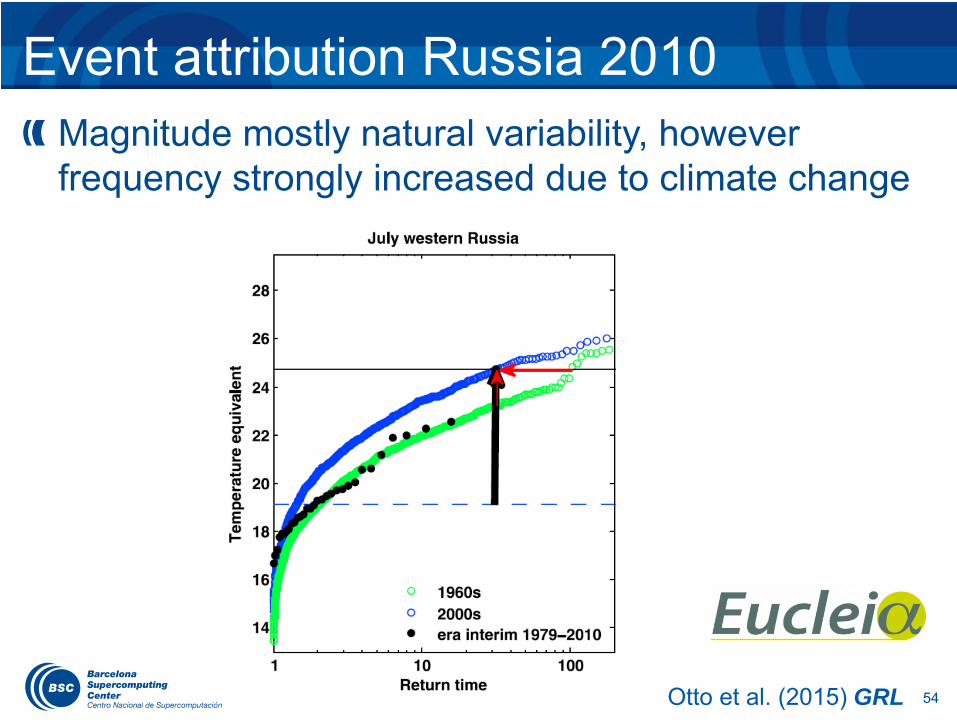
Event attribution Russia 2010Magnitude mostly natural variability, however frequency strongly increased due to climate change
Otto et al. (2015) GRL
55
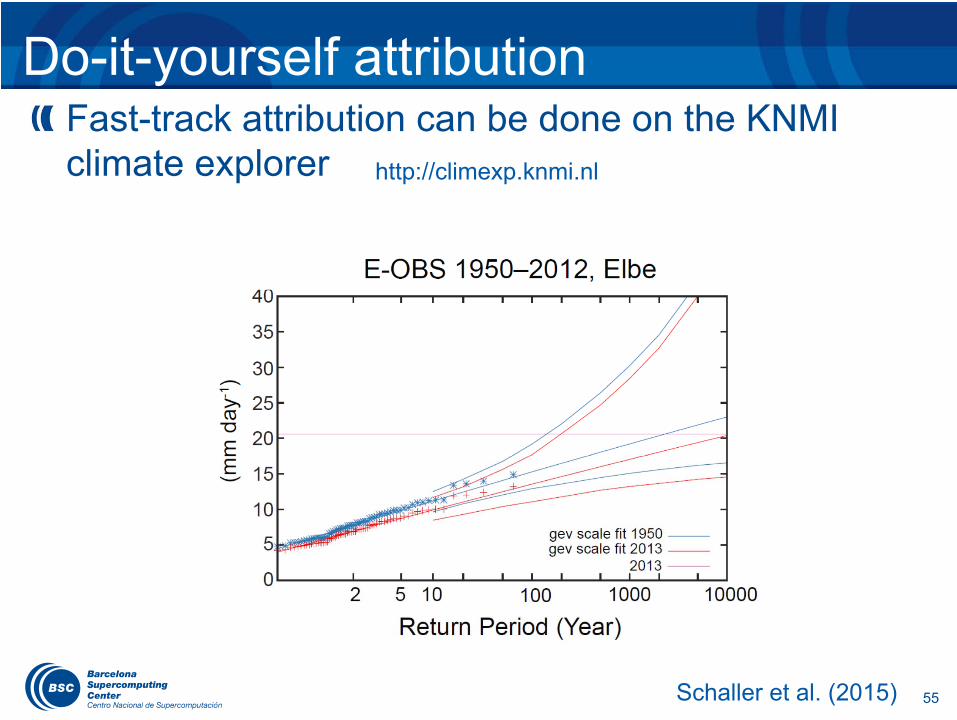
Do-it-yourself attributionFast-track attribution can be done on the KNMI climate explorer http://climexp.knmi.nl
Schaller et al. (2015)
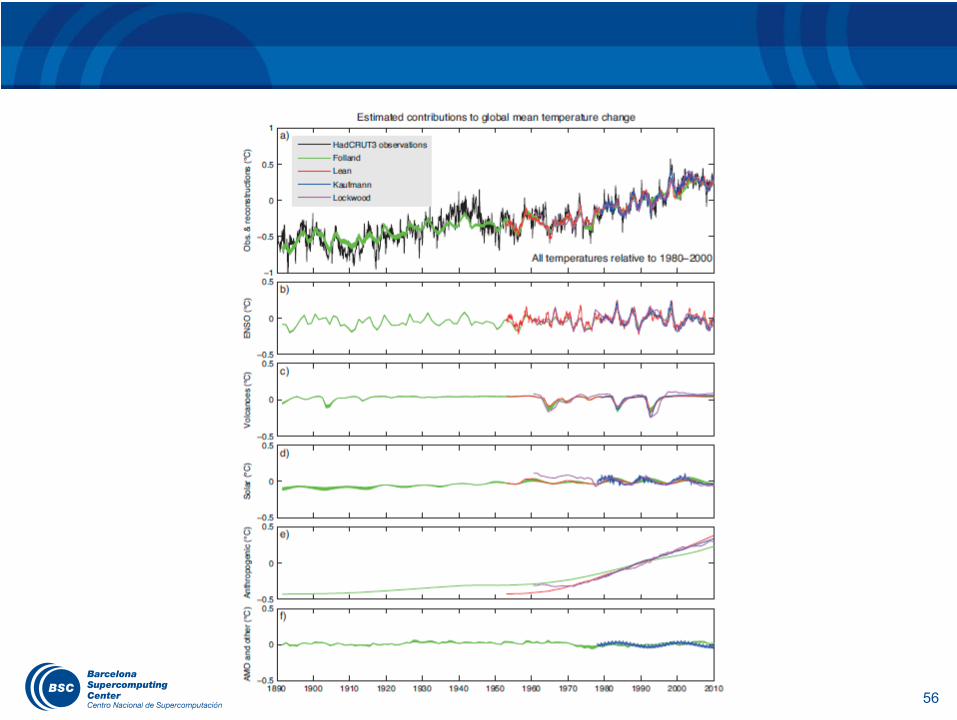
56
57
Detecting the human fingerprint
58
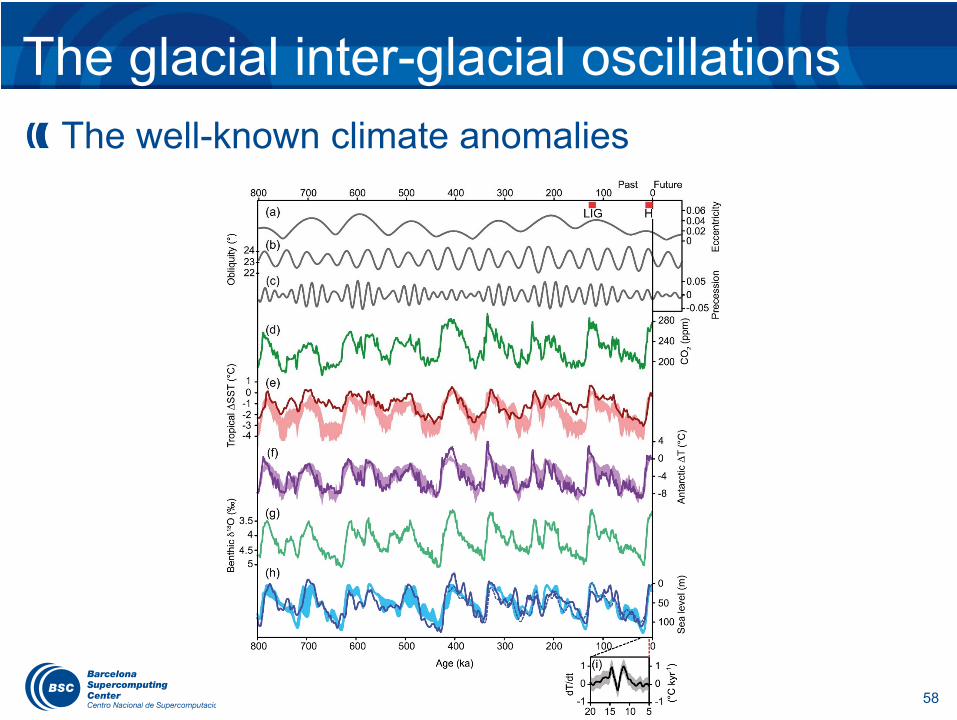
The glacial inter-glacial oscillationsThe well-known climate anomalies