Embed Size (px)
Citation preview
The Fight for a Food-Secure Tomorrow
@Elanco #FeedThe9 GMACTLNON00007
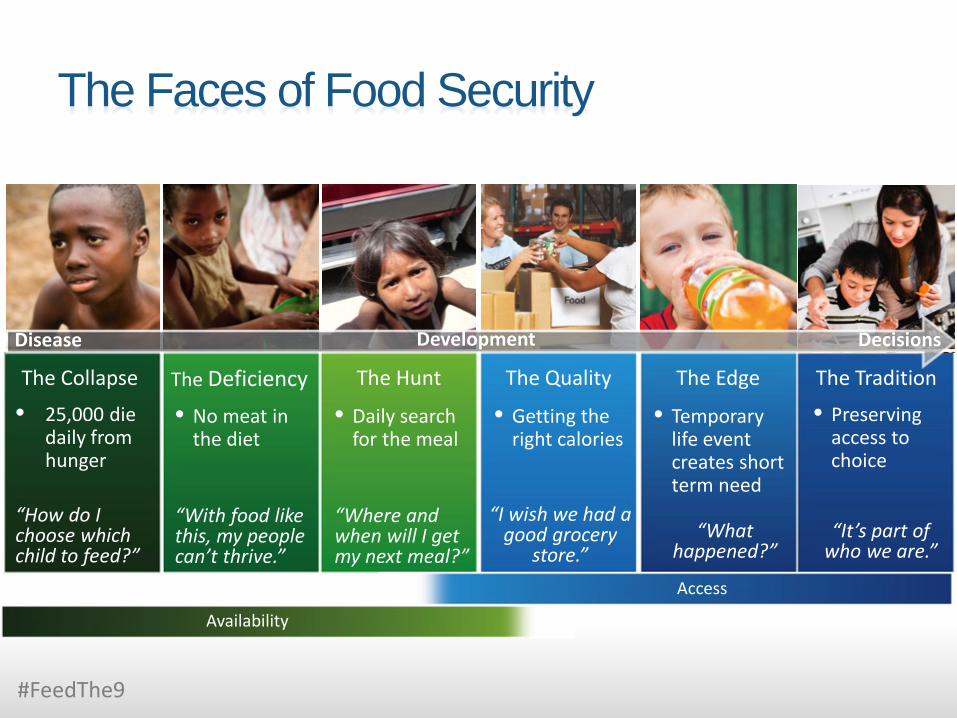
• 25,000 die daily from hunger
The Collapse
The Faces of Food Security
#FeedThe9
The Deficiency The Hunt The Edge The Quality
Access
Availability
Disease Development Decisions
• No meat in the diet
• Daily search for the meal
• Getting the right calories
• Temporary life event creates short term need
• Preserving access to choice
“How do I choose which child to feed?”
“With food like this, my people can’t thrive.”
“Where and when will I get my next meal?”
“I wish we had a good grocery
store.” “What
happened?” “It’s part of
who we are.”
The Tradition
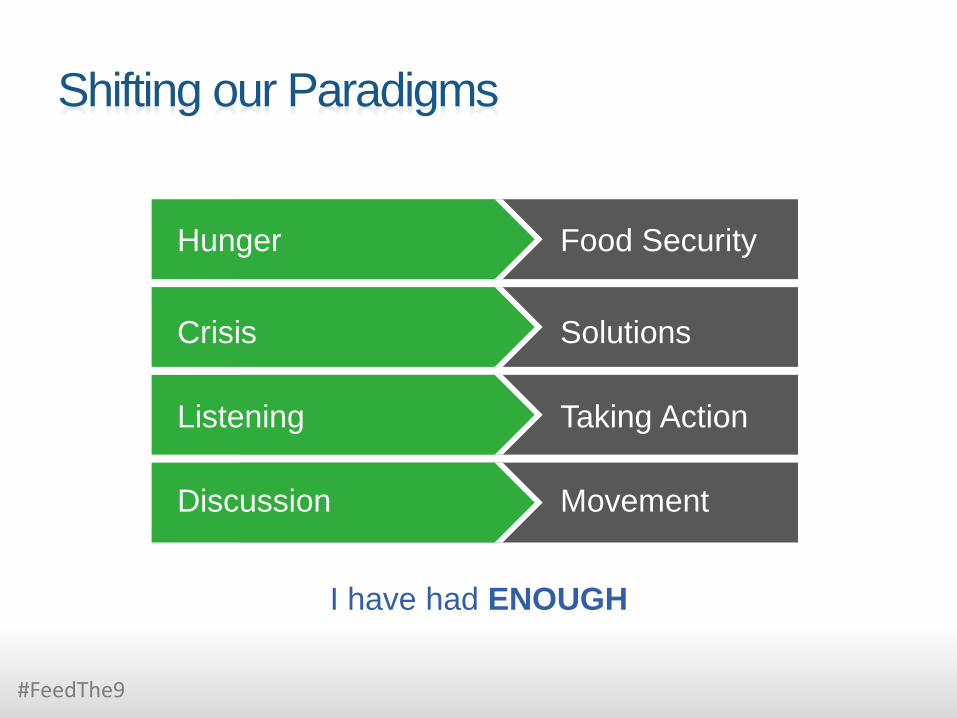
Shifting our Paradigms
Hunger Food Security Crisis Solutions
Listening Taking Action
Discussion Movement
I have had ENOUGH
#FeedThe9
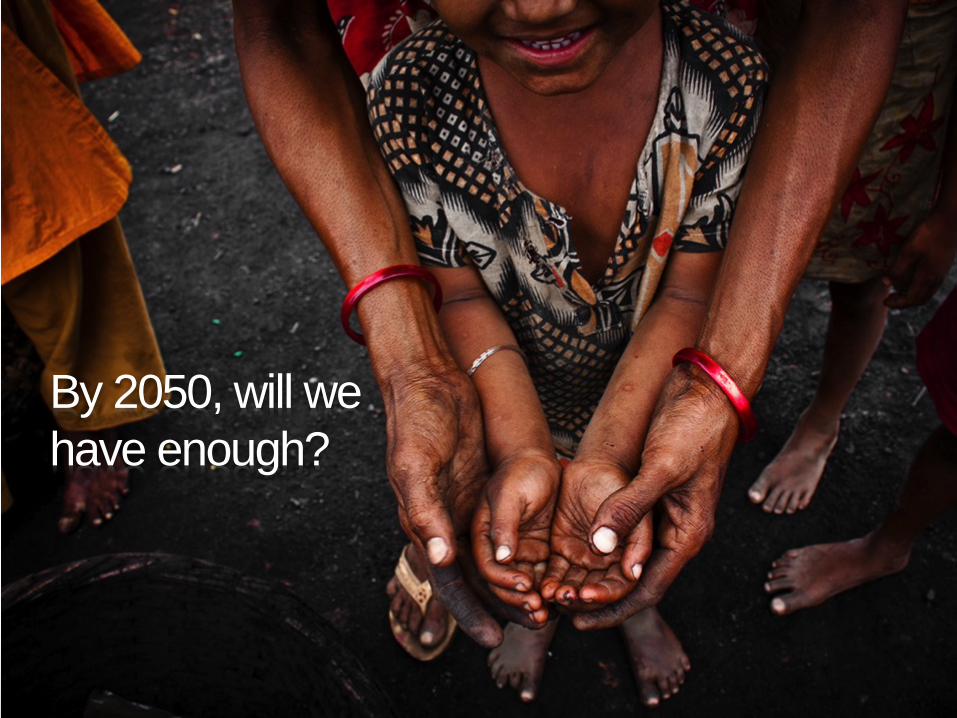
By 2050, will we have enough?
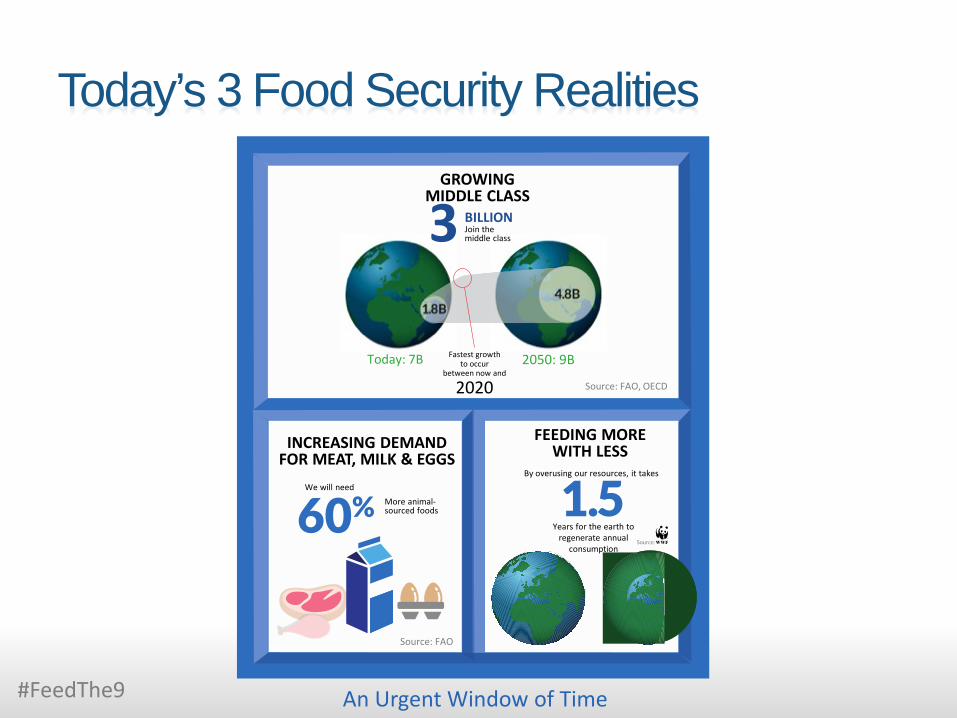
Today’s 3 Food Security Realities
#FeedThe9
FEEDING MORE WITH LESS
By overusing our resources, it takes
Years for the earth to regenerate annual
consumption
An Urgent Window of Time
2050: 9B Today: 7B
GROWING MIDDLE CLASS
BILLION Join the middle class 3
Fastest growth to occur
between now and
2020 Source: FAO, OECD
INCREASING DEMAND FOR MEAT, MILK & EGGS
We will need More animal-sourced foods
Source: FAO
#FeedThe9
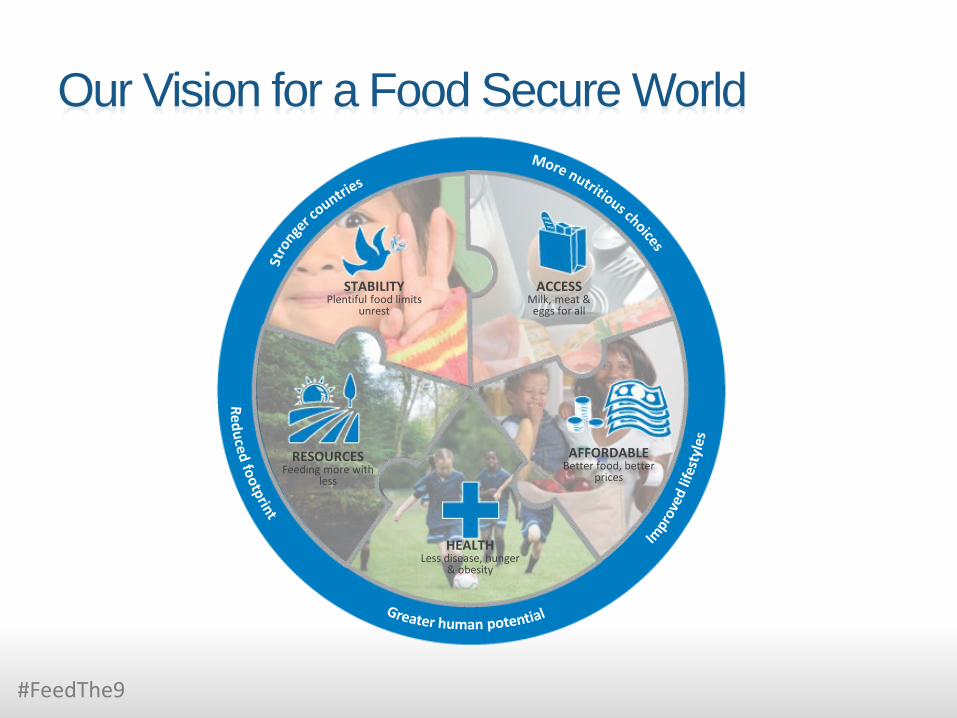
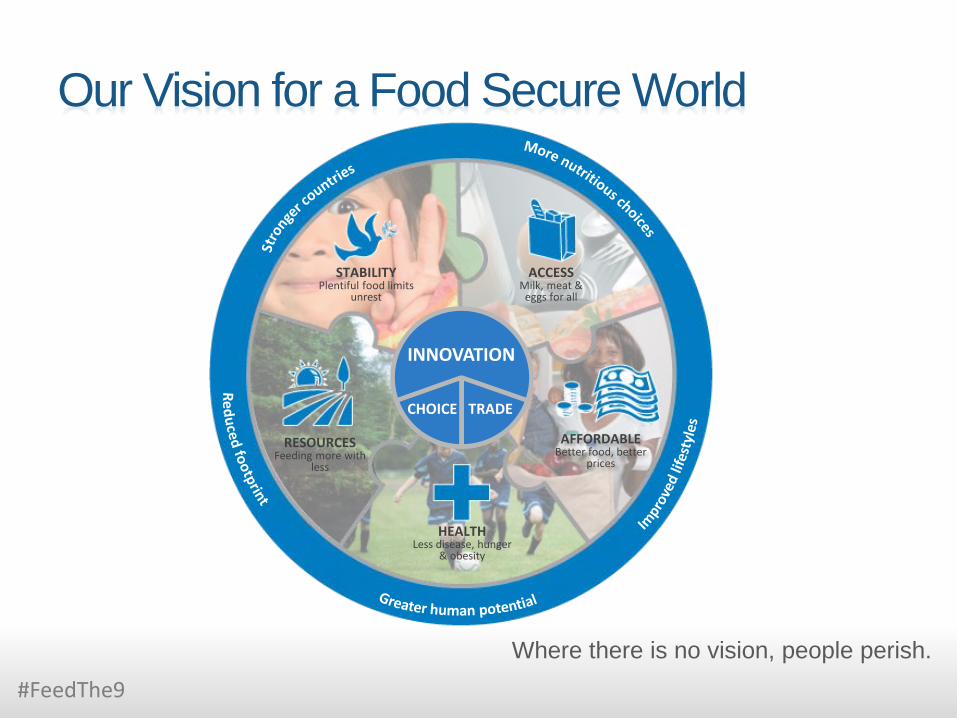
Our Vision for a Food Secure World
ACCESS Milk, meat &
eggs for all
AFFORDABLE Better food, better
prices
STABILITY Plentiful food limits
unrest
RESOURCES Feeding more with
less
HEALTH Less disease, hunger
& obesity
How will we meet beef demand in 2050?
Meat Milk Energy Control
Incr
ease
in E
nd o
f Ter
m T
est S
core
s
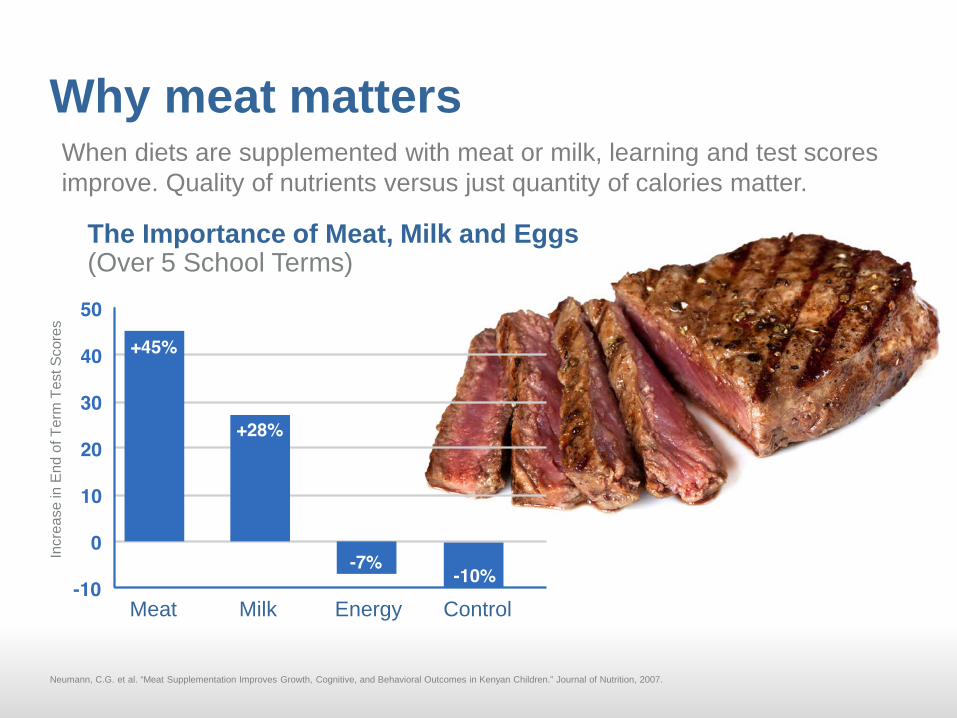
The Importance of Meat, Milk and Eggs (Over 5 School Terms)
Neumann, C.G. et al. “Meat Supplementation Improves Growth, Cognitive, and Behavioral Outcomes in Kenyan Children.” Journal of Nutrition, 2007.
When diets are supplemented with meat or milk, learning and test scores improve. Quality of nutrients versus just quantity of calories matter.
Why meat matters
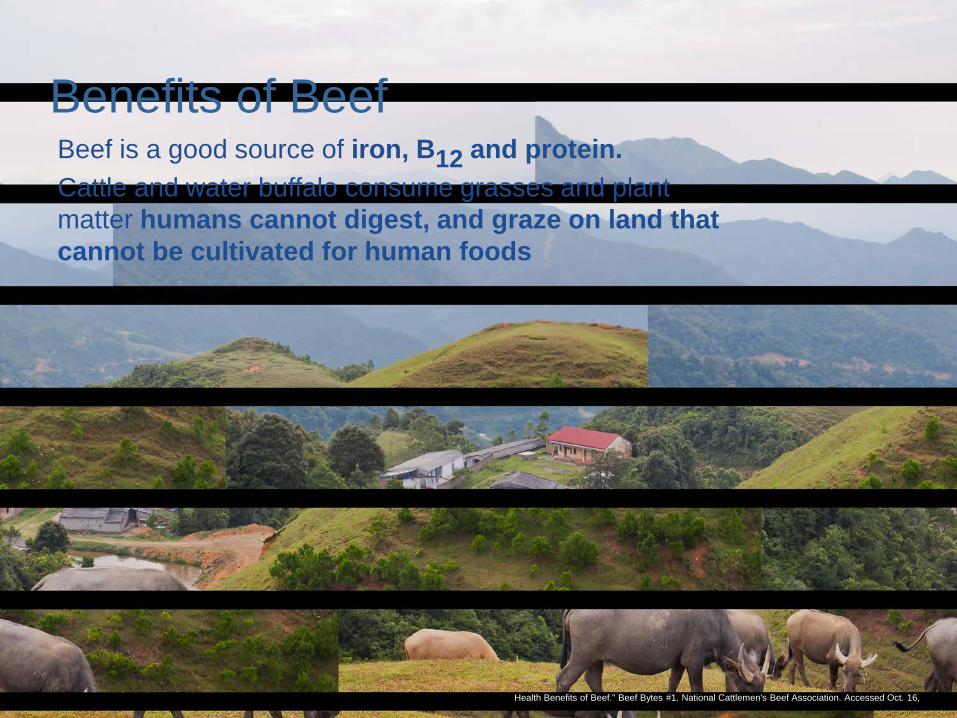
Health Benefits of Beef." Beef Bytes #1. National Cattlemen's Beef Association. Accessed Oct. 16,
Beef is a good source of iron, B12 and protein. Cattle and water buffalo consume grasses and plant matter humans cannot digest, and graze on land that cannot be cultivated for human foods
Benefits of Beef
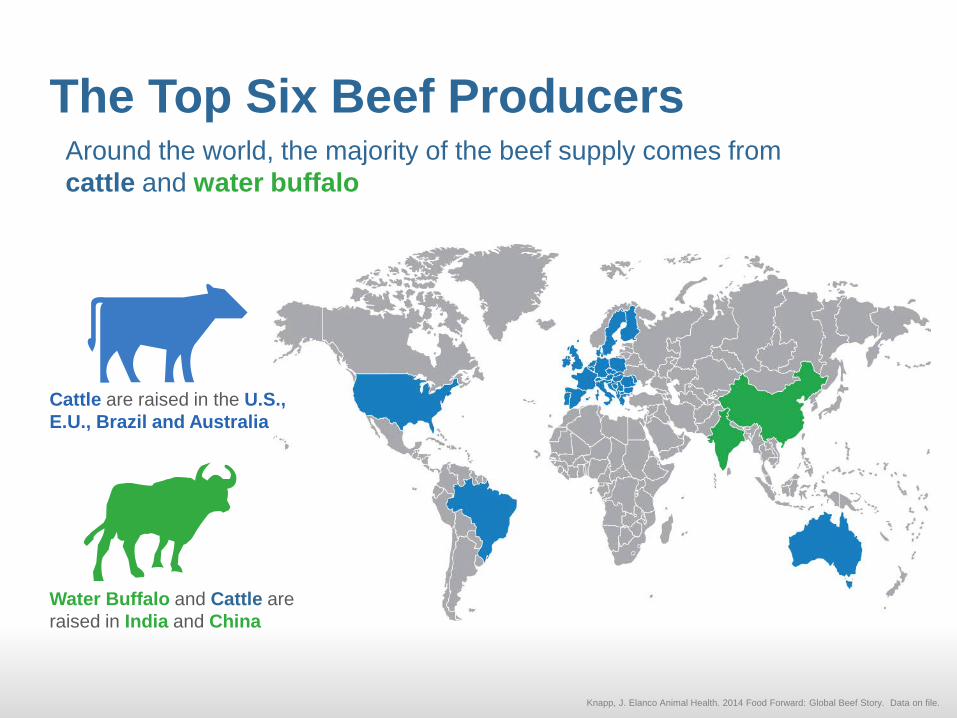
Cattle are raised in the U.S., E.U., Brazil and Australia
Around the world, the majority of the beef supply comes from cattle and water buffalo
Water Buffalo and Cattle are raised in India and China
The Top Six Beef Producers
Knapp, J. Elanco Animal Health. 2014 Food Forward: Global Beef Story. Data on file.

Knapp, J. Elanco Animal Health. 2014 Food Forward: Global Beef Story. Data on file.
Demand for Beef After flat global demand over the past 20 years, average weekly beef consumption per person is expected to increase from 182 grams or 6.4 ounces in 2010 to 194 grams or 6.8 ounces in 2050.
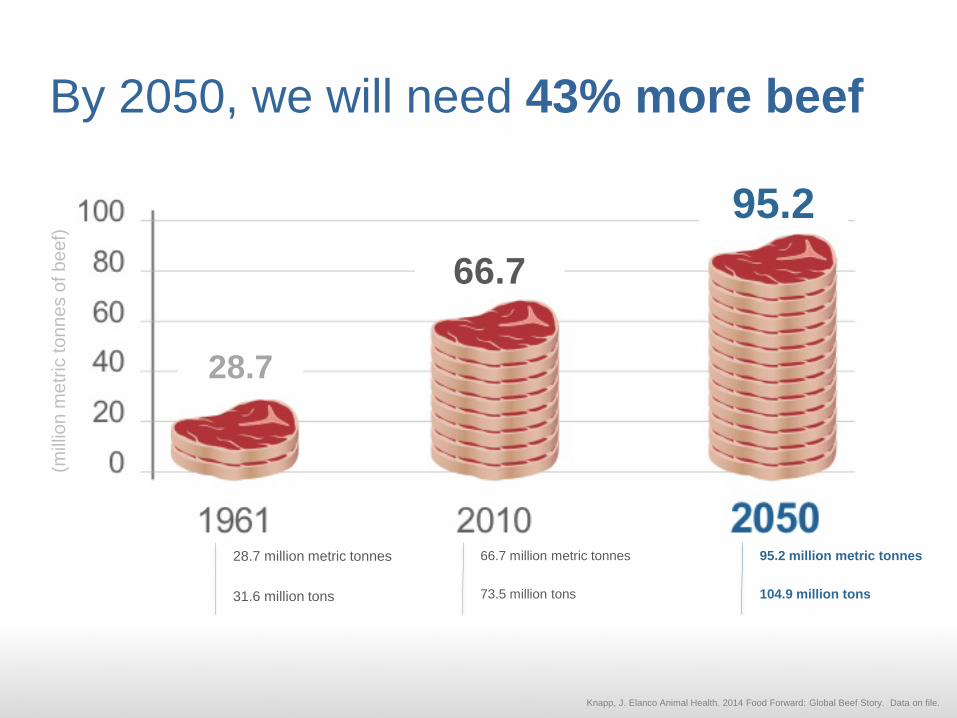
By 2050, we will need 43% more beef
28.7 million metric tonnes 31.6 million tons
66.7 million metric tonnes 73.5 million tons
95.2 million metric tonnes 104.9 million tons
(mill
ion
met
ric to
nnes
of b
eef)
95.2 66.7
28.7
Knapp, J. Elanco Animal Health. 2014 Food Forward: Global Beef Story. Data on file.
Knapp, J. Elanco Animal Health. 2014 Food Forward: Global Beef Story. Data on file.
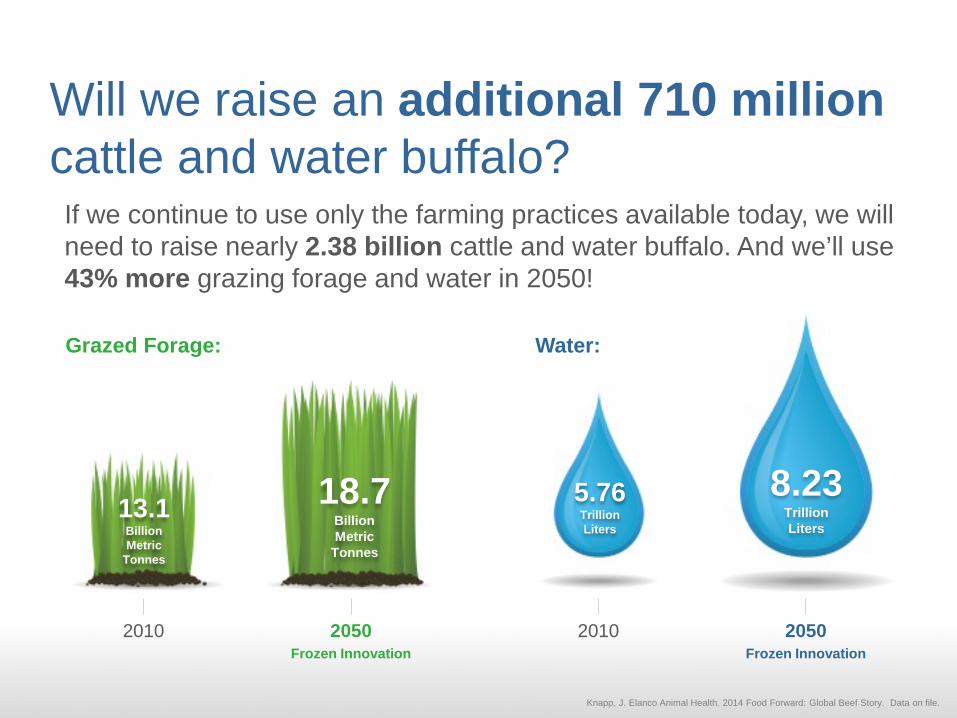
Will we raise an additional 710 million cattle and water buffalo?
If we continue to use only the farming practices available today, we will need to raise nearly 2.38 billion cattle and water buffalo. And we’ll use 43% more grazing forage and water in 2050!
2010 2050 Frozen Innovation
2010 2050 Frozen Innovation
Grazed Forage: Water:
13.1 Billion Metric
Tonnes
18.7 Billion Metric
Tonnes
5.76 Trillion Liters
8.23 Trillion Liters
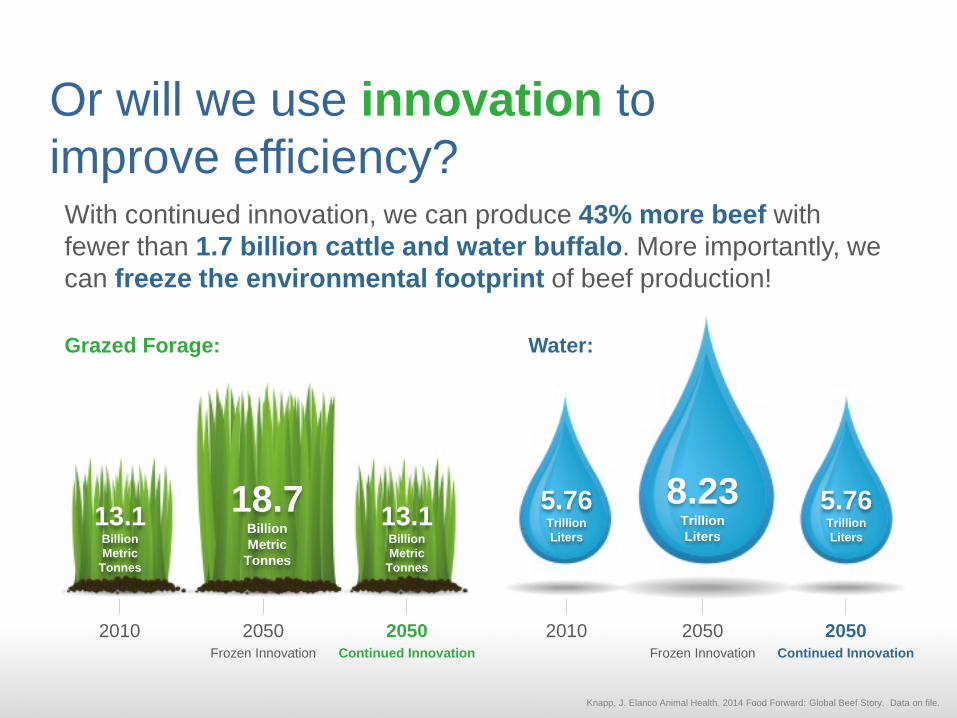
Or will we use innovation to improve efficiency?
With continued innovation, we can produce 43% more beef with fewer than 1.7 billion cattle and water buffalo. More importantly, we can freeze the environmental footprint of beef production!
Grazed Forage: Water:
2010 2050 Frozen Innovation
2050 Continued Innovation
2010 2050 Frozen Innovation
2050 Continued Innovation
13.1 Billion Metric
Tonnes
18.7 Billion Metric
Tonnes
5.76 Trillion Liters
8.23 Trillion Liters
5.76 Trillion Liters
Knapp, J. Elanco Animal Health. 2014 Food Forward: Global Beef Story. Data on file.
13.1 Billion Metric
Tonnes
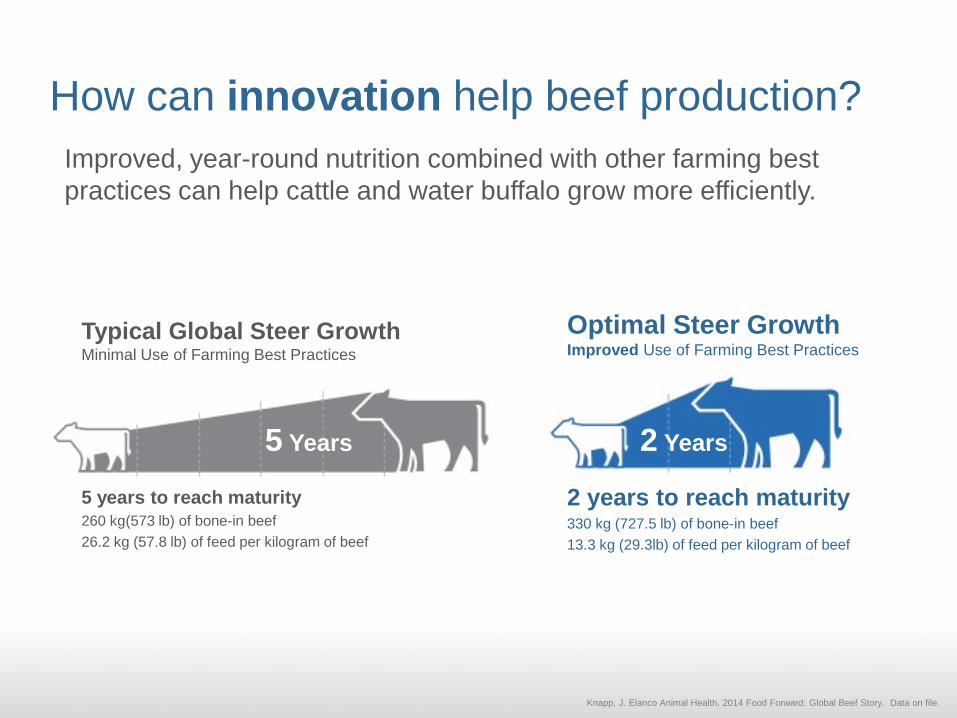
How can innovation help beef production? Improved, year-round nutrition combined with other farming best practices can help cattle and water buffalo grow more efficiently.
Typical Global Steer Growth Minimal Use of Farming Best Practices 5 years to reach maturity 260 kg(573 lb) of bone-in beef 26.2 kg (57.8 lb) of feed per kilogram of beef
Optimal Steer Growth Improved Use of Farming Best Practices 2 years to reach maturity 330 kg (727.5 lb) of bone-in beef 13.3 kg (29.3lb) of feed per kilogram of beef
2 Years 5 Years
Knapp, J. Elanco Animal Health. 2014 Food Forward: Global Beef Story. Data on file.
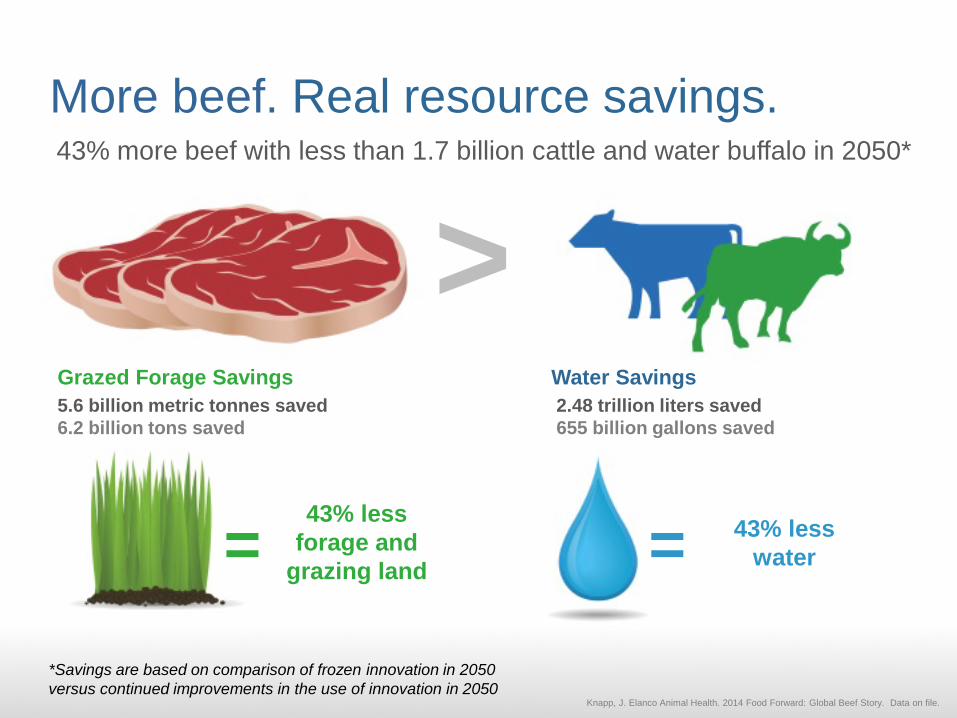
> Grazed Forage Savings 5.6 billion metric tonnes saved 6.2 billion tons saved
More beef. Real resource savings. 43% more beef with less than 1.7 billion cattle and water buffalo in 2050*
Water Savings 2.48 trillion liters saved 655 billion gallons saved
= 43% less
forage and grazing land = 43% less
water
*Savings are based on comparison of frozen innovation in 2050 versus continued improvements in the use of innovation in 2050
Knapp, J. Elanco Animal Health. 2014 Food Forward: Global Beef Story. Data on file.
ACCESS Milk, meat &
eggs for all
AFFORDABLE Better food, better
prices
STABILITY Plentiful food limits
unrest
RESOURCES Feeding more with
less
HEALTH Less disease, hunger
& obesity
Our Vision for a Food Secure World
#FeedThe9
Where there is no vision, people perish.
INNOVATION
TRADE CHOICE
Solution #1: The Power of Innovation
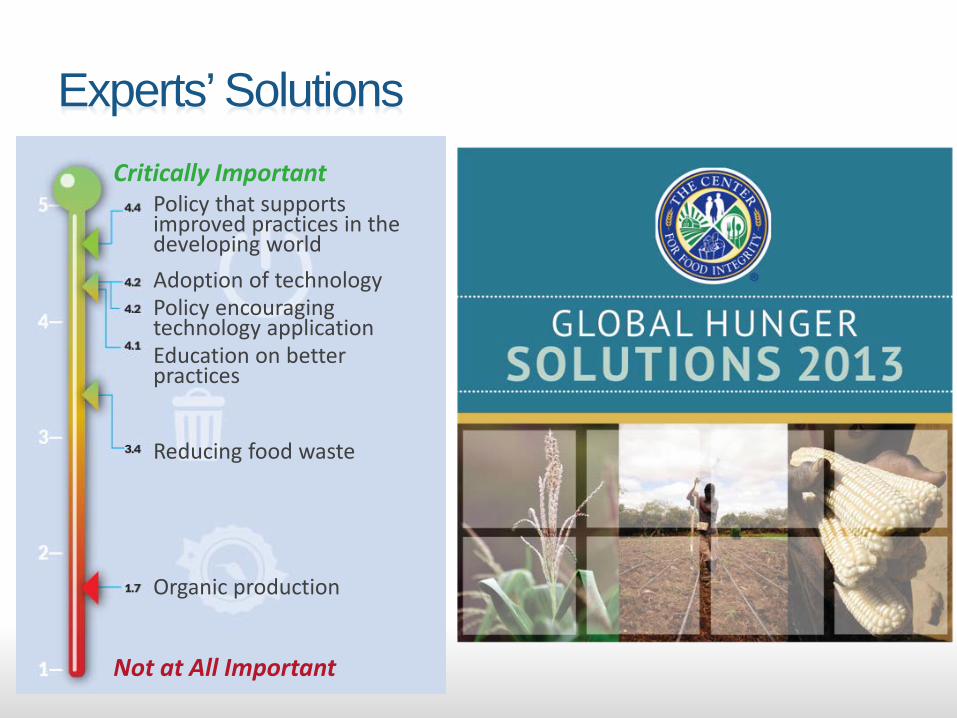
Experts’ Solutions Critically Important
Policy that supports improved practices in the developing world Adoption of technology Policy encouraging technology application Education on better practices
Reducing food waste
Organic production
Not at All Important
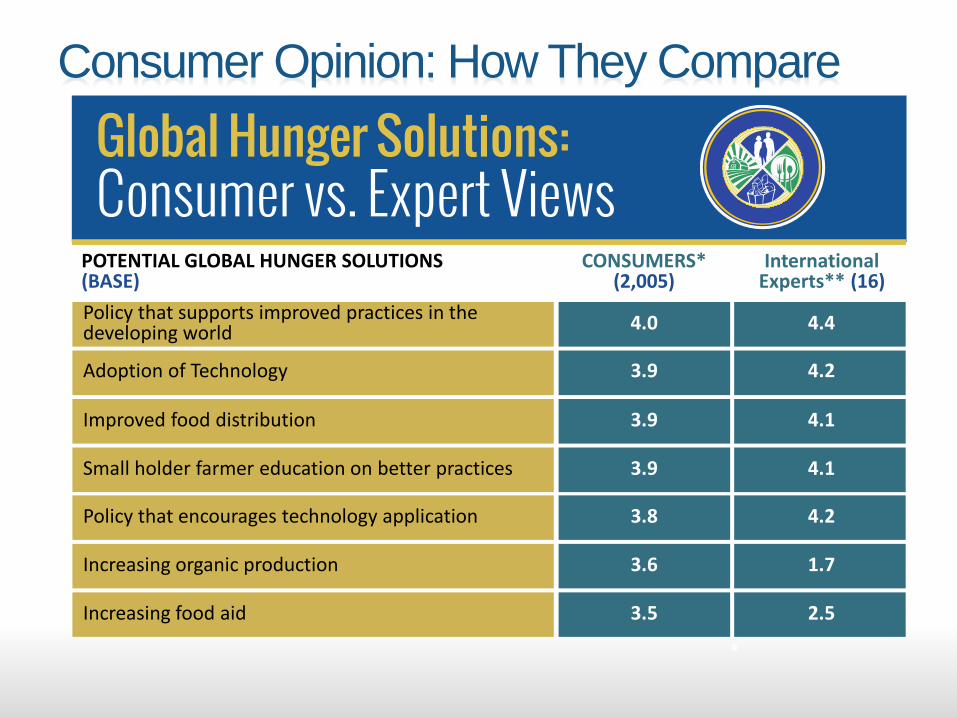
Consumer Opinion: How They Compare
POTENTIAL GLOBAL HUNGER SOLUTIONS (BASE)
CONSUMERS* (2,005)
International Experts** (16)
Policy that supports improved practices in the developing world
Adoption of Technology
Improved food distribution
Small holder farmer education on better practices
Policy that encourages technology application
Increasing organic production
Increasing food aid
4.0 4.4
3.9 4.2
3.9 4.1
3.9 4.1
3.8 4.2
3.6 1.7
3.5 2.5
Solution #2: Ensuring Consumer Choice
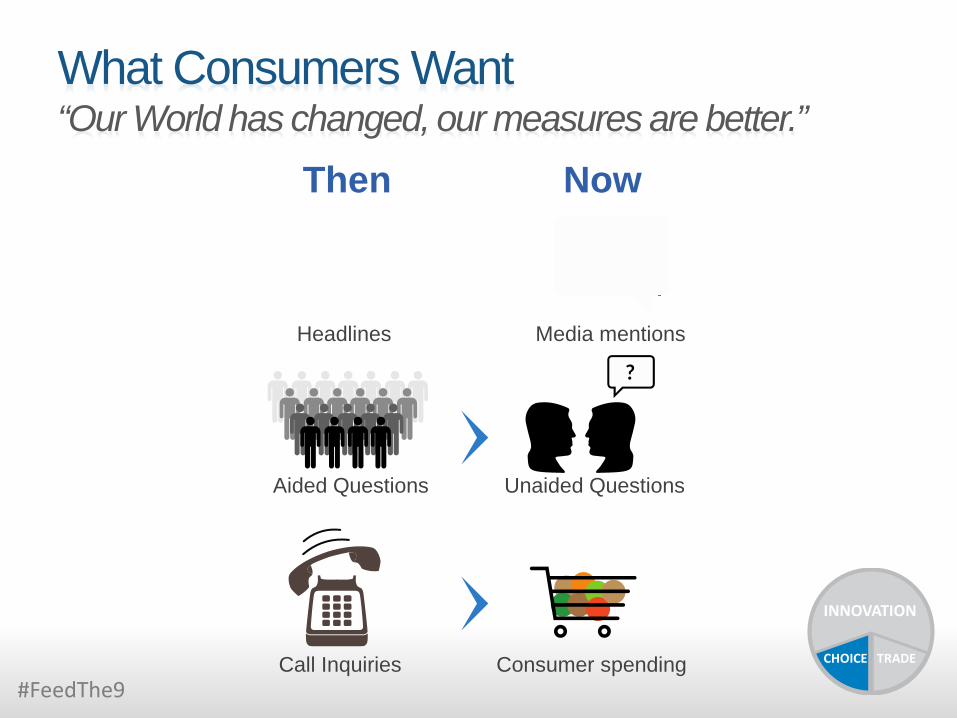
What Consumers Want “Our World has changed, our measures are better.”
Then Now
#FeedThe9
Headlines Media mentions
Aided Questions Unaided Questions
Call Inquiries Consumer spending
INNOVATION
TRADE CHOICE
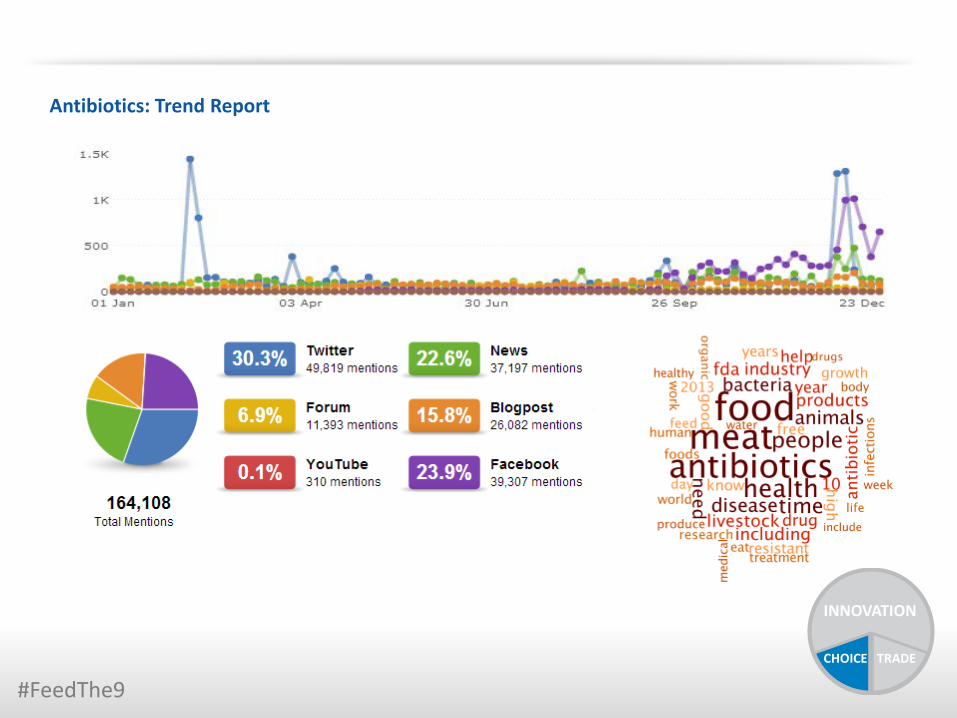
Antibiotics: Trend Report
INNOVATION
TRADE CHOICE
#FeedThe9
#FeedThe9
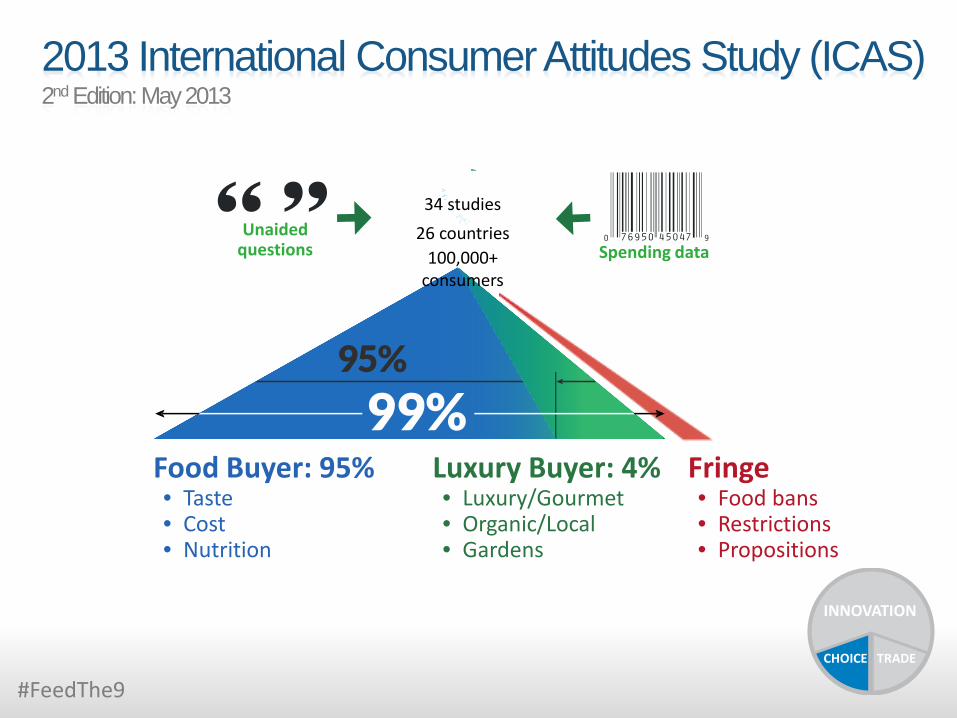
2013 International Consumer Attitudes Study (ICAS) 2nd Edition: May 2013
Fringe • Food bans • Restrictions • Propositions
Luxury Buyer: 4% • Luxury/Gourmet • Organic/Local • Gardens
Food Buyer: 95% • Taste • Cost • Nutrition
34 studies 26 countries
100,000+ consumers
Spending data Unaided
questions
INNOVATION
TRADE CHOICE
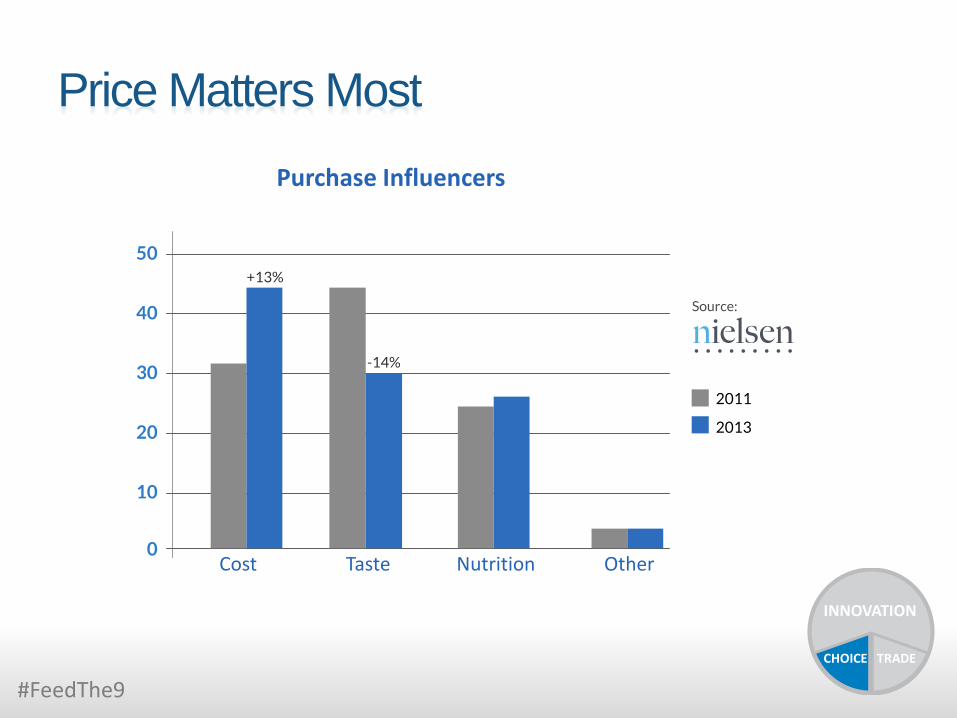
Price Matters Most
#FeedThe9
Cost
Purchase Influencers
Taste Nutrition Other
INNOVATION
TRADE CHOICE
Solution #3: Trade – Food Must Move
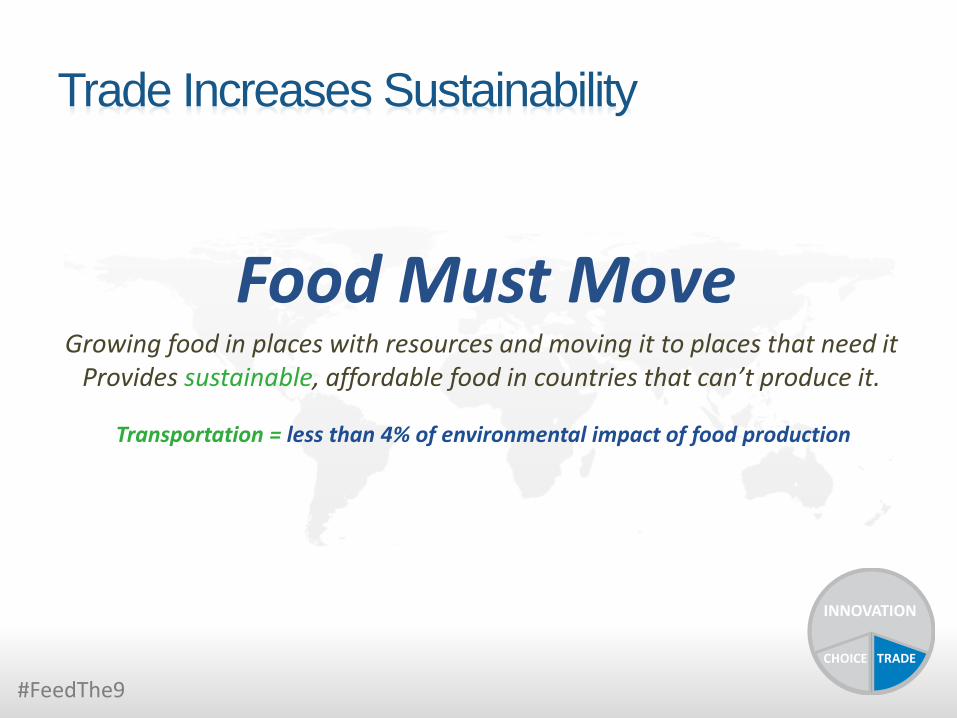
Trade Increases Sustainability
#FeedThe9
Food Must Move Growing food in places with resources and moving it to places that need it
Provides sustainable, affordable food in countries that can’t produce it.
Transportation = less than 4% of environmental impact of food production
INNOVATION
TRADE CHOICE
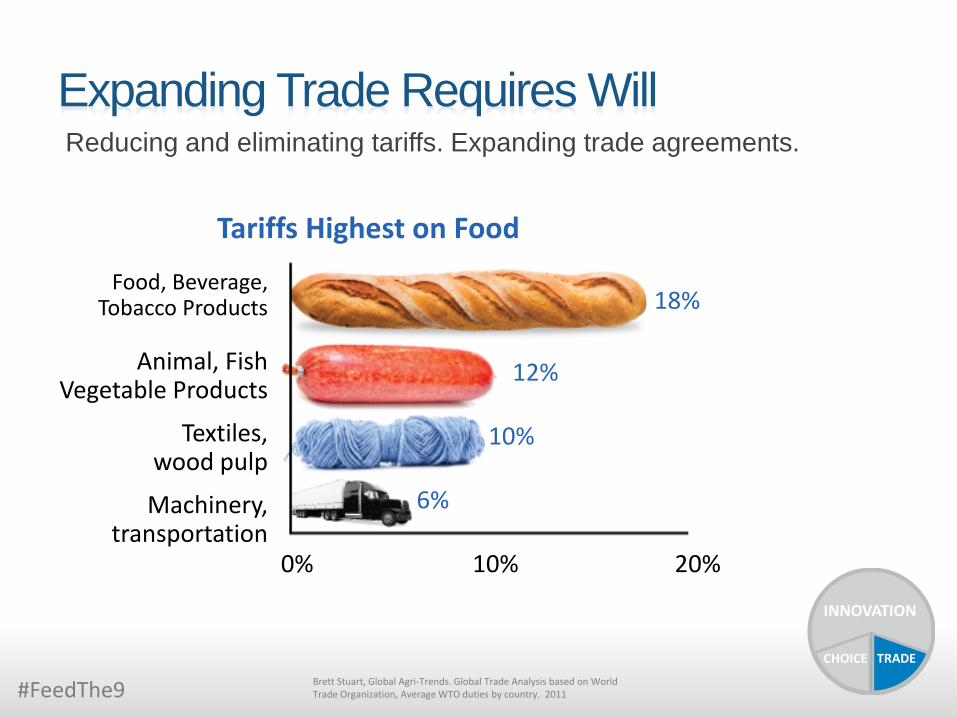
Expanding Trade Requires Will Reducing and eliminating tariffs. Expanding trade agreements.
#FeedThe9
Food, Beverage, Tobacco Products
Animal, Fish Vegetable Products
Textiles, wood pulp
Machinery, transportation
Tariffs Highest on Food
0% 10% 20%
INNOVATION
TRADE CHOICE Brett Stuart, Global Agri-Trends. Global Trade Analysis based on World Trade Organization, Average WTO duties by country. 2011
18%
10%
6%
12%

Trade Increases Availability and Affordability
Source: GTIS, Global AgriTrends
10-Yr Avg GDP/Capita Growth: +1.4%
Mexico Pork Consumption Lb
s/Ca
pita
Imported Domestic
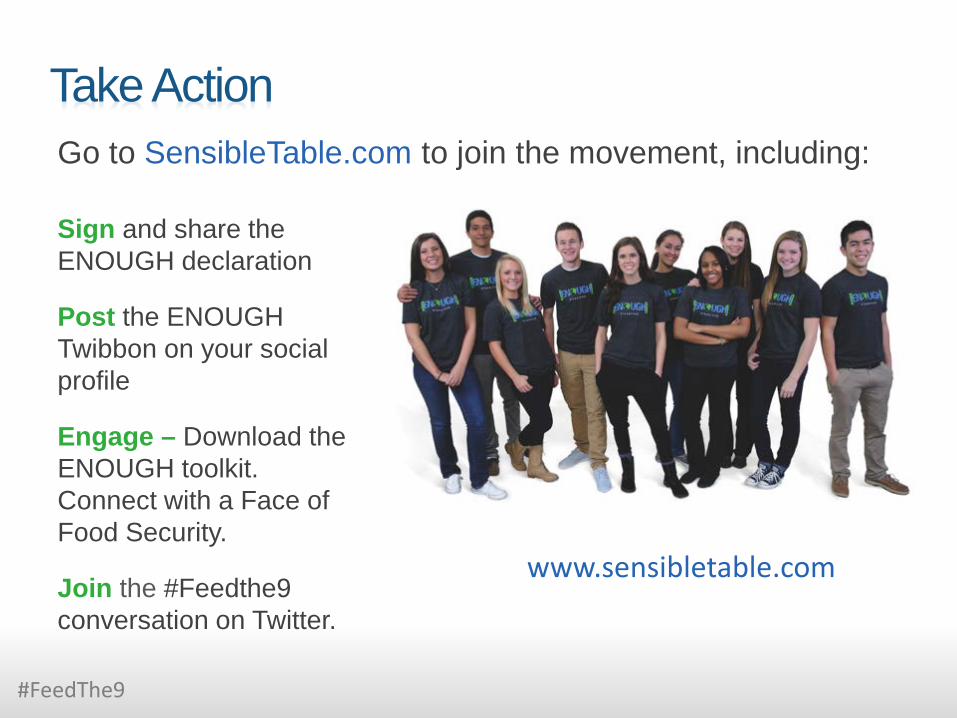
Take Action
Sign and share the ENOUGH declaration
Post the ENOUGH Twibbon on your social profile
Engage – Download the ENOUGH toolkit. Connect with a Face of Food Security.
Join the #Feedthe9 conversation on Twitter.
Follow @elanco, @jeffsimmons2050
Go to SensibleTable.com to join the movement, including:
www.sensibletable.com
#FeedThe9
www.sensibletable.com @jeffsimmons2050
@elanco
We’ve had enough. If you have too, join us. It’s time we #FeedThe9.


![Position Paper May10 [Palestinian Workers in Israel -- Peres Center]](https://img.pdfslide.us/doc/110x75/577d37e01a28ab3a6b969598/position-paper-may10-palestinian-workers-in-israel-peres-center.jpg)