Embed Size (px)
Citation preview
Integrated Belowground Greenhouse Gas Flux Measurements and Modeling, Howland Forest ME.
Kathleen Savage, Debjani Sihi, Eric A. Davidson, David Hollinger, Andrew Richardson, Julie Shoemaker
Howland
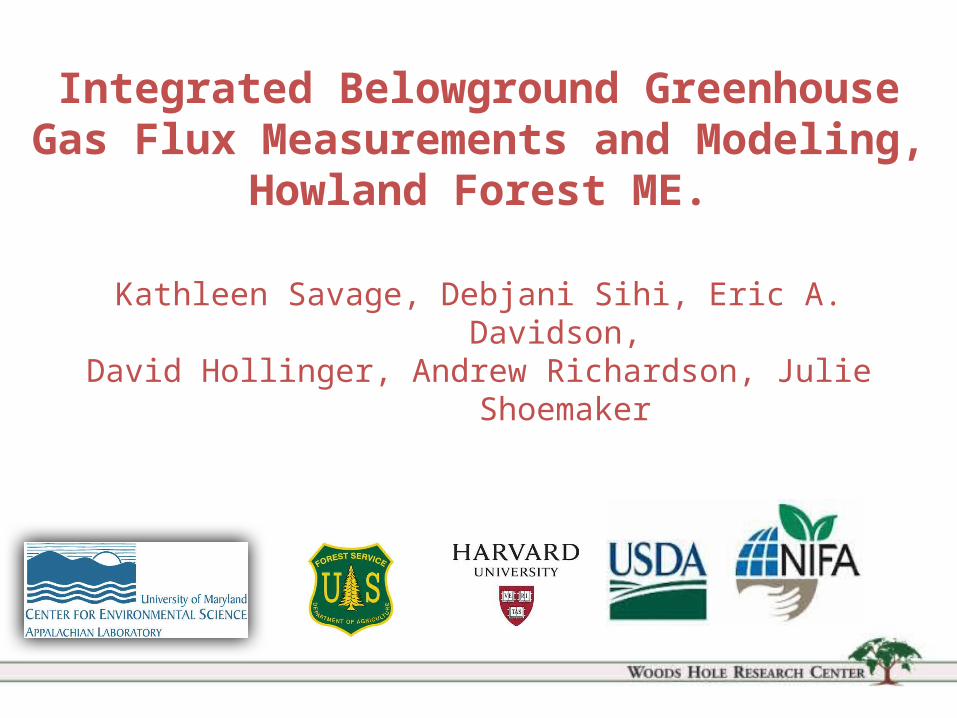
Howland Forest, ME
• Owned by New England Wilderness Trust• (NEWT)
• 558 acre parcel
• Temperate boreal transitional forest
• Mature- hemlock, spruce and cedar
• Continuous NEE and soil respiration measurements since 1996, oneof the longest records
• Recently added net CH4 exchange
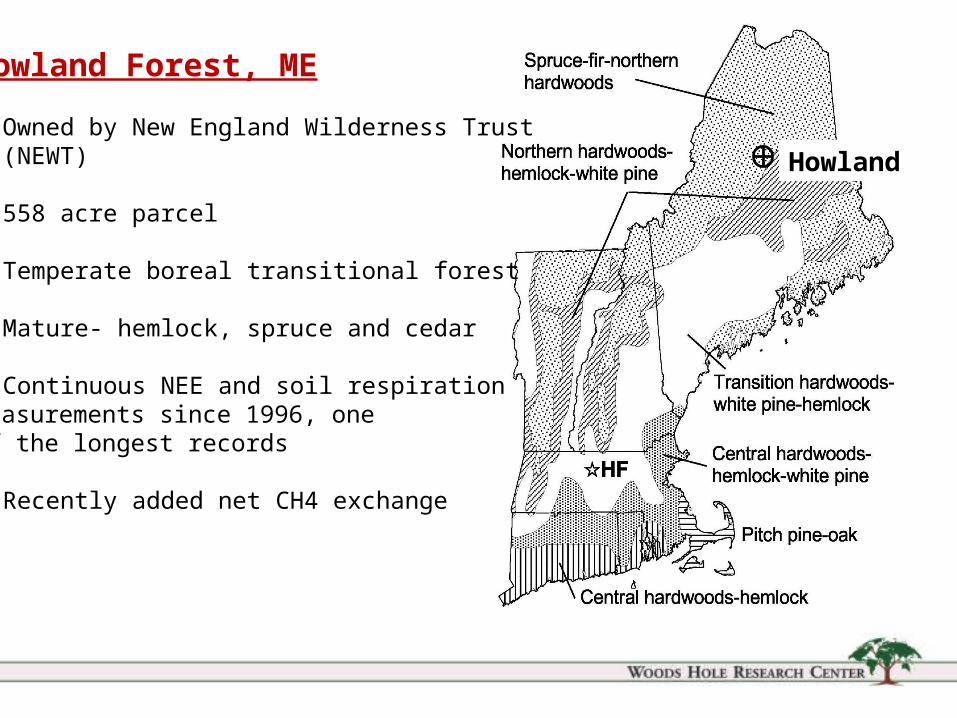
Howland Forest EMS tower
NEE and CH4 measurements
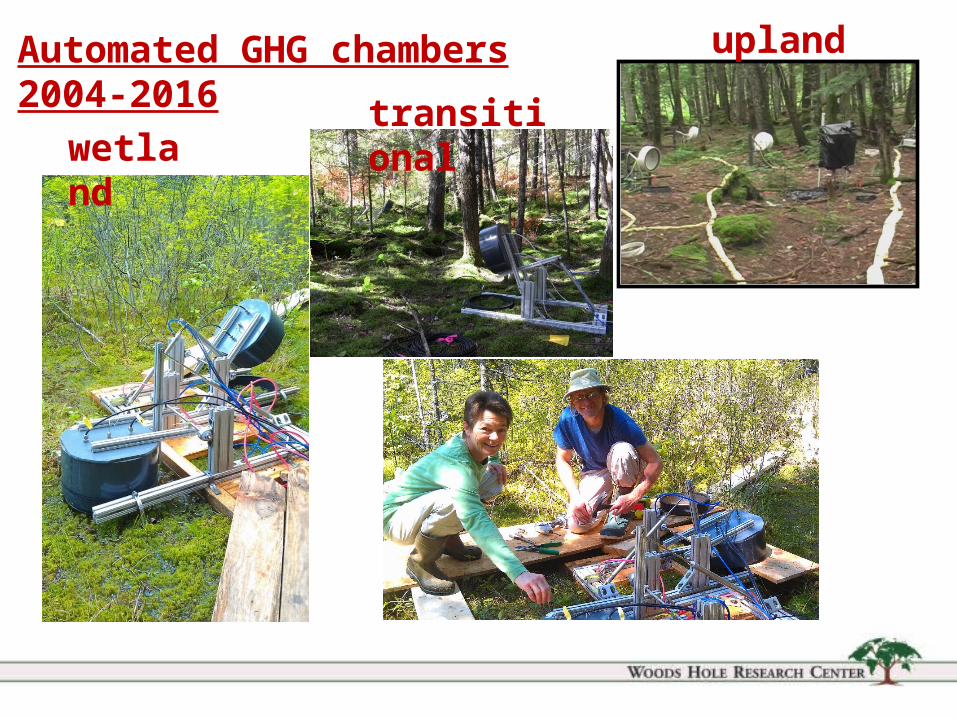
Automated GHG chambers 2004-2016
wetlandtransitional
upland
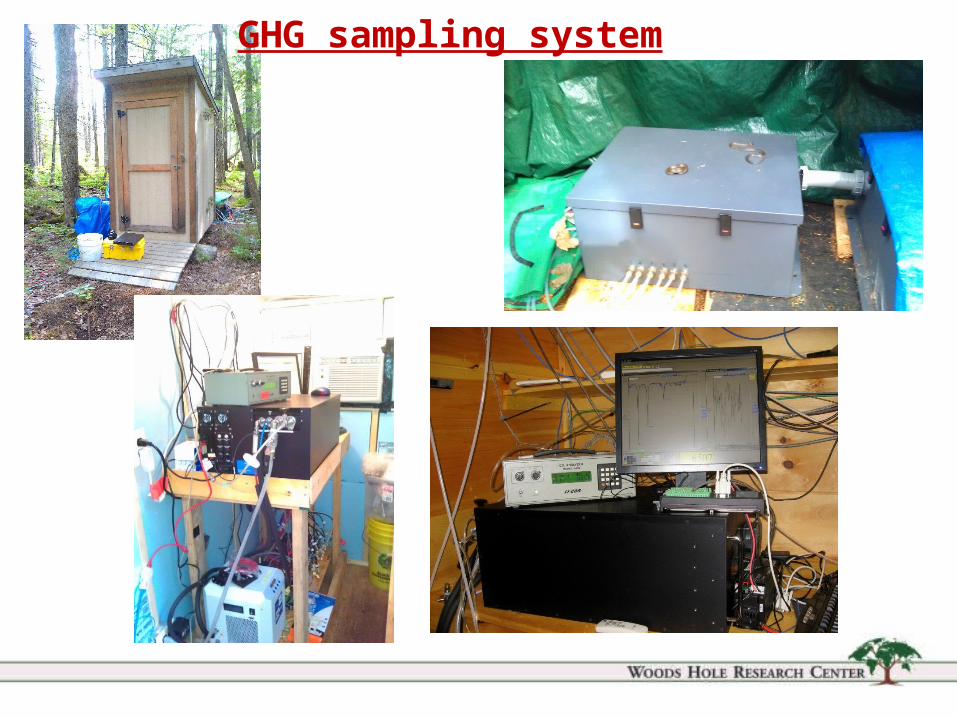
GHG sampling system
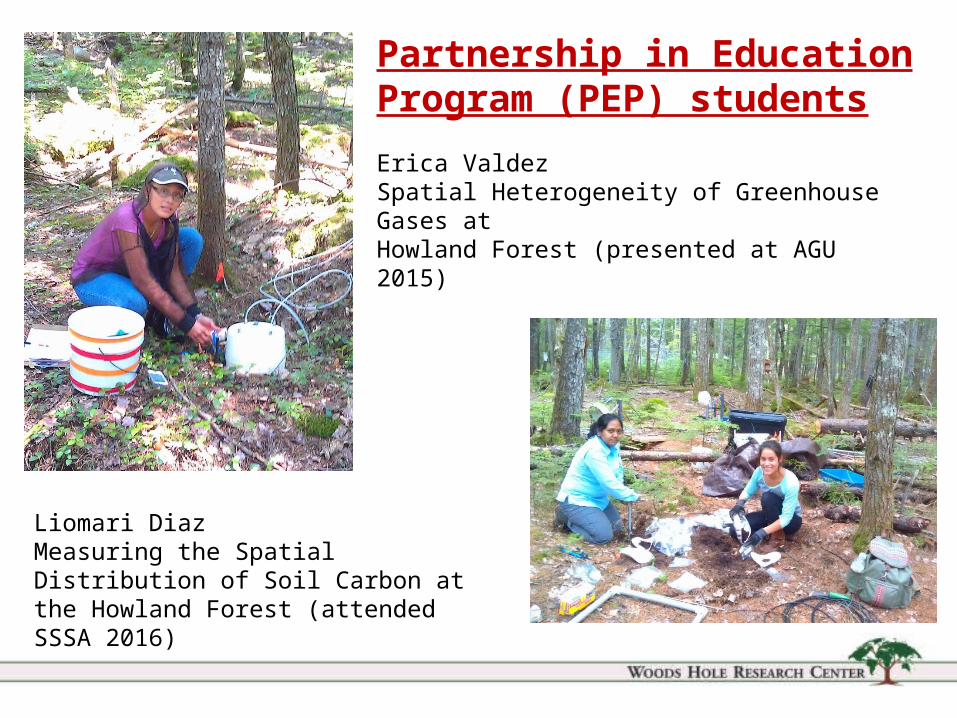
Partnership in Education Program (PEP) studentsErica ValdezSpatial Heterogeneity of Greenhouse Gases at Howland Forest (presented at AGU 2015)
Liomari DiazMeasuring the Spatial Distribution of Soil Carbon at the Howland Forest (attended SSSA 2016)
Introduction to Greenhouse Gases
• Soils are a significant source of carbon dioxide (CO2), methane (CH4), and nitrous oxide (N2O) - the most important greenhouse gases (GHG)
• Carbon dioxide: Soils release CO2 produced by both autotrophic (root) and heterotrophic (microbial) respiration processes (aerobic).
• Methane: Wetlands are a significant natural source of CH4 (anaerobic), and dry upland soils (aerobic) a natural CH4 sink.
• Nitrous Oxide: Soils are the dominant natural source of N2O, and have been shown to be a small sink under N-limited conditions. The production and consumption of N2O is also highly dependent on spatial and temporal variation in soil moisture.
• Variation in soil moisture can be very dynamic, and it is one of the dominant factors controlling soil aeration, and hence the balance between aerobic and anaerobic processes.
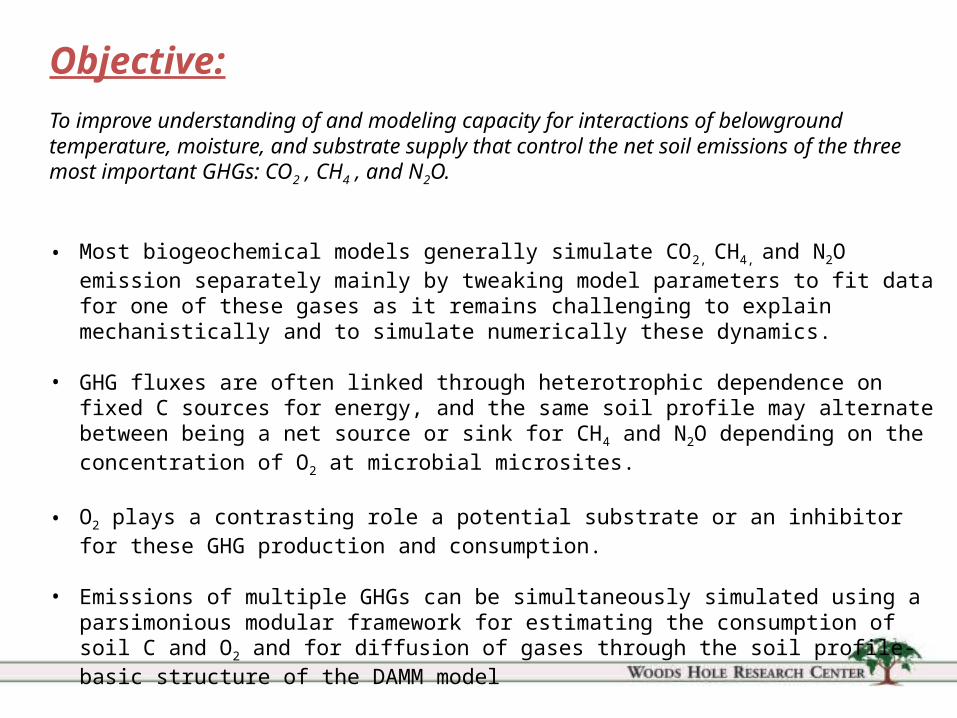
Objective:To improve understanding of and modeling capacity for interactions of belowground temperature, moisture, and substrate supply that control the net soil emissions of the three most important GHGs: CO2 , CH4 , and N2O.
• Most biogeochemical models generally simulate CO2, CH4, and N2O emission separately mainly by tweaking model parameters to fit data for one of these gases as it remains challenging to explain mechanistically and to simulate numerically these dynamics.
• GHG fluxes are often linked through heterotrophic dependence on fixed C sources for energy, and the same soil profile may alternate between being a net source or sink for CH4 and N2O depending on the concentration of O2 at microbial microsites.
• O2 plays a contrasting role a potential substrate or an inhibitor for these GHG production and consumption.
• Emissions of multiple GHGs can be simultaneously simulated using a parsimonious modular framework for estimating the consumption of soil C and O2 and for diffusion of gases through the soil profile-basic structure of the DAMM model
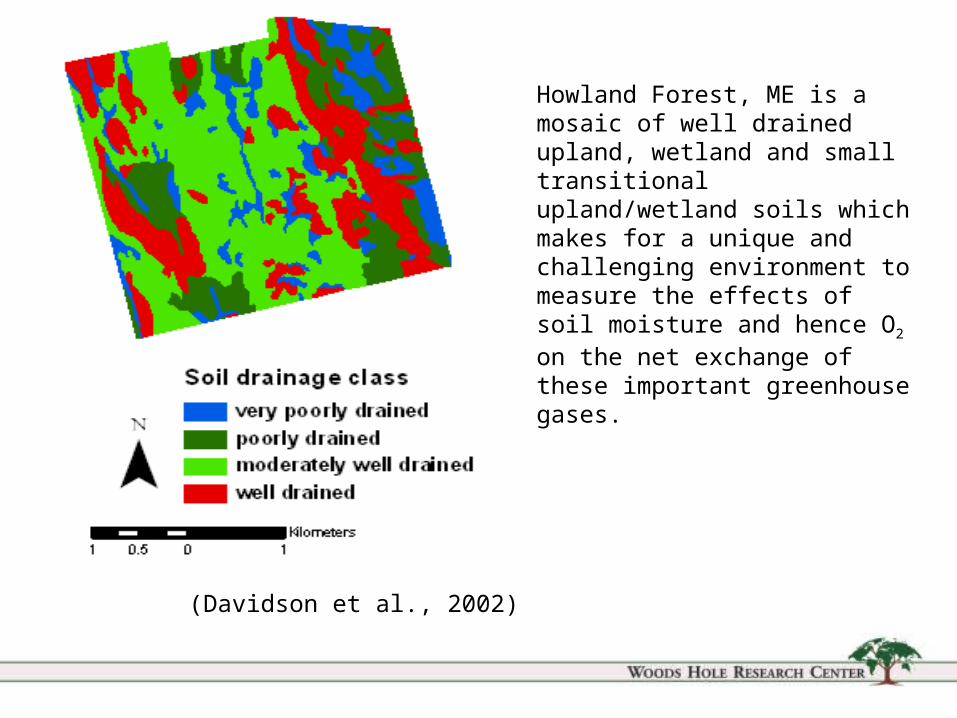
(Davidson et al., 2002)
Howland Forest, ME is a mosaic of well drained upland, wetland and small transitional upland/wetland soils which makes for a unique and challenging environment to measure the effects of soil moisture and hence O2 on the net exchange of these important greenhouse gases.
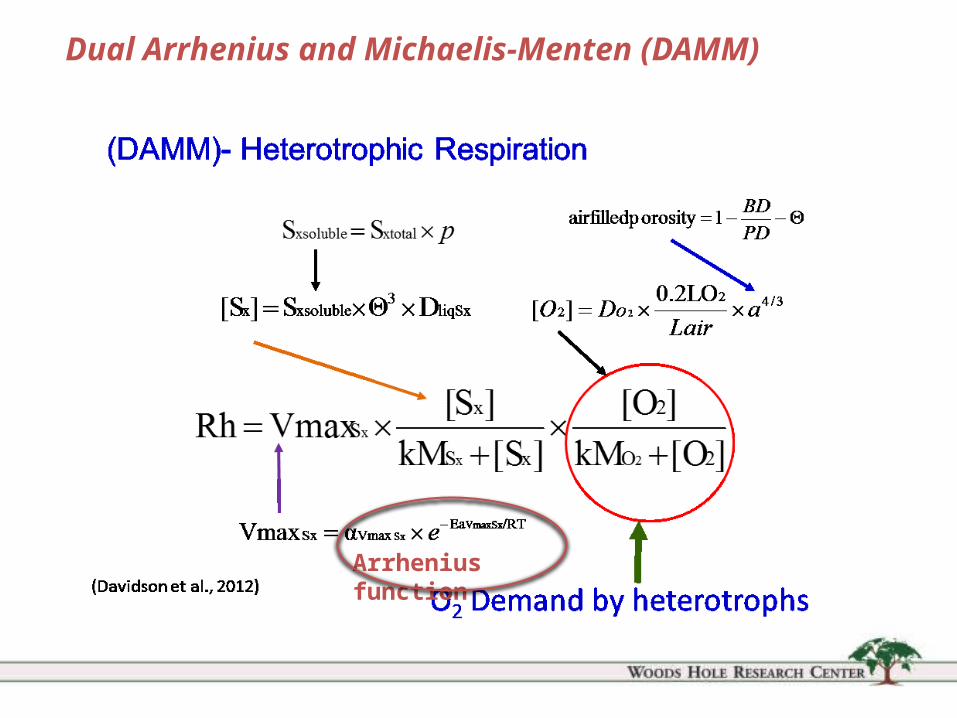
Dual Arrhenius and Michaelis-Menten (DAMM)
Arrhenius function
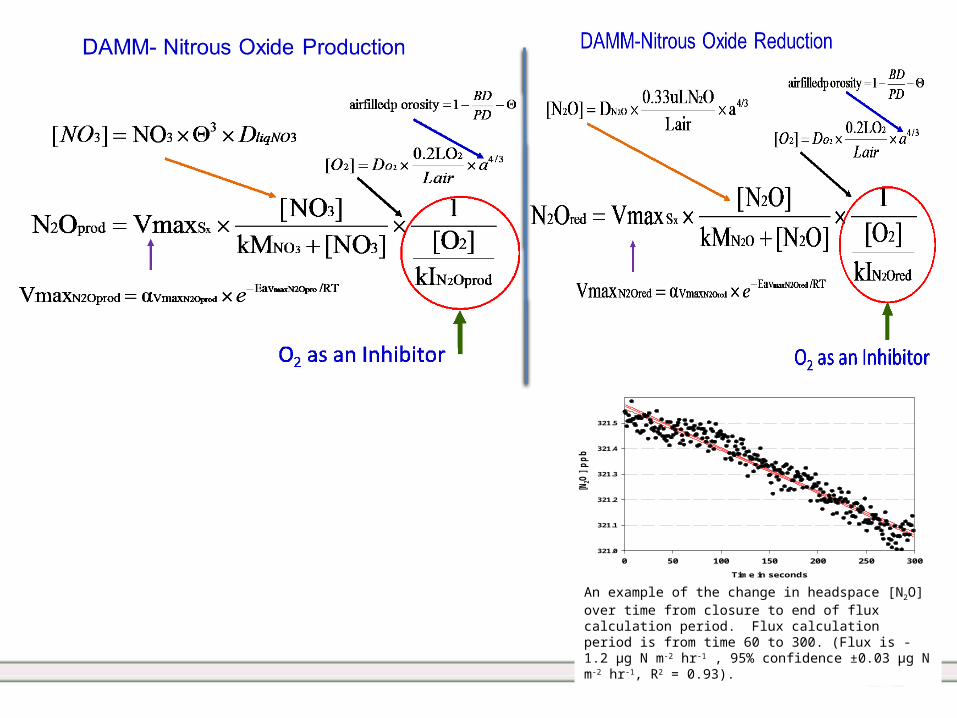
An example of the change in headspace [N2O] over time from closure to end of flux calculation period. Flux calculation period is from time 60 to 300. (Flux is -1.2 µg N m-2 hr-1 , 95% confidence ±0.03 µg N m-2 hr-1, R2 = 0.93).
Time in seconds
0 50 100 150 200 250 300
[N2O
] ppb
321.0
321.1
321.2
321.3
321.4
321.5
CO2
LiCor IRGA
CH4, N2O & H2OAerodyne Quantum
Cascade Laser
pump
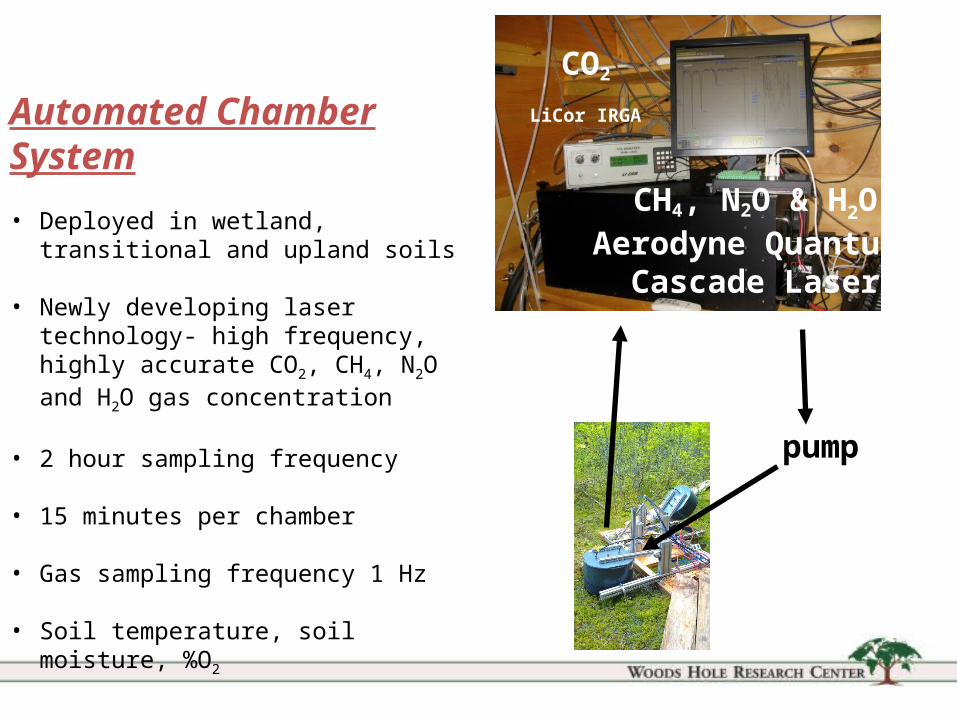
Automated Chamber System• Deployed in wetland, transitional and upland
soils
• Newly developing laser technology- high frequency, highly accurate CO2, CH4, N2O and H2O gas concentration
• 2 hour sampling frequency
• 15 minutes per chamber
• Gas sampling frequency 1 Hz
• Soil temperature, soil moisture, %O2
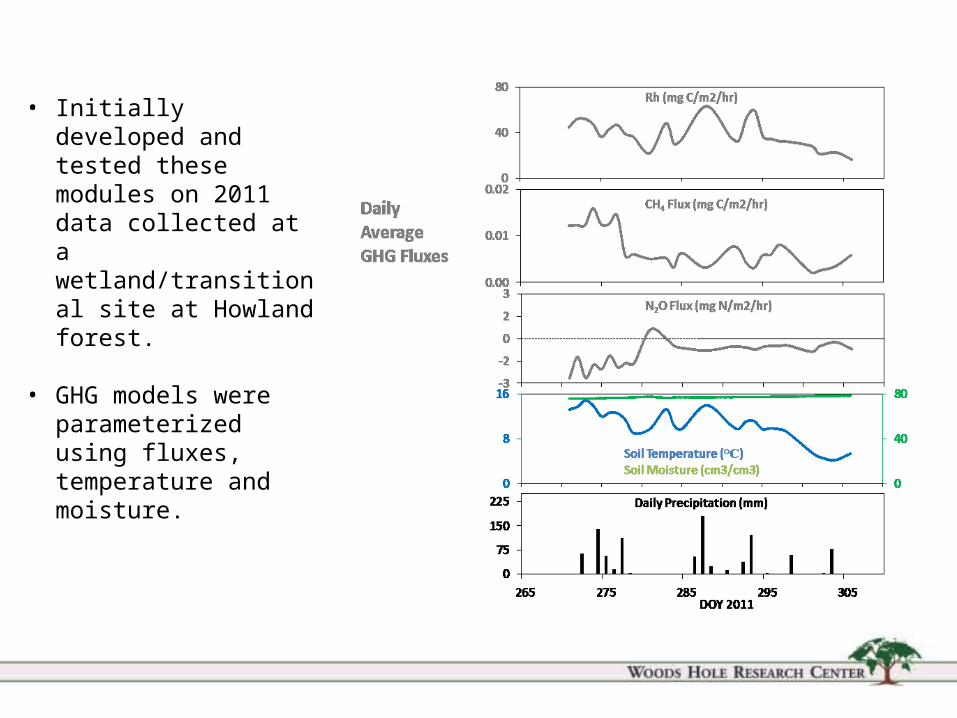
• Initially developed and tested these modules on 2011 data collected at a wetland/transitional site at Howland forest.
• GHG models were parameterized using fluxes, temperature and moisture.
0 35 700
35
70
Rh Model (mg C m-2 hr-1)
Rh D
ata
(mg
C m
-2 h
r-1)
265 275 285 295 3050
4
8
12
16
70
72
74
76
78
80
DOY 2011
Soil
Tem
pera
ture
(°C)
Soil
Moi
stur
e (c
m3c
m-3
)
265 275 285 295 3050
35
70
Data Model
Rh (m
g C
m-2
hr-
1)
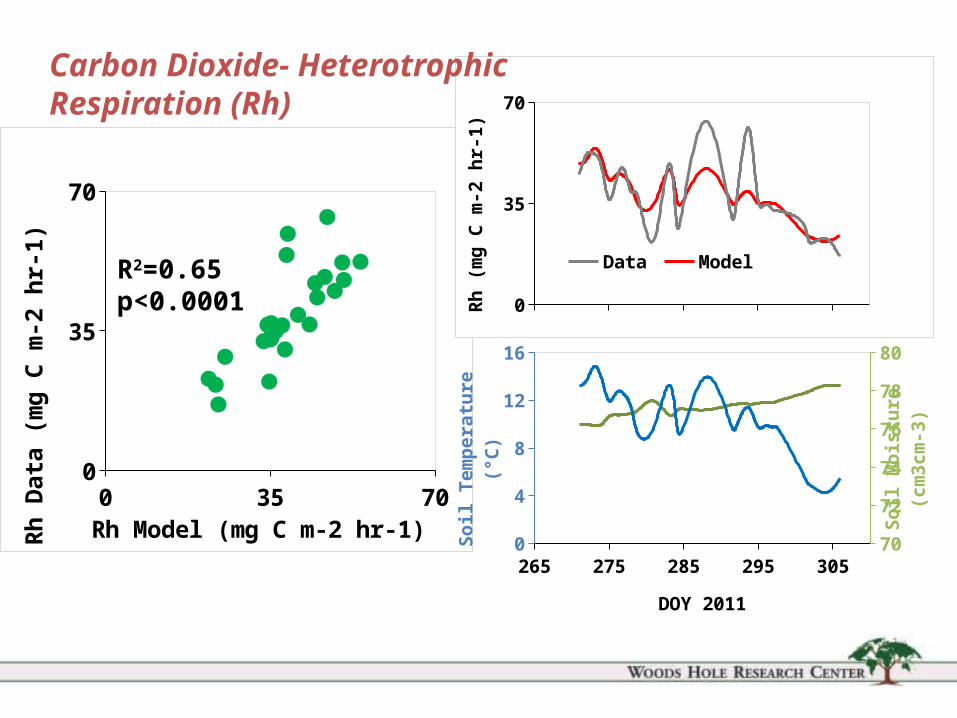
R2=0.65p<0.0001
Carbon Dioxide- Heterotrophic Respiration (Rh)
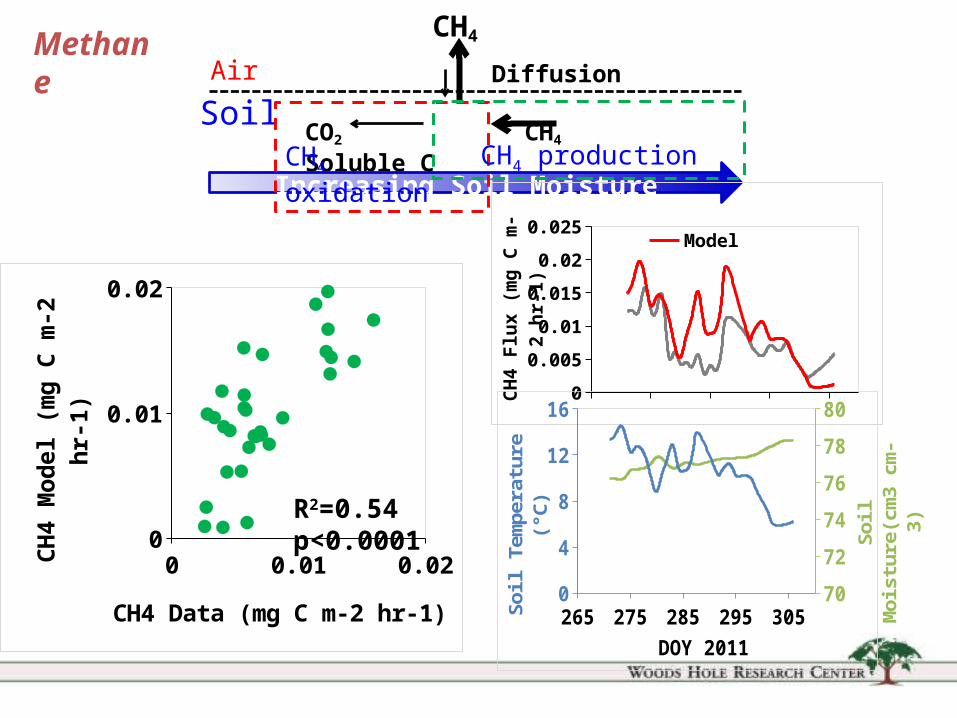
R2=0.54p<0.0001
CO2 CH4 Soluble C
DiffusionAir
Soil
Increasing Soil Moisture
CH4
CH4 oxidation CH4 production
265 275 285 295 3050
0.005
0.01
0.015
0.02
0.025Model Data
CH4
Flux
(mg
C m
-2 h
r-1)
0 0.01 0.020
0.01
0.02
CH4 Data (mg C m-2 hr-1)
CH4
Mod
el (m
g C
m-2
hr-
1)
265 275 285 295 3050
4
8
12
16
70
72
74
76
78
80
DOY 2011
Soil
Tem
pera
ture
(°C)
Soil
Moi
stur
e(cm
3 cm
-3)
Methane
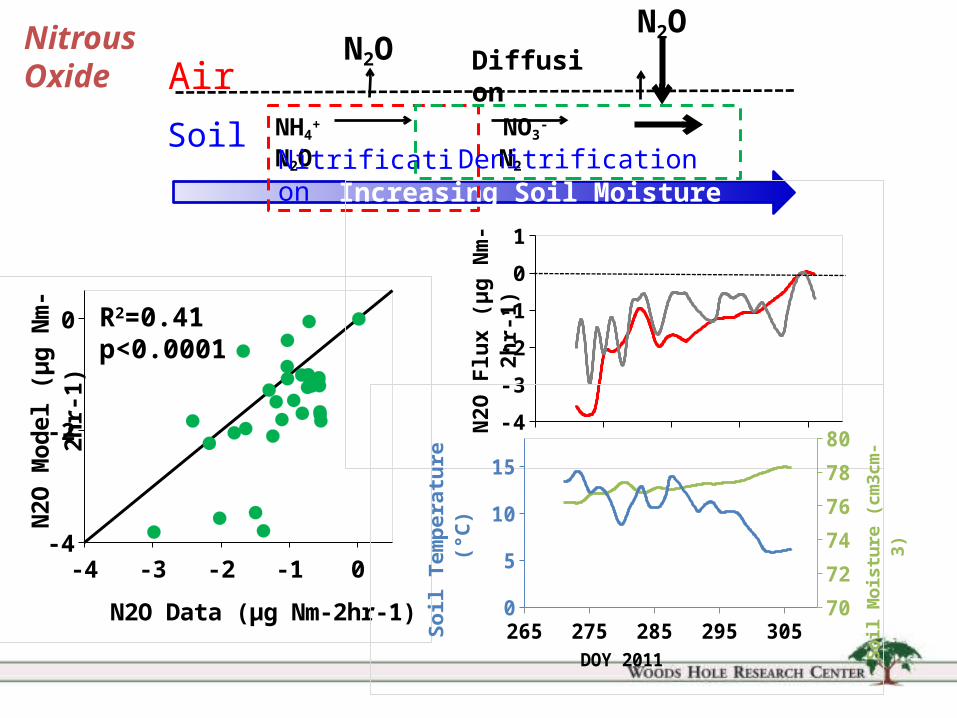
NH4+ NO3
- N2O N2
DiffusionN2O
AirSoil
Increasing Soil Moisture
N2O
Nitrification Denitrification
-4 -3 -2 -1 0-4
-2
0
N2O Data (µg Nm-2hr-1)
N2O
Mod
el (µ
g N
m-2
hr-1
)
R2=0.41p<0.0001
265 275 285 295 305-4
-3
-2
-1
0
1
Data Model
N2O
Flu
x (µ
g N
m-2
hr-1
)
265 275 285 295 3050
5
10
15
707274767880
DOY 2011
Soil
Tem
pera
ture
(°C)
Soil
Moi
stur
e (c
m3c
m-3
)
Nitrous Oxide
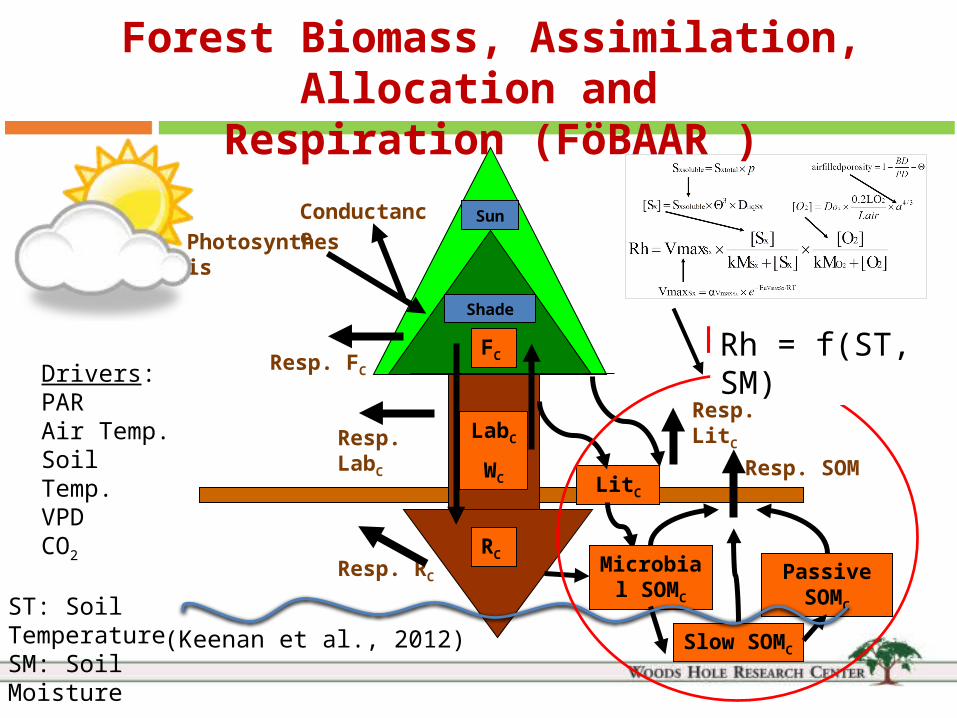
Sun
Shade
Photosynthesis
LabC
WC
FC
RC
Slow SOMC
LitC
Resp. SOM
Resp. LitC
Conductance
Resp. FC
Resp. RC
Resp. LabC
Drivers:PARAir Temp.Soil Temp.VPDCO2
Passive SOMC
Microbial SOMC
Forest Biomass, Assimilation, Allocation and Respiration (FöBAAR )
Rh = f(ST)
ST: Soil TemperatureSM: Soil Moisture
Rh = f(ST, SM)
(Keenan et al., 2012)
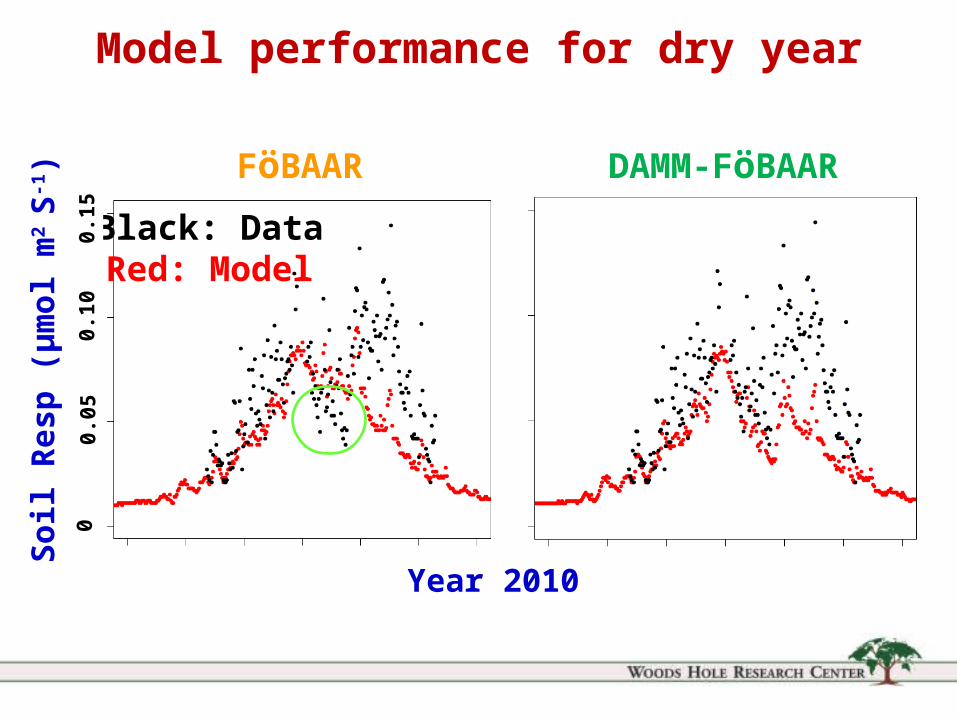
FöBAAR DAMM-FöBAAR
Year 2010
Soil
Resp
(µm
ol m
2 S-1
) Black: DataRed: Model
00.
050.
100.
15Model performance for dry year
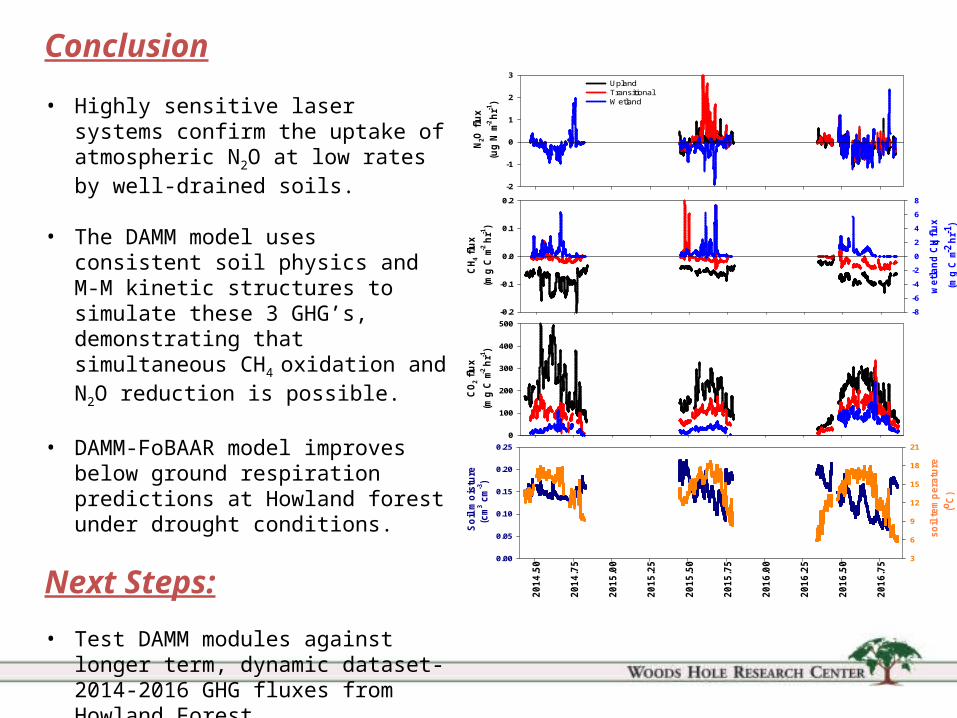
Conclusion
• Highly sensitive laser systems confirm the uptake of atmospheric N2O at low rates by well-drained soils.
• The DAMM model uses consistent soil physics and M-M kinetic structures to simulate these 3 GHG’s, demonstrating that simultaneous CH4 oxidation and N2O reduction is possible.
• DAMM-FoBAAR model improves below ground respiration predictions at Howland forest under drought conditions.
Next Steps:
• Test DAMM modules against longer term, dynamic dataset-2014-2016 GHG fluxes from Howland Forest
CH 4 f
lux
(mg
C m-2
hr-1
)
-0.2
-0.1
0.0
0.1
0.2
wet
land
CH 4
flux
(mg
C m-2
hr-1
)
-8
-6
-4
-2
0
2
4
6
8
N 2O fl
ux(u
g N
m-2
hr-1
)
-2
-1
0
1
2
3
CO 2 f
lux
(mg
C m-2
hr-1
)
0
100
200
300
400
500
2014
.50
2014
.75
2015
.00
2015
.25
2015
.50
2015
.75
2016
.00
2016
.25
2016
.50
2016
.75
Soil
moi
stur
e(c
m3 cm-3
)
0.00
0.05
0.10
0.15
0.20
0.25
soil
tem
pera
ture
(o C)
3
6
9
12
15
18
21
Upland TransitionalWetland

Questions ?
(Photo: Carrie-Ellen Gabriel)
Award number 2014-67003-22073
![Statistical uncertainty of eddy flux–based estimates …Forest [Wofsy et al., 1993], Walker Branch Watershed [Balddocchi and Vogel, 1996], and Howland Forest [Hollinger et al., 2004])](https://img.pdfslide.us/doc/110x75/5f32caa6901e84732d751b28/statistical-uncertainty-of-eddy-fluxabased-estimates-forest-wofsy-et-al-1993.jpg)